

Abstract
Spinal cord stimulations have been used widely to treat intractable neuropathic pain. The conventional spinal cord stimulation paradigm, the “tonic” type, suppresses excessive activation of wide dynamic range neurons in the dorsal horn via the collateral branch from the dorsal column. Therefore, preserved dorsal column function is an important prerequisite for tonic spinal cord stimulations. A tonic spinal cord stimulation requires eliciting paresthesia in the painful area due to stimulation of the dorsal column and dorsal root. Recent spinal cord stimulation paradigms, including burst and high-dose, are set below the paresthesia threshold and are proposed to have different pain reduction mechanisms. We conducted an interference study of these different stimulation paradigms on the somatosensory evoked potential (SEP) to investigate differences in the sites of action between tonic and new spinal cord stimulations. We recorded posterior tibial nerve-stimulated SEP in seven patients with neuropathic pain during tonic, burst, and high-dose stimulations. The total electrical energy delivered was calculated during SEP-spinal cord stimulation interference studies. High-dose stimulations could not reduce the SEP amplitude despite higher energy delivery than tonic stimulation. Burst stimulation with an energy similar to the tonic stimulation could not reduce SEP amplitude as tonic stimulation. The study results suggested different sites of action and effects on the spinal cord between the conventional tonic and burst or high-dose spinal cord stimulations.
Keywords: somatosensory evoked potentials, spinal cord stimulation, tonic stimulation, burst stimulation, high-dose stimulation
Introduction
Spinal cord stimulations (SCSs) have been used widely as one of the options for the treatment of intractable neuropathic pain.1-4) The conventional SCS paradigm is called the “tonic” type, constructed by single electrical pulses with low frequencies.1-3,5) Studies have shown that tonic SCSs suppress the excessive activation of wide dynamic range neurons (wind up) in the dorsal horn via the collateral branch from the dorsal column to the spinothalamic pathway.1-3) Preserved dorsal column function is, therefore, an important prerequisite for tonic SCSs. A tonic SCS requires eliciting paresthesia in the painful area, resulting from stimulation of the Aβ fibers in the dorsal column and dorsal root.1-3,5,6)
Recent SCS investigations have provided new clinical stimulation paradigms, including burst, high-dose/high-density, and 10 kHz high-frequency methods. Generally, however, their stimulation strengths have been set below the paresthesia threshold, unlike conventional tonic stimulation,7) suggesting that there may be different pain reduction mechanisms in the new paresthesia-free stimulations.8)
Study findings of electrically stimulated somatosensory evoked potentials (SEPs) suggest conventional tonic SCSs characteristically attenuate the primary somatosensory cortex (SI) response,9-13) elicited by the ascending impulses via a dorsal column pathway.14) Whether the new SCS paradigms inhibit the SEPs that originate from the SI is unclear.5,15) We reported the different interference effects on the SEP waveforms for tonic, burst, and high-dose SCSs in seven cases with neuropathic pain. We also proposed different sites of action for these SCSs.
Materials and Methods
This study included seven (three females and four males) patients who required SCSs. Table 1 shows the patient's demographics. The clinical diagnoses were lumbar-lower limb pain associated with Parkinson's disease (n = 2) and failed spinal surgery syndrome (n = 5). The SCS electrodes were located at the T1 (n = 1) or T8/9-T10 (n = 6) vertebral levels. Although different clinical conditions may have existed among patients, the effects of different stimulation paradigms of SCSs could be evaluated by comparing SEP changes according to individual subjects' same spinal cord condition. Since the SEP changes in two patients with Parkinson's disease were similar to those of others with failed spinal surgery syndrome, their data were analyzed together. This study compared the effects of SCSs on SEPs among tonic, burst, and high-dose stimulations.
Table 1.
Patient characteristics and pain scores with and without spinal cord stimulation
| # | Age/
gender |
Diagnosis (surgery) | Pain distribution | Duration of pain at time of SCS/years | Spine level of stimulation | Pain (NRS) without SCS | Pain (NRS) with Tonic SCS | Pain (NRS) with Burst SCS | Pain (NRS) with High dose SCS* | Treatment mode (patient’s choice) ** |
|---|---|---|---|---|---|---|---|---|---|---|
| 1 | 55/m | FSSS (C3-7 laminoplasty) | Upper & lower limbs | 0.33 | T1 | 8-10 | 1-2 | 1-2 | - | Burst & Tonic |
| 2 | 42/m | FSSS (L5/S1 fusion) | Lumbar & lower limbs | 11 | T9/10 | 10 | 4-5 | 4-5 | - | Burst & Tonic |
| 3 | 55/f | FSSS (L5/S1 discectomy) | Lumbar & lower limbs | 2 | T9/10 | 7 | 3-4 | 3-4 | 3-4 | Trial only |
| 4 | 82/f | FSSS (L5 laminectomy) | Lumbar | 18 | T9/10 | 8-10 | 8-9 | 8-9 | - | Trial only |
| 5 | 52/m | FSSS (L4/5 discectomy) | Lumbar & lower limbs | 16 | T10 | 9-10 | 5-6 | 5-6 | - | Burst & Tonic |
| 6 | 65/m | Parkinson’s disease | Lumbar & lower limbs | 2 | T8/9 | 2-8 | 2-5 | 2-3 | 2-3 | Burst |
| 7 | 76/f | Parkinson’s disease | Lumbar & lower limbs | 17 | T9/10 | 8-10 | 5-7 | 5-6 | 5-6 | Burst |
SCS: spinal cord stimulation, NRS: numerical rating scale, and FSSS: failed spinal surgery syndrome.
NRS was not measured during the day of SEP (somatosensory evoked potential) -SCS interference study. *NRS during high dose SCS was measured only in three patients. **No choice of high dose SCS was due to the use of non-rechargeable battery in these patients.
This clinical experiment was performed in the inpatient ward with no sedation after the implants during the patients' hospitalization for trial or permanent implantation of the SCSs. The experiment time was approximately one hour with no pauses, and the amplitude used in the experiment differed from that used regularly by the patients. The regular burst or high-dose strengths were approximately 60% or 80% of the paresthesia threshold. The pulse width and frequency of the tonic stimulations ranged between 200-500 μs and 30-50 Hz, respectively. Burst stimulation was used in a non-cycling mode in all the patients and consisted of a 40 Hz burst mode with five spikes at 500 Hz per burst. The pulse width was 1000 μs, with a 1000 μs interspike interval.16) The pulse widths and frequencies in the high-dose stimulation were 90-200 μs and 1000-1200 Hz. All three SCS modes (tonic, burst, and high-dose) were produced and delivered from a device manufactured by the Abbott group of companies, Chicago, USA (Proclaim Elite MRI Dual 8 with Octrode or Lamitrode electrodes). This study used the BurstDR (Abbott group of companies, Chicago, USA) with a passive recharge. To examine the different effects on the dorsal column caused by the different SCS paradigms, we used a higher amplitude than that used clinically as no clear change in the SEP amplitude was observed for the subparethesia SCSs. We calculated the electrical energy distributed around the electrodes as the total electrical energy delivered (TEED) in one second17) according to the following formula:
A (ampere) × A × R (Ω) × f (Hz) × PW (sec). Since the burst with a continuous mode (not cycle) was used, it was calculated as A × A × R × 1000 × 10−6 × 40 × 5.16) In this study, the unit of TEED was watts.18)
Posterior tibial nerve stimulated SEPs were obtained by delivering 0.2-ms square-wave pulses over the medial side of the ankle. The stimulus intensity was adjusted to yield muscle twitches or twice the sensory threshold level, with a stimulation rate of 5 Hz. The scalp recording electrode was at Cz' (2 cm posterior to Cz). In contrast, the reference electrode was placed at Fz, as defined by the international 10-20 system, in which the Cz is the central zero (midline), and Fz is the frontal zero (midline).14) This montage usually allows a clear recording of the P40-N50 cortical components. The P40 originates from the postcentral primary sensory cortex, and it provides the most stable response among the cortical components. Its amplitude is measured from the trough of P40 to the peak of the following N50.14) Analyzing the P40/N50 amplitude has clinical significance for evaluating the magnitude of ascending somatosensory volleys from the peripheral posterior tibial nerve to the cortex. Therefore, measuring the P40/N50 amplitude is adequate to evaluate the changes in the dorsal column volley during the load of the SCSs. The evoked activity was amplified with a 10-1000-Hz bandpass filter, and 300-500 responses were averaged by the Neuropack S1 (NIHON KOHDEN) system.
The SEP waveforms that were interfered with by SCSs were analyzed by comparing the cortical P40/N50 amplitudes before and during the SCSs. Two or more recordings confirmed the SEP reproducibility. Two good reproducible SEP waveforms were averaged, and the P40/N50 amplitude was measured.
The patients were asked about their sensations in response to SCSs, and the paresthesia threshold and maximum paresthesia threshold were determined according to the subjective assessment of each patient. The paresthesia threshold was the lowest intensity of SCSs that the patient could perceive, and the maximum paresthesia threshold was defined as the highest intensity the patient could rate as not painful. The latter was the patient's sensation of sufficiently tolerable strength above the paresthesia threshold and below the discomfort sensation. The paresthesia threshold and maximum paresthesia threshold of each SCS paradigm were determined during the experiment. The TEED at the paresthesia threshold and maximum paresthesia threshold was calculated as an objective electrical parameter to compare these subjective sensations.
SEP interference waveforms were obtained during the three SCSs (tonic, burst, and high-dose) with stimulus strengths between the paresthesia threshold and maximum paresthesia threshold levels.
The SEP change ratio was calculated as (A) divided by (B). (A) was the amplitude of the SEP during the SCSs and (B) was the amplitude of the control SEP. Smaller values of SEP change ratio (A/B) indicated a greater amplitude reduction. The SEP change ratio was calculated from five patients' results during the paresthesia threshold stimulation and seven patients' results during maximum paresthesia stimulation. We compared SEP change rates between the paresthesia and maximum paresthesia thresholds for five patients.
The paired t-test and multiple comparison test for parametric data (analysis of variance followed by Tukey-Kramer) were performed using computer software (Statcel4 oms publication, Japan).
This observational study was approved by the local Institutional Review Board (No.201911-1), and all patients provided written informed consent. The study complied with the 2013 update of the Declaration of Helsinki. The experimental procedures performed on the patients followed the “Ethical guidelines for medical and health research involving human subjects (provisional translation as of March 2015).”
Results
Statistical analysis
Comparison of TEED between tonic, burst, and high-dose stimulations
As shown in Table 2a and Fig. 1, the TEED at the paresthesia threshold in the high-dose was remarkably higher than the tonic and burst stimulations (P < 0.01). Multiple comparisons showed no significant difference between the tonic and burst stimulations.
Table 2a.
Total electrical energy delivered (TEED) at paresthesia threshold (PT), maximum paresthesia threshold (MPT), and somatosensory evoked potentials (SEP) change ratio#
| SCS | TEED
at PT (μW) n = 7 |
TEED
at MPT (μW) n = 7 |
SEP change ratio#
at PT n = 5 |
SEP change ratio#
at MPT n = 7 |
|---|---|---|---|---|
| Tonic | 37 ± 29 (11) | 159 ± 169 (64) | 0.75 ± 0.15 (0.07) | 0.35 ± 0.25 (0.09) |
| Burst | 111 ± 100 (39) | 311 ± 311 (117) | 0.96 ± 0.15 (0.07) | 0.86 ± 0.1 (0.03) |
| High Dose | 1560 ± 1360 (510) | 2670 ± 2080 (786) | 1.04 ± 0.05 (0.02) | 1.02 ± 0.1 (0.03) |
Mean ± SD (SE)
SCS: spinal cord stimulation, μW: microwatts, n: number of patients, SD: standard deviation and SE: standard error.
Fig. 1.
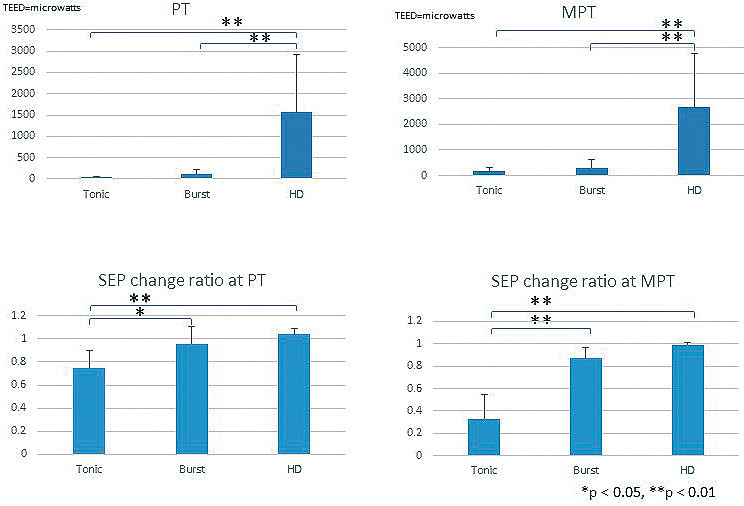
TEED and SEP change ratios.
Total electrical energy delivered (TEED) at paresthesia threshold, maximum paresthesia threshold and somatosensory evoked potential (SEP) change ratio (n = 5–7).
SEP change ratio was calculated as the amplitude of SEP during spinal cord stimulation divided by the amplitude of control SEP at paresthesia threshold (n = 5) or maximum paresthesia threshold (n = 7) stimuli.
PT, paresthesia threshold; MPT, maximum paresthesia threshold; HD, high-dose.
A similar tendency occurred when the stimulation was increased up to the maximum paresthesia threshold level (Table 2a, Fig. 1). The TEED in the high-dose was significantly higher than those of the tonic and burst stimulations (P < 0.01). Multiple comparisons showed no statistically significant differences between the tonic and burst stimulations.
SEP-SCS interference
The SEP-SCS interference study revealed that the SEP change ratio in the tonic stimulation was significantly smaller than those of the burst and high-dose stimulations (P < 0.01-P < 0.05) in both the paresthesia and maximum paresthesia threshold stimulations (Table 2a, Fig. 1). There were no significant differences between the burst and high-dose stimulations.
The TEED values of the paresthesia and maximum paresthesia thresholds during the high-dose stimulation were significantly higher than those during the tonic stimulation. However, the SEP amplitude reduction during the high-dose stimulation at the paresthesia and maximum paresthesia levels was significantly smaller than during the tonic stimulation (Table 2a, Fig. 1). The TEED values to reach the paresthesia and maximum paresthesia levels were not significantly different between the tonic and burst stimulations, while the SEP amplitude reduction during the burst stimulation at the paresthesia and maximum paresthesia levels was significantly smaller than that during the tonic stimulation (Table 2a, Fig. 1).
Moreover, the SEP change ratio decreased significantly when the strength of tonic stimulation increased from the paresthesia to the maximum paresthesia level (Table 2b), indicating dose-dependent SEP amplitude reduction. This change did not occur with the use of BurstDR and a high-dose (Table 2b).
Table 2b.
Comparison of somatosensory evoked potentials (SEP) change ratios# between paresthesia threshold (PT) and maximum paresthesia threshold (MPT) stimulations (5 patients)
| SCS | SEP change ratio# at PT | SEP change ratio# at MPT | Paired t-test |
|---|---|---|---|
| Tonic | 0.75 ± 0.15 (0.07) * | 0.33 ± 0.22 (0.1) * | *p < 0.05 |
| Burst | 0.96 ± 0.15 (0.07) | 0.87 ± 0.1 (0.05) | ns |
| High Dose | 1.04 ± 0.05 (0.02) | 0.99 ± 0.02 (0.01) | ns |
Mean ± SD (SE)
SCS: spinal cord stimulation, SEP: somatosensory evoked potentials
# Amplitude of SEP (P40/N50) during SCS/amplitude of control SEP (N40/P50),
μW: microwatts, n = number of patients, SD: standard deviation, SE: standard error,
and ns: nonsignificant.
Case presentations
Representative cases were shown to confirm the SEP changes during tonic, burst, and high-dose SCSs.
Case 1: A 55-year-old man with failed spinal surgery syndrome (Table 1)
Following C3-7 laminoplasty to treat cervical spondylosis, severe cervical cord edema occurred and was treated with conservative therapy. The patient felt severe pain in four limbs, which worsened gradually (8-10/10 Numerical Rating Scale). Various medications failed to control the pain. He was referred to our hospital, and the SCS trial was successful. SCS electrodes were implanted with the stimulation tips at the upper edge of the T1 vertebra. The Numerical Rating Scale decreased to 1-2/10, and his total medication dose decreased to less than 20% of that pre-SCS.
Tonic vs. burst
Figure 2a shows the results of the comparisons of SEP changes between the tonic and burst SCSs. The applied tonic stimulation (7.3 mA) was approximately 2.5-fold greater than the paresthesia threshold (2.9 mA). Compared to the pre-SCS control SEP waveforms (Fig. 2a-A), an almost complete loss of cortical P40/N50 components occurred during the tonic SCSs (Fig. 2a-B). In contrast, the P40/N50 amplitude was not suppressed during the burst stimulation (Fig. 2a-C and D) even though the stimulus strength (1.4 mA) was four times the paresthesia threshold (0.35 mA), and nearly the same TEED was supplied as that of the tonic SCSs.
Fig. 2a.
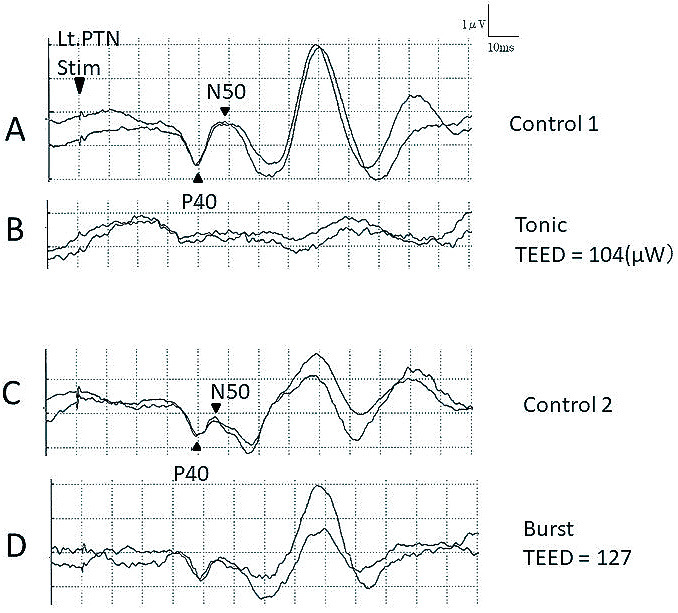
Comparisons between tonic and burst stimulations.
Effects of spinal cord stimulation on posterior tibial nerve-stimulated somatosensory evoked potential (SEP). The P40/N50 is almost absent during tonic stimulation (A, B) but is clearly preserved during burst spinal cord stimulation (C, D). The total electrical energy delivered (TEED) of tonic spinal cord stimulation (B) = 7.3 mA2 × 325 ohms × 30 Hz × PW 200 μs = 1.04 × 10⁸ (mA2 × Ω × Hz × μs) = 104 microwatts (μW). The TEED of burst spinal cord stimulation (D) = 0.0014A × 0.0014A × 325 ohms × 40 Hz × 5 × PW 0.001 sec = 1.27 × 10⁸ (mA2 × Ω × Hz × μs) = 127 microwatts (μW).
PTN; Posterior tibial nerve.
Tonic vs. high-dose
Figure 2b shows the SEP changes during the application of tonic or high-dose SCSs. The control SEP without an SCS was recorded first (Fig. 2b-A). The paresthesia threshold was 2.8 mA, with a tonic stimulation of PW 500 μs and 30 Hz, when the patient felt paresthesia in his right axilla and upper limb. The P40/N50 components became obscure at stimulation strengths of 3.9 mA (Fig. 2b-B) and 7 mA (Fig. 2b-C). After the second recording of control SEP without an SCS (Fig. 2b-D), a high-dose stimulation of PW 150 μs and 1200 Hz was applied with an 8-mA paresthesia threshold strength. While the patient felt paresthesia in his right axilla and right lower limb, no amplitude reduction in P40/N50 appeared (Fig. 2b-E). The stimulus condition was changed from high-dose to tonic (PW 500 μs, 30 Hz), and the strength was increased to the 10 mA maximum paresthesia threshold, which elicited paresthesia in the bilateral hands, fingers, hips, and lower limbs. At the same time, the P40/N50 components disappeared completely (Fig. 2b-F). The high-dose stimulus condition was adjusted to PW 150 μs and 1000 Hz, and the strength was increased to the maximum paresthesia threshold of 10 mA. The TEED was 10-fold higher than that of the tonic maximum paresthesia threshold. Despite delivering significant high-dose-SCS electrical energy, the P40/N50 components were preserved (Fig. 2b-G). After the SCS was turned off, we confirmed that the SEP waveform returned to the previous control waveforms (Fig. 2b-H).
Fig. 2b.

Comparisons between tonic and high-dose stimulations.
Changes in somatosensory evoked potentials (SEP) during tonic and high-dose spinal cord stimulation, in comparison to the controls (A, D, and H), demonstrating absent P40/N50 during tonic spinal cord stimulation (B, C, and F) and preserved P40/N50 during high-dose spinal cord stimulation (E, G). Total electrical energy delivered (TEED) is shown.
PTN; Posterior tibial nerve. μW = microwatts.
This case demonstrated that the reduction in the SEP amplitude was observed more clearly in the tonic rather than in the burst (Fig. 2a) and high-dose (Fig. 2b) SCSs.
Case 2: A 42-year-old man with failed spinal surgery syndrome
The patient complained of severe pain in his bilateral lumbar and lower extremities. Following the stimulation SCS electrode placement at T9/10, his pain decreased to approximately 50% of the preoperative state by tonic and burst stimulations.
After recording the first control SEP (Fig. 3-A), a burst SCS at paresthesia threshold (1.1 mA) and maximum paresthesia threshold (1.8 mA) was administered. Paresthesia occurred at the lumbar region at the paresthesia threshold-level stimulation and the lumbar and abdominal regions at maximum paresthesia threshold-level stimulation. However, the P40/N50 amplitudes were almost unchanged (Fig. 3-B, C). A second control SEP was recorded (Fig. 3-D), and a high-dose-SCS (90 μs, 1200 Hz) with paresthesia threshold (5.5 mA) and maximum paresthesia threshold (8.2 mA)-level stimuli were delivered. The paresthesia areas at the paresthesia threshold and maximum paresthesia threshold-level stimuli were identical to those of the burst stimulus. There was no change in the P40/N50 amplitude (Fig. 3-E, F). A control SEP with good reproducibility was re-recorded (Fig. 3-G) before the tonic stimulation (500 μs, 50 Hz). Tonic SCSs elicited paresthesia in the bilateral lumbar regions and lower limbs. The P40/N50 amplitude decrease seemingly began at paresthesia threshold stimulus strength (2.2 mA) (Fig. 3-H). The P40/N50 amplitude was remarkably reduced following the increase in tonic SCSs up to the maximum paresthesia threshold (4.3 mA) (Fig. 3-I). The tonic SCSs were turned off, and the P40/N50 returned to the pre-SCS levels (Fig. 3-J).
Fig. 3.

Somatosensory evoked potentials during burst, high-dose, and tonic stimulations.
Serial somatosensory evoked potential (SEP) recordings for the interactions of burst (B, C), high-dose (E, F), and tonic (H, I) spinal cord stimulations (SCSs) are shown. The apparent reduction in P40/N50 amplitude is only seen during tonic spinal cord stimulation (I). Control SEPs (A, D, G, and J) are shown for comparisons. The values of total electrical energy delivered (TEED) are shown.
PTN, Posterior tibial nerve; PT, paresthesia threshold; MPT, maximum paresthesia threshold. μW = microwatts.
In summary, a SEP-SCS interaction was apparent when the tonic maximum paresthesia threshold stimulation (Fig. 3-I) was administered. There was no remarkable reduction in SEP amplitude for burst and high-dose SCSs (Fig. 3-C, F); however, the TEED was higher than that of the tonic SCSs.
Discussion
This study's clinical significance was that the new SCS paradigms (burst and high-dose) may be less effective on the dorsal column than the conventional tonic SCSs.
SEP-SCS interference
Interference studies of conventional tonic SCSs to SEPs have been useful in evaluating the dorsal column stimulation,9-13) although it was unclear whether the finding correlated to clinical pain relief.12) The ascending volley of short-latency SEP, elicited by electrical stimulation of the peripheral nerves, travels along the dorsal column; however, the tonic SCSs administered to the dorsal column interferes with SEP waveforms. Appropriate tonic SCSs to the dorsal column induce the loss or reduction of the SEP amplitude, and this study was conducted based on this principle.9-13) In other words, the SEP interference is clinically significant in the investigation of whether some types of electrical stimulation sufficiently activate the dorsal column or not.
The amplitude reduction of the SEP by the interference of the SCS occurs due to (I) the “collision” of the descending volley from the SCS with the ascending SEP impulse elicited by peripheral nerve stimulation; or (II) the early “saturation” of primary somatosensory cortex cells by ascending impulses delivered from the SCS, wherein the number of cells responding to the SEP impulse is decreased.9,11-13)
The present study clearly indicated that tonic SCSs induced dose-dependent SEP amplitude reduction, but the burst and high-dose SCSs did not (Table 2b).
TEED and SEP change in different SCS paradigms
Several expressions of electrical energy stimulation, such as charge per pulse, pulse density per second, and charge per second (energy/second), are calculated from parameters including pulse width, stimulus frequency, and amplitude19) and reflect the electrical energy delivered from a stimulation electrode. Since the energy applied to the tissue surrounding the electrodes is influenced by its resistance (ohm), this factor should also be considered when comparing the effects of different SCSs. The TEED is a representative calculation that includes the above-mentioned parameters17) and has been used to investigate deep brain stimulation.17,18)
Our results indicated that a high-dose stimulation could not reduce the SEP amplitude even though the energy was higher than tonic stimulation.
A burst stimulation with a similar amount of energy to the tonic stimulation could not reduce SEP amplitude as done by the tonic stimulation (Table 2a, Fig. 1). In addition, eliciting paresthesia is required to apply tonic SCSs to obtain pain relief, while the burst and high-dose stimulations are generally set below the paresthesia (sensory aware) level. Significant SEP reductions during different SCS strengths (between paresthesia and maximum paresthesia thresholds) were only apparent at tonic and not burst and high-dose stimulations (Table 2b). This finding further indicates that the effect of the stimulus strength on the SEP was different between the tonic and the burst or high-dose SCSs. All these differences may suggest that the SCS strength for the clinical use of burst and high-dose may not activate the paresthesia-producing dorsal column fibers that are the main sites of action in tonic SCSs. The burst and high-dose SCSs might not activate the same dorsal column pathway sufficiently, like that for the tonic and SEP impulse pass.
Buonocore and Demartini reported a case that showed the loss of SEP using subthreshold high-dose SCSs,15) which was contrary to our results which showed no SEP inhibition during the use of high-dose SCSs. The reason for this difference is unknown, and further case studies are required. Our findings were also consistent with those reported by Falowski, who used intraoperative monitoring.20) He showed no reduction in the SEP amplitude with high-dose-SCSs with a stimulus strength more than three-fold higher than the voltage when the SEP was lost in the tonic SCS. He also suggested that the loss of the SEP was probably not induced by using a subthreshold stimulation of the burst SCS as the SEP loss occurred after the appearance of electromyography response during the burst SCS. Niso et al. also recently reported a lack of inhibition of the early component SEP during the burst SCS.5)
Despite the small number of cases, the present study results showed robust differences in SEP interference among the SCSs.
Different sites of action between tonic and burst or high-dose SCSs
A study in rats by Tang et al. demonstrated an increased firing rate of the dorsal column nucleus by tonic but not burst SCSs.21) The authors speculated that this finding might be related to the absence of paresthesia by the burst SCSs.
Our observation of dorsal column activation by the tonic SCSs was comparable to the increased firing of the dorsal column nucleus by the tonic SCSs reported by Tang et al.,21) although the firing in their study was spontaneous rather than an evoked potential. However, the dorsal column activation appeared to be quite small during burst stimulation; thus, the SEP amplitude reduction due to the burst SCS was also likely to be small, as the dorsal column nucleus firing following the burst SCS may be scarce, as reported by Tang et al.21)
A similar finding in high-frequency (10 kHz) SCSs was reported by Song et al.,22) who showed high levels of activation of the dorsal column nucleus of rats during tonic SCSs but poor activation at 10 kHz SCSs. If these findings also apply to other high-frequency stimuli below 10 kHz, they may explain our study's poor SEP amplitude reduction during the 1000-1200 Hz SCSs.
Tang et al.21) and Song et al.22) administered stimulus strengths below the paresthesia threshold. The present study administered a stimulus strength between the paresthesia threshold and maximum paresthesia threshold. Nevertheless, these findings clearly indicated lower dorsal column stimulation for burst and high-dose SCSs than conventional tonic SCSs.
A recent computer simulation study by Arle et al. showed different fiber threshold accommodations of the Aβ fibers that comprise the dorsal column.23) They hypothesized that the large-diameter fibers are paresthesia-signaling, which has also been proposed explicitly or implicitly by modelers for decades,24) while the burst and high-dose SCSs push the paresthesia-producing threshold of large-diameter fibers above the stimulation amplitude. Their hypothesis was consistent with our results.
Limitation of our study
The participants in our study were heterogeneous because they included Parkinson's disease and failed spinal surgery syndrome. Dystonic and central pains (Parkinson's disease-related pain) and musculoskeletal, neuronal, and radicular pains (Parkinson's disease unrelated pain) are often mixed in the types of pain perceived by patients with Parkinson's disease.13,25) As suggested by previous studies,13,25) pain reduction by SCSs in patients with Parkinson's disease is probably achieved because lumbago and leg pain are caused partially by chronic neuropathic pathological conditions, which are factors even in musculoskeletal pain that has several nociceptive components.13,25)
Since we confirmed similar SEP changes in both pathological conditions, they were analyzed together statistically in this small sample size study. However, further studies will be required to evaluate whether the different diseases may show different SEP responses to different kinds of SCSs.
In conclusion, the present SEP-SCS interference study results suggested that the sites of action and the effect on the spinal cord differed between conventional tonic SCSs and burst and high-dose (up to 1200 Hz) SCSs in humans.
Conflicts of Interest Disclosure
All authors have no conflict of interest in relation to this manuscript.
Acknowledgments
We would like to thank Editage (www.editage.com) for English language editing.
References
- 1). Guan Y, Wacnik PW, Yang F, et al. : Spinal cord stimulation-induced analgesia: Electrical stimulation of dorsal column and dorsal roots attenuates dorsal horn neuronal excitability in neuropathic rats. Anesthesiology 113: 1392-1405, 2010 [DOI] [PubMed] [Google Scholar]
- 2). Yakhnitsa V, Linderoth B, Meyerson BA: Spinal cord stimulation attenuates dorsal horn neuronal hyperexcitability in a rat model of mononeuropathy. Pain 79: 223-233, 1999 [DOI] [PubMed] [Google Scholar]
- 3). Wallin J, Fiskå A, Tjølsen A, Linderoth B, Hole K: Spinal cord stimulation inhibits long-term potentiation of spinal wide dynamic range neurons. Brain Res 973: 39-43, 2003 [DOI] [PubMed] [Google Scholar]
- 4). Tanei T, Kajita Y, Takebayashi S, Aoki K, Nakahara N, Wakabayashi T: Predictive factors associated with pain relief of spinal cord stimulation for central post-stroke pain. Neurol Med Chir (Tokyo) 59: 213-221, 2019 [DOI] [PMC free article] [PubMed] [Google Scholar]
- 5). Niso G, Tjepkema-Cloostermans MC, Lenders MWPM, de Vos CC: Modulation of the somatosensory evoked potential by attention and spinal cord stimulation. Front Neurol 12: 1-11, 2021 [DOI] [PMC free article] [PubMed] [Google Scholar]
- 6). Vallejo R, Bradley K, Kapural L: Spinal cord stimulation in chronic pain: Mode of action. Spine 42: S53-S60, 2017 [DOI] [PubMed] [Google Scholar]
- 7). Linderoth B, Foreman RD: Conventional and novel spinal stimulation algorithms: Hypothetical mechanisms of action and comments on outcomes. Neuromodulation 20: 525-533, 2017 [DOI] [PubMed] [Google Scholar]
- 8). Yearwood T, De Ridder D, Yoo HB, et al. : Comparison of neural activity in chronic pain patients during tonic and burst spinal cord stimulation using fluorodeoxyglucose positron emission tomography. Neuromodulation 23: 56-63, 2020 [DOI] [PubMed] [Google Scholar]
- 9). Polácek H, Kozák J, Vrba I, Vrána J, Stancák A: Effects of spinal cord stimulation on the cortical somatosensory evoked potentials in failed back surgery syndrome patients. Clin Neurophysiol 118: 1291-1302, 2007 [DOI] [PubMed] [Google Scholar]
- 10). Balzer JR, Tomycz ND, Crammond DJ, et al. : Localization of cervical and cervicomedullary stimulation leads for pain treatment using median nerve somatosensory evoked potential collision testing. J Neurosurg 114: 200-205, 2011 [DOI] [PubMed] [Google Scholar]
- 11). Buonocore M, Bodini A, Demartini L, Bonezzi C: Inhibition of somatosensory evoked potentials during spinal cord stimulation and its possible role in the comprehension of antalgic mechanisms of neurostimulation for neuropathic pain. Minerva Anestesiol 78: 297-302, 2012 [PubMed] [Google Scholar]
- 12). Wolter T, Kieselbach K, Sircar R, Gierthmuehlen M: Spinal cord stimulation inhibits cortical somatosensory evoked potentials significantly stronger than transcutaneous electrical nerve stimulation. Pain Physician 16: 405-414, 2013 [PubMed] [Google Scholar]
- 13). Urasaki E, Tsuda M, Nakane S, Toyoda K, Umeno T, Yamakawa Y: Spinal cord stimulation for intractable pain evaluated by a collision study using somatosensory evoked potentials: A preliminary report. Neuromodulation 17: 746-752, 2014 [DOI] [PubMed] [Google Scholar]
- 14). Cruccu G, Aminoff MJ, Curio G, et al. : Recommendations for the clinical use of somatosensory-evoked potentials. Clin Neurophysiol 119: 1705-1719, 2008 [DOI] [PubMed] [Google Scholar]
- 15). Buonocore M, Demartini L: Inhibition of somatosensory evoked potentials during different modalities of spinal cord stimulation: A case report. Neuromodulation 19: 882-884, 2016 [DOI] [PubMed] [Google Scholar]
- 16). De Ridder D, Vanneste S, Plazier M, Van Der Loo E, Menovsky T: Burst spinal cord stimulation: Toward paresthesia-free pain suppression. Neurosurgery 66: 986-990, 2010 [DOI] [PubMed] [Google Scholar]
- 17). Koss AM, Alterman RL, Tagliati M, Shils JL: Calculating total electrical energy delivered by deep brain stimulation systems. Ann Neurol 58: 168, 2005 [DOI] [PubMed] [Google Scholar]
- 18). McAuley MD: Incorrect calculation of total electrical energy delivered by deep brain stimulator. Brain Stimul 13: 1414-1415, 2020 [DOI] [PubMed] [Google Scholar]
- 19). Miller JP, Eldabe S, Buchser E, Johanek LM, Guan Y, Linderoth B: Parameters of spinal cord stimulation and their role in electrical charge delivery: A review. Neuromodulation 19: 373-384, 2016 [DOI] [PubMed] [Google Scholar]
- 20). Falowski SM: An observational case series of spinal cord stimulation waveforms visualized on intraoperative neuromonitoring. Neuromodulation 22: 219-228, 2019 [DOI] [PubMed] [Google Scholar]
- 21). Tang R, Martinez M, Goodman-Keiser M, Farber JP, Qin C, Foreman RD: Comparison of burst and tonic spinal cord stimulation on spinal neural processing in an animal model. Neuromodulation 17: 143-151, 2014 [DOI] [PubMed] [Google Scholar]
- 22). Song Z, Viisanen H, Meyerson BA, Pertovaara A, Linderoth B: Efficacy of kilohertz-frequency and conventional spinal cord stimulation in rat models of different pain conditions. Neuromodulation 17: 226-234, 2014 [DOI] [PubMed] [Google Scholar]
- 23). Arle JE, Mei LZ, Carlson KW: Fiber threshold accommodation as a mechanism of burst and high frequency spinal cord stimulation. Neuromodulation 23: 582-593, 2020 [DOI] [PubMed] [Google Scholar]
- 24). Holsheimer J: Which neuronal elements are activated directly by spinal cord stimulation. Neuromodulation 5: 25-31, 2002 [DOI] [PubMed] [Google Scholar]
- 25). Agari T, Date I: Spinal cord stimulation for the treatment of abnormal posture and gait disorder in patients with Parkinson's disease. Neurol Med Chir (Tokyo) 52: 470-474, 2012 [DOI] [PubMed] [Google Scholar]