

SUMMARY
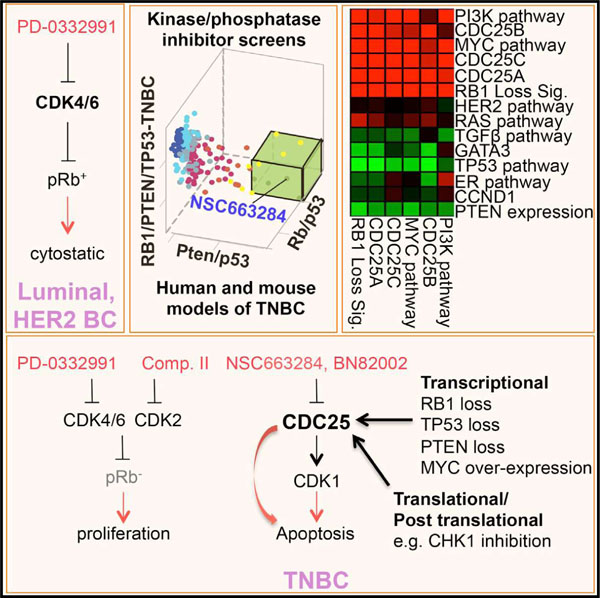
CDK4/6 inhibitors are effective against cancer cells expressing the tumor suppressor RB1, but not RB1-deficient cells, posing the challenge of how to target RB1 loss. In triple-negative breast cancer (TNBC), RB1 and PTEN are frequently inactivated together with TP53. We performed kinome/phosphatase inhibitor screens on primary mouse Rb/p53-, Pten/p53-, and human RB1/PTEN/TP53-deficient TNBC cell lines and identified CDC25 phosphatase as a common target. Pharmacological or genetic inhibition of CDC25 suppressed growth of RB1-deficient TNBC cells that are resistant to combined CDK4/6 plus CDK2 inhibition. Minimal cooperation was observed in vitro between CDC25 antagonists and CDK1, CDK2, or CDK4/6 inhibitors, but strong synergy with WEE1 inhibition was apparent. In accordance with increased PI3K signaling following long-term CDC25 inhibition, CDC25 and PI3K inhibitors effectively synergized to suppress TNBC growth both in vitro and in xenotransplantation models. These results provide a rationale for the development of CDC25-based therapies for diverse RB1/PTEN/TP53-deficient and -proficient TNBCs.
Graphical Abstract
In Brief
Liu et al. report that inhibition of the protein phosphatase CDC25 kills diverse triple-negative breast cancer (TNBC) cells. Moreover, CDC25 antagonists cooperate with other drugs, such as PI3K inhibitors, to efficiently suppress growth of human TNBC engrafted into mice.
INTRODUCTION
Breast cancer (BC), a leading cause of death from malignancies in women worldwide, comprises three major pathological subtypes: ER+, HER2/NEU/ERBB2+, and triple-negative BC (TNBC) (Curtis et al., 2012; Koboldt et al., 2012; Nik-Zainal et al., 2016; Prat and Perou, 2011). TNBCs include basal-like and claudin-low tumors that are highly aggressive. TNBCs are treated with chemotherapy/radiation; no targeted therapy is currently available. The tumor suppressor genes RB1 and PTEN are frequently lost together with TP53 in TNBC. Using different bioinformatics approaches, RB1 and TP53 were estimated to be lost together in ≥28% of TNBC, and PTEN plus TP53 in ~19% (Jones et al., 2016) (Liu et al., 2014). RB1 exerts its anti-proliferative effects by binding to and inhibiting the function of activating E2F1–3 transcription factors, which regulate the expression of genes required for cell-cycle progression (Kitajima and Takahashi, 2017; Liu et al., 2015; Zacksenhaus et al., 2017). G1 cyclin-dependent kinase CDK4/6-cyclin D and CDK2-cyclin E complexes phosphorylate and inactivate pRb, leading to cell-cycle progression. In BC and other malignancies in which RB1 is intact, pRb is invariably inactivated through hyper-phosphorylation in response to amplification or overexpression of CYCLIN Ds, CYCLIN Es, CDK4/6, or CDK2 or loss of negative regulators such as the CDK4/6 inhibitor p16INK4A. Thus, BCs that are ER+ or HER2+ and express hyper-phosphorylated pRb are highly sensitive to cytostatic effects of CDK4/6 inhibitors such as PD0332991 in vitro (Finn et al., 2009). Indeed, these drugs have shown great promise in clinical trials (reviewed in Knudsen and Witkiewicz, 2017; Otto and Sicinski, 2017). BC cells that do not express RB1 respond poorly to PD0332991. In addition, recurrent disease is often accompanied by RB1 loss (Herrera-Abreu et al., 2016). RB1 deficiency is not druggable (Jiang et al., 2011); moreover, as shown herein, combined treatments with CDK4/6 plus CDK2 inhibitors weakly suppress growth of RB1-deficient TNBC cells compared to RB1-proficient cells. Loss of the tumor suppressor PTEN in TNBC also poses a clinical challenge. PTEN is a phosphatase that antagonizes phosphatidylinositol 3-kinase (PI3K) signaling by dephosphorylating phosphatidylinositol 3,4,5-trisphosphate (PIP3) (Wang et al., 2017, and references therein). PTEN-deficient TNBCs respond to PI3K inhibitors; however, PI3K inhibition often leads to relapse and even promotes tumor dissemination by inducing mitochondrial activity (Caino et al., 2015), suggesting that combination therapy is needed for effective treatment. Finally, the RB1 pathway (RB1; p16INK4A), PI3K pathway (PIK3CA; PTEN), and TP53 are major drivers of metastasis in diverse cancer types (Robinson et al., 2017). There is, therefore, an urgent need to identify therapeutic targets for TNBC and other malignancies with alterations in these pathways.
To dissect the genetic behavior of these tumors and identify potential targets, we generated mouse models for Rb/p53- and Pten/p53-deficient TNBC (Jiang et al., 2010; Jones et al., 2016; Liu et al., 2014; Wang et al., 2016). In each case, we identified downstream vulnerabilities that can be exploited therapeutically. Specifically, for PTEN/TP53 loss, we identified eEF2K as a therapeutic target downstream of PI3K-mTOR signaling (Liu et al., 2014); for RB1/TP53 deficiency, we identified the mitochondrial protein translation pathway downstream of RB1-E2F1/3 (Jones et al., 2016). To search for pathways/inhibitors that can target aggressive TNBCs with alterations in these pathways, we herein performed kinome/phosphatase screens on primary mouse Rb/p53- and Pten/p53-deficient tumor cells as well as human TNBC lines with mutations in these genes. We describe the identification of the dual-specificity protein phosphatase CDC25 (cell division cycle 25) as a key target for these divergent TNBC types both in vitro and in xenograft assays. CDC25 removes inhibitory phosphate residues from various cyclin-dependent kinases (CDKs) including CDK1, the only essential CDK in mammals (Santamaría et al., 2007). There are three variants of CDC25, CDC25A–C, that play critical roles in DNA-damage responses and the G1/S and G2/M transitions (Boutros et al., 2007). Although CDC25 inhibitors were previously investigated as potential therapies for various cancers, including BC (Cangi et al., 2000), the pathophysiological context in which these drugs may be effective has not been defined. Our results suggest that, while CDK4/6 antagonists are effective against RB1+, ERa+ luminal, or HER2+ BCs, inhibitors of CDC25, alone or in combination with other components of the CDC25 pathway such as WEE1, offer potent interventions to treat aggressive RB1-, PTEN-, and TP53-deficient TNBCs.
RESULTS
Weak Effect of CDK4/6 Plus CDK2 Inhibitors on RB1-Deficient TNBC Cells
TNBCs are refractory to the CDK4/6 inhibitor PD0332991 (Finn et al., 2009; Robinson et al., 2013). As these tumors often exhibit high levels of cyclin E, we asked whether the presence or absence of RB1 modulated TNBC sensitivity to the CDK2 Inhibitor II (EMD Millipore) (Davis et al., 2002), either alone or in combination with PD0332991. Growth inhibition by 3-(4,5-dimethylthiazol-2-yl)-2,5-diphenyltetrazolium bromide (MTT) assay was determined 3 days post-treatment with low doses of each drug. Synergy was assessed by CompuSyn analysis (http://www.combosyn.com) (Chou and Talalay, 1984), in which a combination index (CI) < 0.85 denotes synergy, a CI of 0.9–1.0 denotes additive effects, and a CI > 1.1 denotes antagonistic effects. The RB1 status in these TNBC lines is indicated: BT549 and MDA-MB-436 harbor both RB1 and PTEN alterations, and all lines contain TP53 mutations/deletions. With the exception of HCC38, the RB1+ tumor lines exhibited greater sensitivity to CDK4/6 plus CDK2 inhibitors than lines deficient in RB1. Moreover, we found strong and moderate synergy between PD0332991 and the CDK2 inhibitor in the RB1+ lines MDA-MB-231 and MDA-MB-157, respectively, but no effect in RB1+ HCC38 TNBC cells and none in all three RB1-deficient TNBC lines (BT549, MDA-MB-436, and MDA-MB-468; Figure S1A). Flow cytometry analysis using annexin V/PI staining corroborated these results, showing increased apoptosis in the RB1-positive MDA-MB-231 but not in RB1-deficient BT549 cells following combined treatment with the CDK4/6 and CDK2 inhibitors (Figure S1B). To identify a possible common target for TNBC, we interrogated these human TNBC lines along with primary cultures from Rb/p53- and Pten/p53-deficient mouse mammary tumors, as described below.
Common and Distinct Features of Rb/p53- and Pten/p53-Deficient Mammary Tumors
To gauge the gene expression differences and similarities between Rb/p53 and Pten/p53 mammary tumors, we first performed unsupervised hierarchical clustering with mouse and human BC samples (Herschkowitz et al., 2007; Liu et al., 2014). Batch correction and integration were performed via ‘‘distance weighted discrimination’’ (DWD), using normal mouse mammary glands and tumors from MMTV-Her2/Neu mice as internal controls. With three exceptions, all Rb/p53 and Pten/p53 mammary tumors clustered with other mouse models of spindle-shape tumors, which closely resemble human claudin-low (CL) and basal-like BC (Figure 1A). Outliers included two Pten/p53 tumors that clustered with mouse Pten tumors and one Rb/p53 tumor that clustered with basal-like SV40 large Tag tumors.
Figure 1. Cluster Analysis and Expression of CDC25 Pathway Genes in Pten/p53- and Rb/p53-Deficient Claudin-Low-Like Mammary Tumors.
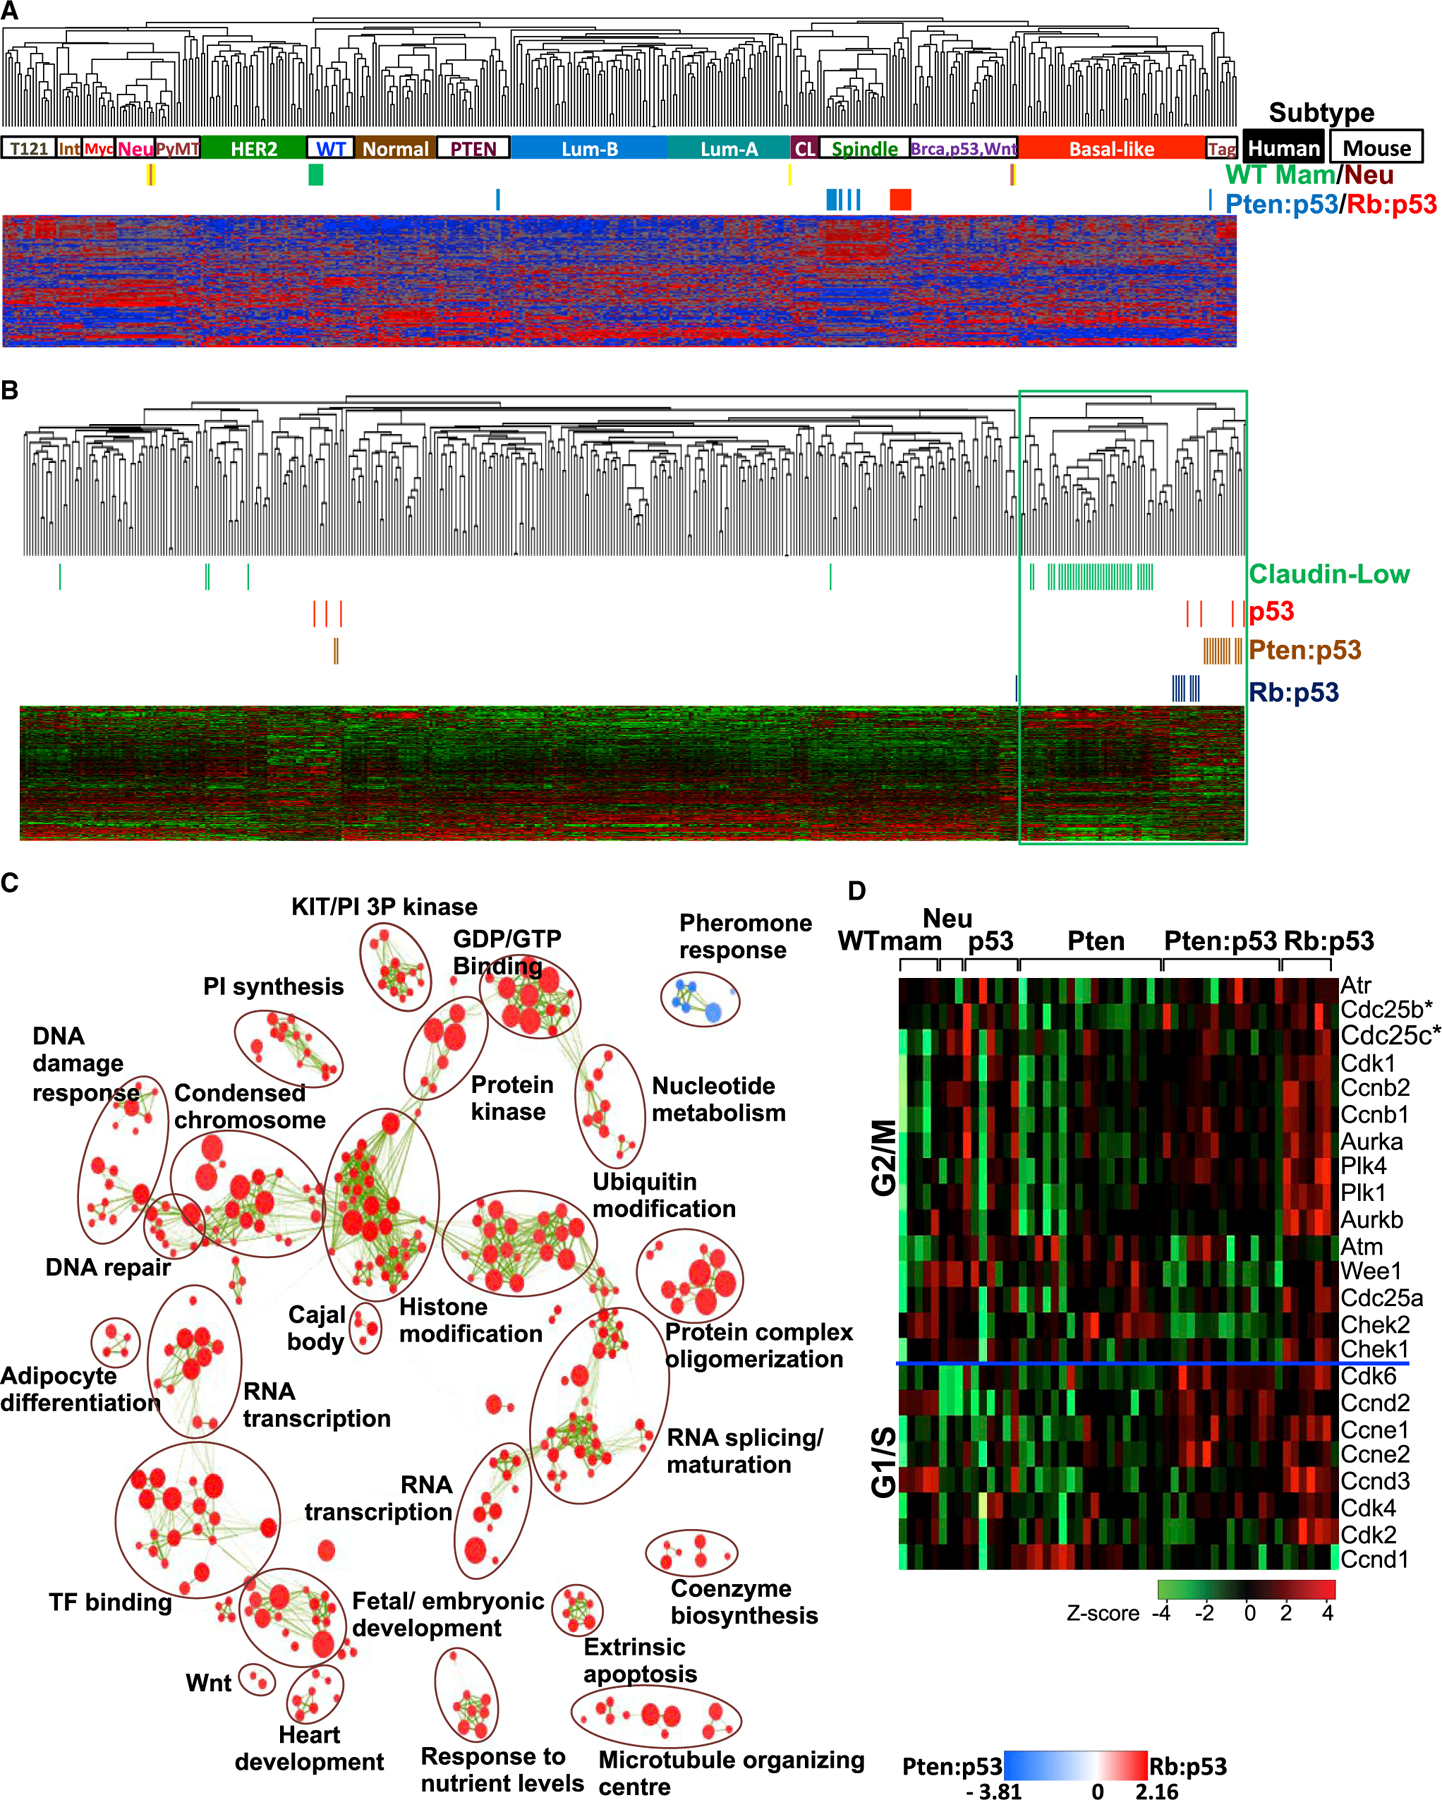
(A) Cluster analysis of Pten/p53- and Rb/p53-deficient mammary tumors using an intrinsic gene signature in comparison with human BC samples (solid boxes indicate basal-like, CL, luminal-A, luminal-B, HER2, and normal samples) and mouse mammary tumors (open boxes indicate Spindle, WTM [WT mammary glands], Neu [MMTV-Neu], Myc [Myc-derived], PyMT [MMTV-PyMT], Int [MMTV-Int3], Tag [tag-derived], PTEN [Pten-deficient], and Brca,p53,Wnt [Brca1-deficient, p53-deficient, MMTV-Wnt1]). Accession number for Rb/p53, p53 tumors, and WT mammary gland: GSE62016 and for PTEN/p53, PTEN, and Neu tumors: GSE39955.
(B) Cluster analysis of Pten/p53- and Rb/p53-deficient mammary tumors with human claudin-low (green) BC using the Prat/Perou claudin-low signature.
(C) GSEA visualized by Enrichment Map in Cytoscape showing most significant pathways enriched in Rb/p53 (red) versus Pten/p53 (blue) tumors. Green lines indicate connections of overlapping pathways. A complete GSEA profile is shown in Figure S2A.
(D) Heatmap showing the expression of genes on the CDC25 pathway in indicated mouse models. Expression of Cdc25B and Cdc25C is significantly higher in p53, Rb/p53, and Pten/p53 relative to Pten tumors or normal mammary glands, respectively (statistical analysis is given in Figure S3).
See also Figures S2 and S3.
We next used a claudin-low signature developed by Prat and Perou (Prat et al., 2010). Again, with the exception of the same three outliers, Rb/p53 and Pten/p53 mammary tumors clustered together with human claudin-low BC (Figure 1B). In these analyses, the Rb/p53 and Pten/p53 mammary tumors clustered near each other but as two distinct groups, suggesting some differences but otherwise much similarity between these tumor types. We then performed pathway analysis using gene set enrichment analysis (GSEA) on the claudin-low-like Rb/p53 and Pten/p53 tumors and visualized results as an enrichment map generated through Cytoscape software at high stringency (p < 0.005, and false discovery rate [FDR] Q < 0.05). Multiple pathways were elevated in Rb/p53 versus Pten/Rb tumors, including cell stemness such as WNT, fetal/embryonic development, and heart development (Figure 1C; Figure S2A). Expression of proliferation, epithelial-mesenchymal transition (EMT), and hypoxia genes was induced in both Rb/p53 and Pten/p53 tumors compared with other subtypes (Figure S2B). As a prelude to the analysis discussed later, we specifically examined the expression of genes on the Cdc25 pathway. Expression of Cdc25 pathway genes—and, specifically Cdc25B and Cdc25C—was induced in Rb/p53-, Pten/p53-, and p53-deficient tumors relative to Pten loss and normal mammary gland, respectively (Figure 1D; statistical analysis is given in Figure S3).
Focused Drug Screens of Mouse Rb/p53- and Pten/p53-Deficient Mammary Tumors and Human RB1/PTEN/TP53 Mutant BC Lines Identify CDC25 as a Common Target
While RB1 loss disrupts G1/S checkpoint control, other checkpoints may still be functional and critical regulators of growth for RB1-deficient TNBC. To identify such Achilles’ heels, we performed a focused screen of 238 compounds targeting 154 different protein kinases and phosphatases (3 μM) for multiple cell-cycle transitions. We screened two primary cultures from Rb/p53-deficient tumors; four primary Pten/p53-deficient tumors; and two human TNBC lines; BT549 and MDA-MB-436, both with mutations/deletions in all three tumor suppressor genes (RB1, PTEN, and TP53). We set a cutoff of 2-fold growth suppression by alamar blue staining 3 days post-drug treatment (single dose). A CDC25 inhibitor, NSC663284, exerted the strongest and most consistent growth inhibition on all three groups of tumor cells (Figures 2A–2C). Three other compounds were identified: staurosporine, a pan-kinase inhibitor; IKK16, a selective inhibitor of IκB kinases IKKα and IKKβ; and FAK inhibitor 14, a non-specific FAK inhibitor. CDC25 inhibition has been previously shown to suppress growth of diverged cancer types, including BC (Boutros et al., 2007; Kristjánsdóttir and Rudolph, 2004). Our results suggest that this phosphatase, which activates multiple CDKs, including cyclin-dependent kinase 1 (CDK1, human CDC2), may be particularly effective against TNBCs, which are resistant to CDK4/6 plus CDK2 inhibition.
Figure 2. Identification of RB1/PTEN/TP53-Deficient TNBC-Suppressing Compounds.
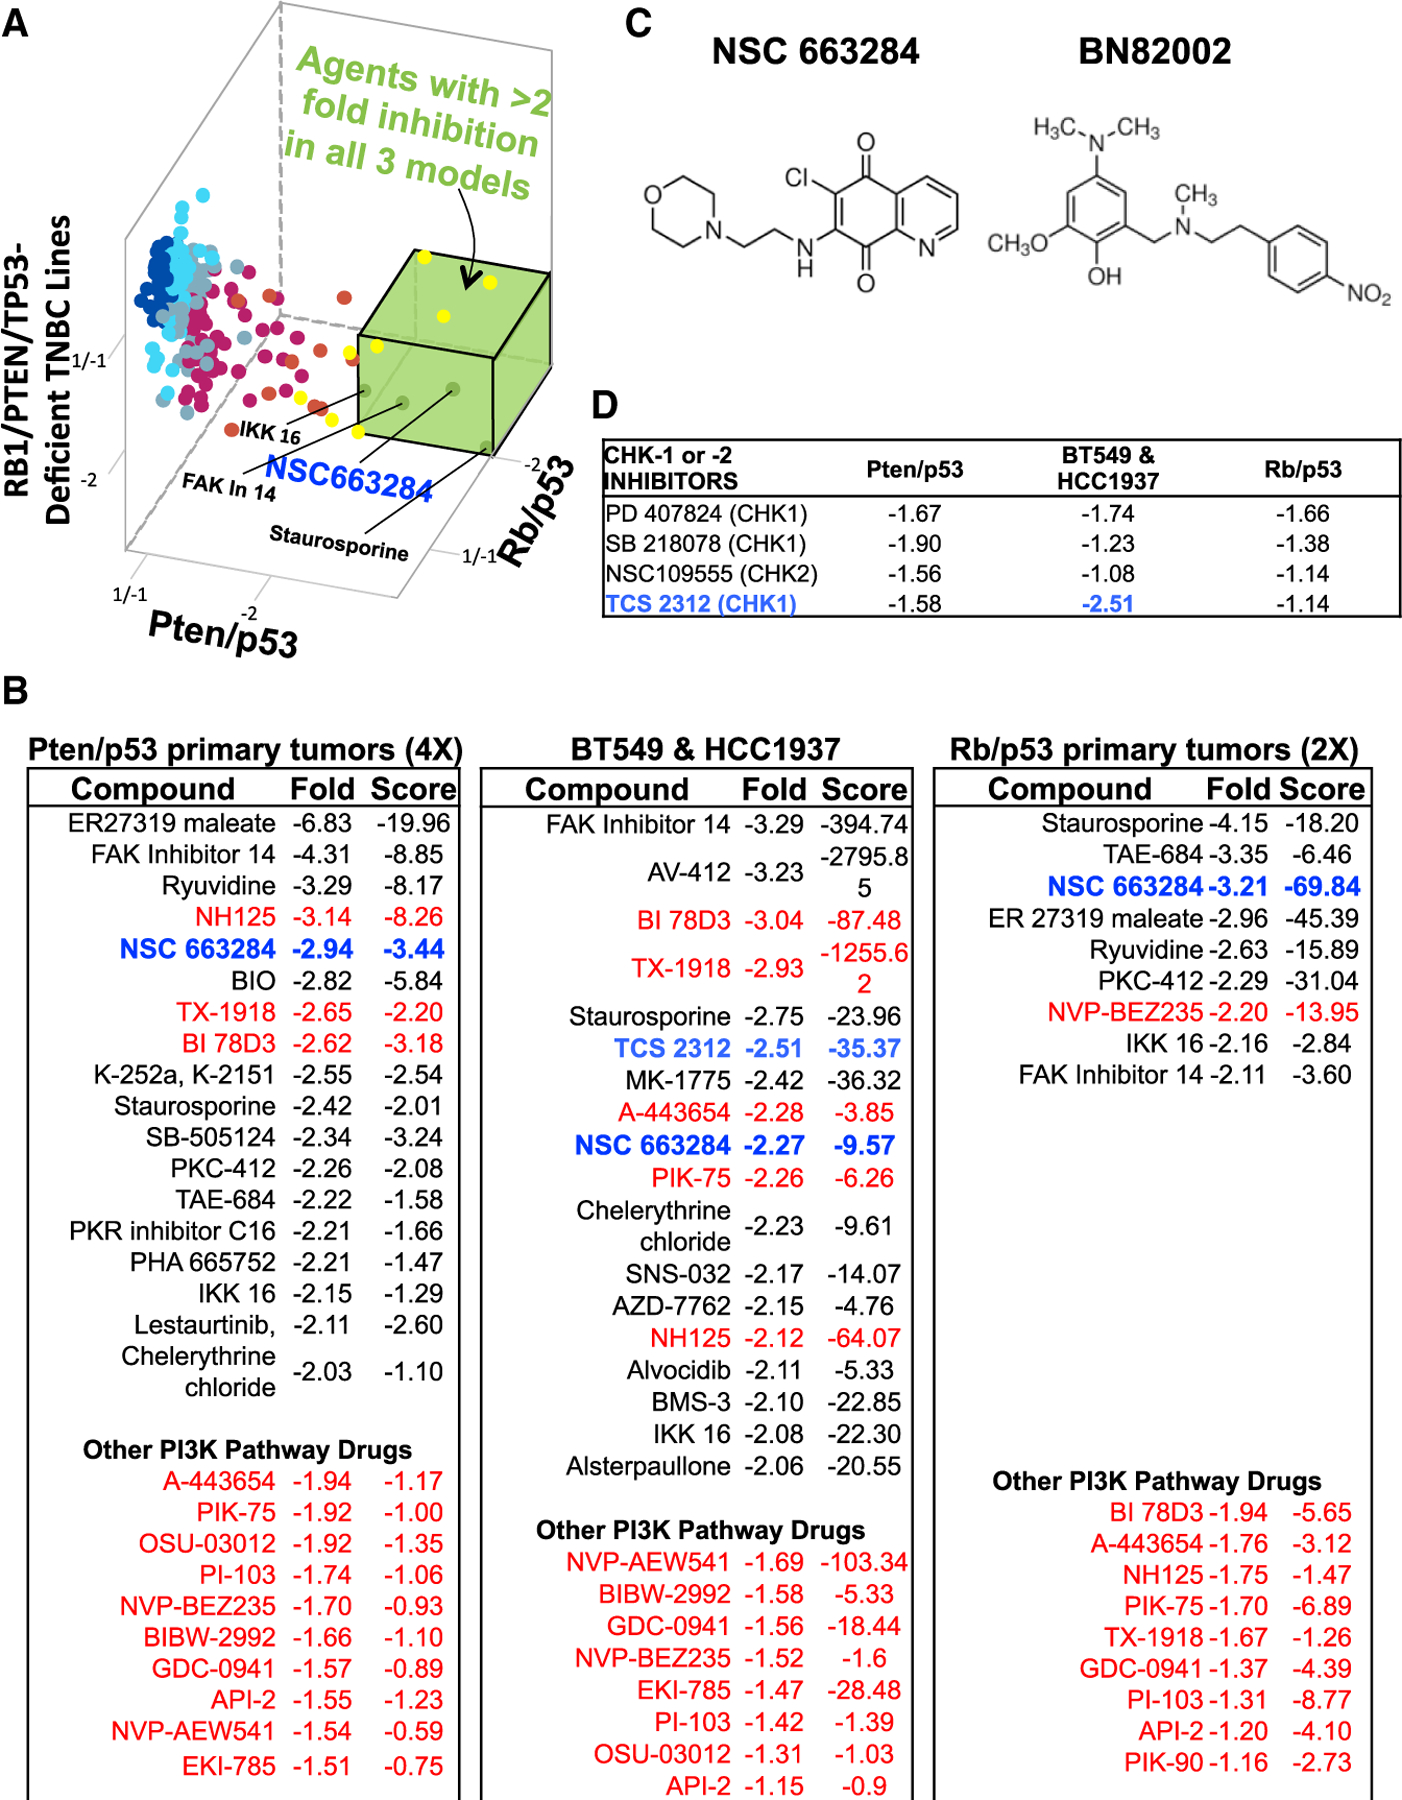
(A) 3D representation (fold change calculated compared to non-treated cells) of kinase/phosphatase inhibitor screens on primary mouse Pten/p53 tumor, mouse Rb/p53 primary tumor cells, and human RB1/PTEN/TP53-deficient TNBC cell lines (BT549 and HCC1937). Compounds with >2-fold inhibition on all three models of TNBC cells (green box) are indicated.
(B) Top inhibitory compounds with fold change and T score (difference divided by SD) for the three groups of tumor cells. The CDC25 inhibitor NSC663284 is highlighted in blue; CHK1 inhibitor TCS-2312 is indicated in light blue; PI3K pathway inhibitors are indicated in red.
(C) Chemical structure of CDC25 inhibitors NSC663284 and BN82002.
(D) Effects of CHK1 and CHK2 inhibitors with fold change on the three groups of tumor cells.
Checkpoint kinases 1 and 2 (CHK1/2) are negative regulators of CDC25, which, in response to DNA damage, are induced to arrest cells at different stages of the cell cycle, thereby facilitating DNA repair (Bartek and Lukas, 2003; Medema and Macůrek, 2012). Despite this tumor-suppressing function, CHK1 and CHK2 are elevated in cancer and act as oncogenes, so that their inhibition is therapeutic (Ma et al., 2011). Several CHK1 inhibitors, PD-407824, SB-218078, and TCS-2312, and one CHK2 inhibitor, NSC-109555, were identified in our screens but, with the exception of TCS-2312, were less potent than the CDC25 inhibitor (Figures 2B and 2D). TCS-2312 exhibited stronger inhibition than the CDC25 inhibitor on the two human TNBC lines but had weak effects on mouse Rb/p53 and Pten/p53 tumors (Figure 2D, light blue). Multiple inhibitors of the PI3K pathways were also found to suppress growth of Pten/p53-deficient mouse and human TNBCs by greater than 2-fold (Figure 2C, highlighted in red). These drugs also inhibited the growth of Rb/p53-deficient TNBC-like mammary tumor cells, although only the dual-PI3K/mTOR inhibitor NVB-BEZ235 suppressed growth over the 2-fold mark.
CDC25 Inhibition Diminishes Growth and Survival of RB1-Deficient and -Proficient TNBC Cells
Though highly potent in vitro, the quinolinedione CDC25 phosphatase inhibitor NSC663284 interacts with serum glutathione, and its activity is rapidly lost in vivo (Guo et al., 2007). Thus, to validate the inhibitory effect of CDC25 antagonists, we also examined the response of RB1-deficient TNBC cells to another CDC25 inhibitor, BN82002, which has a higher half maximal inhibitory concentration (IC50) but better pharmacokinetics (Brezak et al., 2004) (Figure 2C). CDC25 dephosphorylates multiple substrates, including CDK1 on tyrosine-15 (Y15) (Boutros et al., 2007). To confirm the effect of these inhibitors on CDC25 in TNBC cells, NSC663284- or BN82002-treated cells were analyzed by immunoblotting with phospho-specific antibody for CDK1Y15. These treatments increased Y15 phosphorylation in TNBC lines, confirming their antagonistic effects on CDC25 phosphatase activity in this cancer subtype (Figure 3A).
Figure 3. RB1-Deficient TNBC Cells Are Sensitive to CDC25 Inhibition.
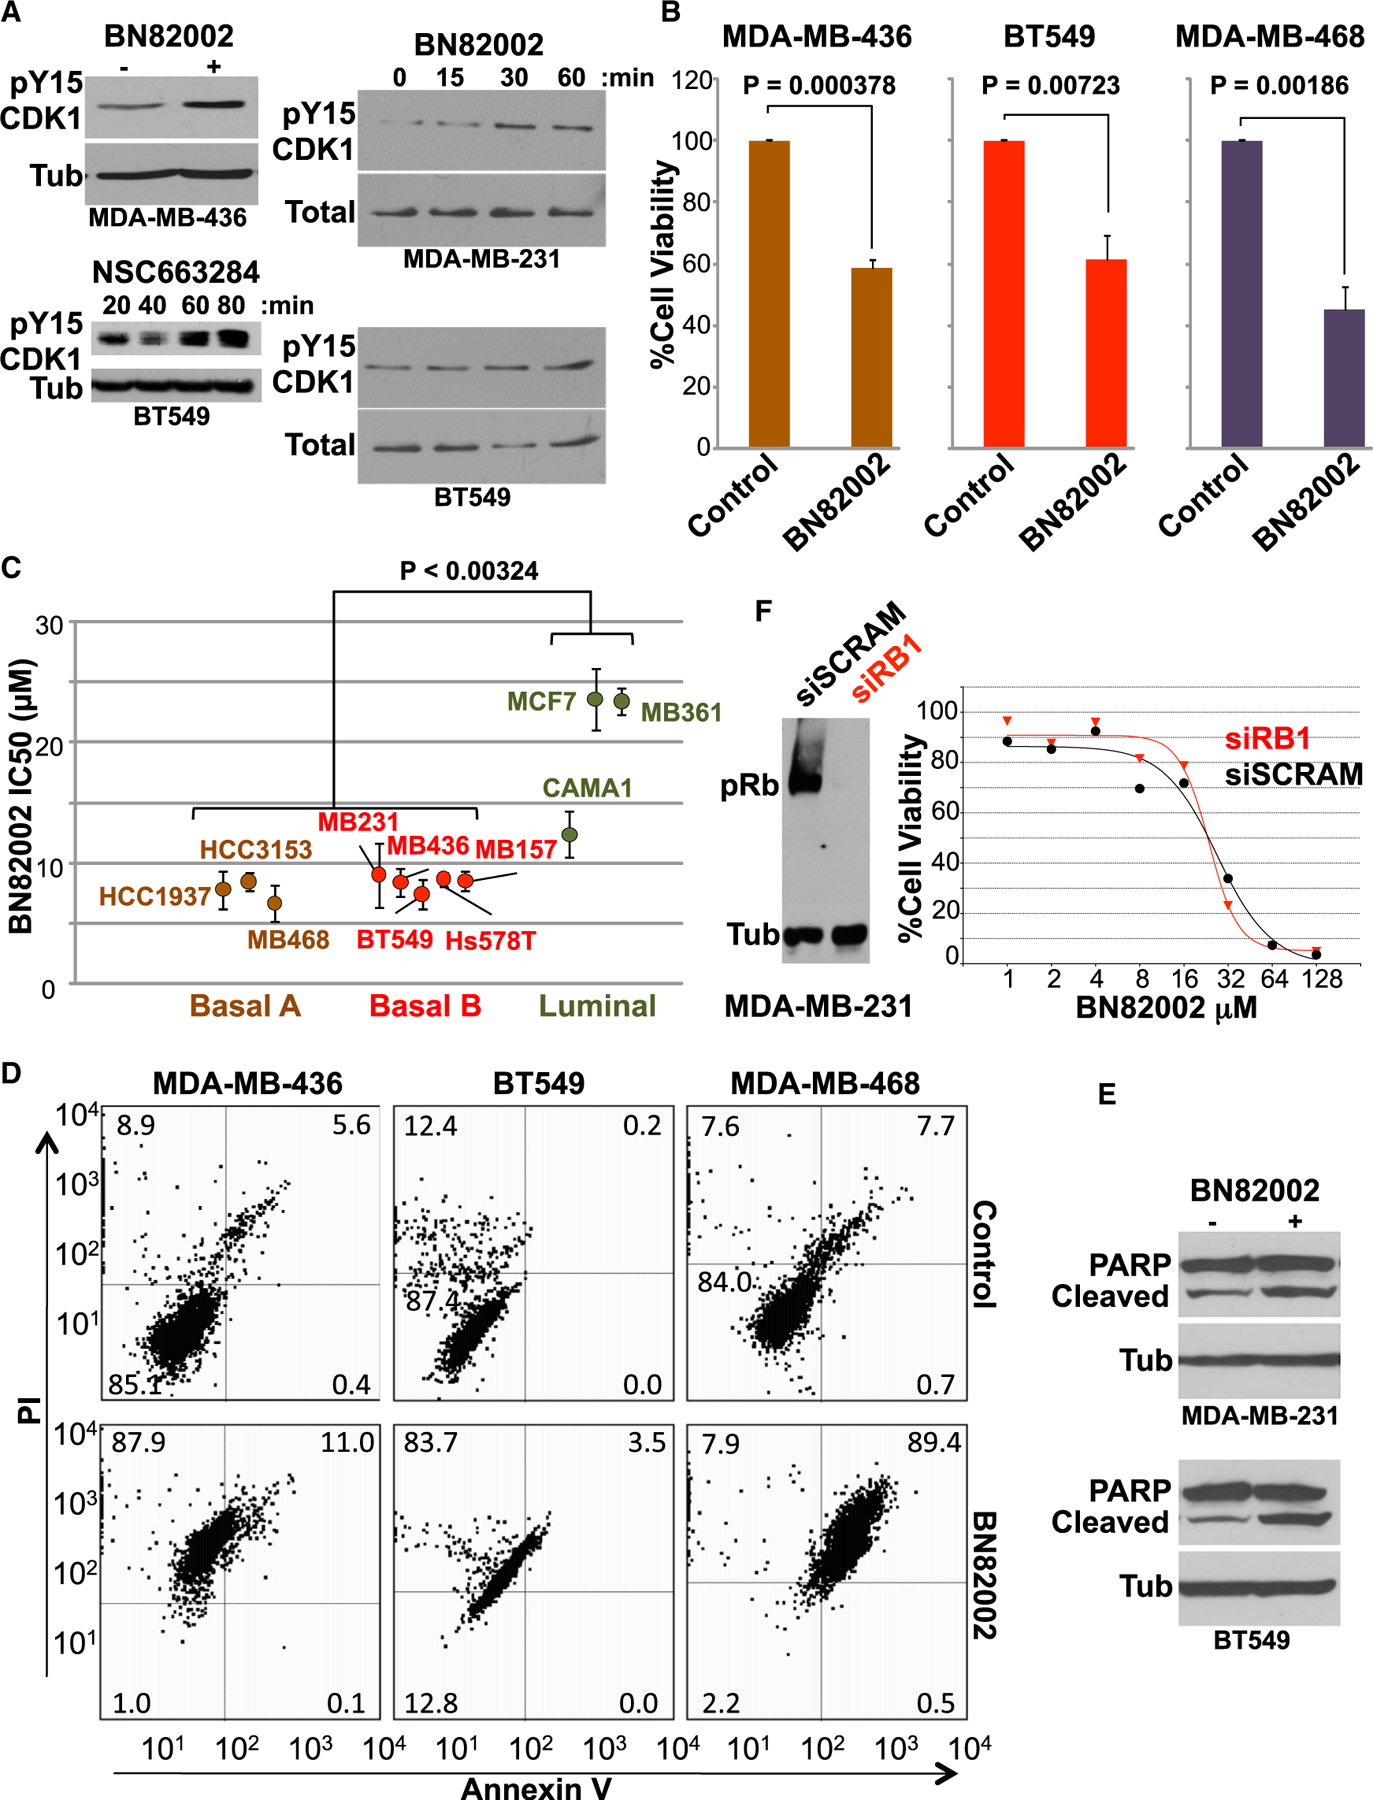
(A) Induction of CDK1 Tyr15 phosphorylation by the CDC25 inhibitors BN82002 and NSC663284. Indicated human TNBC cells were treated with inhibitors for 60 min or indicated time periods and were immunoblotted with anti-pY15 CDK1 antibody. Antibodies for tubulin or total CDK1 served as loading controls.
(B) Significant inhibition of RB1-deficient TNBC (BT549, MDA-MB-436, and MDA-MB-468) cell proliferation by BN82002 (10 μM). Average and SD were calculated from 5 independent experiments.
(C) IC50s ± SD of BN82002 in indicated luminal (CAMA1, MCF7, and MDA-MB-361), basal A (basal-like; HCC3153, MDA-MB-468, and HCC1937), and basal B (claudin-low; BT549, Hs578T, MDA-MB-157, MDA-MB-231, and MDA-MB-436) BC lines. The p value denotes one-way ANOVA with Tukey post hoc.
(D) Induction of apoptosis by CDC25 inhibitors in TNBC cells. Levels of apoptosis were determined by flow cytometry of annexin V- and PI-stained TNBC cells (BT549, MDA-MB-436, and MDA-MB-468) after BN82002 (10 μM) treatment.
(E) Induction of PARP cleavage 24 hr post-CDC25 inhibition in indicated TNBC cells.
(F) Left: efficient RB1 knockdown in MDA-MB-231 cells. Cells were transfected with RB1-specific or scrambled RNAi and analyzed for pRb expression 3 days later. Right: knockdown of RB1 via RNAi does not reduce sensitivity of MDA-MB-231 cells to BN82002.
The three TNBC lines, MDA-MB-436, BT549, and MDA-MB-468, which were resistant to combined CDK4/6 plus CDK2 inhibitors (Figure S1), showed high and significant sensitivity to BN82002 (Figure 3B). Furthermore, multiple basal-like (basal A) and claudin-low (basal B) BC cells exhibited a lower IC50 for BN82002 (⩽8.7 μM) compared with luminal BC lines (CAMA1, MDA-MB-361, and MCF7; >12 μM; p < 0.00324; Figure 3C). To determine whether growth inhibition was cytostatic or cytotoxic, treated cells were subjected to annexin V/propidium iodide (PI) staining. All lines showed significant loss of viability upon BN82002 treatment (Figure 3D, bottom left quadrant). In MDA-MB-468 cells, growth inhibition was accompanied by apoptosis as defined by an increased annexin V/PI population (89.4%) relative to untreated cells (7.7%). In contrast, MDA-MB-436 and BT549 cells exhibited an increase in the PI-positive necrotic tumor population, not annexin-V-positive cells. Anti-CDC25 treatment of BT549 and MDA-MB-231 cells also induced cleavage of PARP, a marker for caspase-dependent apoptosis (Figure 3E). Thus, CDC25 inhibition led to cytotoxic, not cytostatic, effect in all TNBC lines tested.
We next examined the effect of RB1 status on the response to BN82002 in isogenic MDA-MD-231 cells in which endogenous RB1 was transiently knocked down via RNAi (Figure 3F). MDA-MB-231 cells treated with RB1 RNAi or control scrambled RNA were then exposed to various doses of BN82002, and effect on growth was assessed by MTT assay. The control and RB1 knocked-out MDA-MB-231 cells exhibited similar dose responses (Figure 3F), thus demonstrating that CDC25 inhibition is effective in both RB1-proficient and -deficient TNBCs.
CDC25A and CDC25B Expression Correlates with TNBC-Related Oncogenic Signaling, and Poor Clinical Outcome
Although expression of CDC25 enzymes in BC has been investigated (Santamaría et al., 2007), the effect of specific oncogenic alterations on their expression and the impact on clinical outcome are not defined. Here, we correlated CDC25 gene expression with RB1, PTEN, and TP53 status as well as the status of other oncogenic signaling calculated on the basis of microarray data from 1,302 BC samples (Dvinge et al., 2013; Viré et al., 2014). An RB1-loss signature was based on the median expression values of 20 genes that are induced in response to RB1 loss in different contexts (Herschkowitz et al., 2008). Probability activity for ER, HER2, MYC, TP53, PI3K, RAS, and transforming growth factor b (TGF-b) pathways was evaluated using mRNA expression data as defined by Gatza et al. (2010), and the status of PTEN, GATA3, and cyclin D1 was inferred from their expression.
CDC25 mRNA levels positively correlated with increased activity of the RB1-loss signature, loss of TP53 activity signature, or reduced PTEN mRNA expression, the latter of which can be used as a surrogate for PTEN loss (Figure 4A) (Wang et al., 2017). CDC25 expression also increased with elevated PI3K and MYC activity signatures, and slightly with RAS signaling, all major markers of TNBC. Conversely, CDC25 expression diminished in tumors with high signatures or markers for HER2+ and ER+ subtypes (HER2 and ER signatures; GATA3 and CyclinD1 expression). These results are in accordance with established effects of TP53, RB/E2F, and PTEN, as well as MYC on CDC25 gene expression (Dalvai et al., 2011; Vigo et al., 1999; Guo et al., 2013; Galaktionov et al., 1996).
Figure 4. Expression of CDC25 Genes in Different BC Subtypes, Correlation with Various Oncogenic Alterations, and Impact on Clinical Outcome in Breast Cancer.
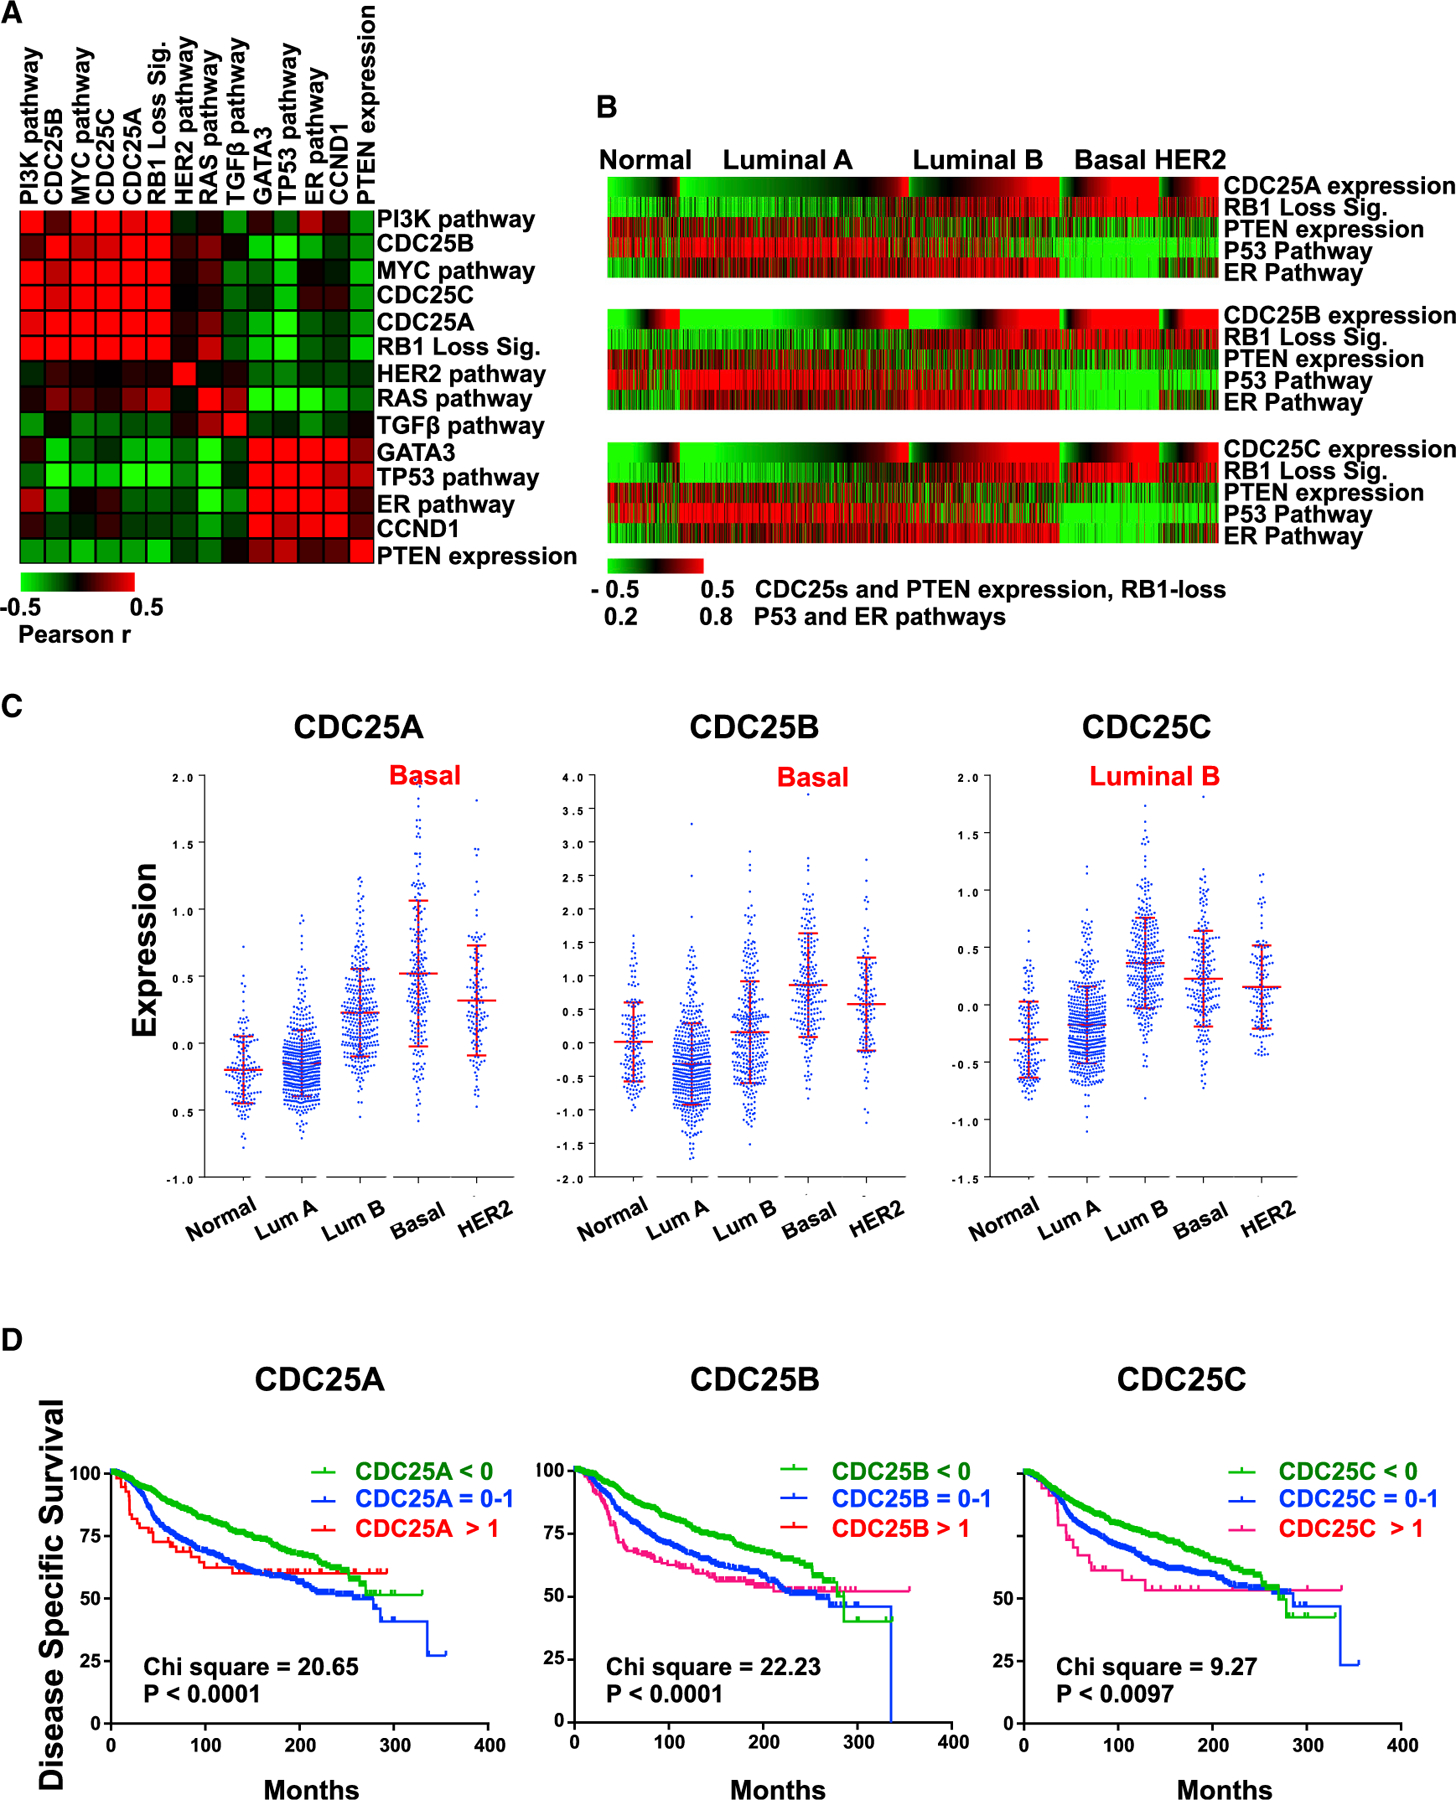
(A) Pairwise correlation analysis comparing CDC25 expression with indicated levels of oncogenes and tumor suppressors estimated by signatures, pathway activities, or gene expression in 1,302 BC samples using European Genome-phenome Archive: EGAD0010000434 (EGA; http://www.ebi.ac.uk/ega/). Results are organized by hierarchical clustering using Pearson correlations. Heatmap indicates the correlation coefficient values: red indicates positive correlation, and green indicates negative correlation.
(B) Correlation of CDC25 expression and tumor suppressor gene status in each BC subtype. The 1,302 BCs grouped by subtypes were ordered with CDC25A, CDC25B, and CDC25C expression values from low to high in each subtype. In all subtypes, expression of the three CDC25 genes correlates with loss of RB1, PTEN, TP53, and ER (positively with RB1 loss; negatively with PTEN expression, TP53, and ER pathway activity). For statistical analysis, see Figure S4.
(C) Expression distribution of CDC25A, CDC25B, and CDC25C in different BC subtypes. Highest expression of CDC25A and CDC25B was in basal-like BC; highest CDC25C expression was in luminal B. Error bars indicate mean ± SD; p < 0.0001 by ANOVA.
(D) Kaplan-Meier analysis of the 1,302 BC patients in correlation with CDC25A, CDC25B, and CDC25C expression; low, <0; medium, 0–1; high, >1. Indicated chi-square and p values were calculated using log-rank (Mantel-Cox) analysis.
See also Figure S4.
To determine which BC subtypes exhibit increased CDC25 expression in response to disruption of RB1, PTEN, and TP53, we classified the tumors and performed a correlation analysis on each subtype. ER signaling was used as a control for luminal tumors. Expression of CDC25 genes most significantly correlated with RB1, TP53, and PTEN loss in TNBC (Figure 4B; for a statistical analysis, see Figure S4). We next determined the subtypes in which CDC25 genes are highly expressed. Interestingly, expression of CDC25A and CDC25B was most elevated in basal-like BC, whereas highest CDC25C expression was detected in luminal B (Figure 4C).
We next tested for the impact of CDC25 expression on disease-specific survival, available with this database of 1,302 BC samples. High expression of CDC25A and CDC25B (p < 0.0001) and CDC25C (p = 0.0097) correlated with poor clinical outcome (Figure 4D). Expression of these genes did not impact survival within basal-like samples (data not shown), suggesting that they serve as surrogates for basal-like or luminal B subtypes, respectively, both of which show a poor prognosis. Alternatively, TNBCs that do not express CDC25 to a high level may acquire other, equally potent, mechanisms to promote cell growth. Together, these results indicate that high CDC25A and CDC25B expression correlates with the loss of RB1, PTEN, and TP53 in basal-like BC; is elevated in this subtype; and identifies patients with poor survival.
Knockdown of CDC25A Plus CDC25B Mimics the Effects of CDC25 Antagonists
As drugs often have off-target effects, we asked whether specific knockdown of CDC25A and CDC25B via RNAi recapitulated the effect of CDC25 inhibitory drugs on cell growth and survival. By western blot analysis, we observed higher expression of CDC25B than CDC25A in BT549 cells, and a combined knockdown of both genes induced an accumulation of phospho-Y15 CDK1 (Figure 5A). As with BN82002, a nearly complete loss of cell viability was observed following RNAi-based targeting of both CDC25s (Figures 5B and 5C). Moreover, like BN82002, knockdown of CDC25A plus CDC25B induced, primarily, apoptosis (annexin V+) in MDA-MB-468 cells but substantial necrosis in BT549 cells (Figure 5D versus 3D). Thus, the effect of BN82002 is likely on target, and TNBC cells that are refractory to CDK4/6-plus-CDK2 combination therapy are specifically sensitive to CDC25 inhibition.
Figure 5. Knockdown of CDC25A Plus CDC25B Suppresses Growth of RB1-Deficient TNBC Cells In Vitro.
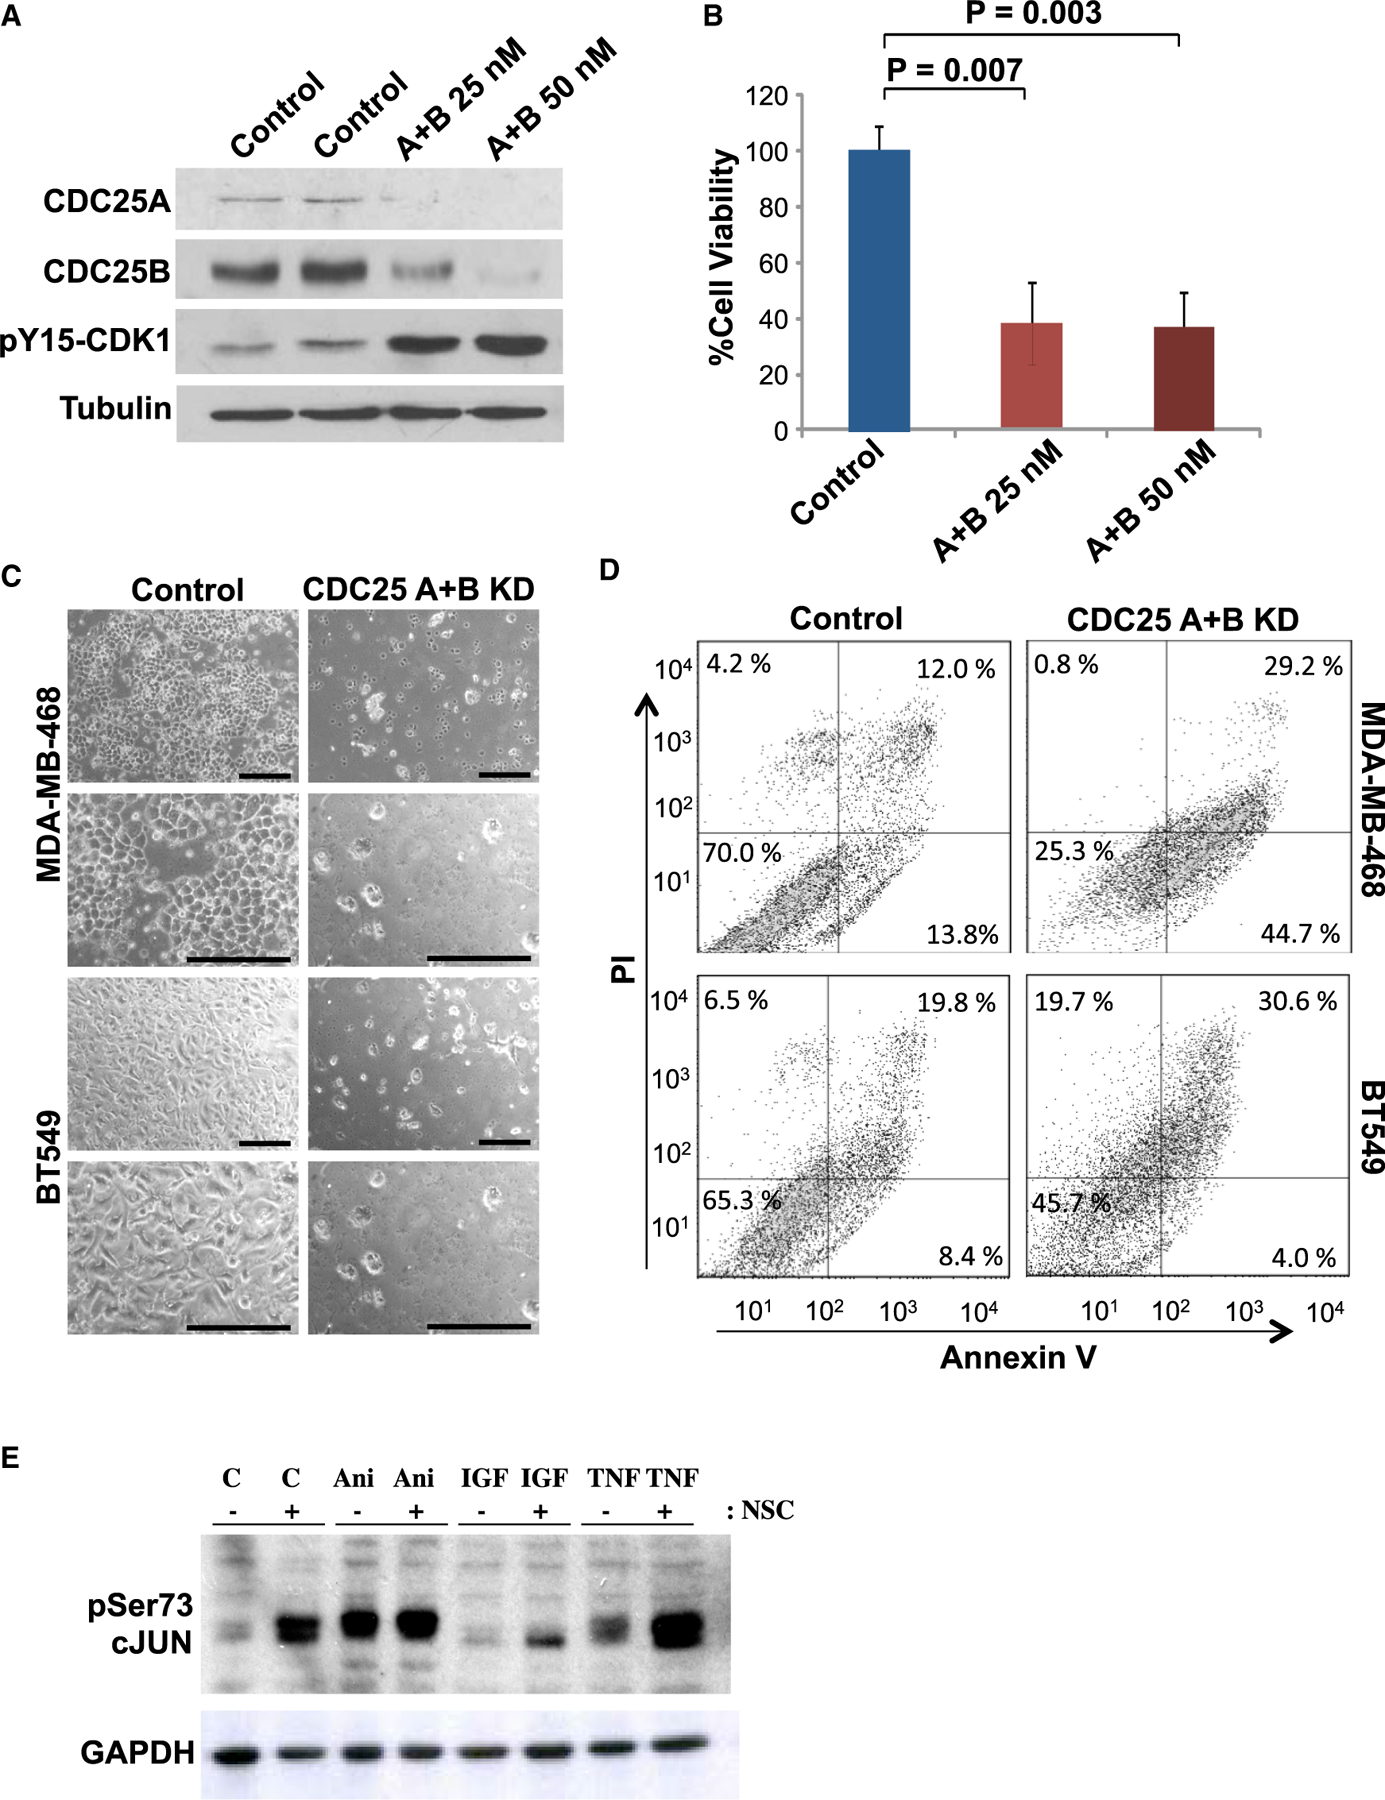
(A) BT549 cells were transfected with scrambled RNAi control or CDC25A plus CDC25B RNAi, at concentrations of 25 or 50 nM, and 3 days later were analyzed for CDC25A, CDC25B, and p-CDK1 expression by immunoblotting. Tubulin served as loading control.
(B) BT549 cells transfected as described above were analyzed for growth by MTT assay. Error bars indicate SD; p values calculated by 2 tailed Student’s t test.
(C) Representative images of MDA-MB-468 and BT549 cells following double transfection with 25 nM control or CDC25A plus CDC25B RNAi. Scale bars, 20 μM.
(D) Representative flow cytometry analysis of annexin V/PI-stained MDA-MB-468 and BT549 cells co-transfected with CDC25A and CDC25B RNAi at a concentration of 25 nM each.
(E) Induction of Ser73-c-JUN phosphorylation 24 hr post-treatment with CDC25 inhibitors. MDA-MB-231 cells were treated with DMSO or 4 μM NSC663284 for 24 hr and then were exposed to anisomycin (Ani; 3 μg/mL) for 30 min or to IGF1 (IGF; 50 ng/mL) or TNF-α (TNF; 100 ng/mL) for 15 min and immunoblotted for Ser73-c-JUN. GAPDH served as loading control.
Long-Term CDC25 Inhibition Induces Phosphorylation of c-Jun
Inhibition of CDC25—and, thereby, pCDK1—leads to cell-cycle arrest in normal cells. However, as shown earlier, in TNBC cells, both pharmacological and genetic inhibition of CDC25 led to massive cell death. CDC25 was implicated either directly or indirectly in cell survival through several mechanisms, including dephosphorylation and suppression of Apoptosis Signal-regulating Kinase 1 (ASK1), also known as Mitogen-Activated Protein Kinase Kinase Kinase 5 (MAP3K5) (Cho et al., 2015; Zou et al., 2001). Activated ASK1, in turn, induces cell demise by inducing the phosphorylation of several targets, including SAPK, JNK, and JUN (Tibbles and Woodgett, 1999). In short-term (1-hr) assays, CDC25 inhibition did not induce detectable phosphorylation of any of these downstream factors (data not shown). However, after 24-hr treatment, levels of Ser73-c-JUN were strongly elevated in un-stimulated cells as well as in cells exposed for a short period of time to the stress-inducing agents anisomycin, insulin growth factor (IGF)1, or tumor necrosis factor α (TNF-α) (Hazzalin et al., 1998; Liu et al., 2000) (Figure 5E; see Discussion).
Synergistic Effects of CDC25 with WEE1 Inhibitors, but Not with CDK4/6, CDC2, or CDK1 Antagonists
We next sought to determine whether CDC25 inhibition synergizes with other inhibitors of cell-cycle progression. Using MTT assays and annexin V/PI flow cytometry, no synergy was found between CDC25 and CDK4/6 inhibitors or between CDC25 and CDK2 inhibitors (Figures S5 and S6).
The WEE1 kinase phosphorylates and inactivates CDK1 on the same sites (Y15) where it is dephosphorylated by CDC25 (Figure S7A), and WEE1 inhibitors are currently assessed in several clinical trials. Using RB1+ (MDA-MB-231) and RB1− (BT549) TNBC cells, we consistently found a strong synergy between the two CDC25 inhibitors (BN82002 and NSC663284) and the WEE1 inhibitor MK-1775 (AZD1775) within the linear range of drug inhibition (Figures 6A–6C; Figures S7B–S7D). In contrast, the CDC25 antagonists showed either additive or antagonistic effects with the CDK1 inhibitor RO3306. These results suggest that CDC25 acts upstream of CDK1 but exerts its pro-apoptotic effect through a different pathway than WEE1. Consistent with this notion, CDC25 and WEE1 inhibitors had different effects on cell-cycle progression in TNBC cells: CDC25 inhibition had no overt effect, whereas WEE1 inhibition enriched for cells in S phase (Figures 6D and 6E).
Figure 6. Synergy Between CDC25 Inhibitors and a WEE1 Inhibitor In Vitro and with the Mitochondrial Protein Translation Inhibitor, Tigecycline, In Vivo.
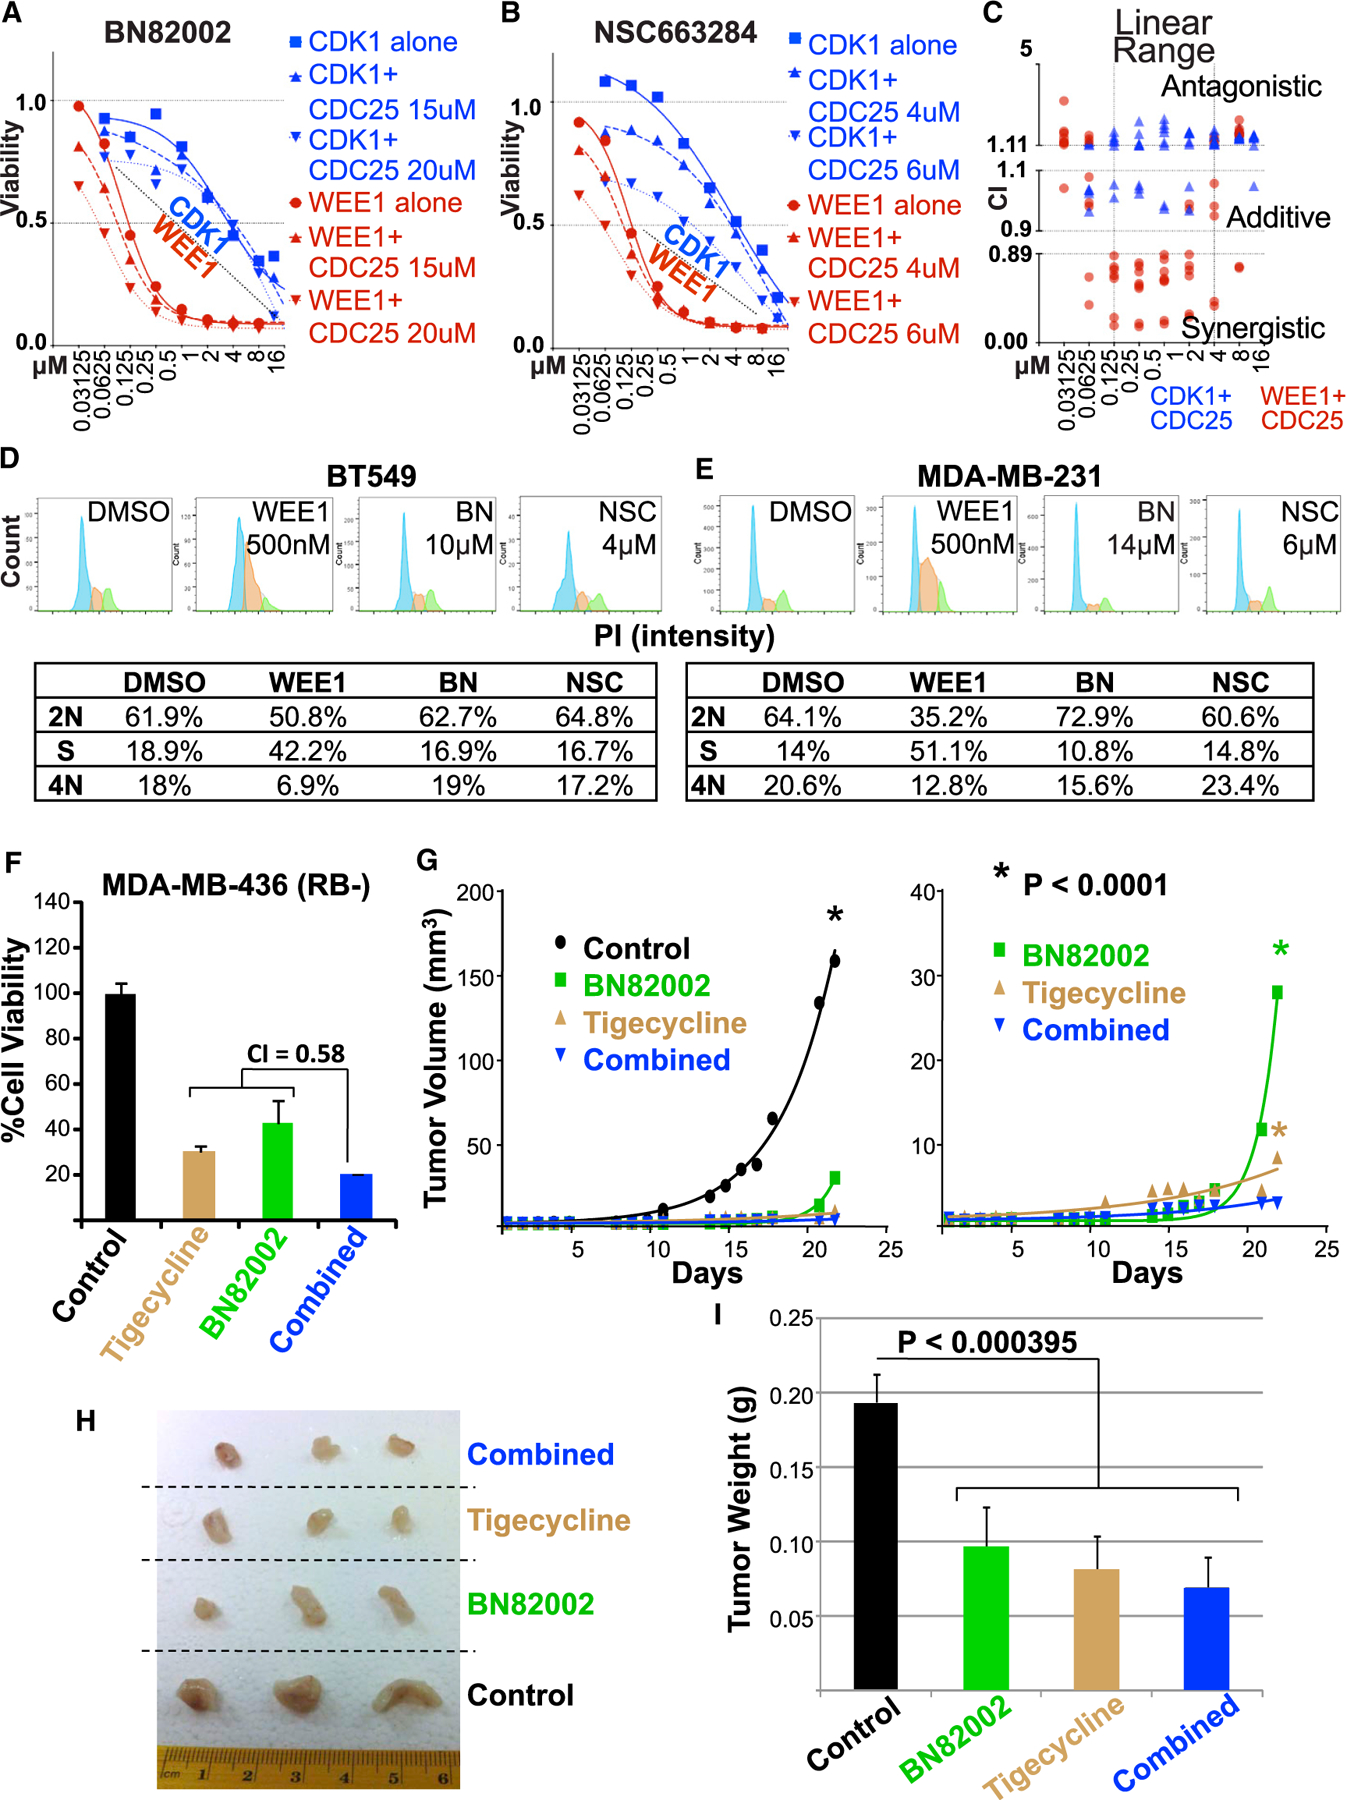
(A and B) Combined CDC25 inhibitors (A) BN82002 or (B) NSC663284) plus CDK1 inhibitor (RO3306) show additive/antagonistic effects, whereas CDC25 plus the WEE1 inhibitor (MK-1775) are mostly synergistic in BT549 TNBC cells. Similar results obtained with MDA-MB-231 cells are shown in Figures S7B and S7C.
(C) Combination index calculated by CompuSyn software for the two CDC25 inhibitors plus CDK1 (blue) or the WEE1 (red) inhibitors in BT549 and MDA-MB-231.
See Figure S7D for details of each inhibitor and cell line.
CDC25 Inhibition Synergizes with PI3K to Suppress Growth of Multiple TNBC Lines In Vitro and Attenuate Xenograft Growth In Vivo
For CDC25-based precision medicine, it would be important to identify the US Food and Drug Administration (FDA)-approved drugs that can synergize with CDC25 inhibitors. Therefore, we investigated whether BN82002 would synergize with FDA-approved inhibitors of RB1 or PTEN deficiency. For RB1 loss, we used tigecycline, the antibiotic and inhibitor of mitochondrial protein translation, recently shown to preferentially kill RB1/TP53-deficient TNBC (Jones et al., 2016). While each of these drugs alone effectively suppressed TNBC growth, we observed synergy only in MDA-MB-436, an additive effect in MDA-MB-468, and an antagonistic effect in BT549 cells (Figure 6F; Figure S8). To assess the effect of these drugs in vivo, we engrafted MDA-MB-436 cells into the mammary glands of immune-compromised NSG mice. When tumors became palpable, mice were randomized and injected with vehicle alone, BN82002, tigecycline, or both drugs. BN82002 strongly inhibited the kinetic of growth and final size/weight of the MDA-MB-468 TNBC xenografts (Figures 6G–6I). In combination with tigecycline, it had a small yet further significant effect on tumor suppression.
As PTEN is often lost in TNBC, we also tested for synergy between BN82002 and PI3K inhibitors. This analysis was also motivated by our observation that long-term (24-hr) treatment with CDC25 inhibitors induced the expression of phospho-Ser473-PKB/AKT in MDA-MB-231 cells (Figure 7A), possibly the results of feedback regulation that prolongs survival. pSer473-PKB/AKT in the PTEN mutant BT548 was constitutively high (data not shown). Using the dual PI3K/mTOR inhibitor NVP-BEZ235 (Liu et al., 2009), we observed robust synergy with BN82002 in four BC lines, MDA-MB-231, MDA-MB-156, BT549, and MDA-MB-468, and an additive effect in MDA-MB-436 (Figure 7B). In a side-by-side comparison with two other PI3K inhibitors, BEZ235 exhibited the highest synergy with BN82002 (CI = 0.23), the pan PI3K p110α/β/δ/γ inhibitor BKM120 also synergized effectively (CI=0.52), whereas the p110 α PI3K-specific inhibitor BYL719 showed moderate synergy (CI = 0.75; Figure 7C). Importantly, BN82002 treatment alone exerted strong inhibition of BT549 xenograft growth in immune-compromised mice (p = 0.0027 versus control; Figure 7D). Inhibition was further increased in the combination arm with BEZ235 (p < 0.0001 versus control; p = 0.002 versus BN82002). Together, these results show that CDC25 blockade alone can suppress the progression of aggressive TNBCs in vivo, as well as synergize with other drugs to effectively inhibit xenograft growth.
Figure 7. CDC25 Inhibition Synergizes with PI3K Inhibitors to Suppress Diverse TNBCs.
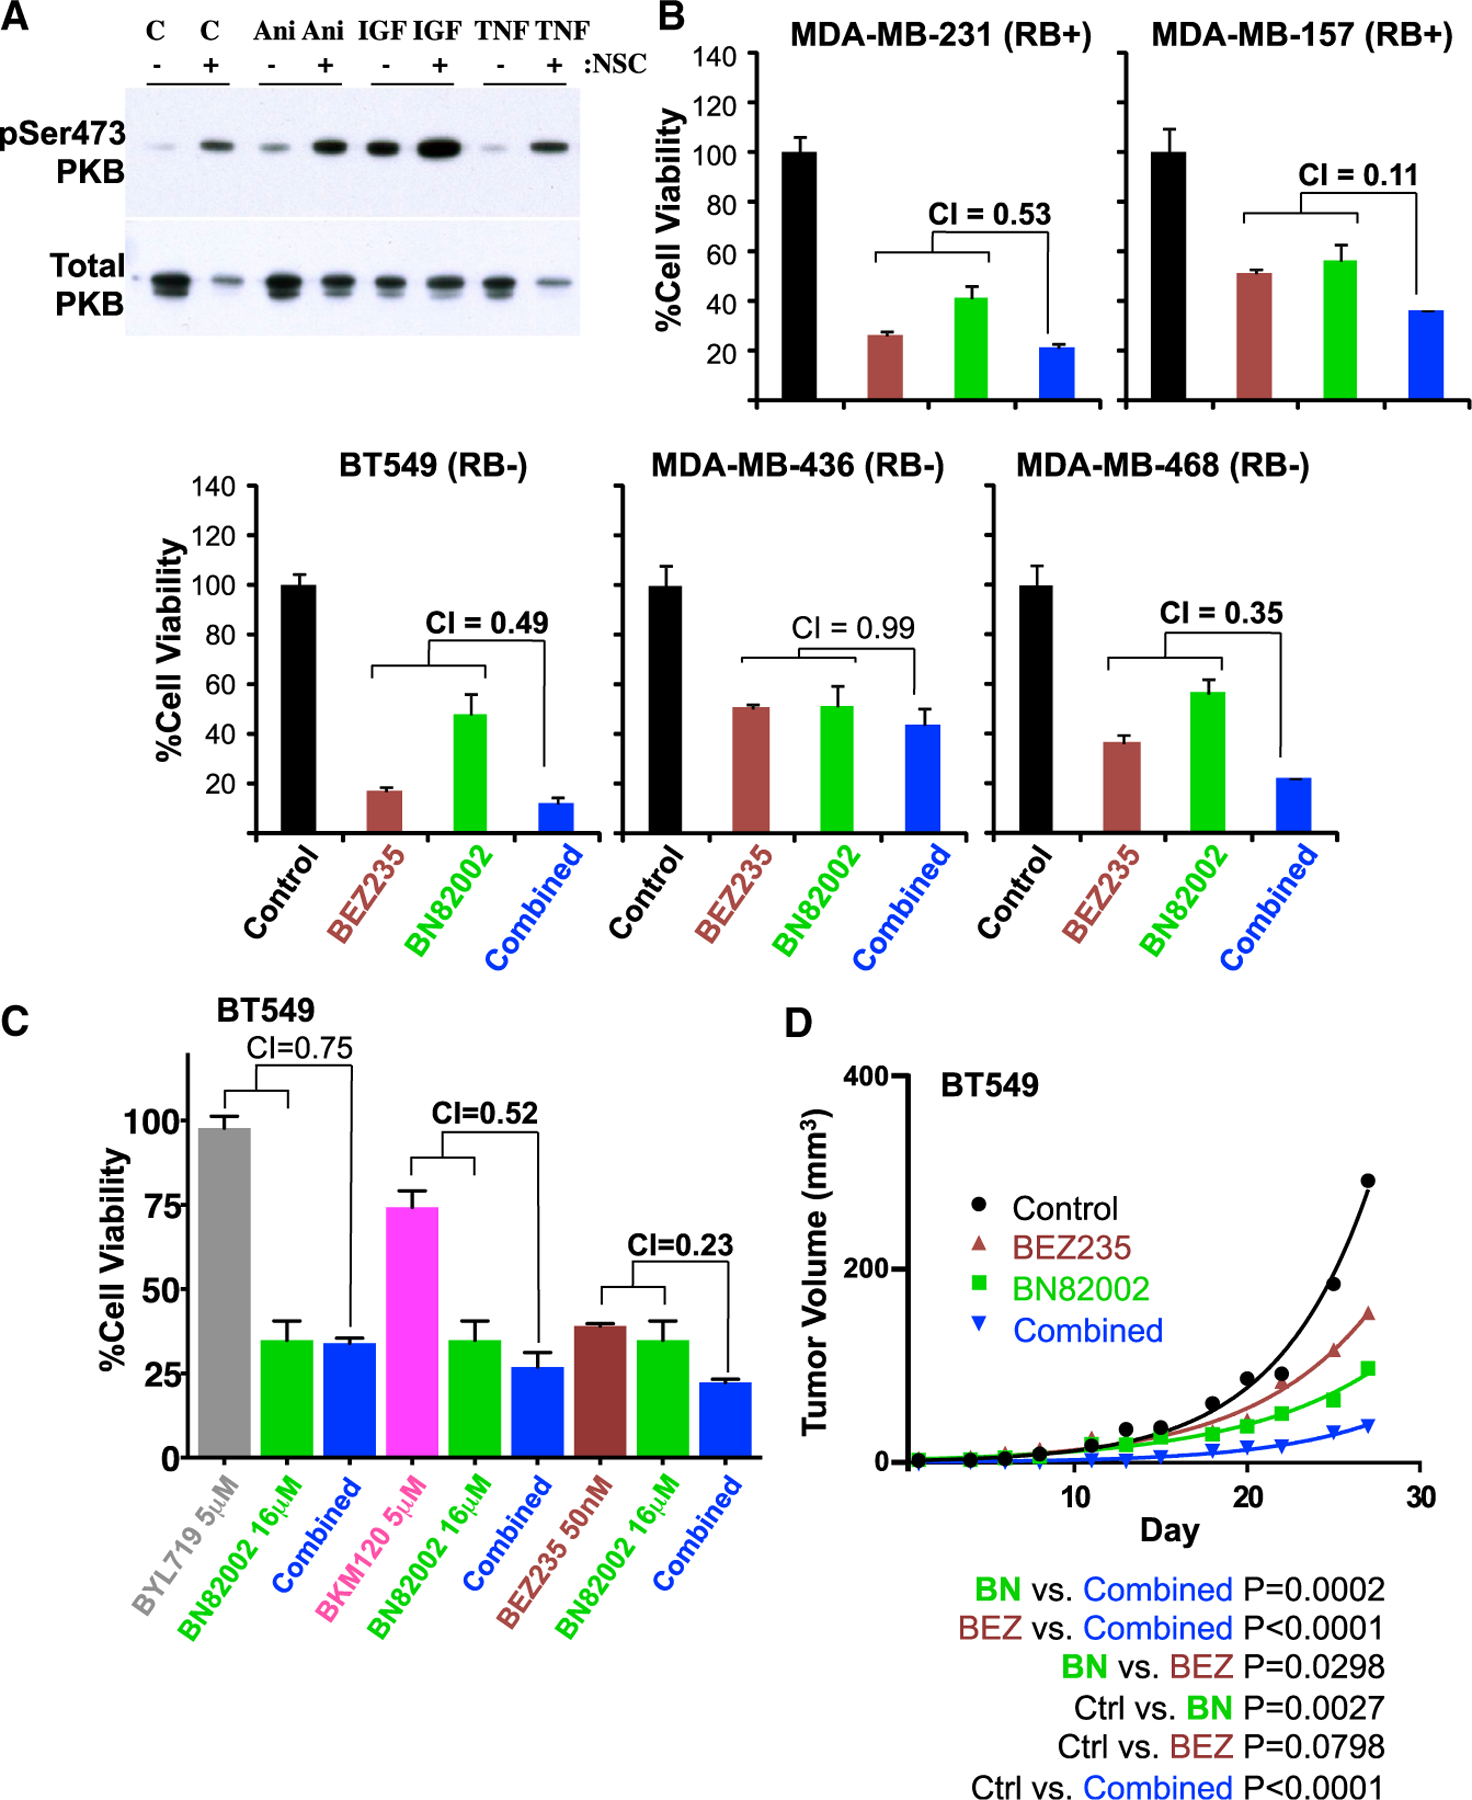
(A) Induction of Ser473-PKB/AKT phosphorylation 24 hr post-CDC25 inhibition. MDA-MB-231 cells were treated with DMSO or 4 μM NSC663284 for 24 hr and then exposed to anisomycin (Ani; 3 μg/mL) for 30 min, and to IGF1 (IGF; 50 ng/mL) or TNF-α (TNF; 100 ng/mL) for 15 min, and immunoblotted with phospho-Ser473-PKB/AKT. Total PKB/AKT is shown below.
(B) Response of indicated TNBC cell lines to BN82002 (10 μM) alone or in combination with BEZ235 (Dactolisib; 0.3 μM). Synergy between the two compounds was assessed by combination index (CI) using Compusyn software.
(C) Cell viability of BT549 cells treated with the CDC25 inhibitor, BN82002, and 3 different PI3K inhibitors: BYL719, BMK120, or BEZ235.
(D) Effect of the CDC25 inhibitor, BN82002, and the PI3K/mTOR inhibitor BEZ235 on TNBC xenograft growth. NSG mice were injected in the inguinal fat pad with BT549 cells (1 × 10⁶) in Matrigel. Once palpable tumors formed, mice were injected i.p. 3 times per week for 27 days with DMSO or with 15 mg/kg BN82002, 5 mg/kg BEZ235, or both. Tumors were measured on each day of treatment. Control, n = 4; BN82002, n = 4; BEZ235, n = 4; and BN82002 and BEZ235 combined, n = 3 mice. Differences between groups (p value) were calculated by nonlinear regression using GraphPad PRISM 6.
(D and E) Cell-cycle profiles of (D) BT549 (RB1−) and (E) MDA-MB-231 (RB1+) cells treated with DMSO (vehicle control) or indicated concentrations of WEE1 inhibitor (MK-1775) or CDC25 inhibitors (BN82002 or NSC663284) using PI staining and flow cytometry analysis. The percentage of cells in each phase is indicated, excluding cells with <2N or >4N DNA.
(F) Response of RB1− TNBC MDA-MB-436 cells to treatment with BN82002 (10 μM) alone or in combination with tigecycline (10 μM). Error bars indicate SD. Level of synergy between the two compounds was assessed by combination index (CI), using CompuSyn software. A similar analysis of BT549 and MDA-MB-468 cells showing lack of synergy is depicted in Figure S8.
(G) Left: drug-response curves for RB1-deficient MDA-MB-436 tumor xenografts untreated or treated with BN82002 and/or tigecycline. Tumor cells were injected orthotopically, and once palpable tumors were formed, mice (n = 6 per group) were injected 3 times per week for 21 days with DMSO (vehicle) or with 15 mg/kg BN82002, 50 mg/kg tigecycline or both. Right: the control graph for the untreated mice was removed to better highlight differences between the treated groups.
*p < 0.0001, by non-linear regression (GraphPad Prism 5.0).
(H) Appearance of 3 representative tumors of each group from (G).
(I) Significant reduction of final tumor weight in treatment groups compared to control. Error bars indicate SD. The p value was calculated by ANOVA.
See also Figures S7 and S8.
DISCUSSION
The critical role played by RB1 in TNBC and metastatic BC has prompted worldwide efforts to identify mechanisms to target its loss, which is not directly druggable. Here, we used focused kinase/phosphatase screens to identify agents that can suppress divergent types of TNBC cells with specific loss of RB1/TP53, PTEN/P53, or all three tumor suppressors. We report on the identification of the dual-specificity protein phosphatase CDC25 as a potent target for subduing these diverse TNBCs. Thus, despite an insensitivity to G1 inhibitors, most TNBCs maintain intact CDC25 checkpoints and are vulnerable to CDC25 antagonists. An antagonist of CHK1, an upstream regulator of CDC25, was also identified in our screens as a potent inhibitor of human TNBC, though not mouse Rb/p53 and Pten/p53 tumors. In addition, an inhibitor of WEE1, which antagonizes CDC25 by phosphorylating Y15-CDK1, potently inhibited both RB1-negative and -positive TNBCs and further synergized with CDC25 inhibitors to kill tumor cells. The robust synergy between CDC25 and WEE1 inhibitors should prompt a search for additional combinations between CDC25 antagonists and upstream regulators like ATM and CHK1 or downstream targets such as Aurora and polo-like kinases, the latter of which have already been implicated in TNBC (Dominguez-Brauer et al., 2015). In particular, while this paper was under consideration, the Witkiewicz and Knudsen group has shown that CHK1 suppression is synthetically lethal with RB1 loss in TNBC cells (Witkiewicz et al., 2018). Whether inhibition of CDC25 plus CHK1 is as synergistic as CDC25 plus WEE1 is yet to be determined.
We show that CDC25A and CDC25B have an elevated expression in TNBC and are bad prognostic indicators for BC patients. This is, at least in part, because these phosphatases serve as surrogates for TNBCs, which have poor clinical outcomes. However, high expression or activity of these genes may also underlie high cell proliferation/survival of TNBC. We show that loss of TP53, RB1, and PTEN—as well as increased PI3K and MYC and, to a lesser degree, RAS signaling—correlate with high CDC25 expression, which likely increases dependency on CDC25 and responsiveness to its inhibition. As noted, TP53, RB1/E2F, PTEN, and MYC are known regulators of CDC25 expression. As these tumor suppressors/oncogenes are major drivers of TNBC, our observations further point to CDC25 as a major target for therapy for these aggressive tumors. These phosphatases are also regulated post-transcriptionally and post-translationally by various factors such as CHK1 and F-box proteins β-TrCP1 and β-TrCP2 (Busino et al., 2003), and they may respond to different cellular stresses such as hypoxia. Analysis of two recent databases with quantitative proteomic and absolute protein levels (Lawrence et al., 2015; Tyanova et al., 2016) shows an increase in CDC25C or CDC25B protein levels in TNBC versus luminal tumor cell lines. However, due to the small number of samples, the increase in CDC25C does not reach significance, whereas the increase in CDC25B in TNBC lines (n = 8) becomes significant only when one outlier from the luminal group (n = 7) is removed (data not shown). Additional analysis is required to correlate CDC25 levels and activities with tumor response to its inhibitors.
Clinical application of CDC25 inhibitors is challenged by difficulty in drugging these phosphatases and associated toxicity. Several additional CDC25 inhibitors have been described (Brezak et al., 2009; He et al., 2013), but no drug with clinical utility is currently available. Our results should encourage renewed efforts to use approaches such as large-scale screens for allosteric inhibitors that indirectly target the catalytic domain. Moreover, our findings suggest that drugs that preferentially inhibit CDC25B, with moderate inhibition of CDC25A and no effect on CDC25C, may be effective yet less toxic.
A complementary approach would be to use low doses of CDC25 inhibitors in combination with other drugs, as used herein. We found no synergy between CDC25 and CDC4/6, CDK2, or CDK1 inhibitors. However, CDC4/6 inhibition has both cell-autonomous and non-cell-autonomous effects, the latter of which involve the promotion of anti-tumor immunity by suppressing the proliferation of regulatory T cells (Goel et al., 2017). Thus, despite the lack of cooperation between CDC25 and CDK4/6 inhibitors in cultured cells, it would be of interest to test the combined effect of these drugs in immune-competent models of TNBC.
Only one TNBC line (of 5) showed synergy with tigecycline. This is unfortunate, given a recent observation that tigecycline effectively cooperates with imatinib to inhibit chronic myeloid leukemia stem cells and diminish tumorigenesis (Kuntz et al., 2017). However, in solid tumors (such as BC), we found that the cytostatic effects of tigecycline antagonized other drugs, such as doxorubicin (Jones et al., 2016), and here, it antagonized or failed to synergize with BN82002 in most TNBC lines.
In contrast to the aforementioned combinations, we found a high degree of synergism between CDC25 and PI3K inhibitors, both in vitro and in vivo. As CDC25 inhibition induced phopho-Ser473-PKB/AKT, CDC25-plus-PI3K combination therapy may not be limited to TNBC with alterations in the PI3K/PTEN pathway. Indeed, we showed that CDC25 and PI3K inhibitors synergized to effectively kill diverse TNBCs with and without mutations along the PI3K/PTEN pathway. How AKT/PKB is induced following long-term treatment of TNBC cells with CDC25 inhibitors is yet to be established.
CDC25 suppression induced cell demise, which was not associated with cell-cycle arrest in any specific phase, suggesting that death occurs at multiple stages of the cell cycle. This is in contrast to the effect of WEE1 inhibition, which led to the accumulation of cells in the S phase at the expense of G1 and G2/M. Thus, while these factors have opposing effects on CDK phosphorylation they have additional and unique pro-survival targets. How does inhibition of CDC25 promote apoptosis in TNBC cells? CDC25 was shown to suppress the stress response kinase ASK1, which affects the phosphorylation of SAPK, JNK, and downstream c-JUN (Cho et al., 2015; Tibbles and Woodgett, 1999; Zou et al., 2001). We found that CDC25 inhibition induced Ser73-c-Jun phosphorylation 24 hr post-treatment. This late induction may be a direct effect of ASK1 but may also be caused by an indirect feedback mechanism that sustains survival in the face of pro-apoptotic signals induced by CDC25 inhibition. Detection of ASK1 and phosphorylated ASK1 is notoriously difficult. It would be important to assess the level/activity of this kinase; the effects of blocking ASK1, JNK, or c-JUN on survival of cells exposed to CDC25 inhibitors; and whether this pathway is linked to hypoxia or other stress responses in TNBC. Further analysis of this pathway may uncover biological markers for efficacy of anti-CDC25 therapy or venues to potentiate the effect of CDC25 inhibitors.
Although we focused our analysis on TNBC, CDC25 inhibition may prove effective against other types of malignancies in which RB1 and/or PTEN plus TP53 are frequently inactivated, including retinoblastoma, serous cervical cancer, and pancreatic and lung cancers, as well as against recurrent metastatic disease where these tumor suppressor genes are often lost. CDC25-dependent checkpoint transitions may be particularly effective in tumors in which the G1/S checkpoint has been compromised by RB1 loss. We also show that combined inhibition of CDC25 plus PI3K effectively suppressed growth of TNBC cells in culture and in xenograft assays in vivo. We envision that improved CDC25 inhibitors would also be highly efficacious in combination therapy regimens together with inhibitors against specific oncogenic alterations in each individual TNBC patient, similar to the emerging clinical utility of CDK4/6 inhibitors in combination with endocrine or anti-HER2 therapies for RB1+ BC.
EXPERIMENTAL PROCEDURES
Mice
Animal protocols were approved by the University Health Network in accordance with the guidelines of the Canadian Council on Animal Care.
Tumor Classification
Microarray analysis with mouse tumor models was carried out using the Affymetrix Mouse Gene 1.0 ST with 500 ng total RNA isolated by double TRIzol extractions (Centre for Applied Genomics, Hospital for Sick Children, Toronto, ON, Canada). Microarray data were normalized using the robust multi-array average (RMA) method via Partek software, and log2-transformed gene expression values were obtained. Median-centered data from aforementioned mouse models were integrated with a reference BC dataset (GEO: GSE18229), which includes both human and mouse subtypes, including human normal, luminal A, luminal B, HER2, claudin-low, and basal-like tumors, using the DWD algorithm. Unsupervised hierarchical clustering (complete linkage) analysis of mouse tumor models was determined using the intrinsic genes (Herschkowitz et al., 2007) and the claudin-low signature (Prat et al., 2010). For side-by-side comparison of mouse models, several groups of genes (Proliferation, EMT, and Hypoxia) were median centered and visualized as heatmaps.
Focused Drug Screens
238 compounds targeting 154 different kinases and phosphatases were screened using a Biomek FX liquid handler equipped with a pin tool for automated compound dispensing. Assays were carried out in a 384-well format, using 300 cells per well. Compounds, resuspended in DMSO as 1-mM stock solutions, were added in a volume of 200 nL to a final concentration of 3 μM. As a reference for 100% activity, each plate included 32 wells with cells treated with vehicle only, and background was measured with media in the absence of cells. Assays were optimized for dynamic range (100% activity per background, >10), while variability was consistently found to be low (i.e., coefficient of variation [CV] < 10%). For IC50, cells were plated, at a concentration of 500 cells per well in 100 μL media, into 96-well plates and treated the next day with indicated compounds at increasing concentrations (1, 3, 10, 30, and 100 μM) for 3 days. Cell viability was measured by adding MTT to a final concentration of 1 mg/mL for 2 hr at 37°C, followed by a PBS wash and re-suspension in 100 μL DMSO overnight. Colorimetric reading at 570 nm was performed using a microplate reader (Molecular Devices). Specific drugs for validation/analysis were as follows: BN82002 (EMD Millipore, catalog #21691), NSC663284 (ApexBio, catalog #A8813), RO3306 (ApexBio, catalog #A8885), and MK-1775 (ApexBio, catalog #A5755).
Gene Expression, Signature and Pathway Activity, and Statistical Analysis
Gene expression of CDC25A, CDC25B, and CDC25C, as well CCND1, GATA3 and PTEN, were represented as the median center expression values of the mRNA microarray data from 1,302 BCs (Dvinge et al., 2013; Viré et al., 2014) that were downloaded from the European Genome-phenome Archive (European Genome-phenome Archive: EGAS00000000122 and EGAD00010000434 at https://www.ebi.ac.uk/ega/datasets/EGAD00010000434). RB1-loss signature was based on the median expression values of 20 RB1-loss genes (Herschkowitz et al., 2008; Jones et al., 2016). Probability activity of the ER, HER2, MYC, P53, PI3K, RAS, and TGF-β pathways was evaluated using the microarray data as described previously (Gatza et al., 2010). With Prism 6 Software (GraphPad Software, La Jolla, CA, USA), Pearson correlation was used to evaluate the associations between the expression of the CDC25 gene family and oncogene/tumor suppressor activities that were represented as pathway-activity/signature/gene-expression values of mRNA expression of transcripts and compared with each other. An ANOVA was used to determine statistical significance of CDC25 family expression among the different subtypes of the human BCs. A log-rank (Mantel-Cox) test was performed for Kaplan-Meier plots. A p value < 0.05 was considered as statistically significant.
Xenograft Model
Human MDA-MB-436 and BT549 (1 million cells per injection) tumor cells were resuspended in 20 μL media/Matrigel mixture (1:1) and injected into #4 mammary glands of non-obese diabetic/severe combined immunodeficiency (NOD/SCID) females (6 mice per group). BN82002 (15 mg/kg, dissolved in DMSO), tigecycline (50 mg/kg, dissolved in PBS), and BEZ235, as indicated, were administered intraperitoneally (i.p.). Control mice were injected with vehicle alone at the same weight/volume ratio.
Supplementary Material
Highlights.
CDC25 inhibitors target TNBCs that are refractory to CDK4/6 plus CDK2 inhibition
CDC25 mRNA levels are affected by RB1, PTEN, TP53, and MYC status in TNBC
CDC25 plus WEE1 or PI3K inhibitors synergize to effectively suppress growth of TNBCs
Provides a rational for development of CDC25-based therapy for TNBC
ACKNOWLEDGMENTS
We thank Emily Reddy, from the SickKids-UHN Flow Cytometry Facility, for assistance with cell-cycle analysis. This research was funded by grants from the Canadian Cancer Society and the Canadian Institute of Health Research to E.Z.; by a Terry Fox Research Institute Program grant to J.R.W., S.E.E., and E.Z.; by the Government of Canada through Genome Canada and the Ontario Genomics Institute (OGI-088 and OGI-097) to A.D.; and by NIH grants P41 GM103504, U41 HG006623, and R01 GM070743 to G.D.B.
Footnotes
Additional experimental procedures can be found in the Supplemental Information.
SUPPLEMENTAL INFORMATION
Supplemental Information includes Supplemental Experimental Procedures and eight figures and can be found with this article online at https://doi.org/10.1016/j.celrep.2018.03.039.
DECLARATION OF INTERESTS
The authors declare no competing interests.
REFERENCES
- Bartek J, and Lukas J (2003). Chk1 and Chk2 kinases in checkpoint control and cancer. Cancer Cell 3, 421–429. [DOI] [PubMed] [Google Scholar]
- Boutros R, Lobjois V, and Ducommun B (2007). CDC25 phosphatases in cancer cells: key players? Good targets? Nat. Rev. Cancer 7, 495–507. [DOI] [PubMed] [Google Scholar]
- Brezak MC, Quaranta M, Mondésert O, Galcera MO, Lavergne O, Alby F, Cazales M, Baldin V, Thurieau C, Harnett J, et al. (2004). A novel synthetic inhibitor of CDC25 phosphatases: BN82002. Cancer Res 64, 3320–3325. [DOI] [PubMed] [Google Scholar]
- Brezak MC, Valette A, Quaranta M, Contour-Galcera MO, Jullien D, Lavergne O, Frongia C, Bigg D, Kasprzyk PG, Prevost GP, and Ducommun B (2009). IRC-083864, a novel bis quinone inhibitor of CDC25 phosphatases active against human cancer cells. Int. J. Cancer 124, 1449–1456. [DOI] [PubMed] [Google Scholar]
- Busino L, Donzelli M, Chiesa M, Guardavaccaro D, Ganoth D, Dorrello NV, Hershko A, Pagano M, and Draetta GF (2003). Degradation of Cdc25A by beta-TrCP during S phase and in response to DNA damage. Nature 426, 87–91. [DOI] [PubMed] [Google Scholar]
- Caino MC, Ghosh JC, Chae YC, Vaira V, Rivadeneira DB, Faversani A, Rampini P, Kossenkov AV, Aird KM, Zhang R, et al. (2015). PI3K therapy reprograms mitochondrial trafficking to fuel tumor cell invasion. Proc. Natl. Acad. Sci. USA 112, 8638–8643. [DOI] [PMC free article] [PubMed] [Google Scholar]
- Cangi MG, Cukor B, Soung P, Signoretti S, Moreira G Jr., Ranashinge M, Cady B, Pagano M, and Loda M (2000). Role of the Cdc25A phosphatase in human breast cancer. J. Clin. Invest 106, 753–761. [DOI] [PMC free article] [PubMed] [Google Scholar]
- Cho YC, Park JE, Park BC, Kim JH, Jeong DG, Park SG, and Cho S (2015). Cell cycle-dependent Cdc25C phosphatase determines cell survival by regulating apoptosis signal-regulating kinase 1. Cell Death Differ 22, 1605–1617. [DOI] [PMC free article] [PubMed] [Google Scholar]
- Chou TC, and Talalay P (1984). Quantitative analysis of dose-effect relationships: the combined effects of multiple drugs or enzyme inhibitors. Adv. Enzyme Regul 22, 27–55. [DOI] [PubMed] [Google Scholar]
- Curtis C, Shah SP, Chin SF, Turashvili G, Rueda OM, Dunning MJ, Speed D, Lynch AG, Samarajiwa S, Yuan Y, et al. ; METABRIC Group (2012). The genomic and transcriptomic architecture of 2,000 breast tumours reveals novel subgroups. Nature 486, 346–352. [DOI] [PMC free article] [PubMed] [Google Scholar]
- Dalvai M, Mondesert O, Bourdon JC, Ducommun B, and Dozier C (2011). Cdc25B is negatively regulated by p53 through Sp1 and NF-Y transcription factors. Oncogene 30, 2282–2288. [DOI] [PubMed] [Google Scholar]
- Davis ST, Benson BG, Bramson HN, Chapman DE, Dickerson SH, Dold KM, Eberwein DJ, Edelstein M, Frye SV, Gampe RT Jr., et al. (2002). Retraction. Science 298, 2327. [DOI] [PubMed] [Google Scholar]
- Dominguez-Brauer C, Thu KL, Mason JM, Blaser H, Bray MR, and Mak TW (2015). Targeting mitosis in cancer: emerging strategies. Mol. Cell 60, 524–536. [DOI] [PubMed] [Google Scholar]
- Dvinge H, Git A, Gräf S, Salmon-Divon M, Curtis C, Sottoriva A, Zhao Y, Hirst M, Armisen J, Miska EA, et al. (2013). The shaping and functional consequences of the microRNA landscape in breast cancer. Nature 497, 378–382. [DOI] [PubMed] [Google Scholar]
- Finn RS, Dering J, Conklin D, Kalous O, Cohen DJ, Desai AJ, Ginther C, Atefi M, Chen I, Fowst C, et al. (2009). PD 0332991, a selective cyclin D kinase 4/6 inhibitor, preferentially inhibits proliferation of luminal estrogen receptor-positive human breast cancer cell lines in vitro. Breast Cancer Res 11, R77. [DOI] [PMC free article] [PubMed] [Google Scholar]
- Galaktionov K, Chen X, and Beach D (1996). Cdc25 cell-cycle phosphatase as a target of c-myc. Nature 382, 511–517. [DOI] [PubMed] [Google Scholar]
- Gatza ML, Lucas JE, Barry WT, Kim JW, Wang Q, Crawford MD, Datto MB, Kelley M, Mathey-Prevot B, Potti A, et al. (2010). A pathway-based classification of human breast cancer. Proc. Natl. Acad. Sci. U S A 107, 6994–6999. [DOI] [PMC free article] [PubMed] [Google Scholar]
- Goel S, DeCristo MJ, Watt AC, BrinJones H, Sceneay J, Li BB, Khan N, Ubellacker JM, Xie S, Metzger-Filho O, et al. (2017). CDK4/6 inhibition triggers anti-tumour immunity. Nature 548, 471–475. [DOI] [PMC free article] [PubMed] [Google Scholar]
- Guo J, Parise RA, Joseph E, Lan J, Pan SS, Joo B, Egorin MJ, Wipf P, Lazo JS, and Eiseman JL (2007). Pharmacology and antitumor activity of a quinolinedione Cdc25 phosphatase inhibitor DA3003–1 (NSC 663284). Anticancer Res 27 (5A), 3067–3073. [PubMed] [Google Scholar]
- Guo SL, Ye H, Teng Y, Wang YL, Yang G, Li XB, Zhang C, Yang X, Yang ZZ, and Yang X (2013). Akt-p53-miR-365-cyclin D1/cdc25A axis contributes to gastric tumorigenesis induced by PTEN deficiency. Nat. Commun 4, 2544. [DOI] [PMC free article] [PubMed] [Google Scholar]
- Hazzalin CA, Le Panse R, Cano E, and Mahadevan LC (1998). Anisomycin selectively desensitizes signalling components involved in stress kinase activation and fos and jun induction. Mol. Cell. Biol 18, 1844–1854. [DOI] [PMC free article] [PubMed] [Google Scholar]
- He R, Zeng LF, He Y, Zhang S, and Zhang ZY (2013). Small molecule tools for functional interrogation of protein tyrosine phosphatases. FEBS J 280, 731–750. [DOI] [PMC free article] [PubMed] [Google Scholar]
- Herrera-Abreu MT, Palafox M, Asghar U, Rivas MA, Cutts RJ, Garcia-Murillas I, Pearson A, Guzman M, Rodriguez O, Grueso J, et al. (2016). Early adaptation and acquired resistance to CDK4/6 inhibition in estrogen receptor-positive breast cancer. Cancer Res 76, 2301–2313. [DOI] [PMC free article] [PubMed] [Google Scholar]
- Herschkowitz JI, Simin K, Weigman VJ, Mikaelian I, Usary J, Hu Z, Rasmussen KE, Jones LP, Assefnia S, Chandrasekharan S, et al. (2007). Identification of conserved gene expression features between murine mammary carcinoma models and human breast tumors. Genome Biol 8, R76. [DOI] [PMC free article] [PubMed] [Google Scholar]
- Herschkowitz JI, He X, Fan C, and Perou CM (2008). The functional loss of the retinoblastoma tumour suppressor is a common event in basal-like and luminal B breast carcinomas. Breast Cancer Res 10, R75. [DOI] [PMC free article] [PubMed] [Google Scholar]
- Jiang Z, Deng T, Jones R, Li H, Herschkowitz JI, Liu JC, Weigman VJ, Tsao MS, Lane TF, Perou CM, and Zacksenhaus E (2010). Rb deletion in mouse mammary progenitors induces luminal-B or basal-like/EMT tumor subtypes depending on p53 status. J. Clin. Invest 120, 3296–3309. [DOI] [PMC free article] [PubMed] [Google Scholar]
- Jiang Z, Jones R, Liu JC, Deng T, Robinson T, Chung PE, Wang S, Herschkowitz JI, Egan SE, Perou CM, and Zacksenhaus E (2011). RB1 and p53 at the crossroad of EMT and triple-negative breast cancer. Cell Cycle 10, 1563–1570. [DOI] [PubMed] [Google Scholar]
- Jones RA, Robinson TJ, Liu JC, Shrestha M, Voisin V, Ju Y, Chung PE, Pellecchia G, Fell VL, Bae S, et al. (2016). RB1 deficiency in triple-negative breast cancer induces mitochondrial protein translation. J. Clin. Invest 126, 3739–3757. [DOI] [PMC free article] [PubMed] [Google Scholar]
- Kitajima S, and Takahashi C (2017). Intersection of retinoblastoma tumor suppressor function, stem cells, metabolism, and inflammation. Cancer Sci 108, 1726–1731. [DOI] [PMC free article] [PubMed] [Google Scholar]
- Knudsen ES, and Witkiewicz AK (2017). The strange case of CDK4/6 inhibitors: mechanisms, resistance, and combination strategies. Trends Cancer 3, 39–55. [DOI] [PMC free article] [PubMed] [Google Scholar]
- Koboldt DC, Fulton RS, McLellan MD, Schmidt H, Kalicki-Veizer J, McMichael JF, Fulton LL, Dooling DJ, Ding L, Mardis ER, et al. ; Cancer Genome Atlas Network (2012). Comprehensive molecular portraits of human breast tumours. Nature 490, 61–70. [DOI] [PMC free article] [PubMed] [Google Scholar]
- Kristjánsdóttir K, and Rudolph J (2004). Cdc25 phosphatases and cancer. Chem. Biol 11, 1043–1051. [DOI] [PubMed] [Google Scholar]
- Kuntz EM, Baquero P, Michie AM, Dunn K, Tardito S, Holyoake TL, Helgason GV, and Gottlieb E (2017). Targeting mitochondrial oxidative phosphorylation eradicates therapy-resistant chronic myeloid leukemia stem cells. Nat. Med 23, 1234–1240. [DOI] [PMC free article] [PubMed] [Google Scholar]
- Lawrence RT, Perez EM, Hernández D, Miller CP, Haas KM, Irie HY, Lee SI, Blau CA, and Villén J (2015). The proteomic landscape of triple-negative breast cancer. Cell Rep 11, 630–644. [DOI] [PMC free article] [PubMed] [Google Scholar]
- Liu H, Nishitoh H, Ichijo H, and Kyriakis JM (2000). Activation of apoptosis signal-regulating kinase 1 (ASK1) by tumor necrosis factor receptor-associated factor 2 requires prior dissociation of the ASK1 inhibitor thioredoxin. Mol. Cell. Biol 20, 2198–2208. [DOI] [PMC free article] [PubMed] [Google Scholar]
- Liu TJ, Koul D, LaFortune T, Tiao N, Shen RJ, Maira SM, Garcia-Echevrria C, and Yung WK (2009). NVP-BEZ235, a novel dual phosphatidylinositol 3-kinase/mammalian target of rapamycin inhibitor, elicits multifaceted antitumor activities in human gliomas. Mol. Cancer Ther 8, 2204–2210. [DOI] [PMC free article] [PubMed] [Google Scholar]
- Liu JC, Voisin V, Wang S, Wang DY, Jones RA, Datti A, Uehling D, Al-awar R, Egan SE, Bader GD, et al. (2014). Combined deletion of Pten and p53 in mammary epithelium accelerates triple-negative breast cancer with dependency on eEF2K. EMBO Mol. Med 6, 1542–1560. [DOI] [PMC free article] [PubMed] [Google Scholar]
- Liu H, Tang X, Srivastava A, Pécot T, Daniel P, Hemmelgarn B, Reyes S, Fackler N, Bajwa A, Kladney R, et al. (2015). Redeployment of Myc and E2f1–3 drives Rb-deficient cell cycles. Nat. Cell Biol 17, 1036–1048. [DOI] [PMC free article] [PubMed] [Google Scholar]
- Ma CX, Janetka JW, and Piwnica-Worms H (2011). Death by releasing the breaks: CHK1 inhibitors as cancer therapeutics. Trends Mol. Med. 17, 88–96. [DOI] [PMC free article] [PubMed] [Google Scholar]
- Medema RH, and Macůrek L (2012). Checkpoint control and cancer. Oncogene 31, 2601–2613. [DOI] [PubMed] [Google Scholar]
- Nik-Zainal S, Davies H, Staaf J, Ramakrishna M, Glodzik D, Zou X, Martincorena I, Alexandrov LB, Martin S, Wedge DC, et al. (2016). Landscape of somatic mutations in 560 breast cancer whole-genome sequences. Nature 534, 47–54. [DOI] [PMC free article] [PubMed] [Google Scholar]
- Otto T, and Sicinski P (2017). Cell cycle proteins as promising targets in cancer therapy. Nat. Rev. Cancer 17, 93–115. [DOI] [PMC free article] [PubMed] [Google Scholar]
- Prat A, and Perou CM (2011). Deconstructing the molecular portraits of breast cancer. Mol. Oncol 5, 5–23. [DOI] [PMC free article] [PubMed] [Google Scholar]
- Prat A, Parker JS, Karginova O, Fan C, Livasy C, Herschkowitz JI, He X, and Perou CM (2010). Phenotypic and molecular characterization of the claudin-low intrinsic subtype of breast cancer. Breast Cancer Res 12, R68. [DOI] [PMC free article] [PubMed] [Google Scholar]
- Robinson TJ, Liu JC, Vizeacoumar F, Sun T, Maclean N, Egan SE, Schimmer AD, Datti A, and Zacksenhaus E (2013). RB1 status in triple negative breast cancer cells dictates response to radiation treatment and selective therapeutic drugs. PLoS ONE 8, e78641. [DOI] [PMC free article] [PubMed] [Google Scholar]
- Robinson DR, Wu YM, Lonigro RJ, Vats P, Cobain E, Everett J, Cao X, Rabban E, Kumar-Sinha C, Raymond V, et al. (2017). Integrative clinical genomics of metastatic cancer. Nature 548, 297–303. [DOI] [PMC free article] [PubMed] [Google Scholar]
- Santamaría D, Barriére C, Cerqueira A, Hunt S, Tardy C, Newton K, Cáceres JF, Dubus P, Malumbres M, and Barbacid M (2007). Cdk1 is sufficient to drive the mammalian cell cycle. Nature 448, 811–815. [DOI] [PubMed] [Google Scholar]
- Tibbles LA, and Woodgett JR (1999). The stress-activated protein kinase pathways. Cell. Mol. Life Sci 55, 1230–1254. [DOI] [PMC free article] [PubMed] [Google Scholar]
- Tyanova S, Albrechtsen R, Kronqvist P, Cox J, Mann M, and Geiger T (2016). Proteomic maps of breast cancer subtypes. Nat. Commun 7, 10259. [DOI] [PMC free article] [PubMed] [Google Scholar]
- Vigo E, Müller H, Prosperini E, Hateboer G, Cartwright P, Moroni MC, and Helin K (1999). CDC25A phosphatase is a target of E2F and is required for efficient E2F-induced S phase. Mol. Cell. Biol 19, 6379–6395. [DOI] [PMC free article] [PubMed] [Google Scholar]
- Viré E, Curtis C, Davalos V, Git A, Robson S, Villanueva A, Vidal A, Barbieri I, Aparicio S, Esteller M, et al. (2014). The breast cancer oncogene EMSY represses transcription of antimetastatic microRNA miR-31. Mol. Cell 53, 806–818. [DOI] [PMC free article] [PubMed] [Google Scholar]
- Wang S, Liu JC, Kim D, Datti A, and Zacksenhaus E (2016). Targeted Pten deletion plus p53-R270H mutation in mouse mammary epithelium induces aggressive claudin-low and basal-like breast cancer. Breast Cancer Res 18, 9. [DOI] [PMC free article] [PubMed] [Google Scholar]
- Wang S, Liu JC, Ju Y, Pellecchia G, Voisin V, Wang DY, Leha LR, Ben-David Y, Bader GD, and Zacksenhaus E (2017). microRNA-143/145 loss induces Ras signaling to promote aggressive Pten-deficient basal-like breast cancer. JCI Insight 2, 93313. [DOI] [PMC free article] [PubMed] [Google Scholar]
- Witkiewicz AK, Chung S, Brough R, Vail P, Franco J, Lord CJ, and Knudsen ES (2018). Targeting the vulnerability of RB tumor suppressor loss in triple-negative breast cancer. Cell Rep 22, 1185–1199. [DOI] [PMC free article] [PubMed] [Google Scholar]
- Zacksenhaus E, Shrestha M, Liu JC, Vorobieva I, Chung PED, Ju Y, Nir U, and Jiang Z (2017). Mitochondrial OXPHOS induced by RB1 deficiency in breast cancer: implications for anabolic metabolism, stemness, and metastasis. Trends Cancer 3, 768–779. [DOI] [PubMed] [Google Scholar]
- Zou X, Tsutsui T, Ray D, Blomquist JF, Ichijo H, Ucker DS, and Kiyokawa H (2001). The cell cycle-regulatory CDC25A phosphatase inhibits apoptosis signal-regulating kinase 1. Mol. Cell. Biol 21, 4818–4828. [DOI] [PMC free article] [PubMed] [Google Scholar]
Associated Data
This section collects any data citations, data availability statements, or supplementary materials included in this article.