Abstract
Lipid metabolic reprogramming is a prominent feature of clear cell renal cell carcinoma (ccRCC). Lipid accumulation affects cellular energy homeostasis, biofilm synthesis, lipid signal transduction, and phenotypic transformation in ccRCC. Herein, a prognostic‐related model was constructed, and the prognostic utility of AUP1, a lipid droplet–regulating very low–density lipoprotein assembly factor, in ccRCC was determined through multiparameter analysis. AUP1 expression was significantly higher in clinical samples than in normal tissues and was closely associated with the clinical stage. The inhibition of AUP1 expression impaired the proliferation, migration, and invasion of ACHN and A498 ccRCC cells in vitro and in vivo. RNA‐seq analysis revealed that AUP1 inhibition can significantly reduce the contents of intracellular triglyceride and cholesterol and regulate cell growth by cell cycle arrest, promoting apoptosis and reversing epithelial‐mesenchymal transition. AUP1 regulated the synthesis of cholesterol esters and fatty acids (FAs) in ccRCC cells by targeting sterol O‐acyltransferase 1 and partially promoted the progression of ccRCC. AUP1 also induced lipid accumulation in ccRCC by promoting the de novo synthesis of FAs (inhibiting protein kinase AMP‐activated catalytic subunit alpha 2), inhibiting the rate‐limiting enzyme of FA β oxidation (carnitine palmitoyltransferase 1A), regulating the key enzyme of lipolysis (monoglyceride lipase, MGLL), and inhibiting the lipid transporter StAR‐related lipid transfer domain containing 5 (STARD5). However, it did not affect the intracellular cholesterol synthesis pathway. The differential expression and prognostic significance of MGLL and STARD5 in ccRCC should be further studied. AUP1 may serve as a new and effective potential target and prognostic marker for ccRCC.
Keywords: AUP1, lipid accumulation, lipid metabolism, prognostic model, renal clear cell carcinoma
We used a publicly available database to construct a prognostic risk model for ccRCC, and through subsequent verification and multi‐parameter analysis, we screened and extracted that AUP1 is significantly highly expressed in ccRCC and is closely related to the clinical prognosis. Combined with RNA‐seq, in vivo, in vitro experiments and clinical samples, we revealed that AUP1 induced lipid accumulation in ccRCC by mediating fatty acid and cholesterol pathways, and realized lipid reprogramming, thus promoting the progression of ccRCC.

Abbreviations
- ccRCC
clear cell renal cell carcinoma
- CE
cholesterol esters
- CHOL
cholesterol
- FA
fatty acid
- TG
triglycerides
1. INTRODUCTION
Renal cell carcinoma (RCC) is a common tumor of the urinary system. The number of new cases and deaths due to RCC is estimated to be 76,080 and 13,780, respectively, in the United States in 2021. 1 Clear cell RCC (ccRCC) is the most common histological subtype, accounting for ~75% of cases. 2 Almost 30% of patients show metastasis at diagnosis, and almost 30% of the remaining patients will develop metastases during follow‐up, indicating a relatively poor prognosis. 3 Although inhibitors of vascular endothelial growth factor receptor tyrosine kinase and immune checkpoint inhibitors have improved progression‐free survival, drug resistance and tumor metastasis and recurrence remain treatment challenges. 3 , 4 , 5 Therefore, it becomes important to identify and validate new biomarkers and explore the molecular mechanisms of ccRCC.
ccRCC is fundamentally a metabolism‐related disease. 6 , 7 Cancer cells predominantly produce energy by lactic acid fermentation even under normoxic conditions rather than by glycolysis followed by the tricarboxylic acid (TCA) cycle in mitochondria; this is known as the classic Warburg effect. 8 Metabolic reprogramming including decreased functioning of the TCA cycle and upregulation of the Von Hippel–Lindau/hypoxia‐inducible factor pathway increases the expression of fatty acid (FA) synthesis genes and cholesterol (CHOL) in cancer cells, and the abundant raw materials aid cancer cell proliferation. 9 , 10 ccRCC tumors contain a large amount of neutral lipids such as cholesterol esters (CE) and triglycerides (TG), indicating lipid deposition in cells. 11 , 12 The associated proliferation and metastasis are closely related to FA synthesis, oxidative catabolism, and CHOL uptake and transport. 13 , 14 , 15 The abundant lipid accumulation in ccRCC affects energy homeostasis and releases lipid species for cell membrane synthesis during cancer cell proliferation. 16 Therefore, targeting lipid deposition will provide a new therapeutic direction and help us understand the complex underlying mechanisms.
In this study, a publicly available database was used to construct a prognostic risk model for ccRCC, and through subsequent verification and multiparameter analysis, the prognostic value of AUP1, which is significantly highly expressed in ccRCC, was determined. The results showed that AUP1 promotes the synthesis of intracellular FAs and CE formation by targeting the SOAT1 pathway and induces lipid accumulation in ccRCC tissues by inhibiting the β oxidation of FAs (FAO), regulating the key enzymes of lipolysis and CHOL transport, and thus induces the proliferation and metastasis of ccRCC cells.
2. MATERIALS AND METHODS
2.1. Data acquisition and analysis
The LIPID STORAGE pathway was accessed on the Gene Set Enrichment Analysis (GSEA) website (https://www.gsea‐msigdb.org/gsea/index.jsp), and 79 genes were selected. The mRNA sequencing data of 539 ccRCC and 72 normal renal tissue samples were downloaded from The Cancer Genome Atlas (TCGA) database with clinicopathological data of patients including age, sex, pathological stage, histological grade, survival time, and survival status. Multiple extension packages based on the R language were used for data processing and statistical analyses. All genes were analyzed for differences between normal and tumor samples using a heat map. Then, single factor Cox analysis was conducted to determine the relationship between these molecules and the prognosis of ccRCC patients, identifying risk genes and protective genes. LASSO regression analysis was conducted to further screen for ccRCC prognosis–related genes to construct the model. The risk score was calculated based on a linear combination of the Cox coefficient and gene expression. The median was used to divide the patients into low‐ and high‐risk groups, and the corresponding survival curve was drawn. Receiver operating characteristic (ROC) curves of 3‐, 5‐, 7‐, and 10‐year survival were used to verify the validity of the model. The correlation with the pathological features of ccRCC seen in patients was analyzed and displayed as a heat map. Univariate and multivariate Cox regression analyses were performed to verify the predictive ability of the risk signature. The nomogram was prepared using the “rms” package, and the coexpression relationship was evaluated using the “corrplot” package. Further gene screening criteria in the model were as follows: (1) the gene has not been studied in ccRCC; (2) it exhibits high expression in the model; (3) it is associated with poor prognosis.
2.2. Tissue samples
Twenty‐four pairs of ccRCC tissues and adjacent normal tissues were collected from patients attending Shandong Provincial Hospital between July 2020 and June 2021. All the 24 paired samples were subjected to quantitative polymerase chain reaction (qPCR) analysis. In addition, 60 pathological sections used for immunohistochemistry (IHC) were postoperatively collected from each patient at the Department of Pathology of Liaocheng People's Hospital Affiliated to Shandong University. Postoperative pathologic reports confirmed a diagnosis of ccRCC. All procedures were implemented according to the guidelines of the Declaration of Helsinki. All patients provided written informed consent.
2.3. Cell culture and transfection
ACHN, A498, 786‐O, Caki‐1, and HK2 cells were purchased from the Chinese Academy of Sciences cell bank. All cells were cultured in the presence of penicillin/streptomycin at 37°C in air containing 5% CO2. The antibodies used are shown in Table S1. For stable transfection, siAUP1 was subcloned into the lentivirus vector (LV) GV493 (hU6‐MCS‐CBh‐gcGFP‐IRES‐puromycin) and negative control virus (LV‐NC, CON313) by Genechem. Stable cell lines were screened with puromycin. The pcDNA3.1+ vector (overexpression) and siRNA targeted against SOAT1 were purchased from GenePharma. Transient transfection was performed using Lipofectamine 3000 and P3000 reagent (Invitrogen) according to the manufacturer's protocol. The sequences used are shown in Table S2.
2.4. RNA‐seq analysis
Total RNA was extracted from LV‐NC and LV‐siAUP1 cells using TRIzol (TAKARA) and further treated with DNase to remove genomic DNA contamination. An RNA library was constructed using a TruSeq Stranded mRNA LT Sample Prep Kit (Illumina), and then the RNA‐seq library was sequenced using an Illumina NovaSeq 6000 PE150 instrument by Haplox Biotechnology Co.
2.5. RNA extraction and real‐time PCR
Total RNA was extracted using an RNA extraction kit (Accurate Biotechnology Co., Ltd.) according to the manufacturer's instructions. Reverse transcription was performed using the Evo M‐MLV RT Premix (Accurate Biotechnology). The qPCR assay was performed using SYBR® Green Premix Pro Taq HS qPCR kit (Accurate Biotechnology) and amplified in LightCycler 480II (Roche). β‐actin was used as an endogenous reference to normalize RNA expression. The relative expression of genes was calculated using the method. The primer sequences used are listed in Table S3.
2.6. Cell proliferation, wound healing, Transwell migration, and invasion assays
Cell Counting Kit‐8 (CCK‐8), EdU, and colony formation assays were performed as previously reported. 17 Cells were cultured in six‐well plates, and the cell monolayer was subsequently scratched with a 200 μl pipette tip. Representative images of cell migration were captured by photographing 10 high‐power fields at 0, 24 and 48 h after injury. Cells were seeded in upper chambers with 200 μl of serum‐free medium. The Transwell chamber (Corning) was paved with Matrigel (Corning356234) for invasion assays and without Matrigel for migration assays. The bottom chamber was filled with the medium and 20% fetal bovine serum as a chemoattractant. After incubation for 48 h, the upper chambers were fixed and then stained with crystal violet (Solarbio) for 20 min. For visualization, the cell lines were photographed and counted in five different fields.
2.7. Hematoxylin and eosin (HE) and IHC staining
Paraffin sections were cut into 4‐μm slices and mounted onto glass slides. They were deparaffinized, rehydrated, and incubated in 3% hydrogen peroxide for 10 min to block endogenous peroxidase. Hematoxylin and eosin and IHC staining analyses were performed using a staining kit (MXB Biotechnologies) in compliance with the manufacturer's instructions. The results were scored by two experienced pathologists in a blinded manner. The staining intensity was evaluated semiquantitatively on a 0–4 scale: 0, no expression; 1, weak (light yellow); 2, moderate (yellow); 3, positive (brown); 4, strong expression (dark brown). The H‐score was calculated using the formula of representative intensity (0, 1, 2, 3, or 4, as described above) × the proportion of expressed cells for each case. 18 Therefore, the theoretically possible range of H‐score was 0–400.
2.8. Tissue microarray technology
Postoperative tumor tissue and corresponding paracancer normal tissue specimens of 90 patients with ccRCC were obtained from Shandong Provincial Hospital between February 2012 and June 2015. Each patient and their family members signed an informed consent form. All 180 tissues were used to create tissue microarrays (manufactured by Wuhan Servicebio Technology Co., Ltd.). The tissue microarrays were stained using a semiquantitative system according to the manufacturer's instructions and verified by IHC.
2.9. Western blotting
Protein was extracted from cells using RIPA lysis buffer (Solarbio), and the protein concentration was determined using the bicinchoninic acid method (Solarbio). Each sample (30 μg protein) was separated by 6–15% sodium dodecyl sulfate‐polyacrylamide gel electrophoresis (Epizyme), transferred to a polyvinylidene fluoride membrane (Millipore), blocked with 5% skim milk powder, and incubated with the primary antibodies overnight. The membrane was then incubated with a peroxidase‐conjugated secondary antibody, and the immunoreactive bands were observed using an ECL system.
2.10. Oil Red O staining
An Oil Red O staining kit (Solarbio) was used to visualize lipid deposition in the cells according to the manufacturer's instructions.
2.11. Determination of intracellular TG and CHOL contents
Intracellular TG and CHOL contents were determined using a commercial kit (Applygen) according to the manufacturer's protocol.
2.12. Xenografts
ACHN (5 × 10⁶) cells stably transfected with LV‐NC and LV‐siAUP1 were subcutaneously injected in 4‐week‐old BALB/c nude mice (Charles River). The tumor volume was estimated every 3 days, and the body mass was weighed every 4 days. The tumor volume was calculated as (length × width2)/2. Four weeks later, the mice were sacrificed, and subcutaneous tumor tissues were weighed and subjected to HE and IHC staining. All animal experiments were performed according to the guidelines of the Animal Ethics Committee of Shandong Provincial Hospital.
2.13. Statistical analysis
GraphPad Prism software was used to conduct the statistical analyses. Quantitative data are expressed as mean ± SEM. The statistical significance of differences between and among groups was assessed using t test and one‐way ANOVA, respectively. Statistical differences are indicated as follows: *p < 0.05; **p < 0.01; ***p < 0.001.
3. RESULTS
3.1. Identification of a prognostic risk signature model of ccRCC and target gene screening
The role of genes related to lipid storage in ccRCC was studied by first constructing a heat map, which showed that 69 out of 79 genes were differentially expressed between ccRCC and normal kidney tissues (Figure 1A), including 39 upregulated (red) and 30 downregulated (blue) genes. Univariate Cox regression analysis revealed 39 genes related to prognosis (p < 0.05), including 14 risk genes (HR > 1) (Figure 1B). Using the LASSO regression analysis, a risk signature model based on minimum criteria was constructed with 17 optimum and most powerful prognostic markers (Figure 1C,D). According to the median risk score, patients were divided into high‐ and low‐risk groups to explore the prognostic prediction performance of the model. According to survival curve analysis, the high‐risk group had a low survival rate (Figure 1E). Receiver operating characteristic curves of 3‐, 5‐, 7‐, and 10‐year survival were further used to verify the validity of the model. The results showed that the longer the time, the higher was the accuracy of the model (5‐year area under curve [AUC] = 0.753, 7‐year AUC = 0.786, and 10‐year AUC = 0.786) (Figure 1F–I), which demonstrated that the risk score calculated by the model could accurately predict the survival rates of ccRCC. Then the correlation between the risk score of the expression of 17 genes and the clinicopathological characteristics of high‐ and low‐risk ccRCC patients in the TCGA dataset was analyzed. The risk scores of high‐ and low‐risk samples were strongly correlated with tumor size (T), tumor metastasis (M), tumor grade, stage, and survival (Figure 1J). Further univariate Cox regression analysis showed that all these variables were independent risk factors (Figure 1K). Multivariate Cox regression analysis showed that risk score, age, stage, and grade were independent risk factors for the prognosis of ccRCC patients (Figure 1L). Based on the above effective variables, the model nomogram was plotted, which could easily estimate the survival rates of ccRCC patients from the total score in the 5‐, 7‐, or 10‐year survival groups. Coexpression analysis of the 17 genes in the model was conducted to investigate whether there is a coexpression relationship between them. Six genes with high expression (Figure 1A, logFC > 0) and poor prognosis (Figure 1B, HR > 1) were extracted from the model for further analysis. Considering the p value of differential expression and prognostic correlation analysis in the model, combined with PubMed literature search and gene function analysis, AUP1 was finally selected as the subject of this study. The process of constructing the prognostic correlation model is shown in Figure 2.
FIGURE 1.
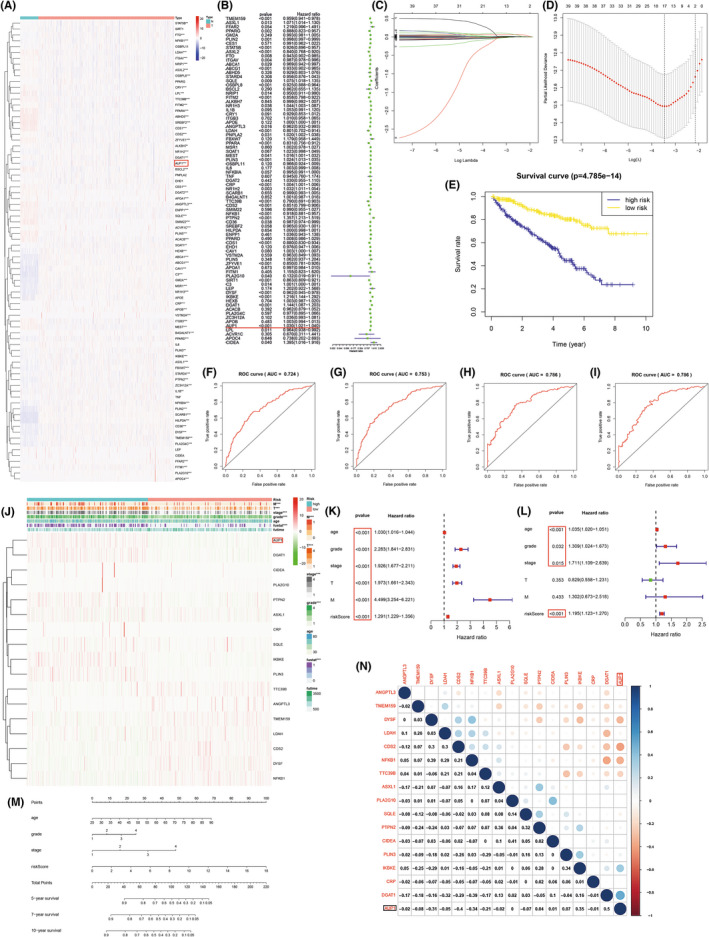
Identification of a prognostic risk signature model. (A) Heat map of lipid storage–related genes. (B) Forest plot; hazard ratio (HR) >1 represents the gene is a risk factor and vice versa. (C, D) LASSO regression. (E) Kaplan‐Meier survival curve. (F–I) ROC curve. (J) Heatmap of the expression of 17 genes in model and clinicopathological characteristics in low and high risk ccRCC patients. (K, L) Univariate and multivariate analysis. (M) Nomogram. Add up the corresponding scores for each variable to get total points and estimate the 5‐, 7‐, or 10‐year survival rates of clear cell renal cell carcinoma (ccRCC) patients. (N) Coexpression analysis. *p < 0.05; **p < 0.01; ***p < 0.001
FIGURE 2.
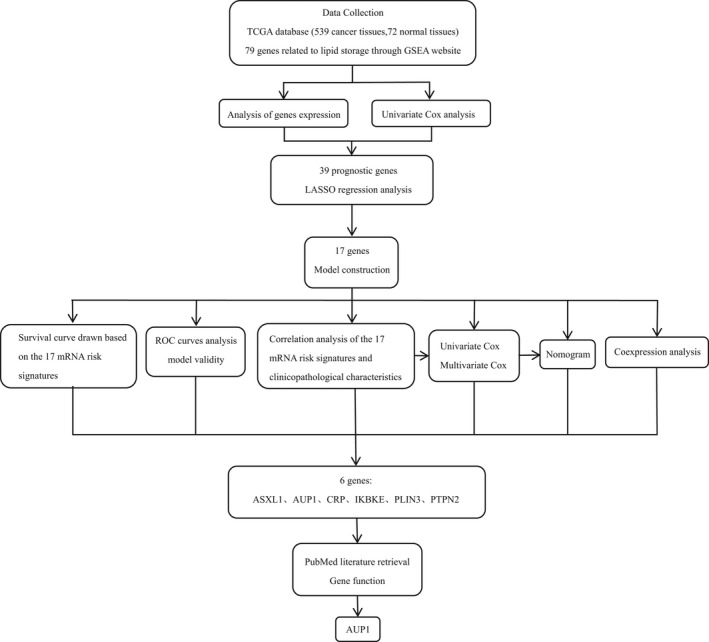
Flow chart
3.2. Expression profiles of AUP1 in clinical samples
The mRNA level of AUP1 was increased in ccRCC from TCGA database samples (Figure 3A,B). qPCR analysis showed that AUP1 was upregulated in 83.3% (20/24) of ccRCC tissues relative to adjacent normal tissues (Figure 3C), consistent with the results for the TCGA database. Immunohistochemistry analysis showed that AUP1 protein expression was increased in ccRCC tissues compared with that in adjacent normal tissues. Hematoxylin and eosin staining indicated that the nucleolus gradually increased and showed atypia with advancement in tumor grade (Figure 3D, Figure S1).
FIGURE 3.
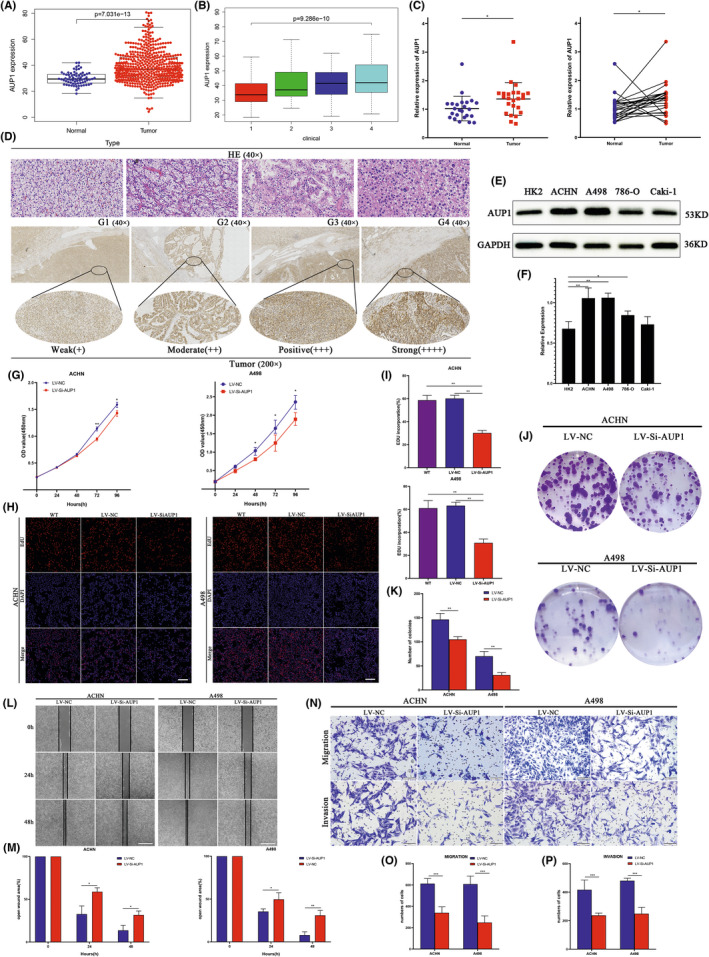
Expression and the effect of AUP1 knockdown on clear cell renal cell carcinoma (ccRCC) cells. (A, B) mRNA expression level of AUP1 in ccRCC (n = 539) and normal tissue (n = 72) samples in TCGA database. (C) Relative expression of AUP1 in ccRCC and matched adjacent normal tissues was detected by qPCR (n = 24). (D) HE staining and immunohistochemistry (IHC) assay for AUP1 expression in clinical samples. (E, F) AUP1 expression in cell lines. (G–I) CCK‐8 and EdU assay (scale bar, 100 μm). (J, K) Colony formation assay. (L, M) Wound‐healing assay (scale bar, 200 μm). (N–P) Transwell assays (scale bar, 100 μm). *p < 0.05; **p < 0.01; ***p < 0.001
3.3. AUP1 modulates the proliferation, migration, and invasion of ccRCC cells in vitro
The effect of AUP1 on the biological function of ccRCC cells was studied in vitro by comparing the expression between different ccRCC cell lines (ACHN, A498, 786‐O, and Caki‐1) and normal renal tubular epithelial cells (HK2). Western blot (WB) analysis showed that AUP1 expression was generally increased in ccRCC cell lines compared with that in HK2 cells, especially in ACHN and A498 cells (Figure 3E,F). Accordingly, these two cell lines were selected for cell transfection. Gene knockdown efficiency was good at both mRNA and protein levels (Figures S2–S4), and there was little difference between the negative control and the wild type. The CCK‐8 assay showed that AUP1 downregulation inhibited the proliferation of both ACHN and A498 cells (Figure 3G). The EdU assay showed that AUP1 knockdown significantly reduced EdU‐positive cells and inhibited the proliferation of ACHN and A498 cells (Figure 3H,I). The colony formation assay further demonstrated that the cell‐cloning capabilities were markedly impaired by AUP1 downregulation (Figure 3J,K). The wound‐healing assay showed that AUP1 inhibition significantly impaired the migration of ACHN and A498 cells at 24 and 48 h (Figure 3L,M). The Transwell assay demonstrated that AUP1 deficiency decreased the migration and invasion of ACHN and A498 cells (Figure 3N–P).
3.4. AUP1 mediates both FA and CHOL metabolism in ccRCC
RNA‐seq analysis was performed on ACHN cells transfected with the LV‐siAUP1 to reveal the underlying biological mechanism. The sequencing of experimental and control samples was repeated for three groups (Figure 4A–C); 1964 genes were found to be differentially expressed, of which 558 were downregulated and 1406 upregulated (Figure 4D,E). Gene Ontology (GO) analysis suggested that the biological processes involved in the differential expression of signal molecules downstream of AUP1 were mainly cellular response to FA, DNA replication, regulation of transcription involved in the G1/S transition of mitotic cell cycle, CHOL efflux, regulation of epithelial cell differentiation/proliferation, lipid localization, and lipid transport (Figure 4F), suggesting that the downstream mechanism is closely related to FA and CHOL metabolism, cell cycle, and epithelial‐mesenchymal transition (EMT). Kyoto Encyclopedia of Genes and Genomes (KEGG) and Reactome database analyses found that the differentially expressed genes were mainly involved in cell cycle and DNA replication (Figure 4G,H).
FIGURE 4.
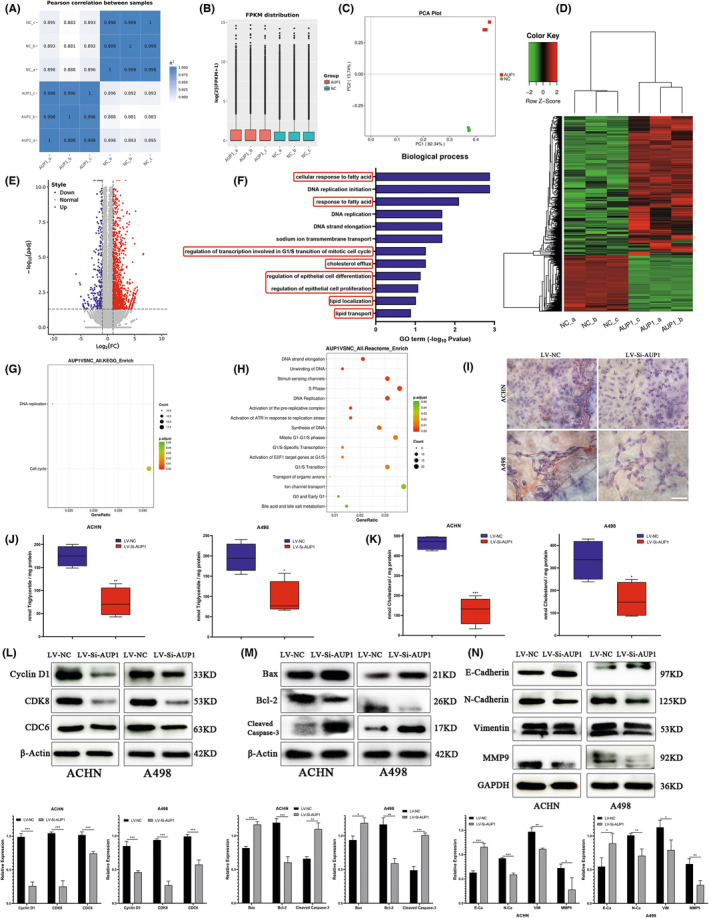
AUP1 regulates fatty acid (FA) and cholesterol (CHOL) metabolism and promotes the progression of clear cell renal cell carcinoma (ccRCC) by mediating cell cycle, apoptosis, and epithelial‐mesenchymal transition (EMT). (A–C) The expression of RNA‐seq samples was analyzed by Pearson correlation, fragments per kilobase million (FPKM) distribution and principal component analysis (PCA) plot. (D) Heatmap for the differential expression genes. (E) Volcano plots. (F) Gene Ontology (GO) functional enrichment analysis. (G) Kyoto Encyclopedia of Genes and Genomes (KEGG) database enrichment analysis. (H) Reactome database enrichment analysis. (I) Oli Red O staining. (J, K) Intracellular triglyceride (TG) and CHOL assay. (L–N) Immunoblot assay of cycle‐related, apoptosis‐related, and EMT‐related protein expression in AUP1‐silent ccRCC cells. *p < 0.05; **p < 0.01; ***p < 0.001
Based on the above results, it was speculated that AUP1 silencing in ccRCC cells simultaneously affected the contents of intracellular FA and CHOL. This hypothesis was verified by Oil Red O staining, which showed that the lipid content and lipid droplet accumulation of both ACHN and A498 cells decreased after AUP1 knockdown (Figure 4I). Furthermore, the TG and CHOL levels of ACHN‐ and A498‐transfected cells decreased upon AUP1 silencing (Figure 4J,K), consistent with the prediction and sequencing data.
3.5. AUP1 influences the proliferation of ccRCC cells by regulating cell cycle, inhibiting apoptosis, and promoting cell migration and invasion through EMT regulation
Gene Ontology, KEGG, and Reactome database analyses suggested that the downstream mechanism of AUP1 knockdown involves the cell cycle, especially G1/S transition (Figure 4F–H). Western blot analysis of cell cycle–related proteins showed that the expression levels of cyclin D1, cyclin‐dependent protein kinase 8 (CDK8), and cell division cycle 6 (CDC6) were decreased both in ACHN and A498 cells after AUP1 silencing (Figure 4L). CDK8 encodes a member of the CDK family, which are known to be important regulators of cell cycle progression. 19 CDC6 functions as a regulator at the early steps of DNA replication, localizes in cell nucleus during cell cyle G1, and translocates to the cytoplasm at the start of S phase. 20 , 21 Moreover, AUP1 knockdown upregulated the expression of the apoptotic protein Bax, downregulated the expression of the antiapoptosis protein Bcl2, and significantly upregulated the expression of the apoptosis‐executing protein cleaved caspase‐3 both in ACHN and A498 cells (Figure 4M). RNA‐seq (Figure 4F) results were supported by WB results to validate the expression level of EMT marker proteins. E‐cadherin was upregulated, while N‐cadherin, vimentin, and MMP‐9 were downregulated after AUP1 silencing (Figure 4N). These findings imply that AUP1 promotes the proliferation, invasion, and migration of ccRCC cells through cell cycle arrest, apoptosis induction, and reversal of EMT.
3.6. AUP1 induces lipid accumulation partly by targeting SOAT1 to promote the progression of ccRCC
The downstream mechanism by which AUP1 regulates lipid metabolism was studied through multiple integration RNA‐seq analysis of differentially expressed genes involved in lipid storage, CHOL efflux, and CHOL storage (from GSEA). The results presented SOAT1 in the convergence diagram (Figure 5A), which catalyzes the formation of FA‐CE. 22 Further qPCR verification of ACHN and A498 cells after transfection showed that SOAT1 expression decreased significantly with AUP1 knockdown (Figure 5B). The Clinical Proteomic Tumor Analysis Consortium database showed increased SOAT1 expression in ccRCC tissues, which gradually increased with the progression of tumor grade (Figure 5C). Then, qPCR analysis of clinical samples showed that SOAT1 expression was significantly increased in tumor tissues compared with that in adjacent normal tissues (Figure 5D). Immunohistochemistry analysis of clinical samples showed that compared with the paracancer tissues, SOAT1 expression in tumor tissues was significantly increased, which progressively increased further with pathological grade (Figure 5E,F). A series of functional in vitro experiments were conducted. First, qPCR assay showed that SOAT1 expression was higher in ACHN and A498 cells than in HK2 cells (Figure 5G). Then, siRNA was used to knock down SOAT1; the transfection efficiency at the mRNA and protein levels is shown in Figure 5H,I. The CCK8 and colony formation assays showed that SOAT1 silencing reduced the proliferation and cloning abilities of ACHN and A498 cells (Figure 5J,K). The Transwell migration and invasion assay confirmed that SOAT1 knockdown inhibited the migration and invasion (Figure 5L).
FIGURE 5.
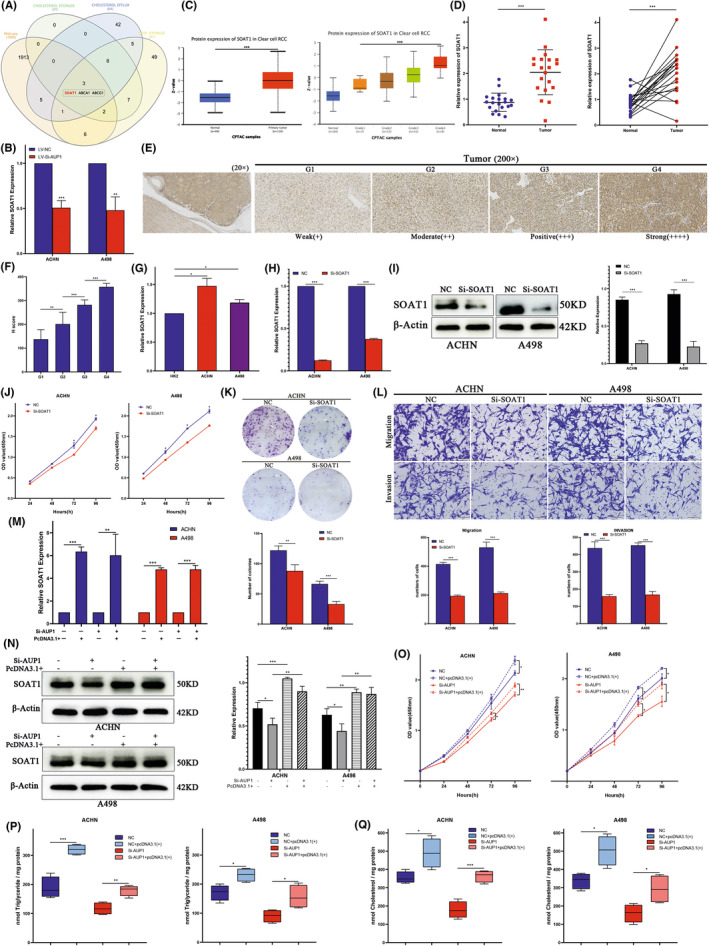
The lipid accumulation of clear cell renal cell carcinoma (ccRCC) cells induced by AUP1 was partially accomplished by SOAT1. (A) Venn diagram. (B) Quantitative PCR analysis of SOAT1 in ACHN and A498 cells after transfected with LV‐Si‐AUP1. (C) Protein expression level of SOAT1 in ccRCC and normal tissue samples in clinical proteomic tumor analysis consortium (CPTAC) database. (D) Relative expression of SOAT1 in ccRCC tissues and matched adjacent normal tissues was detected by qPCR (n = 20). (E, F) Immunohistochemistry (IHC) assay and H score for SOAT1 expression in clinical samples. (G) Relative expression of SOAT1 in cell lines. (H, I) Quantitative PCR and Western blot (WB) assay for the transfection efficiency of Si‐SOAT1. (J, K) CCK‐8 and colony formation assays. (L) Transwell assays (scale bar, 100 μm). (M) Quantitative PCR assay to detect the transfection efficiency of transfected with SOAT1‐pcDNA3.1+ in ACHN and A498 cells stably transfected with lentivirus vector negative control (LV‐NC) or Si‐AUP1. (N) Western blot assay to detect SOAT1 expression in ACHN and A498 cells stably transfected with NC/Si‐AUP1 with or without transfected SOAT1‐pcDNA3.1+. (O) CCK8 assay. (P, Q) Intracellular TG and triglyceride (CHOL) assay. *p < 0.05; **p < 0.01; ***p < 0.001
The above results indicate that SOAT1 may be an important downstream target of AUP1 and has a special biological function in ccRCC. A rescue experiment was next conducted to further clarify its relationship with AUP1 and whether its carcinogenic mechanism is related to the mediation of lipid accumulation. SOAT1 was first overexpressed by transfecting plasmids into ACHN and A498 control cells, and then SOAT1 was overexpressed based on LV AUP1 knockdown. The transfection efficiency at the mRNA level is shown in Figure 5M. Western blot assay showed that AUP1 knockdown decreased the expression of SOAT1, and the abundance was significantly increased after plasmid transfection in ACHN and A498 cells (Figure 5N). In the control cells of ACHN and A498, SOAT1 upregulation enhanced the proliferation, while the upturn of SOAT1 partially reversed the inhibitory effect of AUP1 silencing on cell proliferation (Figure 5O). Quantification of the intracellular TG and CHOL contents of each corresponding ACHN and A498 cells showed that SOAT1 upregulation increased the TG and CHOL contents in ACHN and A498 cells, while upregulation of SOAT1 partially reversed the decrease in TG and CHOL levels caused by AUP1 silencing (Figure 5P,Q). These results suggest that AUP1 induces lipid accumulation in ccRCC cells partly via SOAT1, and the increase in lipid content rescues cell death and promotes tumor proliferation and progression.
3.7. AUP1 stimulates lipid metabolism reprogramming by coordinating multiple signaling pathways of FAs and CHOL in ccRCC
The potential mechanism of AUP1‐induced lipid accumulation in ccRCC was studied in further detail by verifying by qPCR the differentially expressed molecules mainly involved in lipid metabolism in RNA‐seq (Figure 6A). The results showed that PRKAA2 and STARD5 were significantly altered. Furthermore, WB assay on ACHN and A498 cells showed that the expression of PRKAA2, STARD5, and CPT1A increased with a decrease in AUP1 expression, while MGLL expression decreased. Analysis of the expression of HMGCR, a key enzyme in CHOL synthesis, showed that the inhibition of cell growth due to AUP1 silencing did not affect the CHOL synthesis pathway (Figure 6B–D). Energy supply in the tumor microenvironment through FA de novo synthesis, FAO, and lipolysis can release large amounts of FAs, thereby promoting tumor cell progression. 23 While the abundance of intracellular CHOL can also be altered by exogenous uptake and regulation of lipid transport, 24 it is speculated that AUP1 silencing alters these key molecules involved in lipid metabolism, and they can be used as tumor biomarkers in ccRCC. The Cancer Genome Atlas database analysis showed that these genes were significantly changed in ccRCC tissues (Figure 6E). Western blot assay showed that the protein levels of SOAT1 and MGLL were significantly higher in ACHN and A498 cells than in HK2 cells, while the expression levels of PRKAA2 and CPT1A in ccRCC cells were significantly lower (Figure 6F). Different from the TCGA database, the expression of STARD5 was lower in ACHN and A498 than in HK2 cells, indicating that the reduction of intracellular lipid transport regulation is an important factor contributing to the increase in lipid contents. Tissue microarray analysis also verified the increased expression of AUP1 in ccRCC tissues compared with paracancer normal tissues (Figure 6G). The above results indicate that AUP1 induces lipid deposition in ccRCC cells by promoting FA de novo synthesis, inhibiting FAO and lipid transport, and regulating lipolysis.
FIGURE 6.
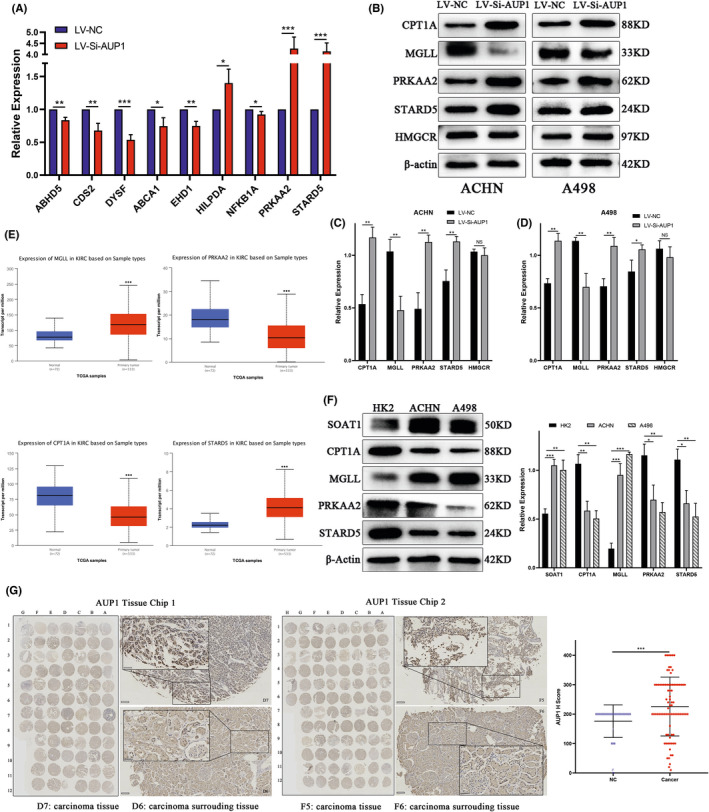
AUP1 mediates lipid reprogramming in clear cell renal cell carcinoma (ccRCC). (A) Quantitative PCR analysis. (B–D) Protein levels in ACHN and A498 cells transfected with LVSi‐AUP1. (E) mRNA expression level of MGLL, PRKAA2, CPT1A, and STARD5 in ccRCC (n = 539) and normal tissue (n = 72) samples in TCGA database. (F) Protein levels in cell lines. (G) AUP1 expression in a ccRCC tissue microarray (scale bars, 100 and 50 μm). *p < 0.05; **p < 0.01; ***p < 0.001
3.8. AUP1 regulates the tumorigenicity of ccRCC cells in vivo
The effect of AUP1 on tumor growth was investigated in vivo by establishing a tumorigenesis model using nude mice. After 28 days of tumor implantation, AUP1 silencing significantly reduced tumor growth (Figure 7A). The tumor weight and volume were also significantly reduced due to AUP1 silencing (Figure 7B,C). Analysis of the bodyweight every 4 days showed that from the 8th day of tumor implantation, the weight of the mice in the AUP1 silencing group began to decline, reached the lowest point on the 12th day, and then returned to the normal baseline level on the 16th day (Figure 7D). However, the weight of the nude mice in the experimental group and the control group was not significantly different. Immunohistochemistry staining of the tumor tissues showed that AUP1 and SOAT1 expression decreased significantly as the tumor volume reduced compared with the expression levels in the control group (Figure 7E,F). These findings suggest that AUP1 silencing in vivo significantly impaired ccRCC tumorigenicity.
FIGURE 7.
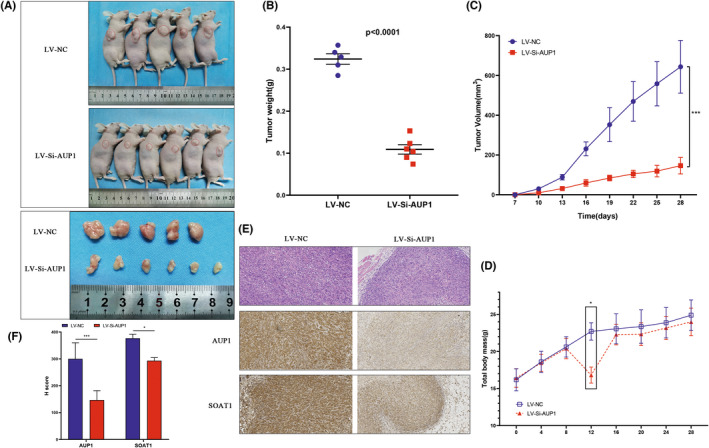
Low expression of AUP1 inhibits the growth of clear cell renal cell carcinoma (ccRCC) in vivo. (A) Images of xenografted tumors in nude mice and subcutaneous tumors on day 28. (B) Scatter plot. (C) Tumor volume. (D) Body weight. (E) Hematoxylin and eosin (HE) staining and immunohistochemistry (IHC) assay. (200×) (F) H score of IHC. *p < 0.05; **p < 0.01; ***p < 0.001
4. DISCUSSION
The cellular metabolic reprogramming induced by lipid accumulation affects multiple physiological processes relevant to carcinogenesis, which involves sustaining proliferative signaling, enabling replicative immortality, evading growth suppressors, inducing angiogenesis, resisting cell death, and avoiding immune destruction. 25 Intracellular lipid droplets (LDs) serve as a source of nutrients for cancer cells and improve cell survival under normoxic and hypoxic conditions. 26 The high proliferation of cancer cells requires large amounts of lipids as building blocks for cell membranes. 27 , 28 Clear cell renal cell carcinoma cells contain abundant lipids and play important functions in energy storage and act as a major source of phospholipid precursors and CHOL for cell membranes. 29
Meisler et al. initially discovered and described AUP1, a protein that contains 410 amino acids and has been mapped to a conserved linkage group on human chromosome 2p13. 30 AUP1 is required for efficient mitophagy and that its function is required for cell survival through prolonged stationary‐phase incubation in a medium containing lactate as a carbon source. 31 Lipid droplets are not only involved in lipid storage but also facilitate proteasome protein degradation and autophagy. 32 While AUP1, which is located both in the endoplasmic reticulum (ER) membrane and the surface of the LD, is an LD‐related protein involved in ER‐associated degradation. AUP1 contains an N‐terminal hydrophobic region (called the LD‐targeting domain) that directs the protein on the membrane. 33 In addition, AUP1 contains an acyltransferase domain, a CUE domain, and a UBE2G2 binding domain (G2BR). The CUE domain is known to bind ubiquitin, and G2BR assists ER‐associated protein degradation by binding to the soluble ubiquitin–conjugating enzyme Ubc7. 34 , 35 Based on its structural properties, AUP1 provides a direct molecular link between LD particle clustering and the ubiquitination‐mediated degradation of misfolded ER proteins. AUP1 also controls lipid synthesis by inducing ubiquitination and the subsequent degradation of several key regulators of lipid biosynthesis. Therefore, AUP1 expression affects the amount and size of LDs, and consequently, AUP1 plays a dual role in protein quality control and LD regulation. 36 , 37
The proliferation of cancer cells requires close coordination between lipid metabolism and cell cycle progression. Cell division requires the synthesis of phospholipids that constitute the plasma membrane. However, de novo FA synthesis is essential to provide the FA required for phospholipid synthesis. 38 In addition, CHOL not only affects the distribution of phospholipids during mitosis but also governs the formation of a vesicular network at the midbody during cytokinesis. 39 In vivo experiments confirmed that the reduction of lipid content, including FA and CHOL, greatly reduces energy supply and biofilm synthesis to maintain cell proliferation, as well as cell cycle arrest and EMT reversal. AUP1 controls a series of complex lipid metabolism cascade pathway processes and directly interferes with tumor progression. Lipid accumulation in ccRCC may trigger EMT as follows: (i) Tumor cells are always self‐synthesizing FAs to maintain rapid proliferation and achieve survival. This approach balances cellular redox levels by consuming reduced equivalents of NAPDH, thereby protecting cells from oxygen free radicals. These create conditions for tumor EMT. 40 (ii) Fatty acid synthase (FASN) can induce the formation and stabilization of lipid rafts, thereby promoting the phosphorylation and degradation of E‐cadherin or altering the level of palmitoylation of Wnt and activating the Wnt/β‐catenin signaling pathway to induce EMT. 40 , 41 (iii) As a key component, changes in CHOL levels affect the structure and function of lipid rafts. Lipid rafts are closely related to signal transduction in EMT through factors such as osteopontin. The latter can activate MAPK, PI3K/AKT, and NF‐κB to enhance MMP2 and MMP9 expression, thereby promoting EMT. 42 , 43
SOAT1, also known as acetyl‐CoA acetyltransferase 1 (ACAT1), belongs to the acyltransferase family and is located in the ER. 22 SOAT1 mainly catalyzes the formation of CE from intracellular free CHOL and stores them in LDs. 44 It can also provide acyl units for acetyl‐CoA at the initial stage of palmitic acid biosynthesis. The acetyl‐CoA is transferred to the sulfhydryl group of the acyl carrier protein under the action of acetyltransferase, which finally forms the product catalyzed by the FASN complex, thus promoting the synthesis of FA. 45 , 46 SOAT1 inhibition significantly reduces de novo lipid synthesis and suppresses SREBP‐1–mediated FA synthesis, causing prostate cancer and glioblastoma cell death. 47 , 48 SOAT1‐mediated acetylation represses FASN degradation and stabilizes FASN, thereby promoting lipid synthesis and hepatocarcinogenesis. 46 ACAT1 upregulation in ccRCC is responsible for the high ACAT enzyme activity, which leads to the accumulation of LDs, and ACAT activity and ACAT1 expression are related to tumor grade, 49 , 50 consistent with the experimental results of the present study.
It has been reported that AUP1 can mediate the ubiquitination of HMGCR. 33 AUP1 knockdown did not significantly affect HMGCR expression, indicating that the regulatory effect of AUP1 on lipid metabolism in ccRCC is not through the synthesis of intracellular CHOL. The reprogramming of lipid metabolism in cancer cells involves numerous pathways and is often not the result of a single specific factor. 51 Considering the key role of FAO in the energy homeostasis of tumors, it was suspected that AUP1 induces lipid deposition in ccRCC through FAO inhibition. AUP1 inhibition significantly increased the expression of CPT1A, which is a key enzyme for carnitine‐dependent transport through the mitochondrial inner membrane, and its deficiency leads to a reduced rate of FAO activity. 52 Fatty acid oxidation activity is elevated in most other solid tumors but reduced in ccRCC. 53 , 54 The decrease in CPT1A expression, along with decreased expression of the TCA cycle components, inhibits the entry of pyruvate into the cycle and impairs oxidative phosphorylation, resulting in lipid accumulation in ccRCC. 9
Combined qPCR and immunoblot analyses showed that PRKAA2 (AMPKα2) expression was increased after AUP1 inhibition. It is an important energy‐sensing enzyme that monitors cellular energy status. AMPK activation can phosphorylate and inactivate acetyl‐CoA carboxylase, thereby inhibiting the de novo synthesis of FA. 53 STARD5 containing a steroidogenic acute regulatory‐related lipid transfer domain is often involved in the trafficking of lipids between diverse intracellular membranes. 55 Ablation of the gene leads to a decrease in CHOL efflux and an increase in intracellular neutral lipid accumulation. It can also enhance the ABCA1‐dependent CHOL efflux pathway and reduce lipid accumulation. 56 MGLL encodes a serine hydrolase of the AB hydrolase superfamily that catalyzes the conversion of monoacylglycerides to free FAs and glycerol. 57 By inhibiting lipolysis, the available pool of FA for cancer cell proliferation reduces. Lipolysis can also produce FAs to serve as precursors of essential signaling lipids. 51 This is the first time that MGLL and STARD5 have been proposed as important biomarkers in ccRCC. Immunoblot assay revealed the difference in their expression in cancer cells and normal cells, and future studies can explore their potential biological significance. The mechanism by which AUP1 regulates lipid metabolism and induces lipid accumulation in ccRCC is shown in Figure 8.
FIGURE 8.
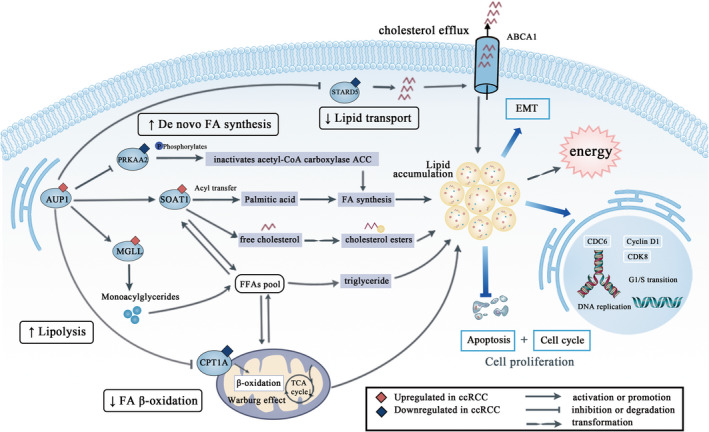
Schematic diagram
In conclusion, a prognostic correlation model for ccRCC was constructed and validated. Results of in vitro, in vivo, and clinical expression data showed that AUP1 induces lipid accumulation in ccRCC through the FA and CHOL pathways to result in lipid reprogramming, thus promoting ccRCC progression. Further analysis of the underlying mechanism would provide a better understanding of lipid metabolism in ccRCC and identify new therapeutic targets.
DISCLOSURE
There is no conflict of interest regarding the publication of this paper.
Supporting information
Table S1.
Table S2.
Table S3.
Figure S1.
Figure S2–S4.
Data S1
ACKNOWLEDGMENTS
This study was funded by the National Natural Science Foundation of China (grant No. 81672553 and 82072816).
Chen C, Zhao W, Lu X, et al. AUP1 regulates lipid metabolism and induces lipid accumulation to accelerate the progression of renal clear cell carcinoma. Cancer Sci. 2022;113:2600‐2615. doi: 10.1111/cas.15445
REFERENCES
- 1. Siegel RL, Miller KD, Fuchs HE, Jemal A. Cancer statistics, 2021. CA Cancer J Clin. 2021;71(1):7‐33. [DOI] [PubMed] [Google Scholar]
- 2. Linehan WM, Ricketts CJ. The cancer genome atlas of renal cell carcinoma: findings and clinical implications. Nat Rev Urol. 2019;16(9):539‐552. [DOI] [PubMed] [Google Scholar]
- 3. Deleuze A, Saout J, Dugay F, et al. Immunotherapy in renal cell carcinoma: the future is now. Int J Mol Sci. 2020;21(7):2532. [DOI] [PMC free article] [PubMed] [Google Scholar]
- 4. Bedke J, Gauler T, Grunwald V, et al. Systemic therapy in metastatic renal cell carcinoma. World J Urol. 2017;35(2):179‐188. [DOI] [PMC free article] [PubMed] [Google Scholar]
- 5. Kammerer‐Jacquet SF, Deleuze A, Saout J, et al. Targeting the PD‐1/PD‐L1 pathway in renal cell carcinoma. Int J Mol Sci. 2019;20(7):1692. [DOI] [PMC free article] [PubMed] [Google Scholar]
- 6. Gupta A, Nath K, Bansal N, Kumar M. Role of metabolomics‐derived biomarkers to identify renal cell carcinoma: a comprehensive perspective of the past ten years and advancements. Expert Rev Mol Diagn. 2020;20(1):5‐18. [DOI] [PubMed] [Google Scholar]
- 7. Yong C, Stewart GD, Frezza C. Oncometabolites in renal cancer. Nat Rev Nephrol. 2020;16(3):156‐172. [DOI] [PMC free article] [PubMed] [Google Scholar]
- 8. Wettersten HI, Aboud OA, Lara PN Jr, Weiss RH. Metabolic reprogramming in clear cell renal cell carcinoma. Nat Rev Nephrol. 2017;13(7):410‐419. [DOI] [PubMed] [Google Scholar]
- 9. Linehan WM, Schmidt LS, Crooks DR, et al. The metabolic basis of kidney cancer. Cancer Discov. 2019;9(8):1006‐1021. [DOI] [PubMed] [Google Scholar]
- 10. Schodel J, Grampp S, Maher ER, et al. Hypoxia, hypoxia‐inducible transcription factors, and renal cancer. Eur Urol. 2016;69(4):646‐657. [DOI] [PMC free article] [PubMed] [Google Scholar]
- 11. Du W, Zhang L, Brett‐Morris A, et al. HIF drives lipid deposition and cancer in ccRCC via repression of fatty acid metabolism. Nat Commun. 2017;8(1):1769. [DOI] [PMC free article] [PubMed] [Google Scholar]
- 12. Drabkin HA, Gemmill RM. Cholesterol and the development of clear‐cell renal carcinoma. Curr Opin Pharmacol. 2012;12(6):742‐750. [DOI] [PubMed] [Google Scholar]
- 13. Hoy AJ, Nagarajan SR, Butler LM. Tumour fatty acid metabolism in the context of therapy resistance and obesity. Nat Rev Cancer. 2021;21(12):753‐766. [DOI] [PubMed] [Google Scholar]
- 14. Wang J, Tan M, Ge J, et al. Lysosomal acid lipase promotes cholesterol ester metabolism and drives clear cell renal cell carcinoma progression. Cell Prolif. 2018;51(4):e12452. [DOI] [PMC free article] [PubMed] [Google Scholar]
- 15. Kim YS, Jung J, Jeong H, et al. High membranous expression of fatty acid transport protein 4 is associated with tumorigenesis and tumor progression in clear cell renal cell carcinoma. Dis Markers. 2019;2019:5702026‐5702027. [DOI] [PMC free article] [PubMed] [Google Scholar]
- 16. Qiu B, Ackerman D, Sanchez DJ, et al. HIF2alpha‐dependent lipid storage promotes endoplasmic reticulum homeostasis in clear‐cell renal cell carcinoma. Cancer Discov. 2015;5(6):652‐667. [DOI] [PMC free article] [PubMed] [Google Scholar]
- 17. Wu G, Wang Q, Xu Y, et al. Targeting the transcription factor receptor LXR to treat clear cell renal cell carcinoma: agonist or inverse agonist? Cell Death Dis. 2019;10(6):416. [DOI] [PMC free article] [PubMed] [Google Scholar]
- 18. Lim YJ, Koh J, Kim K, et al. Clinical implications of cytotoxic T lymphocyte Antigen‐4 expression on tumor cells and tumor‐infiltrating lymphocytes in extrahepatic bile duct cancer patients undergoing surgery plus adjuvant chemoradiotherapy. Target Oncol. 2017;12(2):211‐218. [DOI] [PubMed] [Google Scholar]
- 19. Clark AD, Oldenbroek M, Boyer TG. Mediator kinase module and human tumorigenesis. Crit Rev Biochem Mol Biol. 2015;50(5):393‐426. [DOI] [PMC free article] [PubMed] [Google Scholar]
- 20. Lim N, Townsend PA. Cdc6 as a novel target in cancer: oncogenic potential, senescence and subcellular localisation. Int J Cancer. 2020;147(6):1528‐1534. [DOI] [PMC free article] [PubMed] [Google Scholar]
- 21. Okayama H. Cdc6: a trifunctional AAA+ ATPase that plays a central role in controlling the G(1)‐S transition and cell survival. J Biochem. 2012;152(4):297‐303. [DOI] [PubMed] [Google Scholar]
- 22. Hai Q, Smith JD. Acyl‐coenzyme A: cholesterol acyltransferase (ACAT) in cholesterol metabolism: from its discovery to clinical trials and the genomics era. Metabolites. 2021;11(8):543. [DOI] [PMC free article] [PubMed] [Google Scholar]
- 23. Koundouros N, Poulogiannis G. Reprogramming of fatty acid metabolism in cancer. Br J Cancer. 2020;122(1):4‐22. [DOI] [PMC free article] [PubMed] [Google Scholar]
- 24. Huang B, Song BL, Xu C. Cholesterol metabolism in cancer: mechanisms and therapeutic opportunities. Nat Metab. 2020;2(2):132‐141. [DOI] [PubMed] [Google Scholar]
- 25. Molendijk J, Robinson H, Djuric Z, Hill MM. Lipid mechanisms in hallmarks of cancer. Mol Omics. 2020;16(1):6‐18. [DOI] [PMC free article] [PubMed] [Google Scholar]
- 26. Koizume S, Miyagi Y. Lipid droplets: a key cellular organelle associated with cancer cell survival under Normoxia and hypoxia. Int J Mol Sci. 2016;17(9):1430. [DOI] [PMC free article] [PubMed] [Google Scholar]
- 27. Santos CR, Schulze A. Lipid metabolism in cancer. FEBS J. 2012;279(15):2610‐2623. [DOI] [PubMed] [Google Scholar]
- 28. Liu Q, Luo Q, Halim A, Song G. Targeting lipid metabolism of cancer cells: a promising therapeutic strategy for cancer. Cancer Lett. 2017;401:39‐45. [DOI] [PubMed] [Google Scholar]
- 29. Welte MA, Gould AP. Lipid droplet functions beyond energy storage. Biochim Biophys Acta Mol Cell Biol Lipids. 2017;1862(10 Pt B):1260‐1272. [DOI] [PMC free article] [PubMed] [Google Scholar]
- 30. JSW WJ, Bashir R, Bushby K, Meisler MH. Aup1, a novel gene on mouse chromosome 6 and human chromosome 2p13. Genomics. 1996;36(2):366‐368. [DOI] [PubMed] [Google Scholar]
- 31. Tal R, Winter G, Ecker N, Klionsky DJ, Abeliovich H. Aup1p, a yeast mitochondrial protein phosphatase homolog, is required for efficient stationary phase mitophagy and cell survival. J Biol Chem. 2007;282(8):5617‐5624. [DOI] [PubMed] [Google Scholar]
- 32. Mardinoglu A, Boren J. AUP1 (ancient ubiquitous protein 1): a molecular link between hepatic lipid mobilization and VLDL secretion. Arterioscler Thromb Vasc Biol. 2017;37(4):609‐610. [DOI] [PubMed] [Google Scholar]
- 33. Jo Y, Hartman IZ, DeBose‐Boyd RA. Ancient ubiquitous protein‐1 mediates sterol‐induced ubiquitination of 3‐hydroxy‐3‐methylglutaryl CoA reductase in lipid droplet‐associated endoplasmic reticulum membranes. Mol Biol Cell. 2013;24(3):169‐183. [DOI] [PMC free article] [PubMed] [Google Scholar]
- 34. Stevanovic A, Thiele C. Monotopic topology is required for lipid droplet targeting of ancient ubiquitous protein 1. J Lipid Res. 2013;54(2):503‐513. [DOI] [PMC free article] [PubMed] [Google Scholar]
- 35. Lohmann D, Spandl J, Stevanovic A, Schoene M, Philippou‐Massier J, Thiele C. Monoubiquitination of ancient ubiquitous protein 1 promotes lipid droplet clustering. PLoS One. 2013;8(9):e72453. [DOI] [PMC free article] [PubMed] [Google Scholar]
- 36. Klemm EJ, Spooner E, Ploegh HL. Dual role of ancient ubiquitous protein 1 (AUP1) in lipid droplet accumulation and endoplasmic reticulum (ER) protein quality control. J Biol Chem. 2011;286(43):37602‐37614. [DOI] [PMC free article] [PubMed] [Google Scholar]
- 37. Spandl J, Lohmann D, Kuerschner L, Moessinger C, Thiele C. Ancient ubiquitous protein 1 (AUP1) localizes to lipid droplets and binds the E2 ubiquitin conjugase G2 (Ube2g2) via its G2 binding region. J Biol Chem. 2011;286(7):5599‐5606. [DOI] [PMC free article] [PubMed] [Google Scholar]
- 38. Ow JR, Cadez MJ, Zafer G, et al. Remodeling of whole‐body lipid metabolism and a diabetic‐like phenotype caused by loss of CDK1 and hepatocyte division. eLife. 2020;9:e63835. [DOI] [PMC free article] [PubMed] [Google Scholar]
- 39. Blank HM, Papoulas O, Maitra N, et al. Abundances of transcripts, proteins, and metabolites in the cell cycle of budding yeast reveal coordinate control of lipid metabolism. Mol Biol Cell. 2020;31(10):1069‐1084. [DOI] [PMC free article] [PubMed] [Google Scholar]
- 40. Li M, Bu X, Cai B, et al. Biological role of metabolic reprogramming of cancer cells during epithelialmesenchymal transition (review). Oncol Rep. 2019;41(2):727‐741. [DOI] [PubMed] [Google Scholar]
- 41. Li J, Dong L, Wei D, Wang X, Zhang S, Li H. Fatty acid synthase mediates the epithelial‐mesenchymal transition of breast cancer cells. Int J Biol Sci. 2014;10(2):171‐180. [DOI] [PMC free article] [PubMed] [Google Scholar]
- 42. Murai T. The role of lipid rafts in cancer cell adhesion and migration. Int J Cell Biol. 2012;2012:763283‐763286. [DOI] [PMC free article] [PubMed] [Google Scholar]
- 43. Freeman MR, Di Vizio D, Solomon KR. The rafts of the medusa: cholesterol targeting in cancer therapy. Oncogene. 2010;29(26):3745‐3747. [DOI] [PubMed] [Google Scholar]
- 44. Long T, Sun Y, Hassan A, Qi X, Li X. Structure of nevanimibe‐bound tetrameric human ACAT1. Nature. 2020;581(7808):339‐343. [DOI] [PMC free article] [PubMed] [Google Scholar]
- 45. SL LH, Reynolds KA. Characterization of b‐ketoacyl‐acyl carrier protein synthase III from Streptomyces glaucescens and its role in initiation of fatty acid biosynthesis. J Bacteriol. 1998;180(17):4481‐4486. [DOI] [PMC free article] [PubMed] [Google Scholar]
- 46. Gu L, Zhu Y, Lin X, Tan X, Lu B, Li Y. Stabilization of FASN by ACAT1‐mediated GNPAT acetylation promotes lipid metabolism and hepatocarcinogenesis. Oncogene. 2020;39(11):2437‐2449. [DOI] [PubMed] [Google Scholar]
- 47. Geng F, Cheng X, Wu X, et al. Inhibition of SOAT1 suppresses glioblastoma growth via blocking SREBP‐1‐mediated lipogenesis. Clin Cancer Res. 2016;22(21):5337‐5348. [DOI] [PMC free article] [PubMed] [Google Scholar]
- 48. Liu Y, Wang Y, Hao S, Qin Y, Wu Y. Knockdown of sterol O‐acyltransferase 1 (SOAT1) suppresses SCD1‐mediated lipogenesis and cancer procession in prostate cancer. Prostaglandins Other Lipid Mediat. 2021;153:106537. [DOI] [PubMed] [Google Scholar]
- 49. Matsumoto K, Fujiwara Y, Nagai R, Yoshida M, Ueda S. Expression of two isozymes of acyl‐coenzyme a: cholesterol acyltransferase‐1 and ‐2 in clear cell type renal cell carcinoma. Int J Urol. 2008;15(2):166‐170. [DOI] [PubMed] [Google Scholar]
- 50. Gebhard RLCR, Prigge WF, Figenshau R, Staley NA, Reesey C, Bear A. Abnormal cholesterol metabolism in renal clear cell carcinoma. J Lipid Res. 1987;28(10):1177‐1184. [PubMed] [Google Scholar]
- 51. Minhua Zheng WW, Liu J, Zhang X, Zhang R. Lipid metabolism in tumor immunity. Adv Exp Med Biol. 2021;1316:49‐69. [DOI] [PubMed] [Google Scholar]
- 52. Schlaepfer IR, Joshi M. CPT1A‐mediated fat oxidation, mechanisms, and therapeutic potential. Endocrinology. 2020;161(2):bqz046. [DOI] [PubMed] [Google Scholar]
- 53. Snaebjornsson MT, Janaki‐Raman S, Schulze A. Greasing the wheels of the cancer machine: the role of lipid metabolism in cancer. Cell Metab. 2020;31(1):62‐76. [DOI] [PubMed] [Google Scholar]
- 54. Tan SK, Welford SM. Lipid in renal carcinoma: queen bee to target? Trends Cancer. 2020;6(6):448‐450. [DOI] [PubMed] [Google Scholar]
- 55. Alpy F, Tomasetto C. Give lipids a START: the StAR‐related lipid transfer (START) domain in mammals. J Cell Sci. 2005;118(Pt 13):2791‐2801. [DOI] [PubMed] [Google Scholar]
- 56. Rodriguez‐Agudo D, Malacrida L, Kakiyama G, et al. StarD5: an ER stress protein regulates plasma membrane and intracellular cholesterol homeostasis. J Lipid Res. 2019;60(6):1087‐1098. [DOI] [PMC free article] [PubMed] [Google Scholar]
- 57. Gil‐Ordonez A, Martin‐Fontecha M, Ortega‐Gutierrez S, Lopez‐Rodriguez ML. Monoacylglycerol lipase (MAGL) as a promising therapeutic target. Biochem Pharmacol. 2018;157:18‐32. [DOI] [PubMed] [Google Scholar]
Associated Data
This section collects any data citations, data availability statements, or supplementary materials included in this article.
Supplementary Materials
Table S1.
Table S2.
Table S3.
Figure S1.
Figure S2–S4.
Data S1


