Abstract
The discovery of long noncoding RNAs (lncRNAs) has improved the understanding of development and progression in various cancer subtypes. However, the role of lncRNAs in temozolomide (TMZ) resistance in glioblastoma multiforme (GBM) remains largely undefined. In this present study, the differential expression of lncRNAs was identified between U87 and U87 TMZ‐resistant (TR) cells. lncRNA XLOC013218 (XLOC) was drastically upregulated in TR cells and was associated with poor prognosis in glioma. Overexpression of XLOC markedly increased TMZ resistance, promoted proliferation, and inhibited apoptosis in vitro and in vivo. In addition, RNA‐seq analysis and gain‐of‐function or loss‐of‐function studies revealed that PIK3R2 was the potential target of XLOC. Mechanistically, XLOC recruited specificity protein 1 (Sp1) transcription factor and promoted the binding of Sp1 to the promoters of PIK3R2, which elevated the expression of PIK3R2 in both mRNA and protein levels. Finally, PIK3R2‐mediated activation of the PI3K/AKT signaling pathway promoted TMZ resistance and cell proliferation, but inhibited cell apoptosis. In conclusion, these data highlight the vital role of the XLOC/Sp1/PIK3R2/PI3K/AKT axis in GBM TMZ resistance.
Keywords: chemoresistance, glioma, lncRNA XLOC, Sp1, temozolomide
lncRNA XLOC013218 (XLOC) confers temozolomide (TMZ) resistance of glioma by promoting cell proliferation and inhibiting cell apoptosis via activation of the PIK3R2‐mediated PI3K/AKT signaling pathway in an Sp1‐dependent manner.

Abbreviations
- Cas3
caspase 3
- C‐Cas 3
cleaved caspase 3
- CNS
central nervous system
- GBM
glioblastoma multiforme
- KEGG
Kyoto Encyclopedia of Genes and Genomes
- lncRNAs
long noncoding RNAs
- NHA
normal human astrocyte
- PIK3R2
phosphatidylinositol 3‐kinase regulatory subunit beta
- Sp1
specificity protein 1
- TMZ
temozolomide
- TR
TMZ‐resistant
- XLOC
lncRNA XLOC013218
1. INTRODUCTION
Glioblastoma multiforme (GBM) is a devastating primary malignant tumor in the central nervous system (CNS) associated with poor prognosis despite advancements in surgery, radiation, and chemotherapy. 1 Temozolomide (TMZ), an oral agent with high bioavailability and excellent capability in crossing the blood‐brain barrier, has few side effects and is now the first‐line chemotherapy agent for glioma. 2 , 3 , 4 However, acquired TMZ resistance has limited its treatment benefits. 5 , 6 Therefore, there is an urgent need to explore the mechanisms of the developing resistance and to seek new approaches to overcome TMZ resistance in GBM.
LncRNA is a class of RNAs with over 200 nucleotides lacking protein‐coding capacity, and it possesses extensive biological functions, including regulatory functions such as gene expression and protein stability in various physiological and pathological processes. Recently, emerging studies have shown that long noncoding RNAs (lncRNAs) participated in the regulation of chemoresistance in various cancers, including glioma. 7 , 8 , 9 , 10 However, the role of lncRNAs in TMZ resistance has not been fully explored.
In our previous study, lncRNA and mRNA microarray analysis was performed between U87 parent and U87 TMZ‐resistant (U87TR) cells. Among 2692 differentially expressed lncRNAs (fold change >2.0, FDR <0.05), lncRNA XLOC013218 (XLOC) with 750 base pairs (bp) showed remarkable upregulation, which piqued our interest. Furthermore, we found that XLOC expression was positively correlated with the grade of glioma, and recurrent glioma patients showed increased expression of XLOC when compared with primary glioma. Importantly, high XLOC expression predicted a poorer prognosis. However, much is unknown about the role of XLOC and the underlying mechanisms in TMZ resistance of GBM.
Numerous studies have reported that the phosphatidylinositol 3‐kinase/Akt (PI3K/AKT) signaling pathway is associated with cellular transformation, tumorigenesis, 11 cancer progression, and drug resistance 12 in various types of cancer, including glioblastoma. 13 In our current study, pathway enrichment analysis of GSE100736 (GEO database, https://www.ncbi.nlm.nih.gov/geo/) showed that the PI3K/AKT signaling pathway was activated in U251 TR cells when compared with U251 cells. Furthermore, expression profiling of U251 V‐XLOC and U251 V‐NC by RNA‐seq also indicated activation of the PI3K/AKT signaling pathway. PIK3R2 (p85β) is known as phosphoinositide‐3‐kinase regulatory subunit 2 and is implicated in the activation of the PI3K/AKT pathway. 14 , 15 Moreover, PIK3R2 was remarkably upregulated when XLOC was overexpressed in U87 and U251 cells. However, whether the PIK3R2‐mediated PI3K/AKT signaling pathway participates in XLOC regulation of TMZ resistance in glioma or the mechanisms of XLOC in regulation of PIK3R2 expression is not fully understood.
In the present study, we found that lncRNA XLOC promoted TMZ resistance and cell proliferation while inhibiting cell apoptosis by targeting the PIK3R2‐mediated PI3K/AKT signaling pathway in an Sp1‐dependent manner in glioma. Data obtained from GBM cell lines, xenografts, and clinical samples consistently provided detailed information on the mechanisms. Thus, our research shed light on the characterization of XLOC as the potential therapeutic target to overcome TMZ resistance in glioma.
2. MATERIALS AND METHODS
2.1. Clinical specimens
All 128 human glioma tissue samples were obtained from patients in the Department of Neurosurgery, Zhujiang Hospital, Southern Medical University. Glioma surgical specimens, including 73 grade IV (48 primary GBM and 25 recurrent GBM), 28 grade III, 15 grade II, and 12 grade I samples, were respectively confirmed and classified by two pathologists. 16 In addition, 10 non‐neoplastic brain tissues (as normal control brain) from epileptogenic patients and their relevant clinical information were also collected. All samples were immediately placed in liquid nitrogen after surgical resection. All procedures were performed with ethical approval from the Clinical Biobank Centre at Zhujiang Hospital of Southern Medical University (approval number 2020‐YBK‐001‐02), with informed consent obtained from individuals or their family to utilize the resected tissue for research.
2.2. 5′ and 3′ rapid amplification of cDNA ends (RACE)
RACE was performed with 5’‐RACE system and 3’‐RACE system kit (Invitrogen) according to the manufacturer's instructions. The RACE PCR products were separated on an agarose gel. Then, the bands were cloned into pGM‐T vector (TIANGEN Biotech) and sequenced. The primers used are listed below (GSP: gene‐specific primer):
5’‐RACE: cDNA GSP: GGCCACGCGTCGACTAGTAG;
PCR GSP: CACCTGCACCTCCTCCGTGTTC;
Nest PCR GSP: ATGTCAATGTCGGCACCCACTG;
3’‐RACE: GSP1: CGAAAGCGACAAGGCCGTGATCCCGAAAGC;
GSP2: CAGTGGGTGCCGACATTGACATTC.
2.3. RNA‐seq analysis
Total RNA was extracted from U251 cells after being transfected with V‐NC or V‐XLOC using TriReagent (Sigma‐Aldrich) according to the manufacturer's instructions. HISAT2 (http://daehwankimlab.github.io/hisat2) was used to map RNA‐seq reads to the Human Genome Ensemble GRCh38 with default codes. Raw read counts were imported into R (version 4.1), and differential expression analysis was performed using R package of DESeq2 (version 1.32.0). 17 Differentially expressed genes were selected with fold change >2 and FDR <0.05 by R package edgeR (version 3.34.0) 18 and were subsequently subjected to Gene Ontology (GO) analysis using the Ingenuity Pathway Analysis (IPA) software (QIAGEN).
2.4. Fluorescence in situ hybridization (FISH)
The subcellular localization of XLOC in GBM cells was detected according to the manufacturer's protocol provided by the FISH kit (C10910, RiboBio Tech). In short, after being fixed with 4% paraformaldehyde for 10 minutes, cells were permeabilized in PBS with 0.5% Triton X‐100 on ice for 5 minutes and incubated with prehybridization buffer at 37℃ for 30 minutes. Cells were hybridized with 20 µM using Cy3‐labeled RNA of XLOC FISH probe mix in a moist chamber overnight at 37℃. After being washed with PBS, the cells were stained with DAPI for 10 minutes and sealed prior to fluorescence detection with Carl Zeiss LSM 700 confocal microscopes (Zeiss). The probes against XLOC were synthesized by RiboBio.
2.5. Nucleocytoplasmic separation
Nuclear and cytoplasmic extraction reagents (ThermoFisher) were used for nuclear‐cytoplasm separation, and RNA was extracted for RT‐PCR. Briefly, 5 × 10⁶ cells were resuspended in 0.6 ml resuspension buffer for 15 minutes incubation, followed by homogenization. After centrifugation, the cytoplasmic fraction was acquired from the supernatant content, whereas the remaining nuclear pellet was lysed again using nuclear isolation buffer and RNase‐free H2O as a nuclear fraction. XLOC expression was determined by qPCR with GAPDH as cytoplasmic control and U1 as nuclear control. The primers used are shown in Tables S1 and S4.
2.6. RNA‐pulldown and mass spectrometry (MS) assay
Antisense nucleotide probes to the XLOC sequence were generated to detect XLOC. Information of probes are presented in Table S2. RNA probes were transcribed in U251 cells using MEGAscript T7 transcription kit (Ambion) and were labeled using pierce RNA 3’ end biotinylation kit (Life Technology). Then, RNA probes were treated with TURBO DNase (Life Technology) and were purified using RNeasy MiniKit (QIAGEN). A GBM cell nuclear pellet was resuspended and homogenized with RIP buffer. RNA probes were incubated with nuclear extract for 1 hour at RT, followed by incubation with Dynabeads Myone Streptavidin C1 (Life Technologies) for 1 hour. The primer sequences are listed in Table S3. XLOC associated proteins were identified by MS or Western blotting.
2.7. RNA‐binding protein immunoprecipitation (RIP) Assay
Binding of XLOC to the transcription factor Sp1 protein was assessed using a RIP kit (Millipore Corporation). Cells were lysed on ice and the supernatant was obtained and incubated with magnetic bead‐antibody. Magnetic beads were washed six times with RIP wash buffer. The sample was digested with proteinase K to extract RNA for subsequent PCR analysis. Antibody against Sp1 (Abcam) and IgG (Millipore Corporation) were used for RIP assay. Immune‐precipitate RNAs were isolated and analyzed by reverse transcription PCR and quantitative PCR. Quantitative PCR primers are presented in Table S4. Total RNAs (input controls) and IgG were used to verify that the detected signals were a result of RNAs specifically binding to Sp1.
2.8. ChIP‐PCR assay
The chromatin immunoprecipitation (ChIP) experiment was performed with a kit (Millipore Corporation) following the manufacturer's protocol. Antibodies against Sp1 were purchased from Abcam. Specific primers for potential binding sites (BS): BS 1, BS 2, BS 3, BS 4, and BS 5 are presented in Table S5.
2.9. Dual‐luciferase reporter assay
To explore the effect of XLOC and Sp1 on PIK3R2 promoter activity, the BS 4 sequence of PIK3R2 promoter was subcloned downstream of the luciferase reporter gene to create pGL3‐PIK3R2 pro–wild‐type (Wt) plasmid. To test the binding specificity, the corresponding mutant was created with changed region BS to create pGL3‐PIK3R2 pro–mut‐type (Mut) plasmid. Then, the plasmids were cotransfected with V‐NC, V‐XLOC, V‐Sp1, or sh‐Sp1 into U251 cells, and luciferase activity was measured using luciferase assay kit (K801–200, BioVision Inc). The relative luciferase activity was measured as firefly fluorescence/Renilla fluorescence.
2.10. In vivo studies
Four‐ to five‐week‐old female BALB/c nude mice were obtained from the Laboratory Animal Center, Southern Medical University. To study the role of XLOC in TMZ resistance, the mice were randomly divided into four groups (n = 6 per group) (U87 V‐NC, U87 V‐XLOC, U87TR sh‐NC, U87TR sh‐XLOC), and 5 × 10⁶ cells were subcutaneously implanted into the flanks of nude mice. Tumor volume was calculated using the following formula: volume = 0.5 × (length) × (width)2. For the intracranial xenograft model, the mice were randomly divided into four groups (n = 6 per group) (U87 V‐NC, U87 V‐XLOC, U87TR sh‐NC, U87TR sh‐XLOC), and 5 × 10⁵ cells expressing luciferase were injected into the right cerebrum of mice. Intracranial xenograft bioluminescence was determined every week. For TMZ treatment, mice were injected intraperitoneally once every 3 days with TMZ (5 μg/g). The time to death of each mouse was recorded, and the brains were harvested for further analysis. All animal work was approved by the Animal Experiment Ethics Committee of Zhujiang Hospital in accordance with the Institutional Animal Care and Use Committee Guidelines (approval number LAEC‐2020–072).
2.11. Statistical analysis
Statistical analyses were performed using SPSS 24.0 software. The data between the two groups were analyzed by either one‐way analysis of variance (ANOVA) followed by Tukey's post‐hoc test or Student's t test. Survival curves were estimated using the Kaplan‐Meier method and compared statistically using the log‐rank test. The experiments were repeated three times independently. P values <0.05 were considered statistically significant. All data were presented as the mean ± standard deviation (SD).
3. RESULTS
3.1. XLOC expression is elevated in TR cells and is associated with poor prognosis and tumor recurrence for GBM
To identify the potential lncRNA that may influence TMZ resistance, U87TR and U251TR cell lines were established by gradually increasing the dose of TMZ treatment within 6 months as described in our previous study, 19 and microarray analyses were performed to compare lncRNA differential expression profiles between U87 and U87TR cells (Figure 1A). As indicated by lncRNA microarray, XLOC was dramatically upregulated in U87TR cells, which was further identified by qRT‐PCR (Figure 1C). Importantly, 5’‐and 3’‐RACE assays demonstrated that the full length of XLOC transcript was 750 bp (Figure 1B), which was consistent with the sequence of lnc‐FBXL12‐1:2 (https://lncipedia.org/). In addition, glioma cell lines, such as SHG44, U87, U118, U251, and A172 cells, showed higher XLOC expression than normal human astrocyte (NHA) cells (Figure 1D). Moreover, the expression of XLOC was significantly upregulated in glioma when compared with normal brain tissues (Figure S1A) and was especially increased with advanced glioma grade (Figure 1E). In the TCGA database, patients with high‐grade glioma (GBM) had higher expression of XLOC compared with normal patients (Figure S1B). Importantly, recurrent GBM patients who underwent at least 6 months of TMZ treatment had much higher XLOC levels (Figure 1F). Additionally, Kaplan‐Meier analysis showed that patients with higher XLOC expression were more likely to have poor overall rates of survival (Figure 1G), which were further validated by TCGA data analysis (Figure S1C). Taken together, these data suggest that XLOC upregulation indicated TMZ‐resistance and correlated with poor prognosis in glioma.
FIGURE 1.
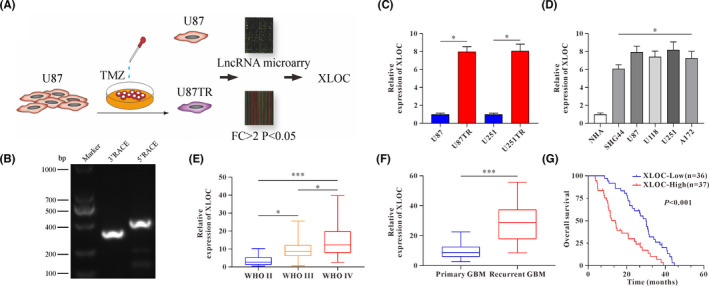
lncRNA XLOC013218 (XLOC) upregulation correlates to temozolomide (TMZ) resistance and poor prognosis in glioma. A, Experiment design to investigate the role of lncRNAs in glioblastoma multiforme (GBM) TMZ resistance. B, Agarose gel electrophoresis showed the PCR products amplified from 5’ RACE and 3’ RACE of XLOC. C, XLOC expression level in TMZ‐resistant (TR) cells and their parent cells. D, Expression levels of XLOC in normal human astrocyte (NHA) cells and glioma cells (SHG44, U87, U118, U251, and A172). E, XLOC expression in high‐grade gliomas (WHO III‐IV) and low‐grade gliomas (WHO II). F, XLOC expression in primary and recurrent GBM tissues. G, 73 GBM patients were classified into two groups (XLOC‐low, n = 36; XLOC‐high, n = 37) based on median value of XLOC; Kaplan‐Meier overall survival analysis of GBM patients based on XLOC expression. Data are presented as the mean ± SD of three independent experiments. *p < 0.05, **p < 0.01, ***p < 0.001
3.2. XLOC confers TMZ resistance, facilitates cell proliferation, and inhibits cell apoptosis
Specific short hairpin RNA target XLOC (sh‐XLOC) or sh‐NC were transfected into U87TR and U251TR cells to knock down XLOC expression, whereas for stable XLOC overexpression, U87 and U251 cells were transfected with V‐XLOC (virus‐lncRNA XLOC) or V‐NC (virus‐negative control), respectively (Figure S1D, E). CCK‐8 assay showed that overexpression of XLOC in U87 and U251 cells significantly promoted TMZ resistance with higher IC50 values (Figure 2A) and increased cell viability (Figure 2B) when compared with V‐NC groups with TMZ (50μg/ml) treatment. Conversely, decreased cell viability with lower IC50 values were observed after knockdown of XLOC in U87TR and U251TR cells (Figure 2C, D). In addition, EdU‐positive cells were significantly increased in V‐XLOC groups (Figure 2E). In contrast, XLOC knockdown led to significantly decreased EdU‐positive cells in TR cells (Figure 2F). Consistently, colony‐forming ability was significantly promoted by XLOC (Figure 2G). Additionally, the rate of apoptosis was significantly decreased in V‐XLOC groups when compared with V‐NC groups with TMZ treatment in parent cells (Figure 2H). However, in TR cells, knockdown of XLOC significantly increased the rate of apoptosis (Figure 2H). These data collectively indicated that XLOC promoted TMZ resistance, facilitated cell proliferation, and inhibited cell apoptosis.
FIGURE 2.
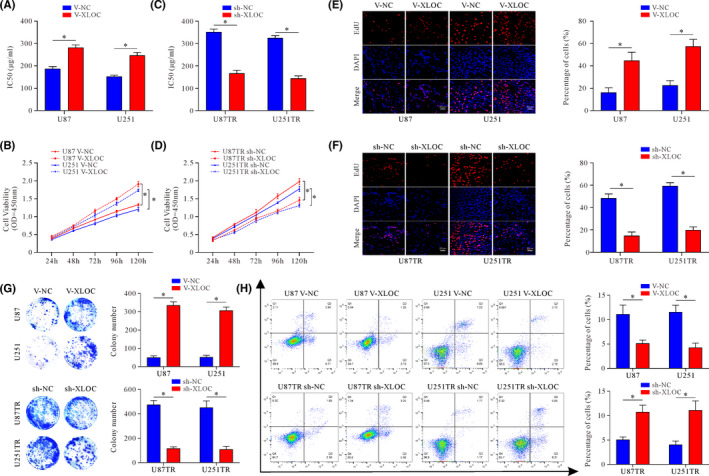
lncRNA XLOC013218 (XLOC) confers temozolomide (TMZ) resistance, facilitates cell proliferation, and inhibits cell apoptosis. A, TMZ sensitivity of U87 and U251 cells after V‐NC or V‐XLOC transfection. B, Cell viability of U87 and U251 V‐NC or V‐XLOC cells treated with TMZ (50 μg/ml) for 24, 48, 72, 96, and 120 h. C, TMZ sensitivity of U87TR and U251TR cells after sh‐NC or sh‐XLOC transfection. D, Cell viability of U87TR and U251TR sh‐NC or sh‐XLOC cells treated with TMZ (50 μg/ml) for 24, 48, 72, 96, and 120 h. E‐H, EdU cell proliferation assays (E) (scale bar, 50 μm), colony formation assay (F), and flow cytometric apoptosis assays (G, H) of XLOC‐overexpressed cells, XLOC‐knockdown cells, and their control cells. Data are presented as the mean ± SD of three independent experiments. *p < 0.05
3.3. PIK3R2 is the potential target of XLOC
To determine the subcellular localization of XLOC, RNA in situ hybridization (RNA‐ISH) was conducted. XLOC was mainly located in the cytoplasm in parent cells, but there was higher XLOC expressed in the nuclei of TR cells (Figure 3A, Figure S1F). Moreover, the nuclear and cytoplasmic fractions of glioma cells were separated, and qRT‐PCR assays were subsequently performed. Consistently, the results confirmed this nuclear and cytoplasm distribution (Figure 3B).
FIGURE 3.
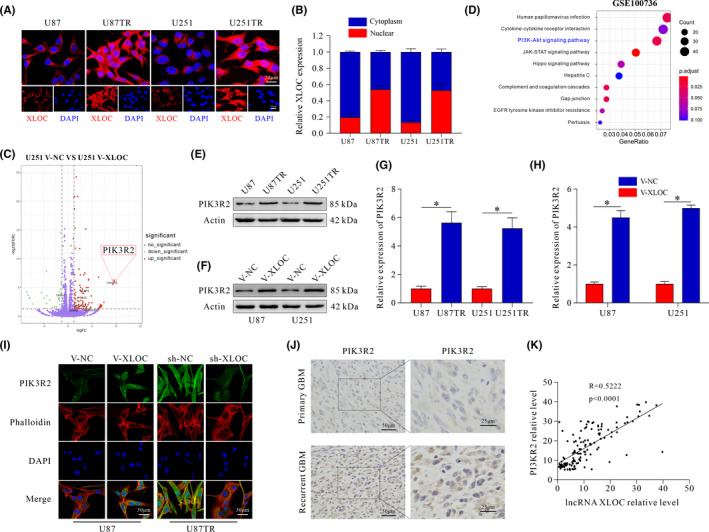
PIK3R2 serves as the target gene of lncRNA XLOC013218 (XLOC). A, Cellular localization of XLOC in U87, U87TR, U251, and U251TR cells (scale bar, 20 μm/10 μm). B, Nuclear and cytoplasmic distribution of XLOC. C, Volcano plot displaying differentially expressed genes between U251 V‐NC and U251 V‐XLOC. D, Pathway enrichment analysis of differentially expressed genes in U251 and U251TR cells (mRNA profiles from GSE100736). E‐G, Expression of PIK3R2 in TR cells and its parental cells. F‐H, PIK3R2 expression after transfection with V‐NC or V‐XLOC. I, Expression of PIK3R2 in XLOC‐overexpressed U87 cells, XLOC‐knockdown U87TR cells, and their control cells (scale bar, 30 μm). J, Expression of PIK3R2 in primary and recurrent glioblastoma multiforme (GBM) patients (scale bar, 50/25 μm). K, The correlation analysis of XLOC and PIK3R2 expression. Data are presented as the mean ± SD of three independent experiments. *p < 0.05
To gain insight into the molecular mechanisms underlying the promoted TMZ resistance by XLOC in glioma, we performed RNA sequencing (RNA‐seq) in U251 V‐XLOC and V‐NC cells. We identified 137 genes with significant change in expression (fold change >2.0, FDR <0.05). Of note, PIK3R2 was dramatically upregulated (Figure 3C). Additionally, pathway enrichment analysis of GEO database (GSE100736) showed that the PI3K/AKT signaling pathway was involved in the acquisition of TMZ resistance in U251 cells (Figure 3D). Moreover, PIK3R2 was upregulated in TR cells when compared with parent cells (Figure 3E, G), and overexpression of XLOC increased PIK3R2 expression in both mRNA and protein levels (Figure 3F, H), which was further confirmed by immunofluorescence (IF) staining (Figure 3I). In contrast, weak PIK3R2 immunostaining activity was observed in the sh‐XLOC group (Figure 3I). Recurrent GBM tissues showed high expression of PIK3R2 (Figure 3J). Furthermore, positive correlation was observed between XLOC and PIK3R2 expression (R = 0.5222) (Figure 3K), which was further identified by TCGA analysis (R = 0.35) (Figure S1G). These results indicate that PIK3R2 is a potential target of XLOC in GBM cells.
3.4. PIK3R2 knockdown reverses the enhanced TMZ sensitivity and promotes the cell survivability effect of XLOC
To further explore whether PIK3R2 is involved in the effect of XLOC or not, sh‐PIK3R2 were transfected into cells stably overexpressing XLOC (U87 and U251 V‐XLOC) (Figure 4A). Knockdown of PIK3R2 significantly decreased the sensitivity of GBM cells to TMZ with lower IC50 values (Figure 4B) and suppressed cell viability with TMZ (50μg/ml) treatment when compared with the control groups (Figure 4C, D). Moreover, the percentage of EdU cells was decreased in sh‐PIK3R2 groups (Figure 4E, F). Consistently, colony‐forming ability was significantly inhibited by PIK3R2 knockdown (Figure 4G). However, knockdown of PIK3R2 promoted apoptosis with TMZ treatment (Figure 4H). Taken together, these data indicated that XLOC conferred TMZ resistance and promoted cell survival by targeting PIK3R2.
FIGURE 4.
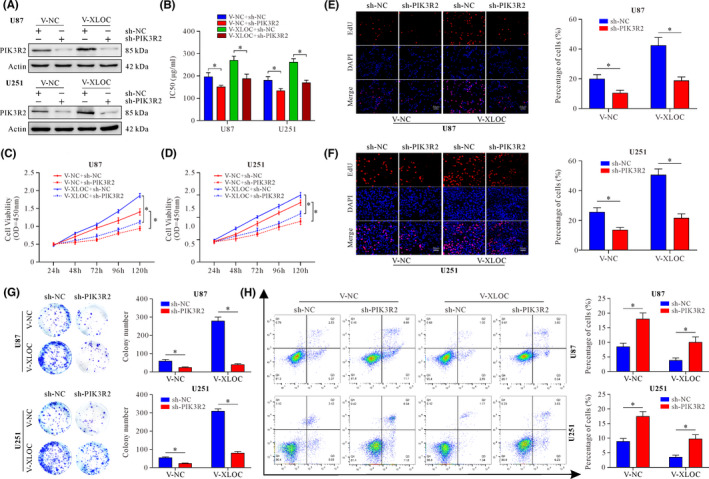
lncRNA XLOC013218 (XLOC) enhances temozolomide (TMZ) resistance, facilitates cell proliferation, and inhibits cell apoptosis through PIK3R2. A, PIK3R2 expression after cotransfection with V‐XLOC and sh‐PIK3R2 or their control. B, TMZ sensitivity of cells after transfection with V‐XLOC and sh‐PIK3R2 or their control. C‐D, Cell viability after cotransfection with V‐XLOC and sh‐PIK3R2 or their control after treatment with TMZ (50 μg/ml) for 24, 48, 72, 96, and 120 h. E‐H, EdU incorporation assay (E, F) (scale bar, 50 μm), colony‐formation assay (G), and flow cytometric apoptosis assay (H) of U87 or U251 XLOC‐overexpressed cells with PIK3R2 knockdown and their control cells. Data are presented as the mean ± SD of three independent experiments. *p < 0.05
3.5. XLOC affects PI3K/AKT signaling pathway–related genes
Enrichment analysis of KEGG pathways identified PI3K/AKT signaling might be regulated by XLOC (Figure 5A). Therefore, PI3K/Akt signaling pathway–related gene expression was explored. The results indicated that overexpression of XOLC upregulated p110β expression and the ratio of p‐PDK1/PDK1, p‐Akt/Akt, p‐mTOR/mTOR, and p‐p70s6K/p70s6K, but inhibited phosphorylation of GSK3β (Figure 5B). In addition, the ratio of p‐eIF4EBP1/eIF4EBP1 and CyclinA2, CyclinD1, and Bcl‐2 expression were increased, whereas the ratio of C‐Cas3/Cas3 and Bax expression were decreased (Figure 5C).
FIGURE 5.
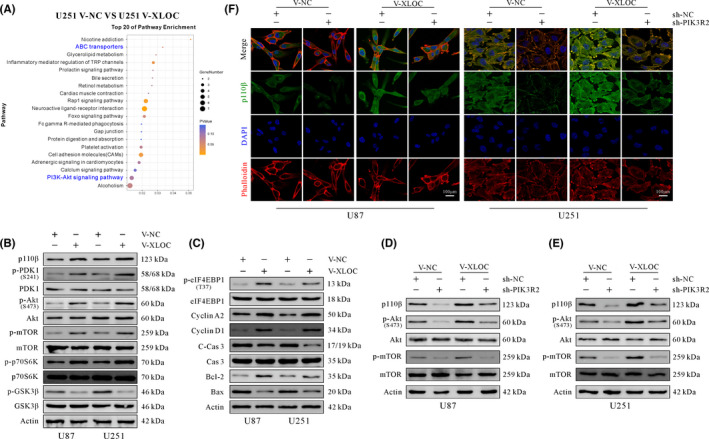
lncRNA XLOC013218 (XLOC) promotes cell proliferation and inhibits cell apoptosis by activating the PIK3R2‐mediated PIK3/AKT signaling pathway. A, KEGG analysis of differentially expressed genes. B, Western blot analysis of PI3K/AKT signaling pathway–related genes. C, Western blot analysis of cell cycle and apoptosis‐associated related genes. D, E, Western blot analysis of PI3K/AKT signaling pathway–related genes in V‐NC or V‐XLOC cells after transfection with sh‐PIK3R2 or sh‐NC. F, Expression of p110β in U87 and U251 cells cotransfected with V‐XLOC and sh‐PIK3R2 or their control (scale bar, 100 μm)
PIK3R2 knockdown significantly suppressed the phosphorylation of Akt and mTOR, as well as the expression of p110β when compared with the sh‐NC–treated group (Figure 5D, E). Furthermore, IF staining showed higher levels of p110β expressed in the V‐XLOC group, while p110β immunoreactivity was weaker in the sh‐PIK3R2 group when compared with the sh‐NC group (Figure 5F). In summary, XLOC confers TMZ resistance, promotes cell proliferation, and inhibits cell apoptosis by upregulating PIK3R2 expression, which further activates the PI3K/AKT signaling pathway.
3.6. XLOC interacts with Sp1 to regulate PIK3R2 expression
To explore the mechanisms underlying XLOC‐mediated upregulation of PIK3R2, RNA pulldown and silver‐staining assays were conducted. We observed a specific band at 75‐100 kDa (Figure 6A), and the MS analysis identified the major protein in this SDS/PAGE band as Sp1 (Figure 6B). To validate this prediction, RNA pulldown and RIP analysis were conducted, and the results confirmed that XLOC specifically binds to Sp1 (Figure 6C, D). PIK3R2 expression was significantly reduced in the sh‐Sp1 group compared with the sh‐NC group (Figure 6E). Moreover, Sp1 expression positively correlated with PIK3R2 expression in clinical specimens (R = 0.4791) (Figure S1H). However, no significant difference was observed regarding Sp1 expression between V‐NC and V‐XLOC groups (Figure 6E).
FIGURE 6.
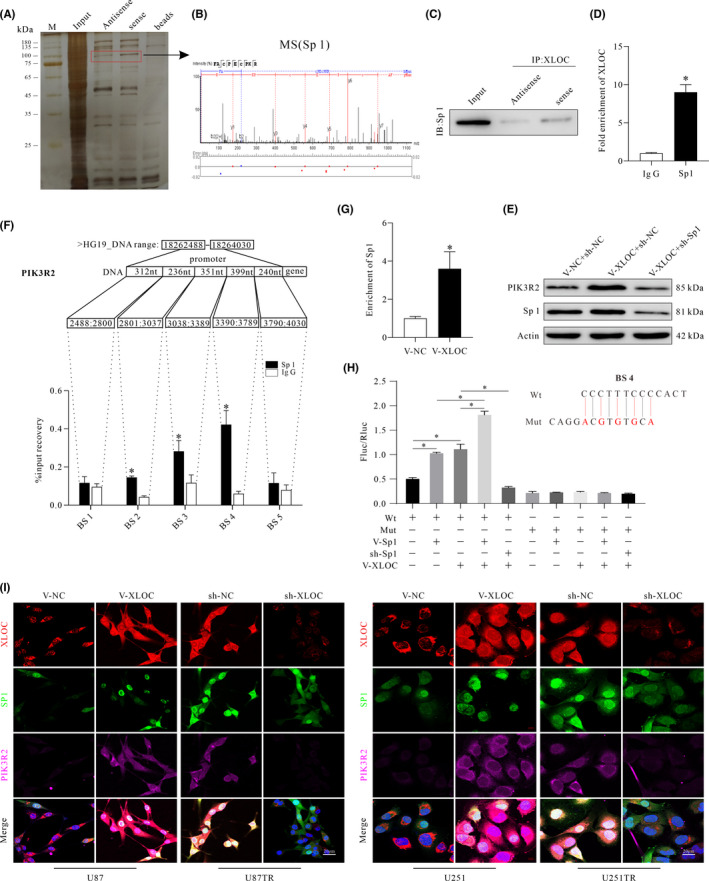
lncRNA XLOC013218 (XLOC) recruits the transcription factor, Sp1, to increase expression of PIK3R2. A, Eluted proteins were resolved by using SDS/PAGE and silver staining. Red box indicates different bound proteins. B, Protein bands identified by mass spectrometry as Sp1. C, Western blot analysis was performed to verify enrichment of Sp1 by XLOC in glioma cells. D, RIP‐qPCR assay was used to verify that Sp1 binds with XLOC. E, Western blot analysis of PIK3R2 and Sp1 expression. F, ChIP assay to determine the binding ability of Sp1 at binding sites (BS) 1‐5 of PIK3R2 promoter region. G, ChIP assay for enrichment analysis of Sp1 after upregulating XLOC expression. H, Dual‐luciferase assay in U251 cells transfected with luciferase construct alone or cotransfected with V‐Sp1, sh‐Sp1, and V‐XLOC. I, Representative images of immunofluorescence staining showing the colocalization of XLOC, Sp1, and PIK3R2 in glioma cells after transfection with V‐XLOC, sh‐XLOC, or their control. Data are presented as the mean ± SD of three independent experiments. *p < 0.05
Analyzing the promoter sequence of PIK3R2 gene using UCSC Genome Browser revealed five potential BS (BS1 to BS5) to Sp1. ChIP assays showed that Sp1 preferentially binds to BS4, but not to BS1, BS2, BS3, or BS5 (Figure 6F). Amplification products in the Sp1 antibody–enriched samples obtained by RT‐qPCR using primers for BS4 were significantly higher in the V‐XLOC group compared with the V‐NC group (Figure 6G). The mutation at the BS4 was performed using a QuikChange site‐directed mutagenesis kit (Agilent), and the mutation loci of BS4 were validated by sequencing (Figure S1I, J). Moreover, dual‐luciferase assay showed that either Sp1 or XLOC failed to stimulate luciferase activity (Fluc/Rluc) when BS4 was mutated. Overexpression of Sp1 and XLOC significantly increased luciferase activity, respectively. V‐XLOC further increased luciferase activity in V‐Sp1–treated cells when compared with V‐NC groups (Figure 6H). However, knockdown of Sp1 eliminated the increased effect of V‐XLOC on luciferase activity. Finally, the colocalization of XLOC, Sp1, and PIK3R2 after transfection with V‐XLOC, sh‐XLOC, or their control showed that upregulation of XLOC correlated with increased expression of intranuclear XLOC and Sp1 and increased PIK3R2 expression (Figure 6I). In contrast, knockdown of XLOC decreased both the expression of PIK3R2 and enrichment of intranuclear XLOC and Sp1 (Figure 6I). Taken together, these data indicated that XLOC promoted PIK3R2 expression by recruiting transcription factor Sp1.
3.7. XLOC as a candidate therapeutic target
In the intracranial xenograft model, the results demonstrated that the tumor growth rate of mice in the U87 V‐XLOC group was significantly increased with shorter survival time compared with the U87 V‐NC group, while U87TR sh‐XLOC–treated mice demonstrated significantly decreased tumor growth rate (Figure 7A) and longer survival time (Figure 7B) when compared with the U87TR sh‐NC group with 5μg/g TMZ treatment. Moreover, the tumor volume and weights were significantly increased in the V‐XLOC group compared with the V‐NC group (Figure 7C–E). However, significantly decreased tumor volume and weights were observed in the sh‐XLOC group when compared with the sh‐NC group (Figure 7C–E).
FIGURE 7.
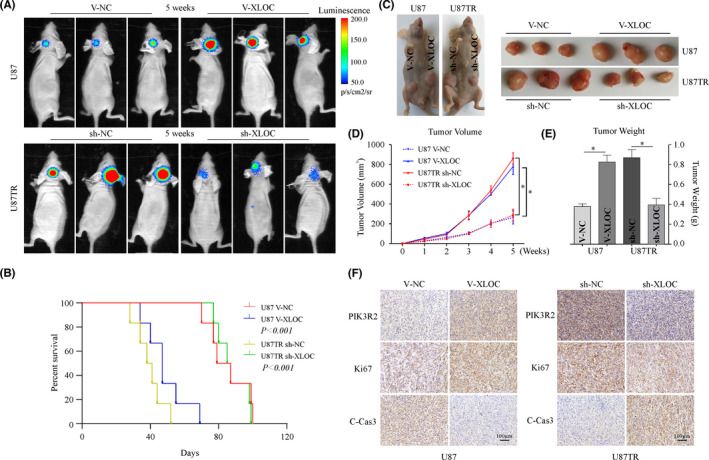
lncRNA XLOC013218 (XLOC)/Sp1/PIK3R2 regulates temozolomide (TMZ) sensitivity of glioblastoma multiforme (GBM) in vivo. A, Representative bioluminescent images of mice bearing intracranial xenografts at 5 weeks with 5 μg/g TMZ treatment (n = 6). B, Overall survival time of the mice (n = 6, log‐rank test). C, D, Photographs of tumors and growth curve of U87 V‐XLOC, U87TR sh‐XLOC, and their control‐treated subcutaneous xenografts tumor after TMZ treatment. E, Weight of tumor xenografts. F, Immunohistochemical stains for PIK3R2, Ki67, and C‐Cas3 expression in xenograft tumors (scale bar, 100 μm) (n = 6). Data are presented as the mean ± SD of three independent experiments. *p < 0.05
Immunohistochemistry analysis revealed that PIK3R2 and Ki67 expression was weakly detected, whereas increased C‐Cas3 expression was observed in XLOC‐overexpressed tumor tissues. Consistently, sh‐XLOC significantly decreased PIK3R2 and Ki67 expression, but increased C‐Cas3 levels when compared with the sh‐NC group (Figure 7F). These findings indicate that the XLOC/Sp1/PIK3R2 axis regulates TMZ sensitivity of GBM in vivo.
4. DISCUSSION
Glioma is the most common and devastating primary malignant brain tumor in adults. 20
Maximal surgical resection followed by radiotherapy and concomitant TMZ chemotherapy is currently the standard treatment for malignant glioma patients, which has significantly increased the median overall survival rate of GBM patients. 21 , 22 However, when GBM patients develop resistance to TMZ therapy, they eventually have recurrent tumors or poor prognosis. 23 Therefore, elucidating the underlying molecular mechanisms of TMZ resistance is paramount in developing effective treatment regimens against GBM.
Recently, the roles of lncRNAs in cancers have been widely explored, and numerous studies have shown that lncRNAs participate in several cancer‐associated processes, including chemoresistance. 9 , 24 , 25 Moreover, abnormal expression of lncRNAs has been shown to be involved in tumorigenesis 26 and the malignant process of glioma. 27 However, lncRNA‐mediated TMZ resistance in GBM has rarely been reported. Herein, we identified XLOC as being distinctly upregulated in TR cells and recurrent GBM tissues. The expression of XLOC was observed to be positively related to the WHO grade of glioma, and GBM patients with high XLOC expression are more likely to have poor prognosis. Gain‐of‐function and loss‐of‐function experiments demonstrated that XLOC promotes TMZ resistance by facilitating cell proliferation and by inhibiting cell apoptosis in vitro and in vivo. These data indicate that XLOC can be a key node of therapeutic intervention as part of GBM treatment.
Using mRNA profiles (GSE100736) from the Gene Expression Omnibus (GEO) database, KEGG analyses of the differentially expressed genes between U251 TR cells and U251 cells indicated that the PI3K/AKT signaling pathway may be associated with TMZ resistance in GBM. RNA‐seq analyses also showed that PIK3R2 was the most upregulated gene in the U251 V‐XLOC–treated group compared with the V‐NC group. Moreover, KEGG analysis of XLOC‐mediated DEGs indicated that ABC transporters and the PI3K/AKT signaling pathway were involved in XLOC‐mediated regulation of TMZ resistance with relatively high enrichment in U251 cells.
PIK3R2 encodes a ubiquitous regulatory subunit (p85β) of PI3K, and increased expression of p85β correlates with PI3K/AKT pathway activation in numerous cancers, including glioma. Previous studies have indicated that PIK3R2 played critical roles in cancer progression and chemoresistance. 28 , 29 For instance, p85β (PIK3R2) could activate p110 activity and AKT‐independent PDK1/SGK3 signaling to promote tumorigenic phenotypes in ovarian cancer. 28 In breast cancer, miR‐126 reduced resistance to trastuzumab by inhibiting the PIK3R2/PI3K/AKT/mTOR signaling pathway. 29 In current studies, knockdown of XLOC decreased PIK3R2 expression, whereas overexpression of XLOC upregulated PIK3R2 expression in both mRNA and protein levels, which is consistent with IF staining results. Besides, the level of p110β, phospho‐Akt, phosphor‐mTOR, and phosphor‐GSK3β proteins was modulated by XLOC. Furthermore, functional studies showed that knockdown of PIK3R2 could partially rescue the promoted cell survival effects induced by overexpression of XLOC with decreased PI3K/AKT signaling pathway activation. These findings indicate that XLOC regulated expression of PIK3R2 and then subsequently regulated the PI3K/AKT pathway to affect the biological behaviors and TMZ sensitivity of GBM cells.
The molecular mechanisms by which lncRNAs exert their biological function in nucleus and cytoplasm are different. 30 , 31 Nuclear lncRNAs regulate transcription greatly by recruiting specific transcriptional regulators onto specific chromosomal loci. 32 In our research, accumulating nuclear localization of XLOC in TR cells was associated with upregulated expression of PIK3R2. Hence, RNA pulldown and MS analyses were performed, and the results indicated that XLOC could interact with Sp1, which was further confirmed by RIP analysis. Sp1 is a transcription factor that is primarily localized in the nucleus and has been shown to be involved in multiple cellular functions, such as modification of target gene tanscription. 33 , 34 Yang et al. revealed that Sp1 expression was increased in TR GBM cells, and Sp1 knockdown promoted TMZ‐induced cell death. 35 In the present study, shRNA‐mediated knockdown of Sp1 significantly attenuated PIK3R2 expression. ChIP and dual‐luciferase assay revealed that Sp1 could bind to PIK3R2 promoter, and that XLOC interacted with Sp1 to promote the binding efficacy of Sp1 to the promoter of PIK3R2. Moreover, tumor xenograft analysis showed that XLOC could regulate TMZ sensitivity in vivo. Taken together, our study reveals the XLOC/Sp1/PIK3R2 axis as an important pathway for acquired TMZ resistance in GBM via maintenance of tumor cell proliferation and apoptosis (Figure 8). Hence, targeting this axis may be a promising therapeutic approach for GBM.
FIGURE 8.
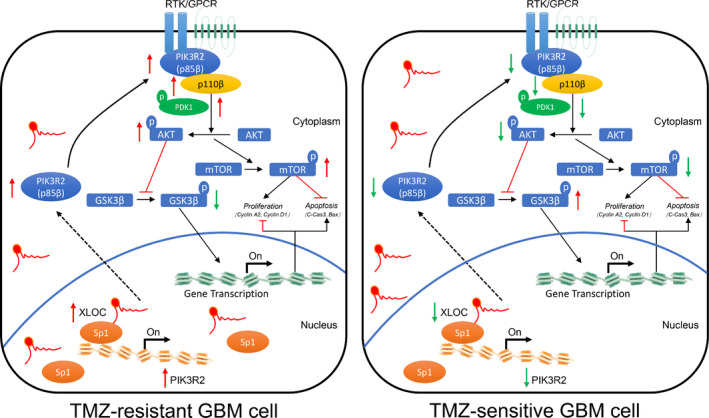
lncRNA XLOC013218 (XLOC) confers temozolomide (TMZ) resistance of glioma by promoting cell proliferation and inhibiting cell apoptosis via activation of the PIK3R2‐mediated PI3K/AKT signaling pathway in an Sp1‐dependent manner
ACKNOWLEDGEMENTS
None.
DISCLOSURE
The authors declare that there is no conflict of interest.
Supporting information
Fig S1
Fig S2
Table S1‐S5
Appendix S1
Zhou J, Xu N, Liu B, et al. lncRNA XLOC013218 promotes cell proliferation and TMZ resistance by targeting the PIK3R2‐mediated PI3K/AKT pathway in glioma. Cancer Sci. 2022;113:2681–2692. doi: 10.1111/cas.15387
Zhou, Xu, and Liu contributed equally to this work.
Funding information
This study was supported by the National Natural Science Foundation of China (82073193, 82003179, 81874079), Natural Science Foundation of Guangdong Province (2017A030308001, 2018A030310422), and Guangdong Provincial Clinical Medical Centre for Neurosurgery (No. 2013B020400005)
REFERENCES
- 1. Lapointe S, Perry A, Butowski NA. Primary brain tumours in adults. Lancet. 2018;392:432‐446. [DOI] [PubMed] [Google Scholar]
- 2. Perry JR, Laperriere N, O'Callaghan CJ, et al. Short‐course radiation plus temozolomide in elderly patients with glioblastoma. N Engl J Med. 2017;376:1027‐1037. [DOI] [PubMed] [Google Scholar]
- 3. Allen BG, Bodeker KL, Smith MC, et al. First‐in‐human phase i clinical trial of pharmacologic ascorbate combined with radiation and temozolomide for newly diagnosed glioblastoma. Clin Cancer Res. 2019;25:6590‐6597. [DOI] [PMC free article] [PubMed] [Google Scholar]
- 4. Weller J, Tzaridis T, Mack F, et al. Health‐related quality of life and neurocognitive functioning with lomustine‐temozolomide versus temozolomide in patients with newly diagnosed, MGMT‐methylated glioblastoma (CeTeG/NOA‐09): a randomised, multicentre, open‐label, phase 3 trial. Lancet Oncol. 2019;20:1444‐1453. [DOI] [PubMed] [Google Scholar]
- 5. Grek CL, Sheng Z, Naus CC, Sin WC, Gourdie RG, Ghatnekar GG. Novel approach to temozolomide resistance in malignant glioma: connexin43‐directed therapeutics. Curr Opin Pharmacol. 2018;41:79‐88. [DOI] [PMC free article] [PubMed] [Google Scholar]
- 6. Hombach‐Klonisch S, Mehrpour M, Shojaei S, et al. Glioblastoma and chemoresistance to alkylating agents: Involvement of apoptosis, autophagy, and unfolded protein response. Pharmacol Ther. 2018;184:13‐41. [DOI] [PubMed] [Google Scholar]
- 7. Ren J, Ding L, Zhang D, et al. Carcinoma‐associated fibroblasts promote the stemness and chemoresistance of colorectal cancer by transferring exosomal lncRNA H19. Theranostics. 2018;8:3932‐3948. [DOI] [PMC free article] [PubMed] [Google Scholar]
- 8. Han P, Li JW, Zhang BM, et al. The lncRNA CRNDE promotes colorectal cancer cell proliferation and chemoresistance via miR‐181a‐5p‐mediated regulation of Wnt/β‐catenin signaling. Mol Cancer. 2017;16:9. [DOI] [PMC free article] [PubMed] [Google Scholar]
- 9. He W, Liang B, Wang C, et al. MSC‐regulated lncRNA MACC1‐AS1 promotes stemness and chemoresistance through fatty acid oxidation in gastric cancer. Oncogene. 2019;38:4637‐4654. [DOI] [PMC free article] [PubMed] [Google Scholar]
- 10. Gooding AJ, Zhang B, Gunawardane L, Beard A, Valadkhan S, Schiemann WP. The lncRNA BORG facilitates the survival and chemoresistance of triple‐negative breast cancers. Oncogene. 2019;38:2020‐2041. [DOI] [PMC free article] [PubMed] [Google Scholar]
- 11. Lu Y, Li X, Liu H, et al. beta‐Trcp and CK1delta‐mediated degradation of LZTS2 activates PI3K/AKT signaling to drive tumorigenesis and metastasis in hepatocellular carcinoma. Oncogene. 2021;40:1269‐1283. [DOI] [PMC free article] [PubMed] [Google Scholar]
- 12. Wu S, Luo M, To KKW, et al. Intercellular transfer of exosomal wild type EGFR triggers osimertinib resistance in non‐small cell lung cancer. Mol Cancer. 2021;20:17. [DOI] [PMC free article] [PubMed] [Google Scholar]
- 13. Liu Y, Yang L, Liao F, Wang W, Wang ZF. MiR‐450a‐5p strengthens the drug sensitivity of gefitinib in glioma chemotherapy via regulating autophagy by targeting EGFR. Oncogene. 2020;39:6190‐6202. [DOI] [PMC free article] [PubMed] [Google Scholar]
- 14. Vallejo‐Díaz J, Chagoyen M, Olazabal‐Morán M, González‐García A, Carrera AC. The Opposing Roles of PIK3R1/p85α and PIK3R2/p85β in Cancer. Trends in Cancer. 2019;5:233‐244. [DOI] [PubMed] [Google Scholar]
- 15. Mirzaa GM, Conti V, Timms AE, et al. Characterisation of mutations of the phosphoinositide‐3‐kinase regulatory subunit, PIK3R2, in perisylvian polymicrogyria: a next‐generation sequencing study. Lancet Neurol. 2015;14:1182‐1195. [DOI] [PMC free article] [PubMed] [Google Scholar]
- 16. Louis DN, Perry A, Reifenberger G, et al. The 2016 World Health Organization Classification of Tumors of the Central Nervous System: a summary. Acta Neuropathol. 2016;131:803‐820. [DOI] [PubMed] [Google Scholar]
- 17. Love MI, Huber W, Anders S. Moderated estimation of fold change and dispersion for RNA‐seq data with DESeq2. Genome Biol. 2014;15:550. [DOI] [PMC free article] [PubMed] [Google Scholar]
- 18. McCarthy DJ, Chen Y, Smyth GK. Differential expression analysis of multifactor RNA‐Seq experiments with respect to biological variation. Nucleic Acids Res. 2012;40:4288‐4297. [DOI] [PMC free article] [PubMed] [Google Scholar]
- 19. Zeng H, Xu N, Liu Y, et al. Genomic profiling of long non‐coding RNA and mRNA expression associated with acquired temozolomide resistance in glioblastoma cells. Int J Oncol. 2017;51:445‐455. [DOI] [PMC free article] [PubMed] [Google Scholar]
- 20. Reifenberger G, Wirsching HG, Knobbe‐Thomsen CB, Weller M. Advances in the molecular genetics of gliomas ‐ implications for classification and therapy. Nat Rev Clin Oncol. 2017;14:434‐452. [DOI] [PubMed] [Google Scholar]
- 21. Fabian D, Guillermo Prieto Eibl MDP, Alnahhas I, et al. Treatment of glioblastoma (GBM) with the addition of tumor‐treating fields (TTF). A Review. Cancers (Basel). 2019;11:174. [DOI] [PMC free article] [PubMed] [Google Scholar]
- 22. Alexander BM, Cloughesy TF. Adult glioblastoma. J Clin Oncol. 2017;35:2402‐2409. [DOI] [PubMed] [Google Scholar]
- 23. Lu C, Wei Y, Wang X, et al. DNA‐methylation‐mediated activating of lncRNA SNHG12 promotes temozolomide resistance in glioblastoma. Mol Cancer. 2020;19:28. [DOI] [PMC free article] [PubMed] [Google Scholar]
- 24. Xie C, Zhang LZ, Chen ZL, et al. A hMTR4‐PDIA3P1‐miR‐125/124‐TRAF6 Regulatory Axis and Its Function in NF kappa B Signaling and Chemoresistance. Hepatology. 2020;71:1660‐1677. [DOI] [PMC free article] [PubMed] [Google Scholar]
- 25. Chen S, Yang M, Wang C, et al. Forkhead box D1 promotes EMT and chemoresistance by upregulating lncRNA CYTOR in oral squamous cell carcinoma. Cancer Lett. 2021;503:43‐53. [DOI] [PubMed] [Google Scholar]
- 26. Mu M, Niu W, Zhang X, Hu S, Niu C. LncRNA BCYRN1 inhibits glioma tumorigenesis by competitively binding with miR‐619‐5p to regulate CUEDC2 expression and the PTEN/AKT/p21 pathway. Oncogene. 2020;39:6879‐6892. [DOI] [PMC free article] [PubMed] [Google Scholar]
- 27. Deng Y, Zhou L, Yao J, et al. Associations of lncRNA H19 Polymorphisms at MicroRNA Binding Sites with Glioma Susceptibility and Prognosis. Mol Ther Nucleic Acids. 2020;20:86‐96. [DOI] [PMC free article] [PubMed] [Google Scholar]
- 28. Rao L, Mak VCY, Zhou Y, et al. p85beta regulates autophagic degradation of AXL to activate oncogenic signaling. Nat Commun. 2020;11:2291. [DOI] [PMC free article] [PubMed] [Google Scholar]
- 29. Fu R, Tong JS. miR‐126 reduces trastuzumab resistance by targeting PIK3R2 and regulating AKT/mTOR pathway in breast cancer cells. J Cell Mol Med. 2020;24:7600‐7608. [DOI] [PMC free article] [PubMed] [Google Scholar]
- 30. Statello L, Guo CJ, Chen LL, Huarte M. Gene regulation by long non‐coding RNAs and its biological functions. Nat Rev Mol Cell Biol. 2021;22:96‐118. [DOI] [PMC free article] [PubMed] [Google Scholar]
- 31. Gil N, Ulitsky I. Regulation of gene expression by cis‐acting long non‐coding RNAs. Nat Rev Genet. 2020;21:102‐117. [DOI] [PubMed] [Google Scholar]
- 32. Guh CY, Hsieh YH, Chu HP. Functions and properties of nuclear lncRNAs‐from systematically mapping the interactomes of lncRNAs. J Biomed Sci. 2020;27:44. [DOI] [PMC free article] [PubMed] [Google Scholar]
- 33. Xu L, Liao WL, Lu QJ, Zhang P, Zhu J, Jiang GN. Hypoxic tumor‐derived exosomal circular RNA SETDB1 promotes invasive growth and EMT via the miR‐7/Sp1 axis in lung adenocarcinoma. Mol Ther Nucleic Acids. 2021;23:1078‐1092. [DOI] [PMC free article] [PubMed] [Google Scholar] [Retracted]
- 34. Li T, Yang X, Li W, et al. ADAR1 stimulation by IFN‐alpha downregulates the expression of MAVS via RNA editing to regulate the Anti‐HBV response. Mol Ther. 2021;29:1335‐1348. [DOI] [PMC free article] [PubMed] [Google Scholar]
- 35. Yang WB, Hsu CC, Hsu TI, et al. Increased activation of HDAC1/2/6 and Sp1 underlies therapeutic resistance and tumor growth in glioblastoma. Neuro Oncol. 2020;22:1439‐1451. [DOI] [PMC free article] [PubMed] [Google Scholar]
Associated Data
This section collects any data citations, data availability statements, or supplementary materials included in this article.
Supplementary Materials
Fig S1
Fig S2
Table S1‐S5
Appendix S1


