

Abstract
Poor chemotherapy response is the main obstacle of ovarian cancer (OC) treatment. Platinum‐refractory and ‐resistant patients are associated with a worse outcome than platinum‐sensitive and partially sensitive patients, but the comprehensive similarities and differences among them are not yet clear. In this study, we analyzed the data of patients with different chemotherapy response in The Cancer Genome Atlas. We found a minority of altered genes were overlapped in refractory and resistant groups, as did the enriched pathways and Gene Ontology terms. We noticed that the neural signaling and drug metabolism enzymes were more significantly enriched and the protein–protein interaction supported these results. The transcription analysis highlighted PDX1 as the common and central transcription factor in both refractory and resistant groups. The competing endogenous RNA (ceRNA) network shared no common ceRNA pairs, indicating a major difference in noncoding RNA post‐transcriptional regulation. In the end, we validated the expression, regulation, binding, and effect on chemotherapy response for selected MNX1‐AS1/hsa‐miR‐4697‐3p/HOXB13 in OC cell lines. Our study offered a novel and comprehensive insight into chemotherapy response, and potential targets for improving chemotherapy response in OC.
Keywords: ceRNA, chemoresistance, HOXB13, miR‐4697‐3p, MNX1‐AS1, ovarian cancer
Our work revealed the chemotherapy response related dysregulated function, transcriptional regulation, and lncRNA based ceRNA regulation landscape in OC, thus offered a novel and comprehensive insight into chemotherapy response. Also, we validated the MNX1‐AS1/ has‐miR‐4697‐3p/ HOXB13 axis could affect carboplatin sensitive for the first time, which could be potential targets for improving chemotherapy response in OC.
![]()
Abbreviations
- ceRNA
competing endogenous RNA
- CRC
colorectal cancer
- CYP
cytochrome P450 enzyme
- DE
differentially enriched
- DEG
differentially enriched gene
- GABA
γ‐aminobutyrate
- GO
Gene Ontology
- HGSOC
high‐grade serous ovarian cancer
- lncRNA
long noncoding RNA
- miRNA
microRNA
- NSCLC
non‐small‐cell lung carcinoma
- OC
ovarian cancer
- OS
overall survival
- PARPi
poly ADP‐ribose polymerase inhibitor
- PCG
protein‐coding gene
- PFI
progression‐free interval
- PFS
progression‐free survival
- PPI
protein–protein interaction
- RNA‐seq
RNA sequencing
- TF
transcription factor
- UGT
diphospho‐glucuronosyltransferase
1. INTRODUCTION
Ovarian cancer is the most lethal gynecological malignancy. More than 70% of OC patients are diagnosed at an advanced stage (stage III or IV), 1 frequently with abdominal metastasis, ascites formation, resistance to chemotherapy and poor prognosis. 2 , 3 Standard treatments for newly diagnosed OC consist of cytoreductive surgery and platinum‐based chemotherapy. 4 Still, approximately 80% of OC patients experience disease recurrence within 6–20 months. 1 It is possible that recurrent patients no longer respond to chemotherapy, resulting in a 5‐year survival rate of only 30%–40%. 1 , 5 , 6 Drug resistance is a difficult problem during cancer treatment, generally causing relapse and even mortality of patients. 7 The response to chemotherapy is important for OC patients' prognosis, and it can be quantified by PFI, which is the interval between the date of last platinum dose and the date of relapse detection. 8 According to PFI length, patients receiving platinum‐based chemotherapy can be categorized into four subgroups: (i) refractory group, including patients who progressed while receiving the last line of platinum‐based therapy or within 4 weeks of last platinum dose; (ii) resistant group, including patients with PFI between 1 and 6 months; (iii) partially sensitive group, including patients with PFI between 6 and 12 months; and (iv) sensitive group, including patients with PFI greater than 12 months. 7 , 9 , 10 , 11
Resistant patients and sensitive or partially sensitive patients account for 23% and 60% of relapse, respectively. 12 Compared to refractory and resistant patients, sensitive and partially sensitive patients usually have a better response rate to sequential treatment (30.9%–47.2% vs. <20%), a longer PFS (5.8–8.6 months vs. 3–4 months), and a longer OS (17.3–18 months vs. 12–15 months). 11 , 13 , 14 Sequential use of single‐agent therapy with a nonplatinum compound is considered standard treatment for refractory or resistant patients, 11 , 14 and the dose‐dense schedule of platinum 15 , 16 or platinum combined with gemcitabine 17 are alternative strategies for resistant patients. Platinum‐based combinations are associated with a better outcome compared with nonplatinum or platinum single agent treatments for sensitive or partially sensitive patients, and platinum doublets or nonplatinum therapy are alternative strategies for partially sensitive patients. 13 , 18 , 19 Although refractory and resistant patients are treated similarly in the clinic, it is not clear whether they are similar in essence.
The metabolic activated platinum eventually transports to the nucleus, binds to DNA, forms DNA adducts, blocks DNA replication, and induces cell death. 20 Any disruption during the process accords chemotherapy resistance to cells, such as drug metabolism (e.g., CYP, GST, and UGT families) or transportation (e.g. ABC transporter and CTR1), cellular metabolism (e.g., glucose, lipids, and glutamine), promotion of DNA repair or tolerance to unrepaired DNA lesions (e.g., ERCC1, XPA, and BRCA1/BRCA2), and cell death inhibition (e.g., bcl‐2, bcl‐xl, mcl‐1, and bax). 21 Of note, PARPi is “synthetically lethal” in cancers harboring BRCA1/BRCA2 inactivating mutations. Recent clinical trials have shown that not only BRCA1/BRCA2 mutation carriers but also noncarriers can benefit from PARPi maintenance treatment. 22 , 23 , 24 Furthermore, PARPi has significantly prolonged PFS or OS in platinum‐sensitive relapsed OC patients from multicenter clinical trials. 23 , 25 , 26
Epigenetic, transcriptional, post‐transcriptional, and post‐translational regulation can affect drug resistance as well. Noncoding RNAs including lncRNAs and miRNAs can regulate PCGs post‐transcriptionally by forming ceRNA, which is a mechanism in which two different RNAs (coding or noncoding) compete for the same miRNA binding site to cross‐regulate each other's expression level. 27 Gradually increasing evidence has shown that ceRNAs are involved in OC drug resistance. For example, an OC tissue microarray identified that UCA1 modulates cisplatin resistance through the miR‐143/FOSL2 pathway, 28 and also regulates the response to cisplatin in OC through miR‐27a‐5p/UBE2N. 29 Moreover, NCALD was reported to act as a ceRNA for CX3CL1 by competing with potential miRs (miR‐27b‐3p, 29b‐3p, 424‐5p, 214‐3p, and miR‐503‐5p), and to affect chemoresistance and the prognosis of OC. 30 The mechanism of drug resistance is multifactorial and individual. Understanding and accurately predicting drug resistance will help in the development of precision medicine.
In this study, we analyzed the similarities and differences in different chemotherapy response groups, including analyses of GO term and pathway enrichment, transcriptional regulation networks, PPI networks, and lncRNAs involved in ceRNA networks in both refractory‐ and resistance‐related DEGs. We also determined that MNX1‐AS1 and HOXB13 act as ceRNAs by competing for the hsa‐miR‐4697‐3p binding site and affecting carboplatin sensitivity in OC cell lines. For the first time, we compared the refractory‐ and resistance‐related differences in OC.
2. MATERIALS AND METHODS
2.1. Analysis of chemotherapy response‐related DEGs
All clinical information, RNA‐seq (https://portal.gdc.cancer.gov), and miRNA‐seq data of The Cancer Genome Atlas‐OC project were downloaded from the GDC data portal, and only the data from frozen samples from primary OC were analyzed.
2.2. Statistical analyses
Each experiment was repeated at least three times. All quantitative data are presented as mean ± SD. Comparison between two groups was carried out by using Student's t‐test. p < 0.05 was recognized as significant. GraphPad Prism 8 was used for statistical analyses.
Detailed information about the materials and methods and primers of genes used in the present study is available in Tables S1 and S2.
3. RESULTS
3.1. Identification of DEGs related to chemotherapy response
A schematic diagram was constructed to display the workflow of our study (Figure 1). The DEG analysis identified 308 genes from RNA‐seq data and 21 miRNAs from miRNA‐seq data related to primary chemotherapy response (refractory‐related genes), including 111 genes (58 protein‐coding genes and 53 non‐coding genes) and 12 miRNAs highly expressed in chemotherapy‐refractory patients, and 197 genes (112 protein‐coding genes and 85 noncoding genes) and nine miRNAs with low expression in chemotherapy‐refractory patients (Figure 2A,B). Our DEG analysis also showed that 411 genes and 38 miRNAs are related to chemotherapy resistance (resistance‐related genes). Among them, 82 genes (including 30 PCGs and 52 noncoding genes) and two miRNAs were highly expressed in chemotherapy‐resistant patients, and 329 genes (205 protein‐coding genes and 124 noncoding genes) and 36 miRNAs had low expression in chemotherapy‐resistant patients (Figure 2B–D). There was a certain overlap between genes associated with low refractoriness and those with low resistance (<50%), but no overlap between genes associated with high refractoriness and those with high resistance (Figure 2E–F), which indicates further study is needed to illustrate whether they were driven by the same mechanism.
FIGURE 1.
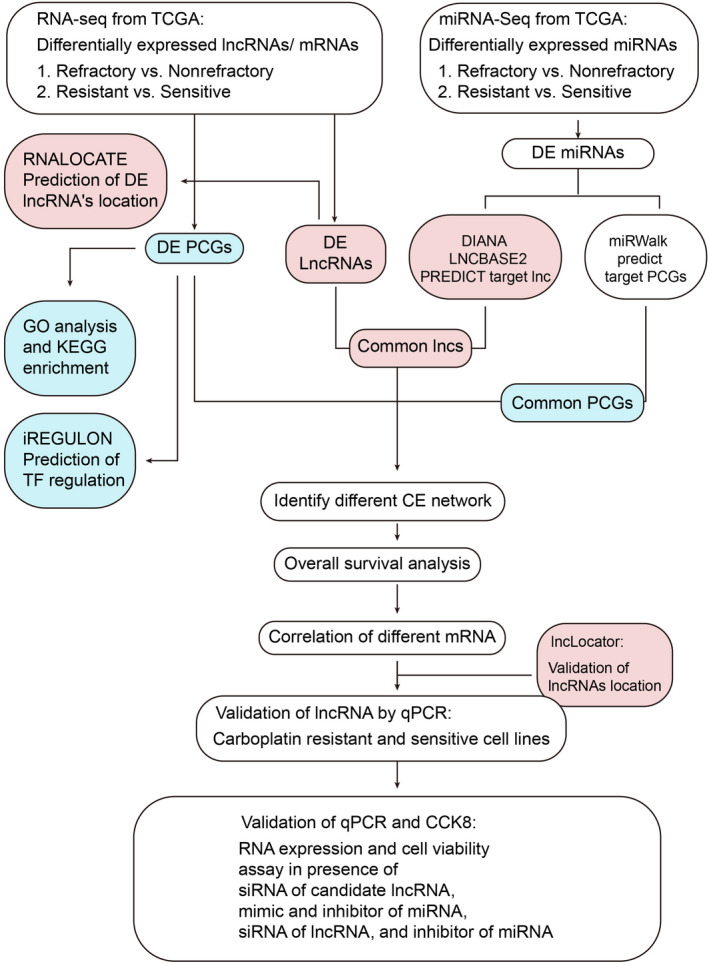
Workflow diagram of chemotherapy resistance‐related competing endogenous RNA construction and validation. DE, differentially enriched; GO, Gene Ontology; KEGG, Kyoto Encyclopedia of Genes and Genomes; lncRNA, long noncoding RNA; PCG, protein‐coding gene; RNA‐seq, RNA sequencing; TCGA, The Cancer Genome Atlas; TF, transcription factor
FIGURE 2.
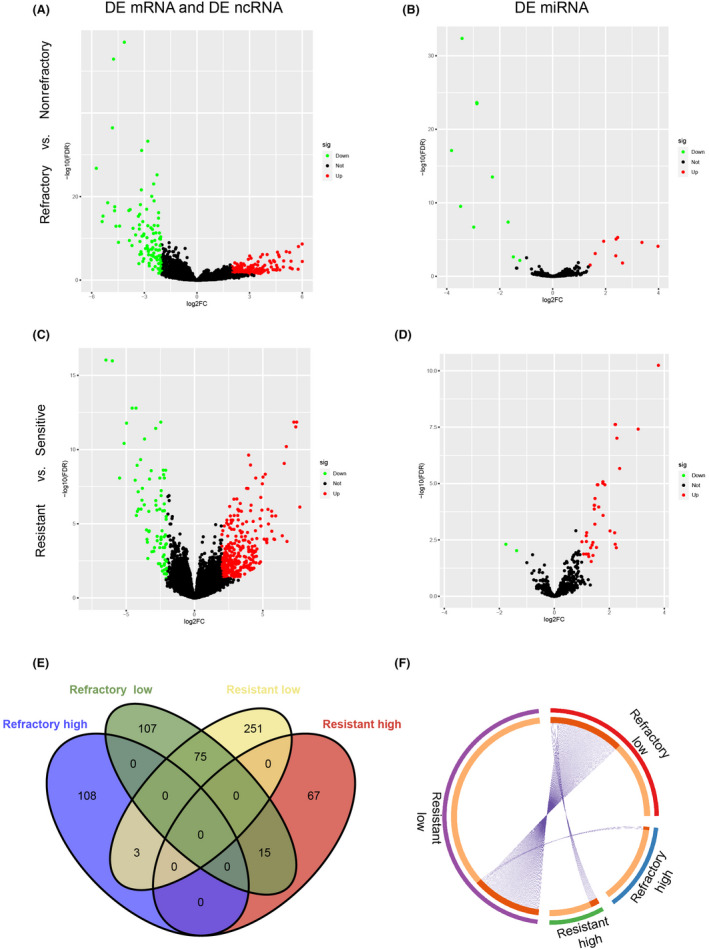
Chemotherapy response‐related differentially enriched genes (DEG) analysis. (A, B) Volcano plots of refractory‐related DEG analysis from RNA sequencing (RNA‐seq) and microRNA sequencing (miR‐seq). (C, D) Volcano plots of resistance‐related DEG analysis from RNA‐seq and miR‐seq. Green dots represent DEGs with significantly low expression, red dots indicate DEGs with significantly high expression, and black dots show genes not significantly expressed. (E, F) Venn diagram (E) and Circos plot (F) show overlap of DEGs. Outside circle with different color represents the identical of each gene list; red inside circle connected by purple lines represents the genes that appear in multiple lists (F)
3.2. Function of chemotherapy response‐related DEGs
Gene Ontology term and pathway enrichment analysis showed a small portion of results in common between refractory‐related DEGs and resistance‐related DEGs (Figure S1B,C). In particular, both refractory‐ and resistance‐related DEGs enriched for ligand‐receptor signaling, synaptic signaling, multiple system development, immunoglobulin complex, tissue homeostasis, and endopeptidase‐ or peptidase‐mediated proteolysis. Chemotherapy refractory‐related DEGs are specifically enriched for regulation of cell growth and anion/acid transport. Chemotherapy resistance‐related DEGs are specifically enriched for regulation of wound healing, ECM, hormone metabolic processes, and humoral immune response (Figures 3A and S1A).
FIGURE 3.
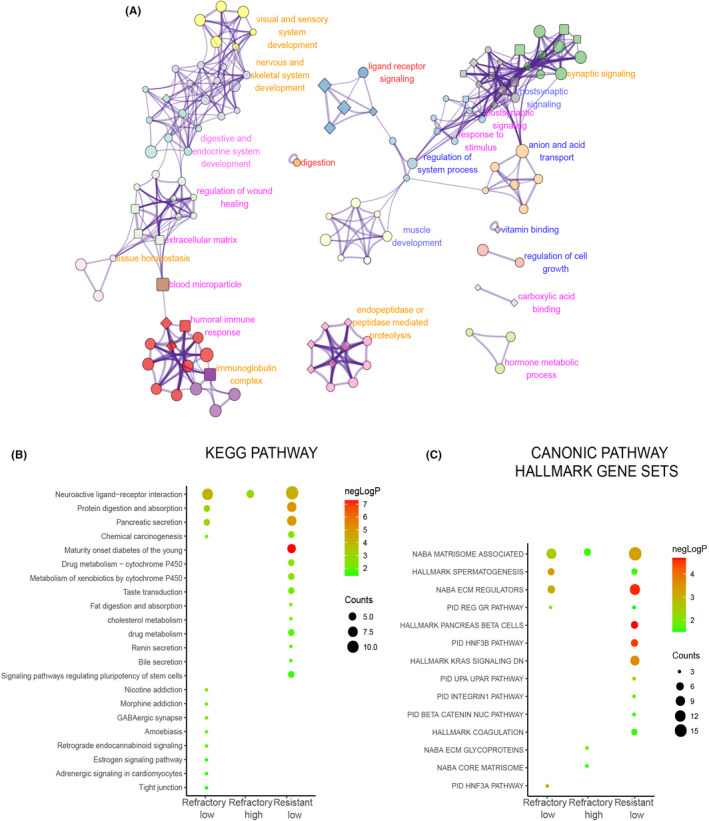
Gene Ontology (GO) term and pathway enrichment for chemotherapy response related differentially enriched genes (DEGs). (A) Top 20 GO term cluster network enriched for chemotherapy response‐related DEGs. Each node represents a specific GO term, and links by an edge when similarity score >0.3. Nodes with the same color belong to the same cluster. Nodes with ellipse, round rectangle, and diamond shape represent enriched biological process, cellular components, and molecular function terms, respectively. The size of the nodes (big, small) correlates with gene counts in the enrichment, common, or majority common clusters between refractory‐related DEGs and resistance‐related DEGs are labeled in red and orange, respectively. Clusters specially enriched in refractory‐ or resistance‐related DEGs are labeled in blue or pink, respectively. (B) Kyoto Encyclopedia of Genes and Genomes (KEGG) pathways enriched for chemotherapy response‐related DEGs. Bubble color and size correlate with‐logP and counts respectively. (C) Canonical pathway hallmark gene sets enriched for chemotherapy response‐related DEGs
In the Kyoto Encyclopedia of Genes and Genomes pathway enrichment analysis, we found that chemical carcinogenesis was enriched in both refractory and resistance underexpressed gene lists, which is important for the formation of DNA adducts. As DNA adduct formation is fundamental for platinum‐based chemotherapy to induce cell death, lower DNA adduct formation in patients was associated with undesirable responses to chemotherapy. 31 In addition, the resistance underexpressed genes were also enriched for cytochrome P450‐mediated metabolism, which might induce platinum‐based antitumor effects through promoting the conversion of platinum to an active form, and signaling pathway regulating the pluripotency of stem cells specifically inclined to mesoderm development (Figure 3B), which was consistent with enrichment of stem cell differentiation in GO terms (Figure S1A). Genes underexpressed in resistant low group were enriched with hallmark KRAS signaling down and beta‐catenin nuclear pathway (inhibitory), which are known to be associated with chemotherapy resistance (Figure 3C). The association between other enriched pathways and chemotherapy resistance or refractoriness generally remained unclear.
3.3. Chemotherapy response‐related transcriptional regulation networks
As GO enrichment results showed that RNA polymerase II‐specific DNA‐binding transcription activator activity was enriched for both refractory‐ and resistance‐related DEGs (Figure S1A), we were curious to determine whether the transcriptional regulations were similar. We found seven TFs in 58 DE PCGs from the refractory high gene list, 18 TFs in 112 DE PCGs from the refractory low gene list, four TFs in 20 DE PCGs from the resistant high gene list, and 34 TFs in the resistant low gene list. There were no common TFs in the refractory and resistant high gene lists, but there were eight common TFs (RBPJL, PRDM14, POU3F4, MNX1, PDX1, HOXB1, HOXC12, and HOXD12) in the refractory and resistant low gene lists, the majority of which belonged to the HOX‐related factors family.
To further clarify whether these DE TFs might be responsible for driving the other DEG expression change through transcription regulation, we constructed a TF regulation network (Figure 4A,B), based on whether certain TF's motif binding sites existed in a DEG's promoter. There were three common TFs (PDX1, POU3F4, and MNX1), five refractory‐specific TFs (PAX7, DLX1, DLX2, DRGX, and FOXI), and six resistance‐specific TFs (HNF1A, POU3F2, LBX1, CUX2, ONECUT1, and ONECUT3) that stood out. Of the refractory related DEGs, 15.58% could be targets of those TFs, and PDX1 was the one predicted with the largest number of targets within the refractory related TF network, followed by POU3F4, MNX1, and PAX7. Targets of PDX1 in refractory‐related TF networks covered almost all targets of other TFs and more frequently showed a strong correlation with PDX1 expression. Notably, a few targets only showed a specific correlation with other TFs, for example, GFRA1 strongly correlated with DLX1/2 and was reported to be associated with chemoresistance in osteosarcoma 32 24.33% resistance‐related DEGs could be targets of those TFs mentioned above, and HNF1A was the one predicted with the largest number of targets within the resistance‐related TF network, followed by PDX1 and POU3F2. Similarly, targets of these TFs overlapped. Although the targets of PDX1 was few, the expression correlation between the same target and PDX1 was generally higher than HNF1A in the resistance‐related TF network. Multiple targets were suspiciously related to chemotherapy response, such as the drug metabolism genes discussed above. Some targets were known to be associated with chemotherapy response, such as SERPINA4, which was proved to associate with platinum sensitivity in HGSOC. 33
FIGURE 4.
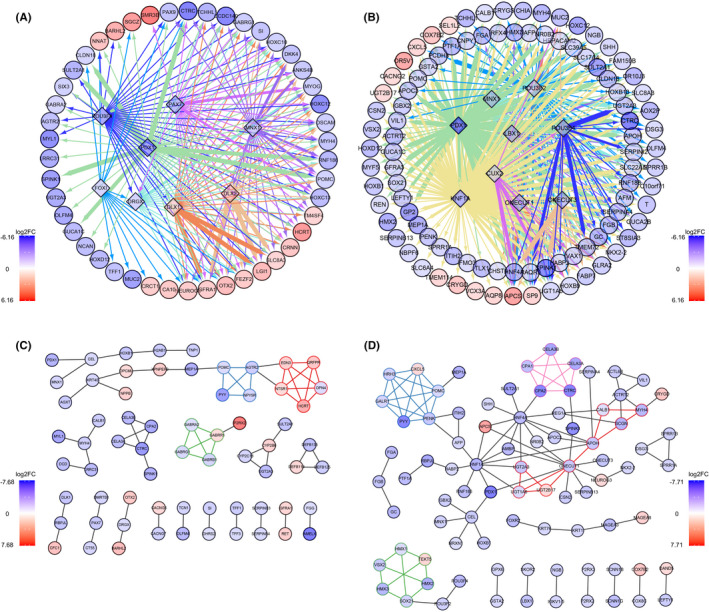
Chemotherapy‐related transcription factor (TF) regulation and protein–protein interaction (PPI) network. (A) Refractory‐related TF regulation network. (B) Resistance‐related TF regulation network. (C) Refractory‐related PPI interaction network. (D) Resistance‐related PPI interaction network. All nodes are colored with log2FC, with refractory or resistant high genes shown in red. Nodes in diamond shape represent TF, nodes in ellipse shape represent target gene. (A, B) The color of the edge represents different source node TF, and the width of the edge represents the Pearson correlation score between genes' expression in certain groups. (C, D) Nodes belonging to PPI subnetworks are bordered and connected with the same color
This analysis showed that PDX1 might be the crucial TF regulating chemotherapy refractoriness and resistance of HGSOC, and DLX1/2 might particularly associate with refractoriness. Transcriptional regulation might be more complicated in resistance of HGSOC, not only because targets shared several TFs, but also because TFs cross‐regulated each other.
3.4. Chemotherapy response‐related PPI networks
Supplementary to GO term and pathway enrichment, the PCGs with physical interaction might be functionally relevant or collaborative. Of the refractory‐related DE PCGs, 38.8% formed the refractory‐related PPI network with three subnetworks. EDN3, QRFPR, NTSR1, HCRT, and OPN4 composed subnetwork1 and were involved in the neuropeptide signaling pathway, ion transport, ion homeostasis, and secretion. POMC, AGTR2, PYY, and NPY5R composed subnetwork2 and were also involved in neuropeptide signaling pathways and secretion. GABRA2, GABRB1, GABRG1, and GABRR1 composed subnetwork3 and GABA receptor complex, which could selectively bind to multiple ligands or drugs, regulated most GABA‐activated physiological activities in the central nervous system. GABA receptors are also expressed in other tissue and differentially expressed in normal and malignant tumor cells. However, their functions in other tissue were largely underdetermined (Figure 4C). Of the resistance‐related DE PCGs, 36.2% formed resistance‐related PPI networks with four subnetworks. UGT1A6, UGT2A3, UGT2B17, ONECUT1, APOH, SCGN, MYH4, and CALB1 composed subnetwork1. The UGT glycolaldehyde acid‐based transfer enzymes are known to take part in multiple metabolic processes including glucuronate, ascorbate, aldarate, porphyrin, chlorophyll, retinol, and monocarboxylic acid. These UGTs also participate in drug metabolism and chemical carcinogenesis, as mentioned in the function enrichment result. CXCL5, POMC, HRH3, PENK, GALR1, and PYY comprised subnetwork2, and were involved in the neuropeptide signaling pathway, G protein‐receptor binding, receptor‐ligand activity, hormone activity, and secretion, which was similar to refractory‐related PPI subnetworks 1 and 2. HMX1, HMX2, HMX3, TEKT5, VSX2, and SOX21 are TFs that made up the subnetwork3. CELA3B, CELA3A, CTRC, CPA1, and CPA2 composed subnetwork4 and are involved in protein digestion and absorption, pancreatic secretion, peptidase activity, and endopeptidase activity (Figure 4D).
The PPI networks reinforced that neuropeptide signaling, secretion, endopeptidase activity, peptidase activity, and metabolic process change were related to chemotherapy response. However, their specific functions in chemotherapy response are not yet fully understood.
3.5. Chemotherapy response‐related ceRNA networks
We noticed that approximately half of the chemotherapy response‐related DEGs were noncoding RNAs, and lncRNA was the main type. According to gene type annotation, there were 91 lncRNAs in refractory‐related DEGs, and 104 lncRNAs in resistance‐related DEGs. As we know, lncRNAs participate in complex regulatory functions by interacting with protein, DNA, and RNA, and the function depends on the subcellular location. The RNALocate database showed that 15 lncRNAs are located in both the cytoplasm and nucleus. One lncRNA is located only in the nucleus and 48 lncRNAs are located only in the cytoplasm in refractory‐related DE lncRNAs. It also showed that in resistance‐related DE lncRNAs, 10 lncRNAs are located both in the cytoplasm and nucleus and 55 lncRNAs are located in the cytoplasm only (Figure S2A). Considering that the majority of chemotherapy response‐related lncRNAs could locate in the cytoplasm, these lncRNAs might function post‐translationally through RNA interaction. Thus, based on RNA expression and computational sequence‐specific binding information, we constructed the lncRNA involved ceRNA networks, theoretically at first, by taking the intersection of predicted targets and DEGs. The refractory‐related ceRNA network contained DE miRs, predicted targets, and DEGs: 44 lncRNAs, 18 miRNAs, and 112 PCGs (Figure 5A). The resistance‐related ceRNA network contained 35 lncRNAs, 34 miRNAs, and 126 PCGs (Figure 5B). To identify the important nodes in these complex networks, we undertook survival analysis and showed that eight PCGs and three lncRNAs, which were highly expressed in the refractory group, were positively associated with unfavorable OS/PFS. Fourteen PCGs and five lncRNAs with low expression in the refractory group were negatively associated with unfavorable OS/PFS (Figure 5A, Table 1). In the resistance‐related ceRNA network, there were 18 PCGs and three lncRNAs with low expression in the resistant group that showed a negative association with unfavorable OS/PFS (Figure 5B, Table 1). After verifying the location of all crucial lncRNAs by LncLocator, which showed none of them with high nuclear localization scores (Figure S2B), the refined ceRNA networks were constructed. Crucial lncRNA–PCG pairs shared common miRNA, and significantly positive expression correlation (Figure S2C,D). Finally, we highlighted the lncRNAs RP11‐366H4.1, RP11‐115D19.1, RP11‐1081 M5.1, RP11‐1081 M5.2, RP11‐184E9.2, CTC‐546 K23.1, RP11‐333A23.4, and FENDRR in the refractory‐related ceRNA network (Figure 5A), and lncRNAs MNX1‐AS1, HNF1A‐AS1, and LINC00261 in the resistance‐related ceRNA network (Figure 5B).
FIGURE 5.
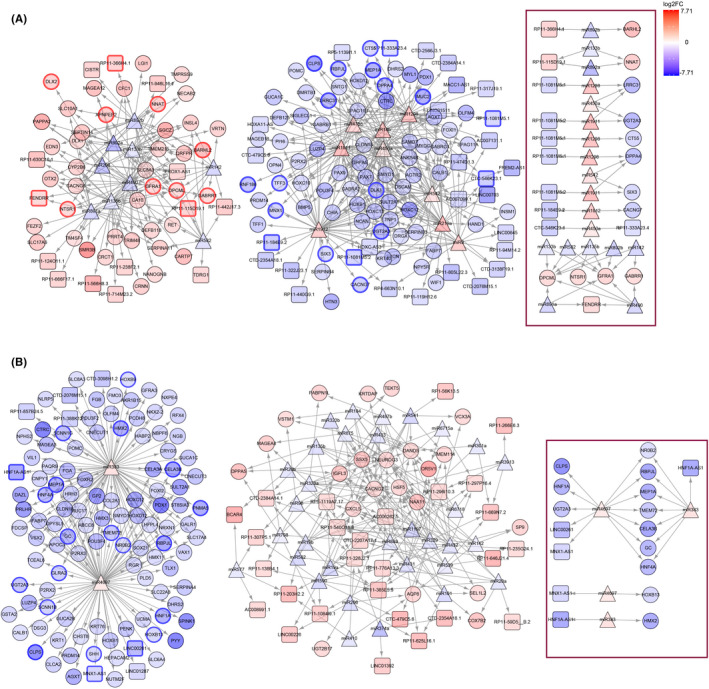
Chemotherapy response‐related competing endogenous RNA (ceRNA) network. (A) Refractory‐related ceRNA network. (B) Resistance‐related ceRNA network. All nodes are colored with log2FC, with refractory or resistant high genes shown in red. Nodes in triangle shape represent microRNA, nodes in rounded rectangle shape represent long noncoding RNA, and nodes in ellipse shape represent protein‐coding genes. Selected nodes with bold border represent significant overall survival/progression‐free survival association. Refined network with significant prognosis and correlation are framed with a red box
TABLE 1.
Survival analysis results of significant long noncoding RNAs and protein‐coding genes in chemotherapy response among patients with ovarian cancer
| Group | Gene name | logFC | p (OS) | HR (OS) | p (PFS) | HR (PFS) |
| Refractory vs. nonrefractory | BARHL2 | −3.81 | 0.046 | 1.36 | 0.045 | 1.34 |
| RP11‐1081 M5.1 | 2.36 | 0.006 | 0.67 | 0.010 | 0.71 | |
| OPCML | −2.16 | 0.027 | 1.36 | 0.001 | 1.52 | |
| GFRA1 | −2.41 | 0.004 | 1.49 | 0.006 | 1.43 | |
| MEP1A | 4.66 | 0.009 | 0.63 | 0.002 | 0.66 | |
| MNX1 | 2.51 | 0.002 | 0.64 | 0.018 | 0.69 | |
| RP11‐366H4.1 | −2.52 | 0.047 | 1.36 | |||
| NNAT | −2.80 | 0.022 | 1.36 | |||
| LRRC31 | 4.00 | 0.027 | 0.68 | |||
| RP11‐1081 M5.2 | 2.51 | 0.004 | 0.69 | |||
| UGT2A3 | 4.02 | 0.003 | 0.59 | |||
| CT55 | 2.43 | 0.011 | 0.71 | |||
| RP11‐184E9.2 | 3.02 | 0.028 | 0.69 | |||
| CTC‐546 K23.1 | 2.83 | 0.005 | 0.63 | |||
| GABRR1 | −2.04 | 0.044 | 1.38 | |||
| XPNPEP2 | −2.87 | 0.018 | 1.4 | |||
| NTSR1 | −2.14 | 0.004 | 1.46 | |||
| DLX2 | −2.57 | 0.035 | 1.35 | |||
| CLPS | 5.28 | 0.008 | 0.7 | |||
| RP11‐115D19.1 | −2.61 | 0.003 | 1.46 | |||
| DPPA4 | 3.63 | 0.009 | 0.70 | |||
| SIX3 | 2.22 | 0.025 | 0.74 | |||
| CACNG7 | 2.77 | 0.035 | 0.72 | |||
| RP11‐333A23.4 | 2.00 | 0.024 | 0.74 | |||
| FENDRR | −2.23 | 0.025 | 1.34 | |||
| RBPJL | 3.48 | 0.019 | 0.73 | |||
| RNF186 | 3.40 | 0.049 | 0.75 | |||
| DLK1 | 3.41 | 0.032 | 0.73 | |||
| TFF3 | 2.29 | 0.009 | 0.70 | |||
| MUC2 | 4.59 | 0.034 | 0.76 | |||
| Resistant vs. sensitive | LINC00261 | 4.10 | 0.003 | 0.67 | 0.005 | 0.64 |
| MNX1‐AS1 | 2.49 | 0.009 | 0.70 | 0.017 | 0.72 | |
| SHH | 2.35 | 0.014 | 0.72 | 0.003 | 0.63 | |
| MEP1A | 4.80 | 0.009 | 0.63 | 0.002 | 0.66 | |
| GLRA2 | 2.89 | 0.020 | 0.67 | 0.046 | 0.74 | |
| PNMA5 | 4.96 | <0.001 | 0.55 | 0.003 | 0.63 | |
| HMX2 | 4.86 | 0.043 | 0.77 | |||
| UGT2A3 | 3.42 | 0.003 | 0.59 | |||
| CLPS | 6.57 | 0.008 | 0.70 | |||
| CELA3B | 5.38 | 0.018 | 0.73 | |||
| SCNN1B | 2.68 | 0.006 | 0.70 | |||
| SCNN1G | 3.81 | 0.026 | 0.70 | |||
| HOXB13 | 2.37 | 0.049 | 0.72 | |||
| HOXB9 | 2.05 | 0.025 | 0.71 | |||
| TMEM72 | 3.25 | 0.029 | 0.70 | |||
| RBPJL | 5.18 | 0.019 | 0.73 | |||
| NR0B2 | 2.05 | 0.033 | 0.76 | |||
| HNF1A | 4.48 | 0.004 | 0.60 | |||
| HNF4A | 4.14 | 0.019 | 0.74 | |||
| GC | 4.27 | 0.028 | 0.70 | |||
| HNF1A‐AS1 | 5.01 | 0.002 | 0.64 |
Abbreviations: HR, hazard ratio; logFC, log FoldChange; OS, overall survival; PFS, progression‐free survival.
3.6. MNX1‐AS1/hsa‐miR4697‐3p/HOXB13 axis regulate carboplatin sensitivity
Furthermore, we determined the regulation and function of certain lncRNAs in vitro. As carboplatin was frequently used in first‐line platinum‐based chemotherapy for HGSOC but with better tolerance, 34 , 35 we determined the IC50 values for carboplatin in multiple OC cell lines. Our results revealed that the IC50 of OVCAR3, A2780, and MR182 were 169.9 μM, 65.27 μM, and 43.59 μM, respectively (Figure 6A). Based on expression levels in RNA‐seq data and OC cell lines (Figure S3A–D), the expression of a selected pair of ceRNAs was further validated with the resistant cell line OVCAR3 and sensitive cell line MR182. Consistent with our hypothesis, we found the MNX1‐AS1 and HOXB13 expression in MR182 was much higher than in OVCAR3 (Figure 6B), and hsa‐miR‐4697‐3p expression in MR182 was significantly lower than OVCAR3 (Figure 6C). As the hsa‐miR‐4697‐3p target sites presented on both MNX1‐AS1 and HOXB13 (Figure S3E), hsa‐miR‐4697‐3p regulated both MNX1‐AS1 and HOXB13 expression levels. Our results showed that elevation of hsa‐miR‐4697‐3p expression by mimic resulted in decreasing of MNX1‐AS1 and HOXB13 expression (Figure 6D), thus an increase in resistance to carboplatin in MR182 cells (Figure 6G). Reduction of hsa‐miR‐4697‐3p expression by inhibitor resulted in increased MNX1‐AS1 and HOXB13 expression (Figure 6E), and consequently increased sensitivity to carboplatin in OVCAR3 cells (Figure 6H). Furthermore, knockdown of MNX1‐AS1 with siRNA significantly decreased MNX1‐AS1 and HOXB13 expression (Figure 6F) and resistance to carboplatin in MR182 cells (Figure 6I). To determine whether HOXB13 and MNX1‐AS1 directly bind to hsa‐miR‐4697‐3p, we further cotransfected the mimic/inhibitor of hsa‐miR‐4697‐3p and the luciferase vector containing the predicted binding site. The miR‐4697‐3p mimic dramatically reduced the luciferase activity of HOXB13 and MNX1‐AS1 in MR182 (Figure 6J) and HEK‐293T cells (Figure S3F). In contrast, the miR‐4697‐3p inhibitor promoted the luciferase activity of HOXB13 and MNX1‐AS1 in OVCAR3 (Figure 6K) and HEK293T cells (Figure S3H).
FIGURE 6.
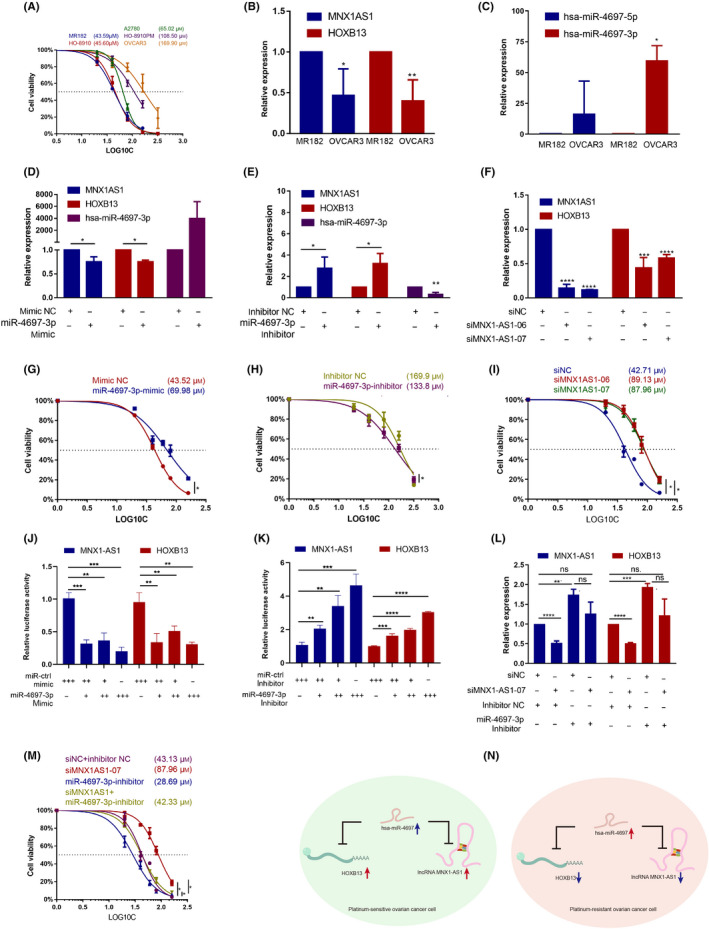
MNX1‐AS1/hsa‐miR‐4697‐3p/HOXB13 axis regulates chemotherapy response. (A) CCK‐8 assays show IC50 values of carboplatin in ovarian cancer (OC) cell lines. (B, C) Quantitative PCR (qPCR) detected gene expression in MR182 and OVCAR3 cells. n = 3. (D–F, L) qPCR detected gene expression following transfection with microRNA (miRNA) mimic (D), miRNA inhibitor (E), siRNA (F) or cotransfection (L) in MR182 cells. n = 3. (G–I) CCK‐8 assay determined IC50 value of carboplatin in miRNA mimic transfected MR182 (G), miRNA inhibitor transfected OVCAR3 (H), siRNA transfected MR182 (I), or cotransfected MR182 cells (M). n = 3. (J, K) Relative luciferase activities in MR182 or OVCAR3 cells cotransfected with a miR‐4697‐3p mimic/inhibitor transfected with luciferase reporter containing binding site of HOXB13or MNX1‐AS1. ++, double concentration. (N) Schematic diagram of the roles and molecular mechanisms of the MNX1‐AS1/hsa‐miR‐4697/HOXB13 axis in OC. *p < 0.05, **p < 0.01, ***p < 0.001, ****p < 0.0001 compared to the first group
Furthermore, hsa‐miR‐4697‐3p inhibitor abrogated MNX1‐AS siRNA‐induced HOXB13 expression decrease (Figure 6L). The results indicated that MNX1‐AS1 and HOXB13 acted as ceRNA by competitively binding to hsa‐miR‐4697‐3p. Although MNX1‐AS1 and HOXB13 share many other miRNAs (Figure S3G), only the expression of hsa‐miR‐4697 was related to chemotherapy response. The MR182 cells transfected with hsa‐miR‐4697‐3p inhibitor alone showed stronger sensitivity to carboplatin, and hsa‐miR‐4697‐3p inhibitor combined with MNX1‐AS1 siRNA resulted in the abolition of gained resistance by siMNX1‐AS1 alone (Figure 6M). Taken together, our results verified that the ceRNA MNX1‐AS1/hsa‐miR‐4697‐3p/HOXB13 axis could regulate carboplatin sensitivity in vitro (Figure 6N).
4. DISCUSSION
Ovarian cancer is the most lethal gynecologic malignancy, 2 and failure of chemotherapy leads to death. 7 Patients with OC can be divided into groups with different outcomes based on PFI, but the intrinsic similarities and differences in different groups are not clear. We identified the refractory‐related DEGs based on primary therapy outcome, and the resistance‐related DEGs basing on PFI. We found some similarities and differences between two DEG lists through functional GO and pathway enrichment, PPI, TF regulation, and ceRNA‐mediated lncRNA regulation analysis. Finally, we showed that the MNX1‐AS1/hsa‐miR‐4697‐3p/HOXB13 axis from the DEG ceRNA network affected carboplatin sensitivity of OC cell lines.
Some enriched GO terms are not clearly associated with chemotherapy response, for example, DEGs included enriched synaptic and post‐synaptic signaling and resistance‐specific enriched hormone metabolic process, which also presented in the PPI network. However, these results reminded us of research from the MD Anderson Cancer Center, which showed that stress hormone epinephrine/norepinephrine could promote epidermal growth factor receptor tyrosine kinase inhibitor resistance through LKB1/CREB/IL‐6 dependent β2‐AR signaling in NSCLC. 36 Metabolic fingerprint analysis showed neurotransmitters 5‐hydroxytryptamin (5‐HT), GABA, and glutamate were elevated in HGSOC, the inhibitors of neurotransmitters could suppress OC cell growth. 37 Furthermore, a recent study for the first time showed that non‐neural cancer cells could secrete and receive GABA signaling, and the GABA signaling could promote proliferation of cancer cells by stabilizing β‐catenin and suppressing CD8+ T cell intratumoral infiltration. 38 We noticed that the chemical carcinogenesis pathway enriched in both DEG lists and the drug metabolism pathway enriched in the resistant DEG list contained the same GSTA2 (member of the GST family), the same UGT superfamily members (UGT1A6, UGT2A3, and UGT2B17), and different CYP family members (CYP2C18 in chemical carcinogenesis and CYP2B6 in drug metabolism).
The UGTs, GSTs, and CYPs are important metabolizing enzymes in liver. Recent studies showed that some that are expressed and possessed activity in multiple cancer cells are usually associated with chemoresistance through inactivating anticancer drugs. 21 For example, the DNA methylation and genetic polymorphisms that affected UGT1A1 expression was associated with SN‐38 inactivation, which is a major determinant for irinotecan toxicity and clinical outcome. Clinical studies have shown that the genotype of UGT1A1 could guide individual dosing and increase response to irinotecan, 39 , 40 , 41 , 42 GSTP1 (GST‐π) inhibited cisplatin resistance in multiple cell lines 43 , 44 and poor chemotherapeutic response in NSCLC, 45 and CYP3A4 and 3A5 intratumoral expression was associated with favorable docetaxel response. 46 , 47 Some members show different functions towards different drugs. For example, CYP1B1 promoted docetaxel resistance in OC cell lines 48 and was associated with antitumor 2‐(4‐amino‐3 methylphenyl)‐5‐fluorobenzothiazole (DF203) sensitivity. 49 CYP2B6 is also associated with tamoxifen deactivation and cyclophosphamide activation. 50 , 51 These findings indicate that not only different members of these families may have different metabolism function towards the same drug, but each member could also have different metabolic function towards the different drug. However, what roles those members from our DEG list play in chemotherapy response is not yet fully understood.
Our TF regulation network indicated that PDX1 might play an important regulatory role in chemotherapy response. In addition to TF regulation, we have constructed an lncRNA involved ceRNA network and validated that MNX1‐AS1 can regulate HOXB13 expression through competing for hsa‐miR‐4697‐3p with HOXB13 and sensitize OC cells to carboplatin. So far, no studies have shown the effect of PDX1, MNX1‐AS1, HOXB13, or hsa‐miR‐4697 on chemotherapy response. A bioinformatics analysis identified 11 miRNAs, including hsa‐miR‐4697‐5p, as potential biomarkers for OC, 52 which can be seen as an extension to our analysis. Our results showed that high expression of MNX1‐AS1 or HOXB13 is associated with favorable outcome. No previous studies have shown the correlation between HOXB13 expression and clinical outcome, however, Li et al. reported a poor outcome association with MNX1‐AS1 expression in OC. 53 However, this discrimination could result from a different cohort, expression detection method, or even the transcripts detected. Various MNX1‐AS1 transcription isoforms or small peptides coded by MNX1‐AS1 might endow MNX1‐AS1 with complexity. Further parallel in vitro and in vivo assays and survival analyses of each isoform/peptide from MNX1‐AS1 would be helpful to clarify the function and clinical meaning of MNX1‐AS1. In addition, MNX1‐AS1 54 and HOXB13 55 , 56 have been shown to function as oncogenes in OC by promoting proliferation, survival, and migration in vitro. As chemotherapy can preferentially kill rapidly proliferating cells, their role in sensitizing carboplatin might rely on the pro‐proliferation function.
Both PDX1 57 and HOXB13 58 are important TFs for embryonic development, but their function across different cancers are context‐dependent. For example, PDX1 is highly expressed in CRC; it promotes CRC proliferation and migration, and is associated with poor prognosis. 59 However, it plays a totally opposite role in gastric cancer. 60 Moreover, as a unique pancreatic master regulator, PDX1 showed various functions during different stages of pancreatic cancer progression. 57 , 61 Similarly, highly expressed HOXB13 is associated with poor prognosis in gynecologic cancer, 62 , 63 , 64 but is associated with favored prognosis in CRC, 65 glioma, 66 and nonmuscle‐invasive bladder transitional cancer. 67 The role of HOXB13 in prostate cancer growth depends on androgen receptor participation. 68 , 69
In conclusion, we have revealed some common genes in refractory‐ and resistance‐related DEGs, both of which are involved in synaptic and postsynaptic signaling, chemical carcinogenesis, and PDX1 transcriptional regulation. However, resistance‐related DEGs are involved in more complex hormone processes, stimulus, stem cell differentiation, and the beta‐catenin and KRAS pathways. Among the complex ceRNA network, we have validated the clinical outcomes associated with MNX1‐AS and HOXB13 ceRNAs, and their competing miR‐hsa‐miR‐4697‐3p expression in carboplatin‐sensitive and ‐resistant OC cell lines. We have also shown that perturbation of the ceRNA axis in OC cells significantly affected the IC50 value of carboplatin. It is not known whether altering the expression of MNX1‐AS1 can also significantly affect the PFI after carboplatin. Appropriate preclinical and clinical models will be needed in the future.
AUTHOR CONTRIBUTIONS
Anqi Wu: conception, design of experiment, development of experimental model systems, performance of experiments, data collection, data analysis and interpretation, writing and editing paper. Jiaqi Liu: design of experiment, performance of experiments, data analysis, writing and editing paper. Xiaojun Zhang, Chenxi Niu, and Shuguang: performance of experiments, data collection. Gang Yin: conception, design of experiment, development of experimental model systems, data analysis and interpretation, writing and editing paper.
DISCLOSURE
The authors have no conflict of interest.
ETHICS STATEMENT
The research protocol was approved by an Institutional Review Board.
Supporting information
Appendix S1
ACKNOWLEDGMENTS
The MR182 cell line was a kind gift from Gil Mor's Laboratory (Department of Obstetrics, Gynecology and Reproductive Sciences, Division of Reproductive Sciences, Yale School of Medicine and C.S. Mott Center for Human Growth and Development, Department of Obstetrics and Gynecology, Wayne State University).
Wu A, Liu J, Zhang X, Niu C, Shu G, Yin G. Comprehensive network analysis of dysregulated genes revealed MNX1‐AS1/hsa‐miR‐4697‐3p/HOXB13 axis in ovarian cancer chemotherapy response. Cancer Sci. 2022;113:2627‐2641. doi: 10.1111/cas.15447
Funding information
National Natural Science Foundation of China, Grant/Award Number: 82173376; Key Project of Hunan Province 2022, Grant/Award Number: 2022WK2012
Anqi Wu and Jiaqi Liu contributed equally to this work and share first authorship.
Contributor Information
Guang Shu, Email: shuguang78@csu.edu.cn.
Gang Yin, Email: gangyin@csu.edu.cn.
REFERENCES
- 1. Martin LP, Schilder RJ. Management of recurrent ovarian carcinoma: current status and future directions. Semin Oncol. 2009;36(2):112‐125. [DOI] [PubMed] [Google Scholar]
- 2. Siegel RL, Miller KD, Jemal A. Cancer statistics, 2020. CA Cancer J Clin. 2020;70(1):7‐30. [DOI] [PubMed] [Google Scholar]
- 3. Lheureux S, Braunstein M, Oza AM. Epithelial ovarian cancer: evolution of management in the era of precision medicine. CA Cancer J Clin. 2019;69(4):280‐304. [DOI] [PubMed] [Google Scholar]
- 4. Matulonis UA, Sood AK, Fallowfield L, Howitt BE, Sehouli J, Karlan BY. Ovarian cancer. Nat Rev Dis Primers. 2016;2:16061. [DOI] [PMC free article] [PubMed] [Google Scholar]
- 5. Lengyel E. Ovarian cancer development and metastasis. Am J Pathol. 2010;177(3):1053‐1064. [DOI] [PMC free article] [PubMed] [Google Scholar]
- 6. Ozols RF. Systemic therapy for ovarian cancer: current status and new treatments. Semin Oncol. 2006;33(2 Suppl 6):S3‐S11. [DOI] [PubMed] [Google Scholar]
- 7. Davis A, Tinker AV, Friedlander M. "Platinum resistant" ovarian cancer: what is it, who to treat and how to measure benefit? Gynecol Oncol. 2014;133(3):624‐631. [DOI] [PubMed] [Google Scholar]
- 8. Friedlander M, Trimble E, Tinker A, et al. Clinical trials in recurrent ovarian cancer. Int J Gynecol Cancer. 2011;21(4):771‐775. [DOI] [PubMed] [Google Scholar]
- 9. Kuroki L, Guntupalli SR. Treatment of epithelial ovarian cancer. BMJ. 2020;371:m3773. [DOI] [PubMed] [Google Scholar]
- 10. Luvero D, Milani A, Ledermann JA. Treatment options in recurrent ovarian cancer_ latest evidence and clinical potential. Ther Adv Med Oncol. 2014;6(5):229‐239. [DOI] [PMC free article] [PubMed] [Google Scholar]
- 11. Pujade‐Lauraine E, Banerjee S, Pignata S. Management of platinum‐resistant, relapsed epithelial ovarian cancer and new drug perspectives. J Clin Oncol. 2019;37(27):2437‐2448. [DOI] [PubMed] [Google Scholar]
- 12. du Bois A, Reuss A, Pujade‐Lauraine E, Harter P, Ray‐Coquard I, Pfisterer J. Role of surgical outcome as prognostic factor in advanced epithelial ovarian cancer: a combined exploratory analysis of 3 prospectively randomized phase 3 multicenter trials: by the Arbeitsgemeinschaft Gynaekologische Onkologie Studiengruppe Ovarialkarzinom (AGO‐OVAR) and the Groupe d'Investigateurs Nationaux Pour les Etudes des Cancers de l'Ovaire (GINECO). Cancer. 2009;115(6):1234‐1244. [DOI] [PubMed] [Google Scholar]
- 13. Pfisterer J, Plante M, Vergote I, et al. Gemcitabine plus carboplatin compared with carboplatin in patients with platinum‐sensitive recurrent ovarian cancer: an intergroup trial of the AGO‐OVAR, the NCIC CTG, and the EORTC GCG. J Clin Oncol. 2006;24(29):4699‐4707. [DOI] [PubMed] [Google Scholar]
- 14. Pignata S, Cc S, Du Bois A, Harter P, Heitz F. Treatment of recurrent ovarian cancer. Ann Oncol. 2017;28(Suppl_8):viii51‐viii56. [DOI] [PubMed] [Google Scholar]
- 15. Ferrandina G, Corrado G. Treatment of platinum refractory or resistant ovarian cancer. Lancet Oncol. 2018;19(9):1147‐1149. [DOI] [PubMed] [Google Scholar]
- 16. Sharma R, Graham J, Mitchell H, Brooks A, Blagden S, Gabra H. Extended weekly dose‐dense paclitaxel/carboplatin is feasible and active in heavily pre‐treated platinum‐resistant recurrent ovarian cancer. Br J Cancer. 2009;100(5):707‐712. [DOI] [PMC free article] [PubMed] [Google Scholar]
- 17. Rose PG, Mossbruger K, Fusco N, Smrekar M, Eaton S, Rodriguez M. Gemcitabine reverses cisplatin resistance: demonstration of activity in platinum‐ and multidrug‐resistant ovarian and peritoneal carcinoma. Gynecol Oncol. 2003;88(1):17‐21. [DOI] [PubMed] [Google Scholar]
- 18. Parmar MK, Ledermann JA, Colombo N, et al. Paclitaxel plus platinum‐based chemotherapy versus conventional platinum‐based chemotherapy in women with relapsed ovarian cancer: the ICON4/AGO‐OVAR‐2.2 trial. Lancet. 2003;361(9375):2099‐2106. [DOI] [PubMed] [Google Scholar]
- 19. Armstrong DK, Alvarez RD, Bakkum‐Gamez JN, et al. Ovarian cancer, Version 2.2020, NCCN Clinical Practice Guidelines in Oncology. J Natl Compr Cancer Netw. 2021;19(2):191‐226. [DOI] [PubMed] [Google Scholar]
- 20. Colombo PE, Fabbro M, Theillet C, Bibeau F, Rouanet P, Ray‐Coquard I. Sensitivity and resistance to treatment in the primary management of epithelial ovarian cancer. Crit Rev Oncol Hematol. 2014;89(2):207‐216. [DOI] [PubMed] [Google Scholar]
- 21. Norouzi‐Barough L, Sarookhani MR, Sharifi M, Moghbelinejad S, Jangjoo S, Salehi R. Molecular mechanisms of drug resistance in ovarian cancer. J Cell Physiol. 2018;233(6):4546‐4562. [DOI] [PubMed] [Google Scholar]
- 22. Fong PC, Boss DS, Yap TA, et al. Inhibition of poly(ADP‐ribose) polymerase in tumors from BRCA mutation carriers. N Engl J Med. 2009;361:123‐134. [DOI] [PubMed] [Google Scholar]
- 23. Poveda A, Floquet A, Ledermann JA, et al. Olaparib tablets as maintenance therapy in patients with platinum‐sensitive relapsed ovarian cancer and a BRCA1/2 mutation (SOLO2/ENGOT‐Ov21): a final analysis of a double‐blind, randomised, placebo‐controlled, phase 3 trial. Lancet Oncol. 2021;22(5):620‐631. [DOI] [PubMed] [Google Scholar]
- 24. Pujade‐Lauraine E, Ledermann JA, Selle F, et al. Olaparib tablets as maintenance therapy in patients with platinum‐sensitive, relapsed ovarian cancer and a BRCA1/2 mutation (SOLO2/ENGOT‐Ov21): a double‐blind, randomised, placebo‐controlled, phase 3 trial. Lancet Oncol. 2017;18(9):1274‐1284. [DOI] [PubMed] [Google Scholar]
- 25. Coleman RL, Oza AM, Lorusso D, et al. Rucaparib maintenance treatment for recurrent ovarian carcinoma after response to platinum therapy (ARIEL3): a randomised, double‐blind, placebo‐controlled, phase 3 trial. Lancet. 2017;390(10106):1949‐1961. [DOI] [PMC free article] [PubMed] [Google Scholar]
- 26. Ledermann J, Harter P, Gourley C, et al. Olaparib maintenance therapy in platinum‐sensitive relapsed ovarian cancer. N Engl J Med. 2012;366(15):1382‐1392. [DOI] [PubMed] [Google Scholar]
- 27. Salmena L, Poliseno L, Tay Y, Kats L, Pandolfi PP. A ceRNA hypothesis: the Rosetta stone of a hidden RNA language? Cell. 2011;146(3):353‐358. [DOI] [PMC free article] [PubMed] [Google Scholar]
- 28. Li Z, Niu H, Qin Q, et al. lncRNA UCA1 mediates resistance to cisplatin by regulating the miR‐143/FOSL2‐signaling pathway in ovarian cancer. Mol Ther Nucleic Acids. 2019;17:92‐101. [DOI] [PMC free article] [PubMed] [Google Scholar]
- 29. Wambecke A, Ahmad M, Morice PM, et al. The lncRNA 'UCA1' modulates the response to chemotherapy of ovarian cancer through direct binding to miR‐27a‐5p and control of UBE2N levels. Mol Oncol. 2021;15:3659‐3678. [DOI] [PMC free article] [PubMed] [Google Scholar]
- 30. Dong C, Yin F, Zhu D, Cai X, Chen C, Liu X. NCALD affects drug resistance and prognosis by acting as a ceRNA of CX3CL1 in ovarian cancer. J Cell Biochem. 2020;121(11):4470‐4483. [DOI] [PubMed] [Google Scholar]
- 31. Reed E, Ozols RF, Tarone R, Yuspa SH, Poirier MC. Platinum‐DNA adducts in leukocyte DNA correlate with disease response in ovarian cancer patients receiving platinum‐based chemotherapy. Proc Natl Acad Sci U S A. 1987;84(14):5024‐5028. doi: 10.1073/pnas.84.14.5024 [DOI] [PMC free article] [PubMed] [Google Scholar]
- 32. Kim M, Jung J‐Y, Choi S, et al. GFRA1 promotes cisplatin‐induced chemoresistance in osteosarcoma by inducing autophagy. Autophagy. 2017;13(1):149‐168. doi: 10.1080/15548627.2016.1239676 [DOI] [PMC free article] [PubMed] [Google Scholar]
- 33. Wu H, Li R, Zhang Z, et al. Kallistatin inhibits tumour progression and platinum resistance in high‐grade serous ovarian cancer. J Ovarian Res. 2019;12(1):125. [DOI] [PMC free article] [PubMed] [Google Scholar]
- 34. McGuire WPHW, Brady MF, Kucera PR, Partridge EE, Look KY, Clarke‐Pearson DL. Cyclophosphamide and cisplatin compared with paclitaxel and cisplatin in patients with stage III and stage IV ovarian cancer. N Engl J Med. 1996;334(1):1‐6. [DOI] [PubMed] [Google Scholar]
- 35. Ozols RF, Bundy BN, Greer BE, et al. Phase III trial of carboplatin and paclitaxel compared with cisplatin and paclitaxel in patients with optimally resected stage III ovarian cancer: a Gynecologic Oncology Group study. J Clin Oncol. 2003;21(17):3194‐3200. [DOI] [PubMed] [Google Scholar]
- 36. Nilsson M, Sun H, Diao L, et al. Stress hormones promote EGFR inhibitor resistance in NSCLC: implications for combinations with β‐blockers. Sci Transl Med. 2017;9(415):eaao4307. [DOI] [PMC free article] [PubMed] [Google Scholar]
- 37. Ha JH, Jayaraman M, Nadhan R, et al. Unraveling autocrine signaling pathways through metabolic fingerprinting in serous ovarian cancer cells. Biomedicine. 2021;9(12):1927. [DOI] [PMC free article] [PubMed] [Google Scholar]
- 38. Huang D, Wang Y, Thompson JW, et al. Cancer‐cell‐derived GABA promotes β‐catenin‐mediated tumour growth and immunosuppression. Nat Cell Biol. 2022;24(2):230‐241. [DOI] [PMC free article] [PubMed] [Google Scholar]
- 39. Gagnon JF, Bernard O, Villeneuve L, Tetu B, Guillemette C. Irinotecan inactivation is modulated by epigenetic silencing of UGT1A1 in colon cancer. Clin Cancer Res. 2006;12(6):1850‐1858. [DOI] [PubMed] [Google Scholar]
- 40. Toffoli G, Cecchin E, Gasparini G, et al. Genotype‐driven phase I study of irinotecan administered in combination with fluorouracil/leucovorin in patients with metastatic colorectal cancer. J Clin Oncol. 2010;28(5):866‐871. [DOI] [PMC free article] [PubMed] [Google Scholar]
- 41. Innocenti F, Schilsky RL, Ramirez J, et al. Dose‐finding and pharmacokinetic study to optimize the dosing of irinotecan according to the UGT1A1 genotype of patients with cancer. J Clin Oncol. 2014;32(22):2328‐2334. [DOI] [PMC free article] [PubMed] [Google Scholar]
- 42. Zhu J, Liu A, Sun X, et al. Multicenter, randomized, phase III trial of neoadjuvant chemoradiation with capecitabine and irinotecan guided by UGT1A1 status in patients with locally advanced rectal cancer. J Clin Oncol. 2020;38(36):4231‐4239. [DOI] [PMC free article] [PubMed] [Google Scholar]
- 43. Ban N, Takahashi Y, Takayama T, Kura T, Niitsu Y. Transfection of glutathione S‐transferase (GST)‐pi antisense complementary DNA increases the sensitivity of a colon cancer cell line to adriamycin, cisplatin, melphalan, and etoposide. Cancer Res. 1996;56(15):3577‐3582. [PubMed] [Google Scholar]
- 44. Kalinina E, Berozov T, Shtil A, Chernov N, Nurmuradov N. Expression of genes of glutathione transferase isoforms GSTP1‐1, GSTA4‐4, and GSTK1‐1 in tumor cells during the formation of drug resistance to cisplatin. Bull Exp Biol Med. 2012;154(1):64‐67. [DOI] [PubMed] [Google Scholar]
- 45. Bai F, Nakanishi Y, Kawasaki M, et al. Immunohistochemical expression of glutathione S‐transferase‐Pi can predict chemotherapy response in patients with nonsmall cell lung carcinoma. Cancer. 1996;78(3):416‐421. [DOI] [PubMed] [Google Scholar]
- 46. Miyoshi Y, Ando A, Takamura Y, Taguchi T, Tamaki Y, Noguchi S. Prediction of response to docetaxel by CYP3A4 mRNA expression in breast cancer tissues. Int J Cancer. 2010;97(1):129‐132. [DOI] [PubMed] [Google Scholar]
- 47. Dhaini HR, Thomas DG, Giordano TJ, et al. Cytochrome P450 CYP3A4/5 expression as a biomarker of outcome in osteosarcoma. J Clin Oncol. 2003;21(13):2481‐2485. [DOI] [PubMed] [Google Scholar]
- 48. McFadyen MCE, McLeod HL, Jackson FC, Melvin WT, Doehmer J, Murray GI. Cytochrome P450 CYP1B1 protein expression: a novel mechanism of anticancer drug resistance. Biochem Pharmacol. 2001;62:207‐212. [DOI] [PubMed] [Google Scholar]
- 49. Chua M, Kashiyama E, Bradshaw T, et al. Role of Cyp1A1 in modulation of antitumor properties of the novel agent 2‐(4‐amino‐3‐methylphenyl)benzothiazole (DF 203, NSC 674495) in human breast cancer cells. Cancer Res. 2000;60(18):5196. [PubMed] [Google Scholar]
- 50. Crewe HK, Notley LM, Wunsch RM, Lennard MS, Gillam EMJ. Metabolism of tamoxifen by recombinant human cytochrome P450 enzymes: formation of the 4‐hydroxy, 4′‐hydroxy and N‐desmethyl metabolites and isomerization of trans‐4‐hydroxytamoxifen. Drug Metab Dispos. 2002;30(8):869‐874. [DOI] [PubMed] [Google Scholar]
- 51. Chen L, Waxman D, Chen D, Kufe D. Sensitization of human breast cancer cells to cyclophosphamide and ifosfamide by transfer of a liver cytochrome P450 gene. Cancer Res. 1996;56(6):1331‐1340. [PubMed] [Google Scholar]
- 52. Yaghoobi H, Babaei E, Hussen BM, EBST EA. An evolutionary multi‐objective optimization based tool for discovering potential biomarkers in ovarian cancer. IEEE/ACM Trans Comput Biol Bioinform. 2020;18:2384‐2393. [DOI] [PubMed] [Google Scholar]
- 53. Li A‐H, Zhang H‐H. Overexpression of lncRNA MNX1‐AS1 is associated with poor clinical outcome in epithelial ovarian cancer. Eur Rev Med Pharmacol Sci. 2017;21:5618‐5623. [DOI] [PubMed] [Google Scholar]
- 54. Lv Y, Li H, Li F, Liu P, Zhao X. Long noncoding RNA MNX1‐AS1 knockdown inhibits cell proliferation and migration in ovarian cancer. Cancer Biother Radiopharm. 2017;32(3):91‐99. [DOI] [PubMed] [Google Scholar]
- 55. Miao J, Wang Z, Provencher H, et al. HOXB13 promotes ovarian cancer progression. Proc Natl Acad Sci U S A. 2007;104(43):17093‐17098. [DOI] [PMC free article] [PubMed] [Google Scholar]
- 56. Yamashita T, Tazawa S, Zhao Y, Katayama H, Ishikawa M. Suppression of invasive characteristics by antisense introduction of overexpressed HOX genes in ovarian cancer cells. Int J Oncol. 2006;28(4):931‐938. [PubMed] [Google Scholar]
- 57. Vinogradova TV, Sverdlov ED. PDX1: a unique pancreatic master regulator constantly changes its functions during embryonic development and progression of pancreatic cancer. Biochemistry (Mosc). 2017;82(8):887‐893. [DOI] [PubMed] [Google Scholar]
- 58. Abate‐Shen C. Deregulated homeobox gene expression in cancer: cause or consequence? Nat Rev Cancer. 2002;2(10):777‐785. [DOI] [PubMed] [Google Scholar]
- 59. Lee Y, Dho SH, Lee J, et al. Hypermethylation of PDX1, EN2, and MSX1 predicts the prognosis of colorectal cancer. Exp Mol Med. 2022;54(2):156‐168. [DOI] [PMC free article] [PubMed] [Google Scholar]
- 60. Ma J, Chen M, Wang J, et al. Pancreatic duodenal homeobox‐1 (PDX1) functions as a tumor suppressor in gastric cancer. Carcinogenesis. 2008;29(7):1327‐1333. [DOI] [PubMed] [Google Scholar]
- 61. Kondratyeva L, Chernov I, Kopantzev E, et al. Pancreatic lineage specifier PDX1 increases adhesion and decreases motility of cancer cells. Cancers (Basel). 2021;13(17):4390. [DOI] [PMC free article] [PubMed] [Google Scholar]
- 62. Yawei Z, Yamashita T, Ishikawa M. Regulation of tumor invasion by HOXB13 gene overexpressed in human endometrial cancer. Oncol Rep. 2005;13:721‐726. [PubMed] [Google Scholar]
- 63. Gonzalez‐Herrera A, Salgado‐Bernabe M, Velazquez‐Velazquez C, et al. Increased expression of HOXB2 and HOXB13 proteins is associated with HPV infection and cervical cancer progression. Asian Pac J Cancer Prev. 2015;16(4):1349‐1353. [DOI] [PubMed] [Google Scholar]
- 64. Ma XJ, Hilsenbeck SG, Wang W, et al. The HOXB13:IL17BR expression index is a prognostic factor in early‐stage breast cancer. J Clin Oncol. 2006;24(28):4611‐4619. [DOI] [PubMed] [Google Scholar]
- 65. Jung C, Kim RS, Zhang H, et al. HOXB13 is downregulated in colorectal cancer to confer TCF4‐mediated transactivation. Br J Cancer. 2005;92(12):2233‐2239. [DOI] [PMC free article] [PubMed] [Google Scholar]
- 66. Xiong Y, Kuang W, Lu S, et al. Long noncoding RNA HOXB13‐AS1 regulates HOXB13 gene methylation by interacting with EZH2 in glioma. Cancer Med. 2018;7(9):4718‐4728. [DOI] [PMC free article] [PubMed] [Google Scholar]
- 67. Marra L, Gigantino V, Chieffi S, Botti G, Cerrone M. Deregulation of HOX B13 expression in urinary bladder cancer progression. Curr Med Chem. 2013;20(6):833‐839. [PubMed] [Google Scholar]
- 68. Kim YR, Oh KJ, Park RY, et al. HOXB13 promotes androgen independent growth of LNCaP prostate cancer cells by the activation of E2F signaling. Mol Cancer. 2010;9:124. [DOI] [PMC free article] [PubMed] [Google Scholar]
- 69. Jung C, Kim R‐S, Lee S‐J, Wang C, Jeng M‐H. HOXB13 homeodomain protein suppresses the growth of prostate cancer cells by the negative regulation of T‐cell factor 4. Cancer Res. 2004;64(9):3046‐3051. [DOI] [PubMed] [Google Scholar]
Associated Data
This section collects any data citations, data availability statements, or supplementary materials included in this article.
Supplementary Materials
Appendix S1