

Abstract
More than 90% of ovarian cancer deaths are due to relapse following development of chemoresistance. Our main objective is to better understand the molecular mechanism underlying paclitaxel resistance (taxol resistance, Txr) in ovarian cancer. Here, we observed that the linker histone H1.0 is upregulated in paclitaxel‐resistant ovarian cancer cells. Knockdown of H1.0 significantly downregulates the androgen receptor (AR) and sensitizes paclitaxel‐resistant SKOV3/Txr and 2774/Txr cell lines to paclitaxel. Conversely, ectopic expression of H1.0 upregulates AR and increases Txr in parental SKOV3 and MDAH2774 cells. Notably, H1.0 upregulation is associated with disease recurrence and poor survival in a subset of ovarian cancer subjects. Inhibition of PI3K significantly reduces H1.0 mRNA and protein levels in paclitaxel‐resistant cells, suggesting the involvement of the PI3K/AKT signaling pathway. Knockdown of H1.0 and AR also downregulates the Txr genes ABCB1 and ABCG2 in paclitaxel‐resistant cells. Our data show that H1.0 induces GCN5 expression and histone acetylation, thereby enhancing Txr gene transactivation. These findings suggest that Txr in ovarian cancer involves the PI3K/AKT pathway and leads to upregulation of histone H1.0, recruitment of GCN5 and AR, followed by upregulation of a subgroup of Txr genes that include ABCB1 and ABCG2. This study is the first report describing the relationship between histone H1.0 and GCN5 that cooperate to induce AR‐dependent Txr in ovarian cancer cells.
Keywords: androgen receptor, GCN5, H1.0, ovarian cancer, paclitaxel resistance
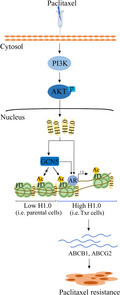
To better understand the molecular mechanism underlying taxol resistance (Txr), we explored the axis PI3K/AKT/H1.0 recruiting GCN5 and AR to upregulate Txr genes, ABCB1 and ABCG2. This study is the first report describing the relationship between histone H1.0 and GCN5 which cooperate to induce AR‐dependent Txr in ovarian cancer cells.
Abbreviations
- AR
androgen receptor
- qPCR
quantitative PCR
- RT‐qPCR
quantitative RT‐PCR
- Txr
paclitaxel resistance
1. INTRODUCTION
Paclitaxel (also called taxol) is one of the most extensively used chemotherapeutic agents to treat ovarian cancer. 1 One prominent mechanism that has been proposed to explain paclitaxel resistance (Txr) is the upregulation of P‐glycoprotein and breast cancer resistance protein (BCRP), which are encoded by ABCB1/MDR1 (multidrug resistance protein 1) and ABCG2 genes, respectively. This process leads to drug efflux, enhanced drug metabolism, and alterations of microtubules. 2 , 3
In our previous study, we observed that the Txr gene H1.0 was upregulated in paclitaxel‐resistant SKOV3/Txr cells based on cDNA microarray and RT‐qPCR analysis. 4 H1.0 encodes a small nucleosome protein that is known to generate cancer cell heterogeneity by regulating epigenetic differentiation states within tumors. 5 H1.0 can interact with nucleosome complexes to regulate chromatin function and influence cellular dynamics. 6 H1.0 and its isoforms are also involved in transcriptional regulation via post‐translational modifications of H1 histones. For instance, H1 phosphorylation reaches its maximum in G2 and mitotic stages of the cell cycle, 7 a process that has been proposed to induce gene repression involving chromatin acetylation. 8 In addition, upregulation of histone acetyltransferases (HATs; e.g., GCN5) positively correlates with aggressive cancer progression and poor prognosis. 9 , 10 , 11 These observations suggest that cancer cells may survive in the presence of chemotherapeutic drugs by epigenetically altering gene expression. However, the mechanism underlying this process remains to be determined.
Increasing evidence suggests that the androgen receptor (AR) is an essential factor in upregulating Txr genes. 4 , 12 For instance, H1.0 expression is positively correlated with AR activation following treatment with the AR agonist dihydrotestosterone. 4 Therefore, we examined the signaling activity of H1.0 and AR in regulating Txr gene expression in ovarian cancer cells. We found that AR transcriptional activity via epigenetic activation was associated with increased expression of H1.0 and Txr genes (e.g., ABCB1/MDR1 and ABCG2). Furthermore, H1.0 expression was regulated by the phosphatidylinositol 3‐kinase (PI3K)/AKT pathway. Notably, histone epigenetic regulation was also positively correlated with H1.0 levels. This is the first study showing that H1.0 induces gene transcriptional activation leading to upregulation of Txr genes in ovarian cancer cells.
2. MATERIALS AND METHODS
2.1. Cell lines and reagents
Parental SKOV3 and MDAH2774 cell lines (purchased from ATCC) and derived paclitaxel‐resistant cells were maintained as described before. 13 The 2774/Txr cell line was established from MDAH2774 cells by treatment with gradually increasing doses of paclitaxel (from 0.5 to 6 nM). Inhibitors of PI3K (Wortmannin), ERK (PD98059), P38 (SB203580), and JNK (SP600125) kinases were purchased from Calbiochem. AR inhibitors bicalutamide and actinomycin D were purchased from Santa Cruz Biotechnology.
2.2. Plasmids and ectopic expression
Human H1.0 cDNA flanked by NheI and PmeI sites was generated by PCR using the primers listed in Table S1 and was subcloned into the pLKO AS3w.puro vector. Plasmid and lentivirus preparation was performed as before. 14 For ectopic GCN5 expression, cells were transfected with pEBB Flag‐GCN5 (Addgene) using Lipofectamine (Invitrogen) following instructions provided by the manufacturer.
2.3. Cell viability assay
For cell viability analysis, the MTT colorimetric assay was used as before. 15 Half maximal inhibitory concentrations (IC50) were determined as the concentrations that reduced cell viability by 50% versus the DMSO control. Resistance factors (RF) were defined as the IC50 of cells overexpressing the target protein divided by the IC50 of control cells. Sensitization factors (SF) were calculated as the ratio of IC50 for shRNA and shCtrl cells.
2.4. Quantitative PCR analysis
Cells were lysed, and total RNA was extracted with TRIzol based on the manufacturer's instructions (Invitrogen). In total, 5 μg of RNA was used for reverse transcription and real‐time quantitative PCR was performed as described previously. 4 Primers used for RT‐qPCR are listed in Table S1.
2.5. Western blotting
Cells were lysed on ice using the RIPA buffer. Bio‐Rad protein assay was used to measure protein concentrations. Immunoblotting was performed with primary antibodies against H1.0, AR, PARP1, ABCB1, ABCG2, or GAPDH (Santa Cruz Biotechnology); cleaved caspase 3, P300, GCN5, AKT, phospho‐AKT, H3K9Ac, H3K18Ac, H3Ac, or H3 (Cell Signaling Technology). Quantification of protein bands was done using ImageJ software. 16
2.6. shRNA‐mediated gene knockdown
Gene knockdown was performed using the pLKO.1 plasmid expressing shRNA and luciferase shRNA as a negative control (shCtrl) as described before. 17 These reagents were purchased from the National RNAi Core Facility (Academia Sinica, Taipei, Taiwan). shRNA clone numbers and target sequences are listed in Table S1.
2.7. cBioPortal database analysis
The publicly available cBio Cancer Genomics Portal (http://cbioportal.org) and its multidimensional cancer genomics data sets were used. 18 The OncoPrint subtool of cBioPortal was also utilized to analyze the status of H1.0 expression from The Cancer Genome Atlas (TCGA) studies. Association between tumor progression, clinical outcome, and H1.0 expression was analyzed. mRNA upregulation was defined as the relative expression of tumor samples against samples from the reference population, using means of z‐scores >2. The z‐score value indicates the number of standard deviations away from the mean of expression in the reference population. To validate co‐expression of H1.0, AR, GCN5, AKT, and PI3K, we used the mutual exclusivity tool of cBioPortal with p < 0.05 as inclusion criteria.
2.8. Reporter luciferase assay
Cells were transfected with either pGL3 control vector or ABCB1 promoter plasmid (ABCB1Pr) with or without pEBB Flag‐GCN5. Renilla luciferase was included in all assays as an internal control. Bioluminescence measurements were normalized to Renilla luciferase activity and expressed as relative luciferase (RLU) activity (i.e., fold change of normalized intensity against mock control Txr cells).
2.9. Chromatin immunoprecipitation (ChIP)
Formaldehyde‐crosslinked nuclei were isolated using nuclear lysis buffer followed by sonication to solubilize chromatin (average length of 600 bp). 17 In total, 500 μg of chromatin–protein complexes were isolated by immunoprecipitation with 5 μg of antibody at 4°C overnight. Beads with precipitated chromatin were washed successively with low‐salt buffer, high‐salt buffer, LiCl buffer, and TE buffer. DNA–protein complexes were eluted with 400 μl of elution buffer. Antibody‐precipitated DNA and input DNA were amplified by qPCR with specific primers. PCR primers used for verification of AR binding on ABCB1 and ABCG2 promoters are listed in Table S1. AR‐binding sites (AREs) were determined using the Jaspar Core database (version 8.0 alpha) with a cut off setting of 80%.
2.10. Statistical analysis
Data were analyzed using a paired Student's t‐test. Data of experiments performed in triplicates were expressed as means ± standard deviation.
3. RESULTS
3.1. H1.0 upregulation in paclitaxel‐resistant cells and association with poor prognosis in ovarian cancer subjects
We first confirmed our previous observation (GSE60335) 4 that histone H1.0 is highly upregulated in paclitaxel‐resistant SKOV3/Txr ovarian cancer cells (Figure 1A). Based on cDNA microarray and RT‐qPCR analysis, H1.0 mRNA levels were respectively upregulated 31‐fold and 63‐fold in SKOV3/Txr cells (Figure 1B). Moreover, H1.0 protein levels were increased 4.2‐fold in paclitaxel‐resistant SKOV3/Txr cells compared with parental cells (Figure 1B, lower panel). We used the OncoPrint module of cBioPortal to analyze H1.0 genetic alterations in three TCGA cohorts of subjects with ovarian serous cystadenocarcinoma. H1.0 expression was upregulated in 1.87% of cases (30/1602) in the three TCGA cohorts examined, namely the Firehose Legacy (n = 560), PanCancer Atlas (n = 556), and Nature 2011 (n = 486) (Figure 1C). Notably, many cases showing H1.0 upregulation experienced cancer recurrence (Figure 1D; 22/30, 73.33%). Kaplan–Meier survival analysis also revealed that H1.0 upregulation was associated with shorter survival compared with controls (Figure 1E; 31.3 versus 44.88 months for H1.0‐upregulated and control groups, respectively; log‐rank p = 8.16 × 10⁻⁴). Taken together, these results indicated that H1.0 gene upregulation is associated with Txr in ovarian cancer cells as well as with disease recurrence and poor survival in ovarian cancer subjects.
FIGURE 1.
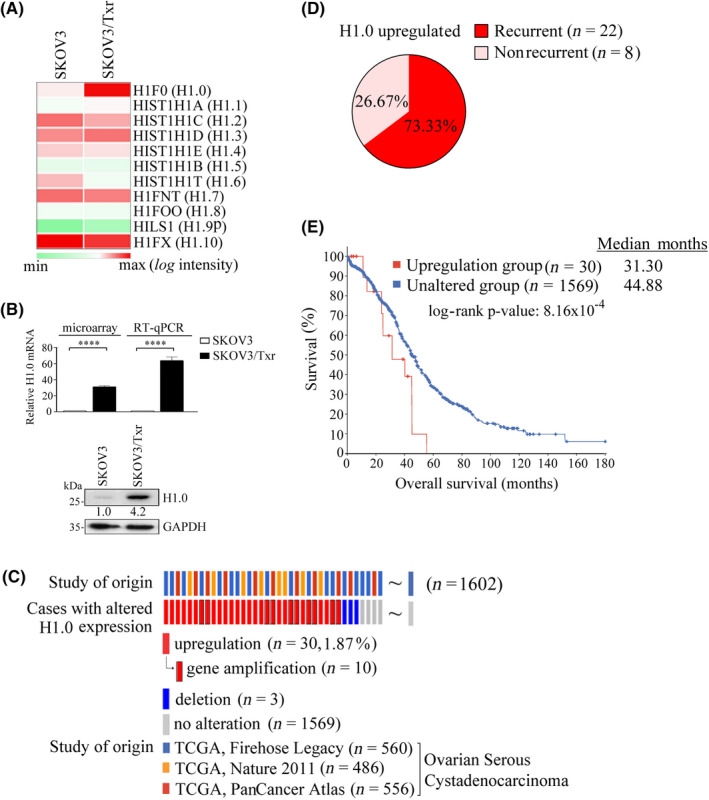
H1.0 upregulation is associated with paclitaxel resistance and poor clinical prognosis in ovarian cancer. (A) Relative H1.0 mRNA expression by cDNA microarray and RT‐qPCR analysis. (B) Heatmap analysis of histone 1 subtype mRNA expression in SKOV3 and isogeneic paclitaxel‐resistant Tx50 and Tx600 (SKOV3/Txr) cells. (C) H1.0 genetic alterations based on TCGA cohorts of ovarian cancer studies using cBioPortal analysis. (D) H1.0 overexpression in ovarian carcinoma studies shows a trend toward cancer recurrence. (E) H1.0 upregulation is significantly associated with shorter survival based on Kaplan–Meier survival analysis. Experiments were performed independently in triplicate (****p < 0.0001)
3.2. Modulation of H1.0 expression affects sensitivity to paclitaxel in ovarian cancer cells
To assess whether H1.0 expression affects paclitaxel sensitivity, we manipulated H1.0 expression in SKOV3 and SKOV3/Txr cells. H1.0 overexpression improved the viability of parental SKOV3 cells in response to paclitaxel, as shown by the RF of 3.5 (Figure 2A). In contrast, H1.0 knockdown increased paclitaxel sensitivity in SKOV3/Txr cells, as demonstrated by the SF of 1.9 (Figure 2B). Next, we evaluated the effects of H1.0 on apoptosis markers using western blotting. Levels of cleaved caspase 3 and its substrate poly‐ADP ribose polymerase‐1 (PARP1) were reduced in H1.0‐overexpressing SKOV3 cells compared with pLKO controls (Figure 2C). In contrast, H1.0 knockdown enhanced cleaved caspase 3 and PARP1 levels compared with mock shCtrl SKOV3/Txr cells (Figure 2C).
FIGURE 2.
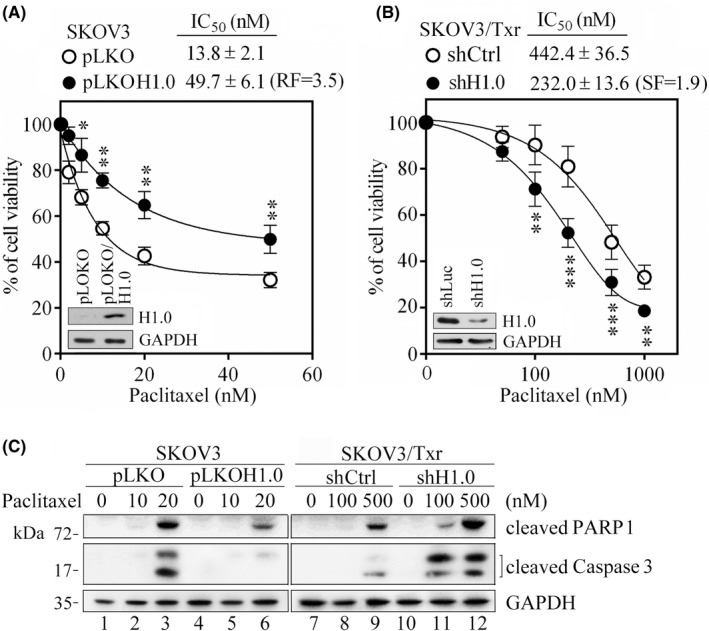
H1.0 knockdown and ectopic expression modulate the response of ovarian cancer cells to paclitaxel. MTT assay was used to compare cell viability in the presence of ectopic H1.0 expression in SKOV3 (A) and following H1.0 knockdown in SKOV3/Txr (B) cell lines. (C) Western blotting of apoptotic proteins PARP1 and cleaved caspase 3 in SKOV3 and SKOV3/Txr cells with H1.0 overexpression or knockdown. SF, sensitization factor; Experiments were performed independently in triplicate (*p < 0.05, **p < 0.01, ***p < 0.001)
To confirm that the association between H1.0 expression and paclitaxel sensitivity was not dependent on the cell lines used, we tested other paclitaxel‐resistant ovarian cancer cells established in our laboratory (i.e., 2774/Txr cells derived from the MDAH2774 cell line). 2774/Txr cells treated with paclitaxel showed a RF of 2.6 compared with parental cells, with a lower level of Txr than SKOV3/Txr cells (32‐fold more paclitaxel‐resistant compared with SKOV3 cells). Notably, H1.0 protein expression was upregulated 5.7‐fold in 2774/Txr cells compared with parental cells (Figure S1A,B). Consistent with the results described above for SKOV3/Txr cells, overexpression of H1.0 in MDAH2774 cells increased resistance to paclitaxel, whereas H1.0 knockdown sensitized 2774/Txr cells to paclitaxel (Figure S1C,D). These results suggested that H1.0 expression positively correlates with Txr in ovarian cancer cells.
3.3. PI3K is a critical upstream signal of H1.0 expression and stability
To explore the mechanism of H1.0 overexpression in Txr, we conducted mRNA stability assays in SKOV3/Txr cells using the RNA synthesis inhibitor actinomycin D. H1.0 mRNA was quantified by RT‐qPCR following actinomycin D treatment for various periods of time, with or without paclitaxel. We observed that H1.0 mRNA levels were stabilized in paclitaxel‐resistant SKOV3/Txr cells, as shown by the milder declining slope and longer half‐life (t1/2) compared with controls (Figure 3A‐a,b for statistic estimation). Conversely, H1.0 mRNA stability was not affected by paclitaxel in either cell line. We also observed that H1.0 protein expression was induced in a dose‐dependent manner by paclitaxel in SKOV3 and SKOV3/Txr cells, with higher levels observed in paclitaxel‐resistant cells (Figure S2). This observation suggests that paclitaxel‐induced H1.0 protein levels in Txr cells are due to increased mRNA levels, partly via gene transactivation as seen from the observation that H1.0 mRNA stability was not affected by paclitaxel in either cell line. Previous findings showed that the PI3K/AKT pathway is critical for the development of Txr in ovarian cancer. 19 , 20 We found that AKT phosphorylation was enhanced not only in highly paclitaxel‐resistant SKOV3/Txr cells but also in mildly paclitaxel‐resistant 2774/Txr cells compared with their respective parental cells (Figure 3B). To determine the signaling pathway involved in upregulating H1.0 in paclitaxel‐treated SKOV3/Txr cells, we examined H1.0 mRNA and protein expression in the presence of kinase inhibitors, including wortmannin (PI3Ki), SP600125 (JNKi), PD98059 (ERKi), and SB203580 (P38i). H1.0 protein (Figure 3C‐a) and mRNA (Figure 3C‐b) levels were reduced in the presence of PI3Ki. In addition, no increase of polyubiquitinated H1.0 levels was observed following paclitaxel treatment in ubiquitination assays, whereas higher polyubiquitinated H1.0 protein levels were observed in paclitaxel‐treated SKOV3/Txr cells in the presence of the PI3K inhibitor (Figure 3D). We also examined the effects of the clinical PI3K inhibitor alpelisib on H1.0 expression. Notably, alpelisib suppressed H1.0 in both SKOV3/Txr and 2774/Txr cells (Figure S3A). In addition, the combination of alpelisib and the AR inhibitor bicalutamide significantly enhanced paclitaxel sensitivity by inducing caspase 3 activation in SKOV3/Txr and 2774/Txr cells (Figure S3B). These results demonstrated that the PI3K/AKT pathway plays an important upstream regulatory role in Txr by enhancing H1.0 mRNA expression and protein stability.
FIGURE 3.
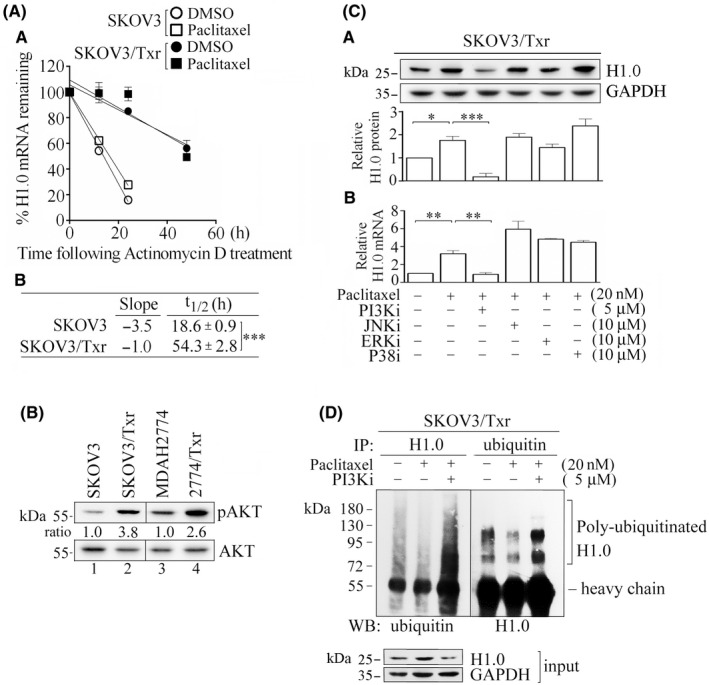
PI3K/AKT signaling modulates H1.0 expression in response to paclitaxel. (A‐a) Relative H1.0 mRNA levels following actinomycin D treatment in SKOV3 vs SKOV3/Txr cells in the presence of paclitaxel. (A‐b) Half‐life of H1.0 mRNA in SKOV3/Txr and SKOV3 cells. (B) Enhanced AKT phosphorylation in SKOV3/Txr and 2774/Txr cells. (C) Protein (C‐a) and mRNA (C‐b) expression analysis in the presence of PI3Ki, JNKi, ERKi, and P38i kinase inhibitors in paclitaxel‐treated SKOV3/Txr cells. (D) H1.0 ubiquitination analysis with or without PI3Ki in paclitaxel‐treated SKOV3/Txr cells. Experiments were performed independently in triplicate (*p < 0.05, **p < 0.01, ***p < 0.001)
3.4. H1.0 and AR mutually regulate each other to drive expression of downstream Txr genes
Our previous study showed that AR, Jun, Myc, and SP1 represent cryptic transcription factors involved in the upregulation of Txr genes in SKOV3/Txr cells. 4 RT‐qPCR analysis revealed that AR was the most downregulated transcription factor in paclitaxel‐treated SKOV3/Txr cells in which H1.0 was knockdown (Figure 4A). Additionally, AR and H1.0 levels were profoundly upregulated in paclitaxel‐resistant SKOV3/Txr and 2774/Txr cells, whereas H1.0 silencing significantly repressed AR expression (Figure 4B). This suggests that AR is a potential candidate to regulate H1.0 expression and that AR and H1.0 may cooperate to upregulate Txr genes in ovarian cancer cells. Previously, we have shown that AR is activated by paclitaxel and that this process drives the mRNA expression of ABC transporters (e.g., ABCB1, ABCG2), which promote Txr in ovarian cancer cells. 4 , 19 Here, we examined whether H1.0 and AR might also affect ABCB1 and ABCG2 protein levels following paclitaxel treatment. As depicted in Figure 4C, while both ABC transporters were highly overexpressed in Txr cells, ABCB1 and ABCG2 expression levels were slightly induced by paclitaxel, while the transporters were markedly reduced by AR knockdown. Notably, H1.0 protein expression was significantly repressed in AR‐knockdown SKOV3/Txr cells (Figure 4C). We sought to further examine the effects of H1.0 on the expression of Txr genes. Of note, ABCB1 and ABCG2 expression was significantly enhanced by H1.0 overexpression in SKOV3 cells compared with pLKO vector‐transfected cells. In contrast, the induced expression was repressed by the AR inhibitor bicalutamide (Figure 4D). This observation suggests that AR activity is amplified by paclitaxel in H1.0‐overexpressing cells. Furthermore, AR protein expression showed a significant increase in H1.0‐overexpressing cells (Figure 4D). In agreement with previous results, H1.0 overexpression and paclitaxel treatment enhanced AR expression and activity, leading to ABCB1 and ABCG2 gene transcription in SKOV3 ovarian cancer cells. These data suggest that both H1.0 and AR may contribute to paclitaxel resistance in ovarian cancer cells by inducing the expression of downstream Txr genes such as ABCB1 and ABCG2.
FIGURE 4.
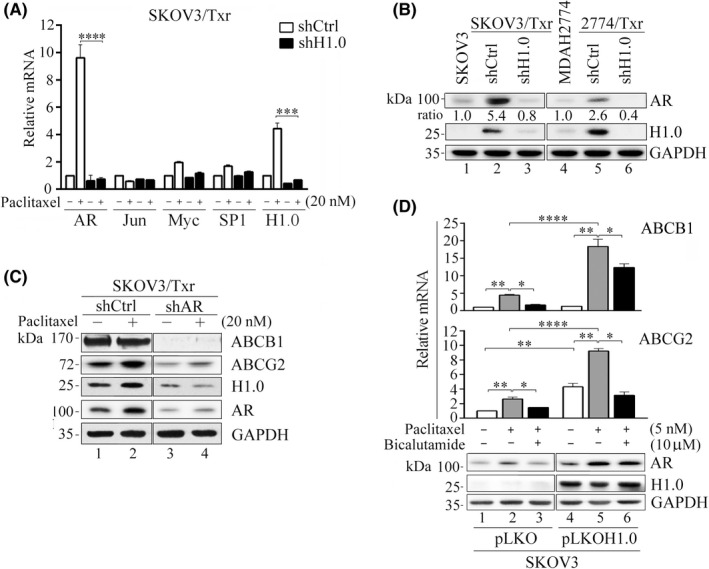
AR and H1.0 mutually regulate each other and produce similar effects on ABCB1 and ABCG2 expression. (A) Relative mRNA expression of the transcription factors AR, Jun, Myc, and SP1 following paclitaxel treatment. (B) AR protein expression was in accordance with H1.0 levels in both paclitaxel‐resistant SKOV3/Txr and 2774/Txr cells. (C) AR knockdown abolished ABCB1, ABCG2, and H1.0 expression. (D) Ectopic H1.0 overexpression enhanced AR protein, and ABCB1 and ABCG2 mRNA expression following paclitaxel treatment, whereas bicalutamide abolished the upregulation. Experiments were performed independently in triplicate (*p < 0.05, **p < 0.01, ***p < 0.001, ****p < 0.0001). Bicalutamide: AR inhibitor
3.5. H1.0 expression positively correlates with GCN5 expression and histone epigenetic activation
To study the molecular mechanism underlying the activity of H1.0 in Txr, we examined the effects of H1.0 on histone modifications. Our results showed that histone H3 was highly acetylated (i.e., H3K9Ac and H3K18Ac) in paclitaxel‐resistant SKOV3/Txr and 2774/Txr cells compared with parental cells, whereas these acetylation marks were reduced in H1.0‐knockdown Txr cells (Figure 5A). Such changes in core histone modifications are related to open chromatin and gene expression. 21 Together, these observations suggest that H1.0 is crucial for histone H3 acetylation and transcriptional activation.
FIGURE 5.
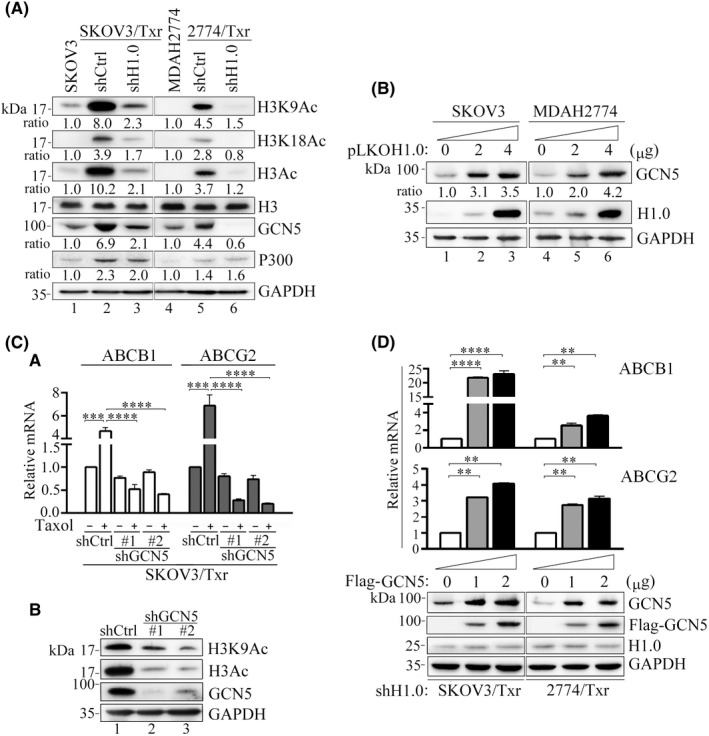
H1.0 expression positively correlates with histone acetylation and GCN5 expression. (A) Hyperacetylation of histone H3 in H1.0 overexpression paclitaxel‐resistant cells, whereas H1.0 knockdown reduced histone acetylation and repressed GCN5 expression. (B) Upregulation of GCN5 following increasing H1.0 overexpression in SKOV3 and MDAH2774 cell lines. (C) GCN5 knockdown abolishes (C‐a) paclitaxel‐induced ABCB1 and ABCG2 upregulation and (C‐b) H3 and H3K9 acetylation in SKOV3/Txr cells. (D) GCN5 overexpression enhances ABCB1 and ABCG2 mRNA levels in H1.0‐knockdown SKOV3/Txr and 2774/Txr cells. Experiments were performed independently in triplicate (*p < 0.05, **p < 0.01, ***p < 0.001)
To examine the critical factor associated with H1.0 and histone acetylation, we examined the HATs GCN5 and P300, which were found earlier to be upregulated in SKOV3/Txr cells. 19 Interestingly, GCN5 and P300 expression was enhanced in highly paclitaxel‐resistant SKOV3/Txr as well as in mildly paclitaxel‐resistant MDAH2774/Txr cells, whereas only GCN5 levels declined following H1.0 knockdown in Txr cells (Figure 5A). Conversely, H1.0 overexpression increased GCN5 levels in a dose‐dependent manner in SKOV3 and MDAH2774 cells (Figure 5B). This demonstrated that high H1.0 levels were positively correlate with GCN5 expression, although the exact mechanism remains unclear. We further attempted to verify that the GCN5 level controls the expression of Txr genes due to cooperation between GCN5 and H1.0. We first observed that ABCB1 and ABCG2 mRNA expression levels were significantly reduced by paclitaxel in paclitaxel‐resistant GCN5‐knockdown cells compared with shCtrl controls (Figure 5C‐a). Histone acetylation was profoundly reduced following GCN5 knockdown in SKOV3/Txr cells (Figure 5C‐b). Moreover, we observed that ectopic GCN5 expression considerably improved ABCB1 and ABCG2 mRNA levels in H1.0‐knockdown SKOV3/Txr and 2774/Txr cells (Figure 5D). These results indicated that GCN5 expression is downstream of H1.0 and that GCN5 may cooperate with H1.0 to affect histones and Txr gene expression.
3.6. Ectopic GCN5 expression rescues AR promoter binding ability in paclitaxel‐resistant H1.0‐knockdown ovarian cancer cells
The above data showed that H1.0 knockdown repressed GCN5 levels and reduced histone activation and Txr gene expression. In our previous study, epigenetic modifications were found to be involved in AR‐mediated transactivation of the ABCB1 promoter. 17 These results prompted us to verify whether ectopic GCN5 expression might rescue the reduced histone acetylation observed following H1.0 knockdown in AR‐mediated transactivation of ABCB1 and ABCG2 genes. As shown in Figure 6A, high H3Ac levels were observed following GCN5 overexpression in H1.0‐knockdown paclitaxel‐resistant cells. In addition, suppressed AR expression levels were also reversed by ectopic GCN5 expression compared with mock transfection in H1.0‐knockdown SKOV3/Txr and 2774/Txr cells (Figure 6A).
FIGURE 6.
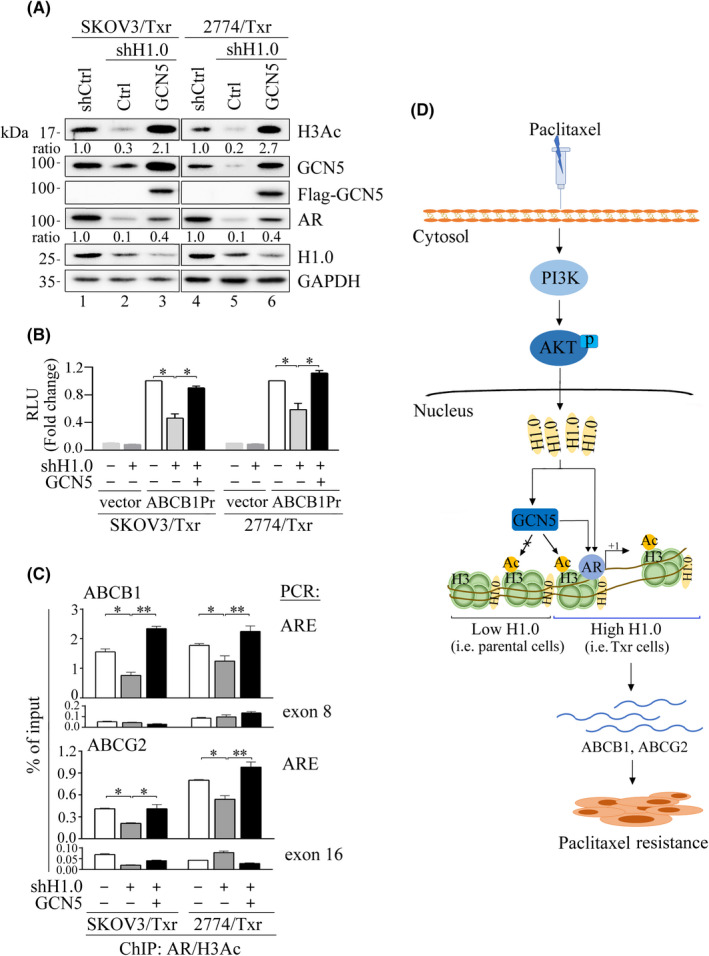
Association between H1.0, GCN5, and AR in transcriptional activation of Txr genes. (A) H1.0 knockdown significantly reduces H3Ac and AR expression, which were notably restored by GCN5 overexpression in paclitaxel‐resistant cells. (B) GCN5 overexpression rescues ABCB1 promoter (ABCB1Pr) activity in H1.0‐knockdown SKOV3/Txr and 2774/Txr cells. Each assay was normalized against Renilla luciferase activity. (C) AR‐binding affinity on ABCB1 and ABCG2 promoters was diminished by H1.0 knockdown while binding capacity was restored by GCN5 overexpression as shown by ChIP assays. PCR reactions of exons 8 and 16 were negative control for ABCB1 and ABCG2 genes, respectively. (D) Schematic diagram illustrating the role of H1.0 upregulation in paclitaxel‐resistant ovarian cancer cells. Activation of the PI3K/AKT signaling pathway enhances H1.0 expression, which cooperates with GCN5, recruiting the transcription factor AR and inducing the expression of the drug resistance genes ABCB1 and ABCG2, thereby enhancing cell viability and drug resistance. ARE: AR‐binding element. Experiments were performed independently in triplicate (*p < 0.05, **p < 0.01, ***p < 0.001)
We also observed that ABCB1 promoter activity was significantly repressed in H1.0‐knockdown cells, whereas GCN5 overexpression rescued the reporter activities in paclitaxel‐resistant H1.0‐knockdown cells, producing activity as high as that of control Txr cells (Figure 6B). These results show that GCN5 produces a beneficial impact on H1.0‐dependent gene transactivation. Chromatin immunoprecipitation assays showed that nucleosome occupancy of AR/H3Ac on ABCB1 and ABCG2 promoters were markedly repressed following H1.0 knockdown in both SKOV3/Txr and 2774/Txr cells treated with paclitaxel (Figure 6C). Notably, GCN5 overexpression rescued AR/H3Ac binding affinity compared with mock control expression as assayed by AR‐binding element (ARE) amplicons. These results indicated that H1.0 depletion repressed GCN5 expression and reduced active histone acetylation as well as AR transcriptional activity.
Based on these results, we propose a model in which paclitaxel activates the PI3K/AKT signaling pathway and leads to upregulation of H1.0, which in turn activates GCN5 and AR‐mediated expression of Txr genes, resulting in enhanced Txr in ovarian cancer cells (Figure 6D).
3.7. Association between H1.0, PI3K, AKT, and AR in ovarian cancer
We monitored the correlation significance between PI3K, AKT, AR, and H1.0 genes by using the co‐occurrence analysis subtool of cBioPortal, which is based on Fisher's exact test. We queried genes including PI3K subunits (PIK3R1, PIK3R2, PIK3R3, PIK3R4, PIK3R5, PIK3R6, PIK3CA, PIK3CB, PIK3CD), AKT subunits (AKT1, AKT2, AKT3), GCN5 (KAT2A), AR, and H1.0 in mutual exclusivity analysis in TCGA databases. Data were selected if PI3K, AKT, and GCN5 expression was significantly associated with AR and H1.0 expression. Odds ratio (OR) values >1 indicated that two genes showed a positive correlation. GCN5, PIK3R5, AR, AKT1, PIK3CB, and PIK3R3 were observed to be significantly co‐expressed with H1.0 (p < 0.05), producing OR values of >8, 6.89, 6.33, 4.30, 3.00, and 2.94, respectively (Table 1). In addition, both GCN5 and PIK3CA showed a positive correlation with AR expression (OR >8 and 2.25, respectively), consistent with our previous study that showed that PI3K/AKT and AR are involved in driving Txr gene expression and chemoresistance. 13 In addition, H1.0 was correlated with GCN5. These results demonstrated positive associations between PI3K/AKT/AR, GCN5, and H1.0, suggesting that this pathway is involved in Txr in ovarian cancer cells.
TABLE 1.
Results of co‐occurrence analysis between PI3K, AKT, AR, and H1.0 expression by cBioPortal
| Gene A | Gene B | Odds ratio (OR) | p‐value | Association |
|---|---|---|---|---|
| H1.0 | KAT2A | >8 | 0.001 | Tendency toward co‐occurrence |
| H1.0 | PIK3R5 | 6.89 | 0.014 | Tendency toward co‐occurrence |
| H1.0 | AKT1 | 4.30 | 0.011 | Tendency toward co‐occurrence |
| H1.0 | PIK3CB | 3.00 | 0.026 | Tendency toward co‐occurrence |
| H1.0 | PIK3R3 | 2.94 | 0.028 | Tendency toward co‐occurrence |
| AR | KAT2A | >8 | 0.031 | Tendency toward co‐occurrence |
| AR | H1.0 | 6.33 | 0.017 | Tendency toward co‐occurrence |
| AR | PIK3CA | 2.25 | 0.034 | Tendency toward co‐occurrence |
4. DISCUSSION
In this study, we studied the role of the nucleosome protein H1.0 in the regulation of paclitaxel resistance in two pairs of isogenic paclitaxel‐resistant ovarian cancer cell lines (i.e., SKOV3 versus SKOV3/Txr and MDAH2774 versus 2774/Txr). Based on previous Metacore data, 112 genes were found to be upregulated more than 10‐fold in paclitaxel‐resistant SKOV3/Txr cells, including 12 transcription factors such as AR, which were found to play a role in regulating Txr genes. 4 In the present study, H1.0 was found to be upregulated 31‐fold and 63‐fold based on cDNA microarray and RT‐qPCR analysis, respectively. Moreover, H1.0 expression was positively correlated with cancer recurrence and poor survival in ovarian cancer patients, suggesting that H1.0 plays a crucial role in ovarian cancer prognosis. Furthermore, ectopic H1.0 expression showed markedly impaired paclitaxel sensitivity in ovarian cancer cell lines. These results indicated that H1.0 represents an attractive target to reduce drug resistance due to its involvement in epigenetic regulation of Txr genes in ovarian cancer cells.
Previous studies have shown that the signaling pathway involving PI3K/AKT/mechanistic target of rapamycin (mTOR) controls cell growth, proliferation, and drug resistance in cancer cells. 22 , 23 Interestingly, we found that PI3K and AKT are modulated by paclitaxel in SKOV3/Txr and MDAH2774/Txr cells (Figure 3B). We observed that the inhibition of PI3K reduced H1.0 protein levels, in addition to destabilizing H1.0 mRNA and protein (Figure 3C). The cells exposed to the PI3K inhibitor were sensitized to paclitaxel as shown by altered cell viability. 4 In addition, H1.0 and AKT expression showed a positive correlation and co‐occurrence based on cBioPortal database analysis (Table 1), further demonstrating that the PI3K/AKT pathway and H1.0 are actively involved in our cellular Txr model.
H1.0 upregulation was observed in 2774/Txr cells, represented as early acquired paclitaxel resistance compared with SKOV3/Txr cells, and silencing H1.0 significantly sensitized these cells to paclitaxel, suggesting that H1.0 is essential for the development of acquired Txr. However, the activating role of the linker histone H1.0 in gene expression is currently incompletely understood. A study conducted by Delabar showed that the transcriptionally active chromatin fraction is enriched almost two‐fold in histone H1.0 compared with the fraction containing untranscribed sequences. 24 This observation suggests that H1.0 may specifically influence individual gene expression via association with potential partner proteins or epigenetic modifications, which may lead to the formation of chromatin regions that are either accessible or inaccessible for gene transcription associated with Txr.
Post‐translational modifications of linker histones, including phosphorylation, 25 acetylation, 26 , 27 methylation, 28 ubiquitination, 29 and ADP ribosylation, 30 have been linked with various nuclear processes, such as DNA damage, apoptosis, cell differentiation, and cancer progression. 31 An early study reported that H1 subtype H1.4 acetylation (H1.4K34Ac) may be involved in chromatin “opening” as well as recruiting transcription factors that facilitate gene expression. 32 Our study on H1.0 expression/activation highlights a transcriptional axis of regulation of Txr genes by H1.0 in association with GCN5 in response to paclitaxel. GCN5 mainly affects histone H3 and H4 acetylation, regulating chromatin structure and acting as a transcription activator. 33 , 34 In the present study, we found that H1.0 knockdown significantly repressed histone H3 acetylation (Figure 5A), which was elevated in Txr cells, leading to reduced AR occupancy on ABCB1 and ABCG2 promoters (Figure 6C). Taken together, these results suggest that H1.0 may play a dual role in chromatin organization and transcriptional activation.
GCN5 is responsible for strongly acetylating histone H3 sites in promoter regions in vivo. 35 We observed that H1.0 knockdown decreased GCN5 expression leading to reduced histone H3 acetylation, as is expected from its role as a HAT, in Txr cells (Figure 5A). Moreover, GCN5 expression was positively correlated with H1.0 levels in H1.0‐overexpressing ovarian cancer cells (Figure 5B), confirming the strong correlation between these two factors and the role of H1.0 in chromatin epigenetic modifications. Our study is the first report that describes the link and cooperation between H1.0 and GCN5 within the context of Txr in ovarian cancer. However, further studies will be needed to determine (1) whether high H1.0 expression recruits GCN5 and other accessory factors for modulating the expression of specific genes, and (2) how H1.0 modulates GCN5 expression and functions. This mechanism remains to be elucidated to fully unravel the crosstalk between GCN5 and H1.0.
A better understanding of the way H1.0 regulates Txr genes has provided insights into the phenomenon of drug resistance in ovarian cancer cells and has helped to identify potential targets for treating ovarian cancer associated with chemoresistance and poor prognosis. Additionally, our results also open opportunities for studying epigenetic regulation of drug resistance genes in other cancers.
DISCLOSURE
We declared that there no author of this manuscript is a current Editor or on the Editorial Board Member of Cancer Science. The authors declared that they have no conflict of interest.
APPROVAL OF THE RESEARCH PROTOCOL BY AN INSTITUTIONAL REVIEWER BOARD
N/A.
INFORMED CONSENT
N/A.
REGISTRY AND THE REGISTRATION NO. OF THE STUDY/TRIAL
N/A.
ANIMAL STUDIES
N/A.
Supporting information
Figure S1
Figure S2
Figure S3
Table S1
ACKNOWLEDGMENTS
This study was supported by Chang Gung University of Science and Technology, Chang Gung Memorial Hospital (Contract No. ZRRPF3L0091, CMRPF1K0101 to NKS; CMRPD3E0092 and BMRP071 to CCKC), and the Ministry of Science and Technology of Taiwan (MOST106‐2320‐B‐255‐004).
Kohli A, Huang S‐L, Chang T‐C, Chao C‐K, Sun N‐K. H1.0 induces paclitaxel‐resistance genes expression in ovarian cancer cells by recruiting GCN5 and androgen receptor. Cancer Sci. 2022;113:2616‐2626. doi: 10.1111/cas.15448
Abhidha Kohli and Shang‐Lang Huang contributed equally to this study.
Contributor Information
Chuck C.‐K. Chao, Email: cckchao@mail.cgu.edu.tw.
Nian‐Kang Sun, Email: nksun@mail.cgust.edu.tw.
REFERENCES
- 1. Weaver BA. How paclitaxel/paclitaxel kills cancer cells. Mol Biol Cell. 2014;25:2677‐2681. [DOI] [PMC free article] [PubMed] [Google Scholar]
- 2. Luqmani YA. Mechanisms of drug resistance in cancer chemotherapy. Med Princ Pract. 2005;14(Suppl 1):35‐48. [DOI] [PubMed] [Google Scholar]
- 3. Krech T, Scheuerer E, Geffers R, Kreipe H, Lehmann U, Christgen M. ABCB1/MDR1 contributes to the anticancer drug‐resistant phenotype of IPH‐926 human lobular breast cancer cells. Cancer Lett. 2012;315:153‐160. [DOI] [PubMed] [Google Scholar]
- 4. Sun NK, Huang SL, Lu HP, Chang TC, Chao CC. Integrative transcriptomics‐based identification of cryptic drivers of paclitaxel‐resistance genes in ovarian carcinoma cells: analysis of the androgen receptor. Oncotarget. 2015;6:27065‐27082. [DOI] [PMC free article] [PubMed] [Google Scholar]
- 5. Torres CM, Biran A, Burney MJ, et al. The linker histone H1.0 generates epigenetic and functional intratumor heterogeneity. Science. 2016;353:aaf1644. [DOI] [PMC free article] [PubMed] [Google Scholar]
- 6. Bustin M, Catez F, Lim JH. The dynamics of histone H1 function in chromatin. Mol Cell. 2005;17:617‐620. [DOI] [PubMed] [Google Scholar]
- 7. Happel N, Doenecke D. Histone H1 and its isoforms: contribution to chromatin structure and function. Gene. 2009;431:1‐12. [DOI] [PubMed] [Google Scholar]
- 8. Girardot V, Rabilloud T, Yoshida M, Beppu T, Lawrence JJ, Khochbin S. Relationship between core histone acetylation and histone H1(0) gene activity. Eur J Biochem. 1994;224:885‐892. [DOI] [PubMed] [Google Scholar]
- 9. Sakai M, Tujimura‐Hayakawa T, Yagi T, et al. The GCN5‐CITED2‐PKA signalling module controls hepatic glucose metabolism through a cAMP‐induced substrate switch. Nat Commun. 2016;7:13147. [DOI] [PMC free article] [PubMed] [Google Scholar]
- 10. Gao B, Kong Q, Zhang Y, et al. The histone acetyltransferase Gcn5 positively regulates T cell activation. J Immunol. 2017;198:3927‐3938. [DOI] [PMC free article] [PubMed] [Google Scholar]
- 11. Majaz S, Tong Z, Peng K, et al. Histone acetyl transferase GCN5 promotes human hepatocellular carcinoma progression by enhancing AIB1 expression. Cell Biosci. 2016;6:47. [DOI] [PMC free article] [PubMed] [Google Scholar]
- 12. Zhu Y, Liu C, Armstrong C, Lou W, Sandher A, Gao AC. Antiandrogens inhibit ABCB1 efflux and ATPase activity and reverse docetaxel resistance in advanced prostate cancer. Clin Cancer Res. 2015;21:4133‐4142. [DOI] [PMC free article] [PubMed] [Google Scholar]
- 13. Sun NK, Huang SL, Chang PY, Lu HP, Chao CC. Transcriptomic profiling of paclitaxel‐resistant ovarian cancer cells identifies FKBP5 and the androgen receptor as critical markers of chemotherapeutic response. Oncotarget. 2014;5:11939‐11956. [DOI] [PMC free article] [PubMed] [Google Scholar]
- 14. Wu ZZ, Lu HP, Chao CC. Identification and functional analysis of genes which confer resistance to cisplatin in tumor cells. Biochem Pharmacol. 2010;80:262‐276. [DOI] [PubMed] [Google Scholar]
- 15. Chao CC, Lee YL, Cheng PW, Lin‐Chao S. Enhanced host cell reactivation of damaged plasmid DNA in HeLa cells resistant to cis‐diamminedichloro‐ platinum(II). Cancer Res. 1991;51:601‐605. [PubMed] [Google Scholar]
- 16. Rueden CT, Schindelin J, Hiner MC, et al. ImageJ2: ImageJ for the next generation of scientific image data. BMC Bioinformatics. 2017;18:529. [DOI] [PMC free article] [PubMed] [Google Scholar]
- 17. Sun NK, Kohli A, Huang SL, Chang TC, Chao CC. Androgen receptor transcriptional activity and chromatin modifications on the ABCB1/MDR gene are critical for paclitaxel resistance in ovarian cancer cells. J Cell Physiol. 2019;234:8760‐8775. [DOI] [PubMed] [Google Scholar]
- 18. Cerami E, Gao J, Dogrusoz U, et al. The cBio cancer genomics portal: an open platform for exploring multidimensional cancer genomics data. Cancer Discov. 2012;2:401‐404. [DOI] [PMC free article] [PubMed] [Google Scholar]
- 19. Sun NK, Huang SL, Chang TC, Chao CC. TLR4 and NFκB signaling is critical for paclitaxel resistance in ovarian carcinoma cells. J Cell Physiol. 2018;233:2489‐2501. [DOI] [PubMed] [Google Scholar]
- 20. Huang SL, Chang TC, Chao CCK, Sun NK. Role of the TLR4‐androgen receptor axis and genistein in paclitaxel‐resistant ovarian cancer cells. Biochem Pharmacol. 2020;177:113965. [DOI] [PubMed] [Google Scholar]
- 21. Li B, Carey M, Workman JL. The role of chromatin during transcription. Cell. 2007;128:707‐719. [DOI] [PubMed] [Google Scholar]
- 22. Simioni C, Martelli AM, Zauli G, et al. Targeting the phosphatidylinositol 3‐kinase/Akt/mechanistic target of rapamycin signaling pathway in B‐lineage acute lymphoblastic leukemia: an update. J Cell Physiol. 2018;233:6440‐6454. [DOI] [PubMed] [Google Scholar]
- 23. Liu J, Wu DC, Qu LH, Liao HQ, Li MX. The role of mTOR in ovarian neoplasms, polycystic ovary syndrome, and ovarian aging. Clin Anat. 2018;31:891‐898. [DOI] [PubMed] [Google Scholar]
- 24. Delabar JM. Nonrandom location of H1‐H1 degree histones on chromatin of mouse liver and brain. J Biol Chem. 1985;260:12622‐12628. [PubMed] [Google Scholar]
- 25. Roth SY, Allis CD. Chromatin condensation: does histone H1 dephosphorylation play a role? Trends Biochem Sci. 1992;17:93‐98. [DOI] [PubMed] [Google Scholar]
- 26. Mannironi C, D'Incalci M. Doxorubicin induces the acetylation of histone H1 in a human colon cancer cell line (LoVo/DX) selected for resistance to the drug, but not in the sensitive parental line (LoVo). Biochem Biophys Res Commun. 1988;155:1221‐1229. [DOI] [PubMed] [Google Scholar]
- 27. Vaquero A, Scher M, Lee D, Erdjument‐Bromage H, Tempst P, Reinberg D. Human SirT1 interacts with histone H1 and promotes formation of facultative heterochromatin. Mol Cell. 2004;16:93‐105. [DOI] [PubMed] [Google Scholar]
- 28. Tuck MT, Farooqui JZ, Paik WK. Two histone H1‐specific protein‐lysine N‐methyltransferases from Euglena gracilis. Purification and characterization. J Biol Chem. 1985;260:7114‐7121. [PubMed] [Google Scholar]
- 29. Lesner A, Kartvelishvili A, Lesniak J, et al. Monoubiquitinated histone H1B is required for antiviral protection in CD4(+)T cells resistant to HIV‐1. Biochemistry. 2004;43:16203‐16211. [DOI] [PubMed] [Google Scholar]
- 30. Rulten SL, Fisher AE, Robert I, et al. PARP‐3 and APLF function together to accelerate nonhomologous end‐joining. Mol Cell. 2011;41:33‐45. [DOI] [PubMed] [Google Scholar]
- 31. Izzo A, Schneider R. The role of linker histone H1 modifications in the regulation of gene expression and chromatin dynamics. Biochim Biophys Acta. 2016;1859:486‐495. [DOI] [PubMed] [Google Scholar]
- 32. Kamieniarz K, Izzo A, Dundr M, et al. A dual role of linker histone H1.4 Lys 34 acetylation in transcriptional activation. Genes Dev. 2012;26:797‐802. [DOI] [PMC free article] [PubMed] [Google Scholar]
- 33. Grant PA, Eberharter A, John S, Cook RG, Turner BM, Workman JL. Expanded lysine acetylation specificity of Gcn5 in native complexes. J Biol Chem. 1999;274(9):5895‐5900. [DOI] [PubMed] [Google Scholar]
- 34. Kuo MH, Brownell JE, Sobel RE, et al. Transcription‐linked acetylation by Gcn5p of histones H3 and H4 at specific lysines. Nature. 1996;383:269‐272. [DOI] [PubMed] [Google Scholar]
- 35. Suka N, Suka Y, Carmen AA, Wu J, Grunstein M. Highly specific antibodies determine histone acetylation site usage in yeast heterochromatin and euchromatin. Mol Cell. 2001;8:473‐479. [DOI] [PubMed] [Google Scholar]
Associated Data
This section collects any data citations, data availability statements, or supplementary materials included in this article.
Supplementary Materials
Figure S1
Figure S2
Figure S3
Table S1