Abstract
When grown in rich medium, Escherichia coli exhibits a drastic reduction of the number of viable cells at the beginning of stationary phase. The decline of cell viability was retarded by disruption of the ssnA gene, which was identified as a gene subject to RpoS-dependent negative regulation. Moreover, ssnA expression was induced at the time of decline of cell viability at early stationary phase. The viability decline was augmented in the rpoS background, and this augmentation was suppressed by ssnA mutation. Cloning of the ssnA gene in a multicopy plasmid, pBR322, caused small colony formation and slow growth in liquid medium. Cells harboring the ssnA clone showed aberrant morphology that included enlarged and filamentous shapes. The gene product was identified as a 44-kDa soluble protein, but its function could not be deduced by homology searching. From these results, we conclude that ssnA is expressed in response to a phase-specific signal(s) and that its expression level is controlled by RpoS, by a mechanism which may contribute to determination of cell number in the stationary phase.
Escherichia coli has a life cycle in which exponential growth occurs in the presence of sufficient nutrients but ceases as nutrients are consumed or as growth-suppressing factors are accumulated; at the same time, cells develop resistance to a variety of environmental stresses (2, 12, 19). In the natural environment, E. coli usually lives under starved conditions, coexisting with a large number of other microorganisms, and rarely encounters circumstances which allow it to grow exponentially. Thus, the natural conditions are comparable to those of stationary phase in in vitro experiments, in which many specific genes are expected to function. To identify stress-specific genes is thus important for elucidation of the mechanism of maintenance of the bacterial life cycle in nature.
A stationary phase-specific ςS factor, ςS, encoded by rpoS, has been extensively characterized (7, 9, 12, 23, 24, 26). The factor is believed to be a master regulator in the network of gene expression in stationary phase and to control many genes responding to various physiological stresses (8, 9). When grown in rich medium, E. coli exhibits a large decrease in viability, by one to two orders of magnitude, at the beginning of stationary phase, and after that, it retains the same viability for many days (27). To explain this phenomenon, Zambrano and Kolter (26) proposed the GASP (growth advantage in stationary phase) model, in which mutants that acquire a competitive advantage take the place of the population of dying cells. As one of such mutants, rpoSatt, which was isolated from prolonged culture, was reported to express the GASP phenotype in mixed cultures with the wild type (26, 27). However, the physiological role and cause of the decline of cell viability are still unknown.
In our previous study, the E. coli ssn (subject to RpoS-dependent negative regulation in stationary phase) genes were identified (21). One of the genes, designated ssnA, was shown to be specifically induced in stationary phase when cell viability was decreasing and was expressed at a much higher level in the rpoS background than in the wild type. Here, we demonstrate that the ssnA gene is involved in the decline of cell viability observed at the beginning of stationary phase and that there is a functional relationship between ssnA and rpoS affecting determination of cell viability. We have begun the molecular analysis by focusing on the bacterial cell death event at the beginning of stationary phase.
MATERIALS AND METHODS
Materials, bacterial strains, and plasmids.
Restriction enzymes and T4 DNA ligase were purchased from Takara Shuzo (Kyoto, Japan) and New England Biolabs (Beverly, Mass.). The DNA sequencing kit was from Amersham (Little Chalfont, Buckinghamshire, United Kingdom). Other chemicals were analytical grade. E. coli strains and plasmids used in this study are shown in Table 1.
TABLE 1.
Bacterial strains and plasmids used in this study
| Strain or plasmid | Genotype or description | Reference or source |
|---|---|---|
| E. coli strains | ||
| W3110 | IN(rrnD-rrnE) rph-1 | K. Mizobuchi |
| TG1 | supE hsdΔ5 thi Δ(lac-proAB) F’ traD36 proAB+ lacIqlacZΔM15 | 15 |
| MC1000 | araD139 Δ(ara-leu)7697 ΔlacX74 galU galK rpsL | 5 |
| BL21 (DE3) | F′ dcm ompT hsdS(rB− mB−) gal λDE3(lacI lacUV5-T7 gene 1 ind-1 Sam7 nin-5) | RIKEN DNA Bank |
| UM122 | rpoS::Tn10 | A. Ishihama |
| YU449 | W3110 ssnA::kan | This work |
| YU450 | W3110 rpoS::Tn10 | This work |
| YU451 | W3110 ssnA::kan rpoS::Tn10 | This work |
| YU381 | MC1000 rpoS::Tn10 | 21 |
| Plasmids | ||
| pBR322 | Ampr Tetr | 3 |
| pACYC177 | Ampr Kanr | 6 |
| pBRSSNA | pBR322 with the 2.9-kb PstI fragment bearing ssnA | This work |
| pBRSSNA-ND | pBR322 with the 2.3-kb PstI-NruI fragment from pBRSSNA | This work |
| pBRSSNA-NP | pBR322 with the 0.6-kb PstI-NruI fragment from pBRSSNA | This work |
| pBRSSNA-MD | pBRSSNA lacking the 0.5-kb MluI fragment | This work |
| pACYCSSNA | pACYC177 with the 2.9-kb PstI fragment bearing ssnA | This work |
| pVEX11 | Ampr, pBR322 with T7 promoter of φ 10 gene and its terminator | 20 |
| pVEXSSNA | pVEX11 with the 1.3-kb XbaI-BamHI fragment bearing ssnA | This work |
| pJQ200mp18 | sacB Genr | 14 |
| pJQ200SSNA | pJQ200mp18 with the 2.9-kb PstI fragment bearing ssnA | This work |
| pJQ200SSNA-K | pJQ200SSNA derivative with insertion of kan at the NruI site | This work |
| pCB182 | lacZ galK Ampr | 17 |
| pSSNALAC | ssnA-lacZ operon fusion in pCB182 | This work |
Bacterial growth conditions and media.
E. coli cells were grown with reciprocal shaking (100 times/min) at 37°C in LB (1% Bacto Tryptone, 0.5% yeast extract, 0.5% NaCl) or M9 minimal medium (13) with 0.2% glucose. For time course experiments, one colony was inoculated into 1.5 ml of medium. After a 12-h preculture, cells were diluted to a turbidity corresponding to an optical density at 600 nm (OD600) of 0.1. Thirty microliters of this cell suspension was inoculated into 30 ml of medium in a 100-ml Erlenmeyer flask, and cell growth was then monitored under the conditions indicated in the text.
Colony sizes of different strains were compared on 1.5% agar LB plates after 20 h of incubation. When used, the following drugs were added at these final concentrations: ampicillin, 100 μg/ml; tetracycline, 8 μg/ml; and kanamycin, 50 μg/ml.
Construction of ssnA clone and its derivatives.
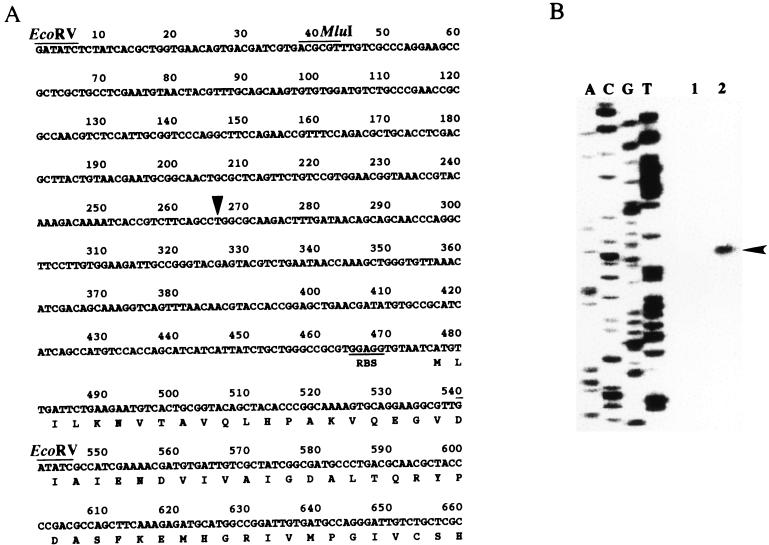
Conventional recombinant DNA techniques (15) were used. The 2.9-kb PstI fragment bearing ssnA was isolated from the Kohara clone, 6A1 (11), and inserted into the PstI site of pBR322 or pACYC177, generating pBRSSNA or pACYCSSNA, respectively. Deletion constructs were made by inserting the 2.3-kb PstI-NruI or 0.6-kb NruI-PstI fragment from pBRSSNA into the PstI-ScaI site in pBR322, generating pBRSSNA-ND or pBRSSNA-NP, respectively. pBRSSNA-MD was generated by deleting a 0.5-kb MluI fragment from pBRSSNA. To construct the ssnA-lacZ operon fusion, the 0.5-kb EcoRV fragment bearing the ssnA promoter and the region corresponding to the N-terminal 22 amino acid residues (see Fig. 6A) was subcloned from pBRSSNA into pCB182, generating pSSNALAC.
FIG. 6.
Nucleotide sequence of the region around the promoter of ssnA and its transcription initiation site. (A) The nucleotide sequence of the region around the ssnA promoter and the N-terminal amino acid sequence of SsnA are shown. A possible ribosome-binding sequence (RBS) is underlined. The transcriptional start site of ssnA is indicated by a triangle. Restriction sites used in this study are indicated above the sequences. (B) Primer extension was performed using a fluorescein isothiocyanate-labeled primer as described in Materials and Methods. Total RNA (1 μg) from MC1000 harboring pSSNALAC in exponential phase (6-h culture) (lane 1) or in stationary phase (48-h culture) (lane 2) was used. The sequencing ladder (lanes A, C, G, and T) was obtained by using pSSNALAC DNA as a template and the same primer. An arrowhead indicates the extended band.
Morphological observation.
Cells were grown at 37°C in LB medium, and samples taken at the late exponential phase were diluted with 100 mM potassium phosphate (pH 7.0) and immediately incubated with acridine orange or 4′,6-diamidino-2-phenylindole at a final concentration of 30 or 5 μg/ml, respectively, at room temperature for 3 min. Stained cells were filtered through a polycarbonate membrane and viewed with a UV-1A filter (EX 365/10) for staining with 4′,6-diamidino-2-phenylindole or a B-2A filter (EX450-490) for staining with acridine orange under a Nikon E600 microscope with fluorescence capability (Nikon, Tokyo, Japan). Photomicrographs were taken with a charge-coupled device camera with an exposure time of 10 ms and printed by using a CP710A printer (Mitsubishi, Tokyo, Japan). Reagent solutions and buffers employed in the cell-staining procedures were used after being passed through cellulose acetate filters (pore size, 0.2 μm).
Mutant construction.
An ssnA-disrupted mutant of W3110 was constructed as follows. The 2.9-kb PstI fragment bearing ssnA was inserted into the PstI site of pJQ200mp18 (14), generating pJQ200SSNA. The BglII-BamHI fragment bearing the kanamycin resistance gene (kan) from ColE1::Tn5 (provided by T. Miki) was blunt ended by T4 DNA polymerase treatment (15) and inserted into the NruI site in ssnA on pJQ200SSNA, to disrupt the ssnA open reading frame (ORF). The resultant recombinant, pJQ200SSNA-K, was introduced into W3110 to allow homologous recombination between the kan-inserted ssnA gene on the plasmid and the ssnA gene on the genome, and recombinants were screened on LB plates containing 5% sucrose and kanamycin (15 μg/ml). Gene disruption was confirmed by Southern blotting by using DNA fragments bearing ssnA or kan as probes.
From the resultant W3110 ssnA::kan (YU449) or UM122 rpoS::Tn10 (provided by A. Ishihama), W3110 rpoS::Tn10 (YU450) and W3110 ssnA::kan rpoS::Tn10 (YU451) were made by P1 transduction (13).
Homology searching.
Homology searching was performed by using FASTA and BLAST in the GenBank, DDBJ, EMBL, SWISS-PRO, and NBRF-PIR databases. Comparisons of nucleotide sequences or amino acid sequences were conducted by using GENETYX (Software Development, Tokyo, Japan).
SsnA overproduction and cell fractionation.
The 1.3-kb DNA fragment bearing ssnA was amplified by PCR by using primers 5′-GGGTCTAGAGGAG GTGTAATCATGTT-3′ and 5′-GGAGGATCCCATTTATGCCAGCGCAT-3′, which have the XbaI and BamHI sites, respectively, at their 5′ ends, as indicated by underlines. The amplified fragment was digested with XbaI and BamHI and inserted into the XbaI-BamHI site downstream of the T7 promoter in pVEX11. The region encompassing ssnA in the recombinant, pVEXSSNA, was sequenced to ensure that no mutations had been introduced during amplification of the DNA fragment. BL21 (DE3) cells harboring pVEXSSNA were grown at 37°C in LB medium containing ampicillin, and after 1 mM isopropyl-β-d-thiogalactopyranoside (IPTG) was added to obtain an OD600 of approximately 1.0, cultivation was further continued for 4 h. The expressed SsnA protein was separated from other proteins by sodium dodecyl sulfate–12% polyacrylamide gel electrophoresis and transferred to a polyvinylidene difluoride membrane. The portion of the membrane containing the protein band was cut out, and the protein was subjected to amino acid sequencing, as described previously (25).
Subcellular fractionation was performed by a modification of the method described previously (25). Cells were harvested from 250-ml cultures by centrifugation at 8,000 × g for 5 min at 4°C, washed with 0.85% NaCl, and suspended in 10 mM Tris-HCl (pH 7.5). The suspended cells were disrupted by passing twice through a French pressure cell press (16,000 lb/in2). After removal of cell debris by centrifugation at 8,000 × g for 10 min, the membrane and soluble fractions were separated by centrifugation at 86,000 × g for 90 min. The resultant membrane fraction was resuspended by homogenization in a volume of 10 mM Tris-HCl (pH 7.5) equivalent to the volume of the soluble fraction.
Primer extension and RT-PCR analysis.
E. coli total RNA was prepared as described by Aiba et al. (1). For primer extension analysis, 1 μg of total RNA isolated from MC1000 or YU381 harboring pSSNALAC was subjected to the reverse transcription (RT) reaction using a fluorescein isothiocyanate-labeled primer (5′-CGCCAGGGTTTTCCCAGTCACGAC-3′) as previously described (10). The RT reaction was performed at 60°C with rTth DNA polymerase XL (Perkin-Elmer-Cetus Instruments). A standard nucleotide sequence ladder was obtained with the same primer and pSSNALAC DNA as a template. To analyze expression along with cell growth, an RT reaction was carried out at 60°C for 60 min with 0.1 μg of total RNA from W3110 or YU450 cells and one of the primers used in the ssnA amplification, and subsequently PCR consisting of denaturing at 94°C for 1 min, annealing at 60°C for 2 min, and extension at 72°C for 5 min was carried out by using the two primers used for the ssnA amplification. The products obtained after PCR were analyzed by 0.9% agarose gel electrophoresis and stained with ethidium bromide. Their relative amounts were compared by measuring band densities after the color of the image taken was reversed by using a model GS-700 Imaging Densitometer (BIO-RAD). Linearity of the amplification was observed up to at least 27 cycles.
β-Galactosidase assay.
For analysis of ssnA expression during the course of cell growth, MC1000 or YU381 cells harboring pSSNALAC were grown at 37°C in LB containing ampicillin. As the cell growth progressed, samples were taken from the cell culture and β-galactosidase activity was measured according to the procedure described by Miller (13). For determination of activity, the following formula was used (13): Miller units = 1,000 × (OD420 − 1.75 × OD550)/(t × v × OD600) OD420 and OD550 were read from the reaction mixture, OD600 reflects the cell density just before assay, t is the time of reaction expressed in minutes, and v is the volume of culture used in the assay expressed in milliliters.
RESULTS
Growth inhibition by the ssnA gene cloned in a multicopy plasmid, pBR322.
Based on the genomic position of the ssnA gene at 65 min in the E. coli chromosome (22), the 2.9-kb PstI fragment bearing the ssnA gene was subcloned from Kohara clone 6A1 into pBR322, generating pBRSSNA. We determined the nucleotide sequence of the fragment and found one ORF, the sequence of which precisely agreed with that of orf464 in the GenBank database. However, we revised the orf464 to orf442 because the N-terminal 9-amino-acid sequence that was determined in this study (see below) corresponds to the 23rd to 31st codons of orf464.
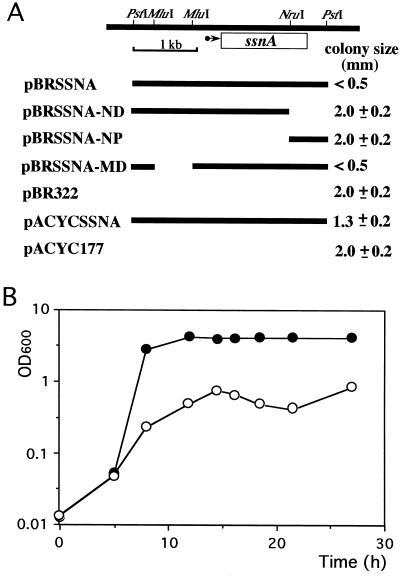
Cells harboring pBRSSNA were found to grow slowly on plates, indicating that ssnA may have a negative effect on cell growth. To examine whether ssnA causes cell growth inhibition, we constructed several deletion-bearing derivatives and tested their effects on cell growth (Fig. 1A). E. coli W3110 harboring pBRSSNA or pBRSSNA-MD formed small colonies. In contrast, cells harboring pBRSSNA-ND or pBRSSNA-NP, which lack part of ssnA, formed normal-sized colonies. This phenomenon was also observed with other E. coli strains, TG1 and MC1000, and with another clone, pACYCSSNA, which is a pACYC177 derivative with a copy number lower than that of pBR322. Therefore, the formation of small colonies appeared to depend on the presence of the intact ssnA gene.
FIG. 1.
Effect of the ssnA gene on cell growth. E. coli W3110 cells harboring pBRSSNA, pBRSSNA-ND, pBRSSNA-NP, pBRSSNA-MD, pBR322 (vector), pACYCSSNA, or pACYC177 (vector) were grown until log phase and plated on LB plates containing tetracycline or kanamycin (A). The mean diameters of the colonies were then compared after 20 h of incubation. The top diagram represents the physical map of the region around ssnA, and an arrow indicates the ssnA promoter position and transcriptional direction. Black bars represent the DNA fragments inserted into the vectors. (B) W3110 harboring pBR322 (closed circles) or pBRSSNA (open circles) were grown under the conditions described in Materials and Methods, and cell growth was determined by measuring OD600.
Growth inhibition by ssnA was also observed in liquid culture (Fig. 1B). Cells harboring pBRSSNA showed markedly slower growth than cells harboring the vector. In the cultures, insoluble sediments were observed as cell growth progressed, suggesting that the growth inhibition resulted in cell lysis.
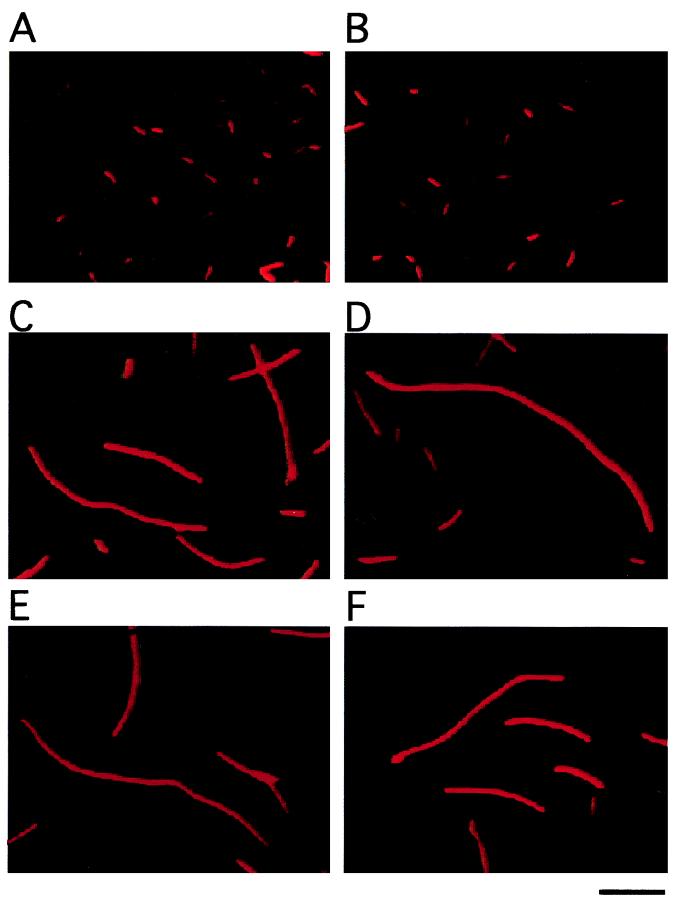
Growth-inhibited cells were morphologically analyzed by staining with acridine orange. When wild-type W3110 cells harboring the vector were grown at 37°C until the late exponential phase, they exhibited a rod shape (Fig. 2A and B), whereas most cells harboring pBRSSNA showed enlarged and filamentous shapes (Fig. 2C, D, E, and F). Cell staining with 4′,6-diamidino-2-phenylindole showed that the nucleoids formed lines at intervals in the cell filaments (data not shown), suggesting that normal DNA replication occurred in the cells. Lysed cells were also observed in the presence of pBRSSNA. Therefore, increased expression of ssnA causes aberrant morphology of the host cell, presumably by hampering some cell function, such as cell division.
FIG. 2.
Morphological analysis carried out by staining with acridine orange. Cells grown for 14 h in LB medium were diluted and stained. W3110 harboring pBR322 (A and B) or pBRSSNA (C, D, E, and F) was analyzed by staining with acridine orange. The scale bar corresponds to 10 μm.
Characterization of the ssnA mutant.
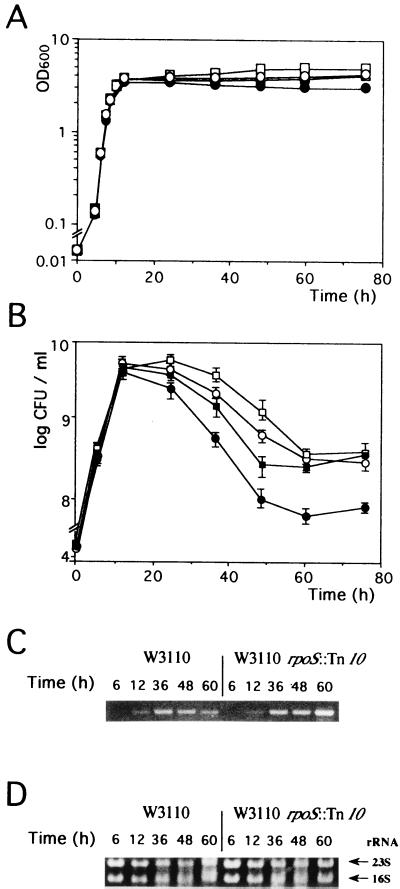
To explore the function of the ssnA gene, we constructed an ssnA-disrupted strain by inserting the kanamycin resistance gene into the genomic ssnA gene of W3110. Consequently, although the ssnA mutant, YU449, was not different in colony size and form from the parent strain on LB plates, its cell density and viability were significantly different from those of the parent strain at the beginning of stationary phase (Fig. 3A and B). During the exponential phase, the growth curves of the ssnA and wild-type strains were essentially the same in terms of OD and cell viability. Just after cells entered the stationary phase, YU449 showed a cell viability pattern different from that of W3110. As previously reported (27), the number of viable cells of W3110 was observed to increase to about 5 × 10⁹ CFU/ml and then to decrease by more than one order of magnitude, to about 2 × 10⁸ CFU/ml. In contrast, YU449 showed a significant retardation of the decrease in cell viability (Fig. 3B), indicating that the ssnA mutation allows the cells to survive longer than the wild type in this phase. After 60 h, the numbers of viable cells of both strains were similarly stable (1 × 10⁸ to 3 × 10⁸ CFU/ml) for several days, and the morphology of both appeared to be essentially the same (data not shown). The OD of YU449 in stationary phase was found to gradually increase and to be higher than that of the wild type. The reason for this may have been reduced lysis of dead cells.
FIG. 3.
Cell growth and viability of W3110, YU449 (W3110 ssnA::kan), YU450 (W3110 rpoS::Tn10), and YU451 (W3110 ssnA::kan rpoS::Tn10) and expression of the ssnA gene. Cell growth at 37°C in LB medium was monitored by measuring OD600 (A). At the same time, the number of viable cells (expressed as CFU per milliliter) was determined by counting the number of colonies formed after 20 h on LB plates (B). In both A and B, closed squares, open squares, closed circles, and open circles represent W3110, YU449, YU450, and YU451, respectively. The solid lines connect average values from three different experiments. The vertical line for each point corresponds to the standard deviation. Total RNA was isolated from W3110 and YU450 (W3110 rpoS::Tn10) grown in LB medium at the times indicated, and 0.1 μg of RNA was subjected to RT-PCR (C). The products obtained after a 25-cycle PCR were analyzed by 0.9% agarose gel electrophoresis and stained with ethidium bromide. Portions (5 μg) of the same total RNA samples were electrophoresed in the same gels to compare rRNAs as a control (D).
The expression of ssnA in stationary phase and its negative control by RpoS.
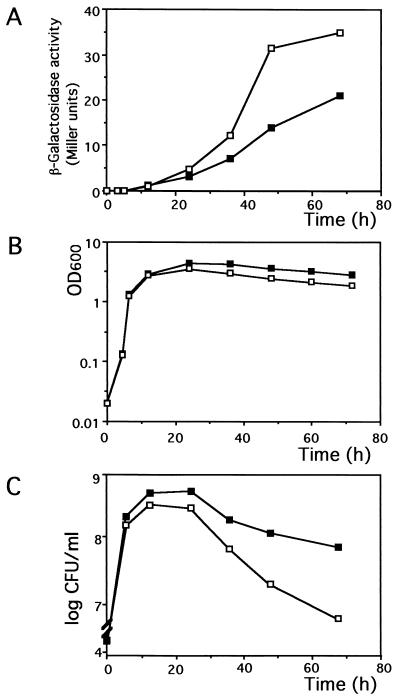
Considering the growth inhibition caused by the increased expression of ssnA and the retardation of cell death in the ssnA background, the ssnA gene seems to be involved in the cell death at early stationary phase. We therefore examined the ssnA expression by RT-PCR under the conditions used in the experiments to determine cell viability (Fig. 3C). A 1.3-kb band corresponding to the ssnA transcript was detected in cells in stationary phase but not in exponential phase. This indicates that ssnA expression is extremely low in exponential phase and increases at the beginning of stationary phase, which appears to be consistent with the time at which cell viability started to decrease. The RT-PCR experiments further revealed that in stationary phase, ssnA expression was enhanced more than twofold in the rpoS background (Fig. 3C). The stationary phase-specific induction and the enhanced expression in the rpoS background were also observed when an ssnA-lacZ operon fusion was used (Fig. 4). These results suggest that ssnA expression is negatively regulated by RpoS.
FIG. 4.
ssnA expression during the course of cell growth. MC1000 (closed squares) or YU381 (MC1000 rpoS::Tn10; open squares) cells harboring pSSNALAC were grown at 37°C in LB containing ampicillin, and β-galactosidase activity (A), cell density (B), and cell viability (C) were monitored at the times indicated.
On the other hand, the rpoS mutant reached a lower cell density and its viable cell number decreased more than that of the wild type after cells entered the stationary phase (Fig. 3A and B and Fig. 4B and C). Notably, these effects were ameliorated by the addition of the ssnA mutation (as in YU451, an rpoS ssnA double mutant, in Fig. 3). Therefore, the further decrease of viable cells in the rpoS background seems to be due to the increased expression of ssnA caused by the rpoS mutation. These data suggest that ssnA is expressed in the early stationary phase under the control of RpoS and that this expressional control may determine cell viability during the subsequent stationary phase.
Formation of small colonies corresponds to the retardation of decline of cell viability in the ssnA background.
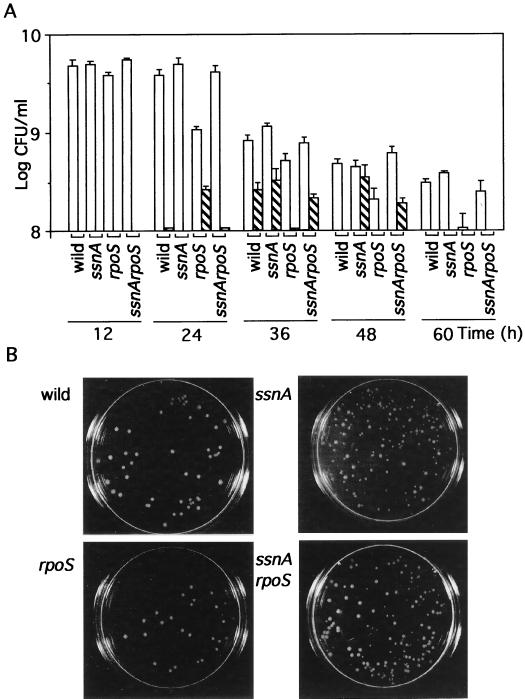
We noticed that small colonies were obtained from liquid cultures at the time that the decline of cell viability occurred at early stationary phase. From 12-h cultures at the late exponential phase, uniform colonies were formed (Fig. 5), whereas, from cultures at 24 to 48 h, when the viability was decreasing, small colonies were formed in addition to large colonies equivalent in size to those formed at the late exponential phase. A significant difference between the ssnA strain and the wild type was observed in this phase. The two strains formed nearly the same numbers of large colonies, but small colonies developed from the 36-h culture of the wild-type strain and from the 36- and 48-h cultures of the ssnA strain. Thus, the difference between the two strains in the viable cell number at the beginning of stationary phase may be correlated with the formation of small colonies but not with the formation of large colonies. After the decline of the cell viability (60-h culture), the colonies of the two strains became homogeneous again. Similar numbers of small colonies were formed from 24-h cultures of the rpoS strain and from 36- and 48-h cultures of the rpoS ssnA strain.
FIG. 5.
Small colony formation corresponding to retardation of cell decline in the ssnA background. Changes of the number and properties of colonies from W3110, YU449, YU450, and YU451 cells in the liquid culture were examined at the times indicated (A). The numbers of large colonies (with diameters of more than 2 mm) after a 20-h incubation are represented by open columns. Hatched columns represent the number of small colonies (less than 2 mm in diameter). The vertical line for each column corresponds to the standard deviation based on three different experiments. Colonies of each strain obtained from a 48-h culture are shown (B).
The small size of the colonies may not be caused by mutation, because when cells from the small colonies were subjected to a similar experiment with cultivation in liquid culture, large and small colonies appeared again and the proportion of the two sizes of colonies derived from the small colonies was the same as that derived from the large colonies. The small colonies thus seemed to be formed from cells in liquid cultures during a specific period of stationary phase. From these results, we assume that during such a period, the cells that form small colonies may delay the first cell division on plates, and such cells would die if cultivated any longer in liquid medium. In the ssnA strain in the 48-h culture (Fig. 5B), many small colonies were formed on plates, whereas in the wild type at the same time, no small colonies were formed. Cells lacking ssnA appeared less likely to die compared with the wild type at the early stationary phase. Therefore, it is suggested that ssnA reduces the cell viability by enhancing the death of feeble cells at this phase.
The ssnA gene and its product.
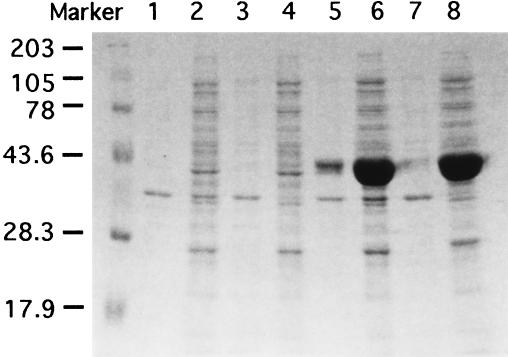
A possible ribosome-binding sequence was found upstream of the initiation codon, ATG, that is 66 bases downstream of the initiation codon of the orf464 sequence in the GenBank database (Fig. 6A). To test the usage of the initiation codon and to identify the ssnA gene product, the 1.3-kb DNA fragment encompassing the region from the ribosome-binding sequence to the stop codon of ssnA was cloned under the control of the T7 promoter. SsnA was then detected as a 44-kDa protein and was found only in the soluble fraction and not in the membrane fraction (Fig. 7). This protein size is roughly equivalent to the mass of 48,841 Da predicted for the amino acid sequence encoded by orf442. The sequence of the 9 N-terminal amino acids of the protein was determined, and it completely agreed with the sequence deduced from the nucleotide sequence (data not shown). Therefore, SsnA is suggested to consist of 442 amino acid residues.
FIG. 7.
The subcellular localization of the ssnA product. Cells harboring pVEX11 (lanes 1 to 4) or pVEXSSNA (lanes 5 to 8) were grown at 37°C to an OD600 of approximately 1.0 and then grown for 4 additional h in the presence of 1 mM IPTG. Subcellular fractions were obtained by French pressure cell press and ultracentrifugation, as described in Materials and Methods, and the fractions were subjected to sodium dodecyl sulfate-12% polyacrylamide gel electrophoresis, followed by staining with Coomassie brilliant blue. Lanes 1 and 5, unbroken cells recovered by low-speed centrifugation after treatment with a French press; lanes 2 and 6, cell extracts recovered after treatment with a French press; lanes 3 and 7; membrane fractions recovered after ultracentrifugation; lanes 4 and 8, soluble fractions recovered after ultracentrifugation. Samples used in all lanes were from comparable aliquots of the cell cultures. Sizes of the prestained molecular weight markers were as follows: myosin, 203,000; phosphorylase b, 105,000; bovine serum albumin, 78,000; ovalbumin, 43,600; carbonic anhydrase, 28,250; β-lactoglobulin, 17,900.
The transcriptional start site of ssnA was determined by the primer extension method (Fig. 6B). An extension product initiated 211 bases upstream of the translation initiation codon was detected when RNA from cells in stationary phase was analyzed. A band at the same position was also detected in the rpoS background (data not shown), whereas no corresponding band could be detected when RNA from cells at exponential phase was analyzed, probably because its level of expression is very low, as described above and previously (21). A sequence (CGTACA–15 bases–TCTTCA) weakly similar to the canonical ς70-dependent promoter sequence was found upstream of this putative transcriptional start site. There is a possible ρ-independent terminator (CCCTCTTCCC–––GGGAAGAGGGTTAAATAA) 10 bases downstream of the stop codon of ssnA.
Homology searching revealed that SsnA showed weak identity (23.6%) in a region of almost its full length (415 amino acid residues) to the N-ethylameline chlorohydrolase homologue in Methanococcus jannaschii (accession no. D64492), of which the cellular function has not yet been clarified (4). N-Ethylameline chlorohydrolase (TrzA; accession no. L16534) in Rhodococcus corallinus has been characterized (18) but is much less similar to SsnA (23.5% identity in a region of 226 amino acid residues) than to the homologue in M. jannaschii. Thus, homology searches did not allow us to predict the function of SsnA.
DISCUSSION
When grown in rich medium, E. coli exhibits a large decrease in viability at the beginning of stationary phase, and after that, the viable cell number is maintained for many days (26, 27). This process occurs with experimental reproducibility, which means that a decline in cell viability certainly starts and stops at a definite time and/or cell number. When the cells after the decline of cell viability were reinoculated into new medium, a similar decline in cell viability was observed (data not shown). Therefore, the decline of viability may be due to a cellular mechanism(s) specific for some phase in the life cycle of the organism.
The ssnA gene characterized here was found to be specifically expressed as the cell viability was decreasing in the early stationary phase. A mutant lacking the ssnA gene showed a delay of the decrease in viability compared with the wild type, although no significant difference was observed in the exponential phase (Fig. 3). Therefore, ssnA appears to promote a unique cell death event in the early stationary phase. The ssnA gene, however, may be dispensable for the decline of cell viability because it eventually occurs even in ssnA mutants.
Although the enzymatic function of SsnA is still unknown, cells harboring the ssnA gene on a multicopy plasmid exhibited a filamentous shape, which is one of the characteristic phenotypes of cell division-defective mutants, and sometimes exhibited swollen or burst shapes (Fig. 2). The viable cell number (expressed in CFU per milliliter) was about 100-fold lower than the total cell number scored directly by microscopic observation (data not shown). Therefore, the enhanced production of SsnA might make the host cell defective in cell division and thus nonviable. The ssnA gene on the genome is thus assumed to have a negative effect on cell division, although it is unclear whether SsnA directly affects the division machinery. Interestingly, the ssnA mutant showed slightly higher cell density than the wild type at stationary phase (Fig. 3A), which might be explained by such a defect in inhibition of cell division. From this possibility of involvement in inhibition of cell division and the evidence of retardation of the decline in cell viability in the ssnA mutant, we surmise that ssnA may be necessary for determining the viable cell number in stationary phase in the nutrient medium used.
A clue for elucidating the physiological function of the ssnA gene may lie in the properties of colonies formed from cells in the early stationary phase when the cell viability was decreasing (Fig. 5). The retardation of the decline in the viable cell number in the ssnA background seems to be correlated with the appearance of small colonies, which are assumed to be formed from feeble cells that are about to die but to maintain a small degree of viability in the liquid culture at that phase. The ssnA gene may reduce the viability of such feeble cells, and thereby the cell population may be promptly adjusted to the level that exists under stationary phase conditions.
Another interesting finding revealed in this study was the relationship between the ssnA and rpoS genes. The ssnA expression that is induced in stationary phase was found to be negatively regulated by rpoS (Fig. 3 and 4). The augmented decrease in viable cell number in the rpoS background may thus be due to the increased expression of ssnA, which was confirmed by measurement of the ssnA mRNA by RT-PCR (Fig. 3C). Therefore, rpoS may repress the excessive expression of ssnA, thereby controlling the number of viable cells in stationary phase. Although the molecular mechanism of the rpoS-dependent repression has not been determined, control by rpoS may prevent ssnA from overexerting its cellular function.
A drastic change in the number of viable cells in early stationary phase is observed in rich medium but not in minimal medium (27). ssnA expression in early stationary phase in minimal medium was very low, like that in exponential phase (data not shown), suggesting that an unknown inducer(s) of ssnA expression may be produced in early stationary phase in cells grown in rich medium. Cells in stationary phase may control the viable cell number in their own population, which would be crucial for withstanding nutrient-limited or stressful conditions or for smooth transition of the population from exponential to stationary phase.
ACKNOWLEDGMENTS
We thank O. Adachi and K. Matsushita for helpful discussions.
This work was supported by grants from the Ministry of Education, Science and Culture of Japan.
REFERENCES
- 1.Aiba H, Adhya S, de Crombrugghe B. Evidence for two functional gal promoters in intact Escherichia coli cells. J Biol Chem. 1981;256:11905–11910. [PubMed] [Google Scholar]
- 2.Barrow P A, Lovell M A, Barber L Z. Growth suppression in early-stationary-phase nutrient broth cultures of Salmonella typhimurium and Escherichia coli is genus specific and not regulated by ςS. J Bacteriol. 1996;178:3072–3076. doi: 10.1128/jb.178.11.3072-3076.1996. [DOI] [PMC free article] [PubMed] [Google Scholar]
- 3.Bolivar F, Rodriguez R L, Betlach M C, Heyneker H L, Boyer H W, Crosa J H, Falkow S. Construction and characterization of new cloning vehicles. II. A multiple cloning system. Gene. 1977;2:95–113. [PubMed] [Google Scholar]
- 4.Bult C J, et al. Complete genome sequence of the methanogenic archaeon, Methanococcus jannaschii. Science. 1996;273:1058–1073. doi: 10.1126/science.273.5278.1058. [DOI] [PubMed] [Google Scholar]
- 5.Casadaban M J, Cohen S N. Analysis of gene control signals by DNA fusion and cloning in Escherichia coli. J Mol Biol. 1980;138:179–207. doi: 10.1016/0022-2836(80)90283-1. [DOI] [PubMed] [Google Scholar]
- 6.Chang A C Y, Cohen S N. Construction and characterization of amplifiable multicopy DNA cloning vehicles derived from the P15A cryptic miniplasmid. J Bacteriol. 1978;134:1141–1156. doi: 10.1128/jb.134.3.1141-1156.1978. [DOI] [PMC free article] [PubMed] [Google Scholar]
- 7.Hengge-Aronis R. Survival of hunger and stress: the role of rpoS in early stationary phase gene regulation in E. coli. Cell. 1993;72:165–168. doi: 10.1016/0092-8674(93)90655-a. [DOI] [PubMed] [Google Scholar]
- 8.Hengge-Aronis R. Back to log phase: ςS as a global regulator in the osmotic control of gene expression in Escherichia coli. Mol Microbiol. 1996;21:887–893. doi: 10.1046/j.1365-2958.1996.511405.x. [DOI] [PubMed] [Google Scholar]
- 9.Ishihama A. Adaptation of gene expression in stationary phase bacteria. Curr Opin Genet Dev. 1997;7:582–588. doi: 10.1016/s0959-437x(97)80003-2. [DOI] [PubMed] [Google Scholar]
- 10.Izu H, Adachi O, Yamada M. Gene organization and transcriptional regulation of the gntRKU operon involved in gluconate uptake and catabolism of Escherichia coli. J Mol Biol. 1997;267:778–793. doi: 10.1006/jmbi.1996.0913. [DOI] [PubMed] [Google Scholar]
- 11.Kohara Y, Akiyama K, Isono K. The physical map of the whole E. coli chromosome: application of a new strategy for rapid analysis and sorting of a large genomic library. Cell. 1987;50:495–508. doi: 10.1016/0092-8674(87)90503-4. [DOI] [PubMed] [Google Scholar]
- 12.Kolter R, Siegele D A, Tormo A. The stationary phase of the bacterial life cycle. Annu Rev Microbiol. 1993;47:855–874. doi: 10.1146/annurev.mi.47.100193.004231. [DOI] [PubMed] [Google Scholar]
- 13.Miller J H. A short course in bacterial genetics: a laboratory manual and handbook for Escherichia coli and related bacteria. Cold Spring Harbor, N.Y: Cold Spring Harbor Laboratory Press; 1992. [Google Scholar]
- 14.Quandt J, Hynes M F. Versatile suicide vectors which allow direct selection for gene replacement in Gram-negative bacteria. Gene. 1993;127:15–21. doi: 10.1016/0378-1119(93)90611-6. [DOI] [PubMed] [Google Scholar]
- 15.Sambrook J, Fritsch E F, Maniatis T. Molecular cloning: a laboratory manual. 2nd ed. Cold Spring Harbor, N.Y: Cold Spring Harbor Laboratory Press; 1989. [Google Scholar]
- 16.Sanger F, Nicklen S, Coulson A R. DNA sequencing with chain-terminating inhibitors. Proc Natl Acad Sci USA. 1977;74:5463–5467. doi: 10.1073/pnas.74.12.5463. [DOI] [PMC free article] [PubMed] [Google Scholar]
- 17.Schneider K, Beck C F. Promoter-probe vectors for the analysis of divergently arranged promoters. Gene. 1986;42:37–48. doi: 10.1016/0378-1119(86)90148-4. [DOI] [PubMed] [Google Scholar]
- 18.Shao Z O, Seffens W, Mulbry W, Behki R M. Cloning and expression of the s-triazine hydrolase gene (trzA) from Rhodococcus corallinus and development of Rhodococcus recombinant strains capable of dealkylating and dechlorinating the herbicide atrazine. J Bacteriol. 1995;177:5748–5755. doi: 10.1128/jb.177.20.5748-5755.1995. [DOI] [PMC free article] [PubMed] [Google Scholar]
- 19.Siegele D A, Kolter R. Life after log. J Bacteriol. 1992;174:345–348. doi: 10.1128/jb.174.2.345-348.1992. [DOI] [PMC free article] [PubMed] [Google Scholar]
- 20.Studier F W, Rosenberg A H, Dunn J J, Dubendorf J W. Use of T7 RNA polymerase to direct expression of cloned genes. Methods Enzymol. 1990;185:60–89. doi: 10.1016/0076-6879(90)85008-c. [DOI] [PubMed] [Google Scholar]
- 21.Talukder A A, Yanai S, Nitta T, Kato A, Yamada M. RpoS-dependent regulation of genes expressed at late stationary phase in Escherichia coli. FEBS Lett. 1996;386:177–180. doi: 10.1016/0014-5793(96)00426-7. [DOI] [PubMed] [Google Scholar]
- 22.Talukder A A, Yanai S, Yamada M. Analysis of products of the Escherichia coli genomic genes and regulation of their expressions. An applicable procedure for genomic analysis of other microorganisms. Biosci Biotechnol Biochem. 1994;58:117–120. doi: 10.1271/bbb.58.117. [DOI] [PubMed] [Google Scholar]
- 23.Tanaka K, Takayanagi Y, Fujita N, Ishihama A, Takahashi H. Heterogeneity of the principal ς factor of RNA polymerase in stationary-phase Escherichia coli. Proc Natl Acad Sci USA. 1993;90:3511–3315. doi: 10.1073/pnas.90.8.3511. [DOI] [PMC free article] [PubMed] [Google Scholar]
- 24.Weichart D, Lange R, Henneberg N, Henge-Aronis R. Identification and characterization of stationary phase-inducible genes in Escherichia coli. Mol Microbiol. 1993;10:407–420. [PubMed] [Google Scholar]
- 25.Yamada M, Sumi K, Matsushita K, Adachi O, Yamada Y. Topological analysis of quinoprotein glucose dehydrogenase in Escherichia coli and its ubiquinone-binding site. J Biol Chem. 1993;268:12812–12817. [PubMed] [Google Scholar]
- 26.Zambrano M M, Kolter R. GASPing for life in stationary phase. Cell. 1996;86:181–184. doi: 10.1016/s0092-8674(00)80089-6. [DOI] [PubMed] [Google Scholar]
- 27.Zambrano M M, Siegele D A, Almiron M, Tormo A, Kolter R. Microbial competition: Escherichia coli mutants that take over stationary phase culture. Science. 1993;259:1757–1760. doi: 10.1126/science.7681219. [DOI] [PubMed] [Google Scholar]


