

Abstract
Background.
The assessment of alcohol consumption during a drinking bout, known as drinking topography, may help improve understanding of biopsychosocial mechanisms underlying alcohol consumption. However, past studies have been limited by effort-intensive, time-consuming, and error-prone processes involved in collecting, organizing, and standardizing drinking topography data. Recent technologies allowing integrated data collection and greater environmental control, such as virtual reality (VR), could resolve these problems.
Methods.
In this pilot project, we assessed alcohol consumption topography of participants in a VR drinking environment with a programmable virtual confederate (i.e., bar goer) during two testing sessions. In one, the confederate drank quickly (30-60 second sip interval). In the other, the confederate drank slowly (60-120 second sip interval). Participants’ hands and beverage were represented in VR. Between sips, beverages were placed on a Bluetooth-enabled scale, allowing real-time updates of drink weight. Participant experience was assessed after each testing visit. Multilevel modeling was used to characterize the effect of confederation condition on sip interval and sip volume. Descriptive analyses were used for participant experience data.
Results.
Results showed significant, moderate-to-strong between-visit correlations for topographic measures (r=.50 to r=.84) and indicate participants found the experience to be comfortable and acceptable. Multilevel models indicated participants had greater sip volumes and lower sip intervals when the confederate drank quickly.
Conclusions.
Future studies should take advantage of the considerable translational value of this technology to improve understanding of risk associated with individual drinking bouts and develop novel interventions for reducing hazardous drinking.
Keywords: drinking topography, alcohol, virtual reality, simulated bar
1. INTRODUCTION
Excessive alcohol use is a significant health problem in the United States, resulting in the deaths of more than 95,000 people annually and resulting in upwards of $250 billion in workplace productivity and health care expenses each year (CDC, 2019). 26.5% of U.S. adults aged 18 years and older report past-month binge drinking, with the highest rates among adults aged 18 to 25 (CDC, 2020; SAMHSA, 2018). Future prevention and clinical intervention techniques will benefit from greater insight into the biopsychosocial factors influencing both harmful and protective drinking behaviors.
1.1. Drinking Topography
Measurement of the microstructure of drinking behavior during drinking bouts, or ‘drinking topography’, provides a means to characterize biopsychosocial determinants of drinking behavior (Caudill et al., 1975; Collins et al., 1985). Most studies of the biopsychosocial risks associated with excessive alcohol consumption use broad measures, such as typical daily alcohol intake and binge frequency. However, the rate at which an individual consumes alcohol during a given bout can also be an important determinant of outcomes because the rate at which one drinks can impact their rate-of-rise of blood alcohol concentration (BAC) and overall peak BAC (Carpenter & Merrill, 2021). These factors, in turn, impact the subjective response, degree of impairment, and biobehavioral / sociolegal risks associated with alcohol intake (de Wit et al., 1990; Fillmore et al., 1998). Inter- and intra-individual variability in drinking topography has similar implications, exemplified by the difference between chugging and sipping a beer. Drinking topography studies can also provide important insights in the impact of social context on drinking behavior. Macro-scale social network studies suggest peer interactions can have an important influence on individual risk for heavy drinking and associated consequences (Barnett et al., 2014; Kenney et al., 2018). In a seminal drinking topography study (Caudill et al., 1975), participants drank wine at their own pace with a confederate who attempted to drink at a faster or slower predetermined rate. Participants drank significantly more, and more rapidly, when the confederate drank quickly.
Despite its importance, research into drinking topography has been sporadic, hampered by costly environmental manipulations, difficulties standardizing confederate behavior, and effortful data collection. Prior drinking topography studies have used physical simulated bars (i.e., laboratory spaces resembling a bar or pub, including a bar top, taps, stools, tables, etc.; Caudill et al., 1975; Collins et al., 1985; Garlington et al., 1977). Although simulated bars are the standard for drinking topography studies, they are very expensive and difficult to standardize across research sites.
Ensuring consistent confederate behavior in drinking topography studies is another substantial challenge. In the ‘fast’ condition of the Caudill et al. (1975) study, the confederate drank 700 mL of wine over 15 minutes. This process is difficult to standardize across sessions and burdensome for research staff. Meanwhile, the process of calculating drinking topography measures is time-consuming and potentially error-prone, requiring manual coding from video recordings (Collins et al., 1985). Furthermore, because some topography variables must be calculated from others (e.g., sip volume is determined by dividing the total volume consumed by the number of sips), analyses of changes in drinking topography within a bout cannot be conducted. Therefore, although drinking topography studies have great promise for informing the impact of biopsychosocial factors on drinking behavior and associated risks, they would benefit substantially from technological innovation.
Meanwhile, research regarding cigarette smoking has benefited from the development of telemetric devices allowing detailed assessment of smoking topography, including expired air carbon monoxide levels, depth of puff, puff frequency, and puff duration (Burling et al., 1985; Kashinsky et al., 1995). With these devices, clinically relevant insights have been uncovered regarding biopsychosocial influences on smoking habits, including affect, nicotine withdrawal symptomatology, alcohol craving, and mental illness on smoking topography (Green et al., 2016; Rosenberry et al., 2018; Delinger-Apte et al., 2020). These studies have also provided insights regarding social influences on smoking behavior and a better understanding of psychological processes that can reinforce harmful smoking behaviors and hamper interventions (Dimoff et al., 2017). Unfortunately, a telemetric device capable of collecting data related to drinking topography has not yet been developed.
1.2. Virtual Reality Technology
Since its inception in 1968, virtual reality (VR) technology has advanced from simple simulations to much more sophisticated environments enabling the study of environmental and social impacts on human behavior (VRS, 2017), supporting a boom in its clinical and research-oriented applications, including in gaming, military training, surgical simulations, exposure therapies, and physical rehabilitation (Cipresso et al., 2018). Modern VR involves wearing a headset with two screens close to the eyes, displaying an environment to the wearer while tracking their head and hand movements. This tracking component is vital to engagement in VR; as the participant moves their head, their perspective of the environment shifts to create an immersive experience. The inherent immersion and high degree of environmental control inherent in VR allows standardization of environmental and contextual variables to a previously unattainable level (Garrett et al., 2018).
1.3. Potential Utility of a Virtual Bar
Despite its promise, no studies have yet attempted to use VR technology to advance the assessment of drinking topography. The primary aim of the current study was to develop and establish feasibility of a novel VR-based platform capable of directly measuring drinking topography, including sip volume, sip frequency, and inter-sip interval. We hypothesized that participants would find the experience acceptable (e.g., comfortable, adequately realistic/immersive, and without dizziness or nausea) and that the platform would enable accurate, semi-automated assessment of drinking topography. As a secondary aim, we included the presence of a programmable virtual confederate and manipulated the rate at which it displayed a drinking animation, creating virtual high-consumption and low-consumption conditions. Consistent with Caudill et al. (1975), we hypothesized that manipulating the ‘sip interval’ of this virtual confederate across the two conditions would affect participants’ drinking topography, including sip interval and sip volume.
2. METHODS & MATERIALS
The present study was a pilot development and feasibility project assessing the potential utility of a novel VR drinking paradigm. The overall design of the study can be found in Figure 1. This study was approved by the University of Florida Institutional Review Board. All participants provided written informed consent prior to data collection.
Figure 1.

The overall design of the study.
2.1. Developing the Virtual Bar
We worked with an experienced video game developer (Dust Productions, LLC, Gainesville, FL, USA) to develop a novel VR-based platform using the Unity game engine (Unity Technologies, Copenhagen, Denmark). The research team met on a weekly basis with Dust Productions’ lead programmer to establish development priorities and provide feedback on design elements.
The resulting Integrated Topography and Consumption Tracking in VR (INTACT VR) platform was developed and tested for the HTC VIVE Pro Eye Virtual Reality headset (HTC Corporation, New Taipei City, Taiwan), which included capabilities for gaze tracking via an integrated eye tracking system (Tobii, LLC, Stockholm, Sweden). The program was run using an Alienware Aurora R7 PC (Dell, Inc., Round Rock, United States) with a VR-ready graphics processing unit (NVIDIA® Geforce 1080).
INTACT VR allows participants to rate visual analogue scales presented over the headset at fixed intervals using an HTC VIVE Controller, while two HTC VIVE Trackers, strapped to the participants’ wrist and beverage, allow participants’ hand and beverage to be represented in the virtual environment. Participants place their beverage on a coaster positioned on a Skale 2 brand scale (Atomax Inc., Taipei City, Taiwan) set into the table, allowing real-time updates of drink weight via Bluetooth.
INTACT VR also includes numerous customizable settings (Figure S1) used to change variables relevant to data collection and the virtual environment, including Participant ID; background music; confederate gender, intersip interval, and sip duration; and visual analogue scale (VAS) settings (instructions, anchors, and display frequency). Once begun, the program displays an empty tutorial room space (Figure S2) on the headset, within which participants familiarize themselves with the experience and controls. There are also options allowing scale syncing, recalibration of the scale location in the virtual environment, and presentation of a pre-recorded tutorial for participants to practice VAS ratings. Controls are visible only to research staff facilitating participant sessions.
2.2. Participants
Once a stable version of INTACT VR was ready for testing, we recruited 25 adult participants from the local community via flyers and word of mouth. All participants were regular drinkers (i.e., consumed ≥1 alcohol-containing beverage per month over the past six months). Exclusion criteria were: 1) outside the ages of 21 to 45, 2) history of current major depression or history of major depressive disorder if electroconvulsive therapy had been used, 3) history of any psychotic disorder, 4) under-controlled hypertension or diabetes, 5) neurological disease (e.g., multiple sclerosis, epilepsy, amyotrophic lateral sclerosis, Parkinson’s disease), 6) serious medical illness (e.g, hepatitis, HIV/AIDS), 7) impaired cognitive function, 8) current or past drug or alcohol dependence, or 9) being alcohol naïve. These criteria were determined by participant self-report. Use of prescription and over the counter (OTC) medication was allowed provided alcohol use was not contraindicated (Boissoneault et al., 2014; Gilbertson et al., 2009).
2.3. Study Sessions
Screening took place during the first study session in a private examination room. Participants completed screening measures including the Beck Depression Inventory-II (BDI-II; Beck et al., 1996), the State-Trait Anxiety Inventory (STAI; Spielberger et al., 1983), and the Alcohol Use Disorders Identification Test (AUDIT; Saunders et al., 1993). The Alcohol Use Questionnaire (AUQ), which measures typical alcohol use pattern, was derived and adapted from published literature by the UF Neurocognitive Laboratory (SJ Nixon, Director; Cahalan et al., 1969).
Qualifying participants were then scheduled for two testing sessions. During their two testing sessions, participants experienced the INTACT VR program. Participants confirmed that they met the following testing criteria before each visit: 1) refrained from any tobacco use for 1 hour and alcohol use for 24 hours, 2) fasted for 4 hours, and 3) absence of any pain, headache, or nausea. Participants ate a meal replacement bar at the beginning of the session (~250 kcal). They also completed urine-based drug and pregnancy screenings, and baseline breath alcohol concentration (BrAC) testing using a standard breathalyzer (Intoxylizer 800, CMI, Inc., Owensboro, KY). Positive results on drug, pregnancy, or alcohol screenings were exclusionary.
2.4. Testing Procedure
In both testing sessions, participants completed a short (<10 minutes) VR familiarization procedure, during which they viewed the tutorial room (Figure S2). The study facilitator adjusted the headset to the participant’s comfort. Participants then completed eye tracking calibration; practiced picking up and placing an unopened bottle on the scale/coaster; and an automated VAS tutorial, during which participants were made familiar with the VIVE Pro controller and asked to rate their baseline level of intoxication (see Supplemental Methods for script).
Participants then chose a bottled beverage: either Yuengling Traditional Lager (Yuengling & Son, Pottsville, PA) or Angry Orchard Hard Cider (Boston Beer Co., Walden, NY). Both beverages contained 5% alcohol by volume. Participants were instructed to 1) drink at their own pace, 2) place the bottle on the scale whenever they were not drinking, and 3) remain seated. Participants were informed that research staff would be monitoring the visit via webcam, though the session would not be recorded; that they could communicate any needs with research staff by speaking aloud; and that they could end the experience at any time, if desired. Finally, research staff opened the bottle, placed it on the scale, and began the virtual bar program before leaving the room.
While in the virtual bar environment, a playlist of popular music from the 1970s through 2010s played over the headset in pseudo-random order counterbalanced across visits. Participants provided self-ratings of subjective intoxication (from ‘not at all intoxicated’ to ‘the most intoxicated imaginable’) on a 0-100 visual analog scale (VAS; Figure S3). In addition to baseline ratings, ratings were acquired every five minutes and immediately upon leaving the bar environment.
If the participant completed their first beverage before an hour had passed, they were given water to rinse their mouth and provided a breath sample to determine their BrAC. Participants were then asked if they would like to continue with another beverage. The session concluded after the participant completed two beverages or when they had been in the virtual bar for an hour, whichever occurred first. After exiting the bar, participants were asked to complete a Participant Experience Questionnaire (PEQ; adapted from Olbrecht et al., 2020). This measure involved a brief set of Likert scales regarding their VR experience, including adequacy of orientation to the experience, comfort, willingness to participate in future INTACT VR, and level of immersion.
Finally, participants were provided lunch; post-session participant BrAC was assessed periodically until it was ≤ .02 g/dL, at which point participants were transported home via rideshare service.
2.5. Experimental Conditions
During each testing session, participants experienced one of two experimental conditions determined by the pre-programmed actions of a gender-matched virtual confederate seated at the bar in the participant’s line of sight (Figure 2). In both conditions, the confederate would periodically display a simple animation during which they ‘drank’ from the bottle in their hands. Testing conditions differed in the frequency at which this animation played. In the “fast” testing condition, the confederate drank every 30 to 60 seconds, consistent with a drinking pace of roughly 90 oz per hour, or 7.5 standard drinks (KU, 2020). In the “slow” condition, the confederate displayed one drink animation every 60 to 120 seconds. Although the confederate’s sip interval was randomly determined within the ranges above, the same random seed was used for all participants to ensure consistency. Condition order was counterbalanced across participants.
Figure 2.

The virtual bar environment from the point of view of a participant. Across from the participant at the bar, the virtual confederate can clearly be seen. The virtual confederate was gender-matched with participants. In this example, the male confederate is displayed.
2.6. The Virtual Reality Bar Toolbox
We used a custom algorithm (“the Virtual Reality Bar (ViRB) Toolbox”) to visually represent drinking topography and calculate key variables for analysis. The algorithm identified periods of consistent scale weight and periods of rapid change. The toolbox graphed scale weight data over time and marked the start of drink instances with an asterisk. Sample data is presented in Figure S4.
Drinking topography variables were then calculated. Sip interval, the time in seconds between drink instances, was calculated by taking the difference in time from the end of one drink instance to the beginning of the next. Average sip interval was determined by taking the mean of these values, while total time drinking was determined by taking their sum. Sip volume, the amount of the beverage a participant drinks each sip in grams, was calculated by taking the difference in weight from one drink instance to the next. Average sip volume was determined by taking the mean of these values, while total sip volume was calculated by taking their sum. Finally, the total sip number was calculated by subtracting one from the total number of drink instances to account for initial placement of the beverage on the scale.
For each session, research staff carefully reviewed the graphical output by the ViRB Toolbox. In seven instances, the algorithm failed to accurately represent observed drinking behavior. Specifically, it did not correctly identify the start of these sips due to rapid shifts in recorded weight that were unrelated to the participant lifting their beverage off of the scale (e.g., shaking the table). These instances were manually corrected by research assistants (VS and NB), who visually identified the correct “start” points. To ensure veracity of topographic data, a subset of participants (n=9) had sip counts manually verified using drink logs kept by research assistants remotely observing drinking sessions. An almost perfect correlation was found between observed and calculated sip counts (r=.994). For every discrepancy, the observed count was lower than the calculated count, suggesting research assistants had missed sip instances and supporting the usefulness of INTACT VR for improving accuracy of drinking topography assessment.
2.7. Analysis Strategy
To examine whether the fast- vs. slow-consumption virtual confederate impacted participants’ drinking topography, we used multilevel modeling (MLM) with restricted maximum likelihood estimation via the PROC MIXED procedure in SAS® 9.4 (SAS Institute, 2014). MLM accounted for the fact that we had repeated assessments of alcohol consumption that were unevenly spaced across time and nested within person. Degrees of freedom were calculated using the Kenward-Roger approximation. We conducted two models, one with sip interval (seconds) and one with sip volume (grams) as the outcome. Primary predictors were confederate condition (fast- vs. slow-consumption), time since the beginning of the drinking session (given relevant evidence from the smoking literature; Veilleux et al., 2011), and their interaction. Gender was included as a covariate to adjust for gender-related drinking differences1. Models included a person-level random intercept and a random slope for time since the beginning of the drinking session.
3. RESULTS
Twenty-five participants (Mage= 24.88 [SD = 3.574] years, 17 female) completed the study. Of these, 17 participants self-identified as White, three as Asian, and five as multiple or other races. Eight participants self-identified as Hispanic/Latinx. Participants were highly educated (Medu = 17.44 [SD = 2.311] years, range 14 - 23).
3.1. Screening Measures
Participant responses on the BDI-II indicated minimal depressive symptomatology (MBDI = 3.52 [SD = 3.124], range 0 - 13); on the STAI, participants reported minimal anxiety (MState = 27.48 [SD = 6.494], MTrait = 33.72 [SD = 8.178]). AUDIT scores were below the standard cutoff (>8) for hazardous drinking (M = 5.32 [SD = 2.155]). Mean Quantity-Frequency Index (QFI; MQFI = 0.504 [SD = 0.495]) and Maximum Quantity Index (maxQ; MmaxQ = 3.832 [SD = 1.815]) derived from the AUQ indicated that, on average, participants consumed ~1 standard drink per day and a maximum of ~6 standard drinks at one time during the past six months. Complete screening data can be found in Table 1.
Table 1.
Screening data (n = 25)
| Mean | Standard deviation | Minimum | Maximum | |
|---|---|---|---|---|
| Age | 24.88 | 3.574 | 21 | 34 |
| Education | 17.44 | 2.311 | 14 | 23 |
| BDI | 3.52 | 3.124 | 0 | 13 |
| STAI State | 27.48 | 6.494 | 20 | 45 |
| STAI Trait | 33.72 | 8.178 | 21 | 50 |
| AUDIT | 5.32 | 2.155 | 3 | 11 |
| QFI (oz absolute ethanol / day) | .5043 | .4947 | .114 | 2.16 |
| Max QFI (oz absolute ethanol) | 3.8319 | 1.8150 | .72 | 8.64 |
3.2. Drinking Topography
Although all participants completed both testing sessions, a physical malfunction with the scale that necessitated its replacement resulted in five participants being excluded from topographic analysis. For the remaining 20 participants, the INTACT VR program and the ViRB Toolbox algorithm allowed the depiction of drinking topography data in easily interpretable graphs (see Figure S5 for example). Results showed significant between-visit correlations for the average sip interval (r=.50, p=.02), total time drinking (r=.52, p=.02), average sip volume (r=.76, p<.001) and total number of sips (r=.84, p<.001). These correlations suggest moderate-to-strong consistency in drinking topography across sessions, even in the context of experimental manipulation (see Table 2).
Table 2.
Topographic data (n = 20)
| Correlation | ||||
|---|---|---|---|---|
|
| ||||
| Measure | Condition | Mean (SD) | r | p |
| Sip Interval (s) | Slow | 90.397 (29.44) | ||
| Fast | 92.107 (32.41) | .50 | .02 | |
| Total Time Drinking (s) | Slow | 2743.924 (863.35) | ||
| Fast | 2323.444 (863.33) | .52 | .02 | |
| Sip Volume (g) | Slow | 24.056 (11.32) | ||
| Fast | 24.890 (12.6) | .76 | .00 | |
| Total Sip Volume (g) | Slow | 588.585 (192.33) | ||
| Fast | 547.585 (183.51) | .09 | .72 | |
| Total Sip Number | Slow | 28.55 (11.43) | ||
| Fast | 26.70 (11.38) | .84 | .00 | |
We next examined the impact of the virtual confederate condition on sip interval and sip volume. For sip interval, MLM indicated a significant interaction between confederate condition and time since beginning the session (b=−1.20, 95% CI=[−1.20, −0.6], p<.001). As seen in Figure 8, simple slopes revealed sip interval increased (i.e., drinking rate slowed) over time in both conditions. This increase was significantly smaller in the fast-drinking condition (b=1.20, 95% CI=[0.60, 1.80], p=.004) compared to the slow-drinking condition (b=1.80, 95% CI=[1.20, 3.00], p<.001).2
For sip volume, MLM indicated a significant interaction between condition and time since beginning the session (b=0.18, 95% CI=[0.048, 0.30], p=.006). As seen in Figure 9, simple slopes revealed that the sip volume did not change over time in the fast-drinking condition (b=−0.060, 95% CI=−[0.018, 0.060], p=.241), whereas it significantly decreased over time in the slow-drinking condition (b=−0.24, 95% CI=[−0.36, −0.12], p<.001).3 Gender was significant (b=2.63, 95% CI=[0.35, 4.91], p=.024), such that men had larger sip volumes than women.
3.3. Participant Experience
All 25 participants who completed the study (including those with faulty scale data excluded from the MLM analysis) provided experience data. No nausea or dizziness was reported in 94% of testing sessions. Three participants reported mild nausea or dizziness. Five participants had minor concerns about the comfort of the VR equipment. No adverse events occurred.
All participants agreed that “the instructions I received prior to my virtual reality experience were helpful and adequate”, 18 reported that “the equipment felt comfortable during my virtual reality experience”, and 14 endorsed that “I felt immersed in my virtual reality experience”. All but one participant agreed that “I would willingly participate in another study involving the virtual reality bar”. Participants also endorsed an average rating of 4.6 on a 7-point scale asking their “sense of being in the virtual environment” (0=not at all, 7=very much) and an average rating of 3.4 on a similar scale rating the extent of times “when the virtual environment was real to you”.
For 82% of Testing Visits, participants felt that the length of time they spent in the virtual environment was acceptable. When prompted for suggestions to improve future experiences, participants requested more opportunities for interaction, such as the presence of others in the bar, changes in scenery, or bar games. Detailed experience data can be found in Tables 3 and 4.
Table 3.
Participant experience data, questions 1 to 4 (n = 25, across both visits)
| Mean | Standard deviation | 1= Strongly disagree (%) | 2= Disagree (%) | 3= Agree (%) | 4= Strongly agree (%) | |
|---|---|---|---|---|---|---|
| 1. The instructions I received prior to my virtual reality experience were helpful and adequate | 3.92 | .274 | 0 | 0 | 8 | 92 |
| 2. The equipment felt comfortable during my virtual reality experience† | 3.33 | .718 | 0 | 14 | 39 | 47 |
| 3. I would willingly participate in another study involving the virtual reality bar | 3.74 | .600 | 2 | 2 | 16 | 80 |
| 4. I felt immersed in my virtual reality experience | 3.06 | .767 | 2 | 20 | 48 | 30 |
: n=24 due to missing data
Table 4.
Participant experience data, questions 5 to 14 (n = 25, across both visits)
| Mean | Standard deviation | 1= Strongly disagree (%) | 2= Disagree (%) | 3= Neither Agree nor Disagree (%) | 4= Agree (%) | 5= Strongly Agree (%) | |
|---|---|---|---|---|---|---|---|
| 5. I had the sense that I returned from a journey | 3.50 | 1.216 | 6 | 18 | 20 | 32 | 25 |
| 6. I vividly remember some parts of the experience | 4.32 | 1.096 | 6 | 2 | 6 | 26 | 60 |
| 7. I felt myself being ‘drawn in’† | 3.49 | 1.063 | 2 | 8 | 26 | 34 | 18 |
| 8. I felt involved | 3.06 | 1.252 | 10 | 30 | 18 | 28 | 14 |
| 9. I lost track of time | 3.92 | 1.066 | 4 | 8 | 12 | 44 | 32 |
| 10. I felt that the characters and/or objects could almost touch me | 2.96 | 1.160 | 12 | 26 | 22 | 34 | 6 |
| 11. I felt I was visiting the places in the virtual environment† | 3.73 | 1.132 | 6 | 8 | 18 | 40 | 26 |
| 12. I felt that the virtual environment was part of the real world | 3.00 | 1.471 | 24 | 18 | 8 | 34 | 16 |
| 13. My experience was intense | 2.58 | 1.144 | 22 | 24 | 32 | 18 | 4 |
| 14. I paid more attention to the virtual environment than I did to my own thoughts | 3.04 | 1.399 | 12 | 34 | 16 | 14 | 24 |
: n=24 due to missing data
4. Discussion
4.1. Feasibility and Acceptability of the Virtual Bar
To our knowledge, this study demonstrates the first assessment of drinking topography using VR. As hypothesized, participants found the INTACT VR experience acceptable. Although it is expected that nausea and dizziness may occur in VR environments, few participants reported these issues in the current work, and almost all were willing to participate in similar studies in the future. Drinking topography measures were highly repeatable within participants. In addition to being able to measure volumes of individual sips, sip counts derived from INTACT VR were highly consistent with - and even more accurate than - research assistants’ observed counts. Together, results suggest that INTACT VR is capable of successfully recording drinking topography. Furthermore, this data is precise to a level previously cumbersome or impossible to attain. In aggregate, participants provided neutral-to-positive ratings of realism and immersion. Although perfect realism and immersion are likely not required for INTACT VR to facilitate drinking topography studies, participants provided useful suggestions regarding areas of improvement for future iterations, including additional interactive elements.
Results point to several strengths of this approach. The first major strength is the use of VR to facilitate data collection. By taking advantage of a standardized VR environment, investigators could expose participants to identical virtual drinking environments across sites regardless of geographic location. In contrast, multi-site studies are difficult with traditional simulated bars, which have significant variations between location, complicating design and interpretation. Furthermore, construction of and modifications to physical simulated bars are very costly. Another major strength is platform-scale integration, allowing us to collect individual sip volumes and intervals and enabling exploration of nuanced and dynamic effects of experimental manipulations on drinking. A third strength in this approach is the development of an algorithm facilitating interpretation and calculation of participant drinking topography (the VIRB Toolbox). While this algorithm is still being refined and currently requires investigators to review graphical representations of drinking behavior to verify its output, there is potential for future studies to use this Toolbox for the integration of real-time feedback in potential interventions promoting healthier drinking behavior.
4.2. Impact of the Virtual Confederate
The impact of time in the environment on participant drinking topography (i.e., gradual increases in sip interval and decreases in sip volume) was found to be significantly moderated by confederate drinking condition. This effect was stronger in the slow condition, where participants took an additional 1.8 seconds between sips for every minute in the environment vs. 1.2 seconds in the fast condition. Similarly, sip volume declined by .24 grams per minute in the slow condition but did not significantly change in the fast condition. These results are consistent with those of prior studies of both drinking and smoking topography, which have identified a) significant effects of confederate drinking on drinking topography (Caudill and Marlatt, 1975); and b) that topography tends to become less “intense” over the course of a use episode (e.g., Veilleux et al., 2011). Critically, they also demonstrate that drinking topography measures indexed by INTACT VR are sensitive to experimental manipulations. Participant and virtual confederate gender were matched in this study to better replicate the methods of Caudill and Marlatt (1975), who included only male participants and confederates. However, future studies of social influences on drinking using INTACT VR should carefully consider potential impacts of the gender and appearance of the virtual confederate given individual variability in participant sociodemographic characteristics, including sexual preference.
4.3. Conclusion
Taken together, results establish feasibility and acceptability of a novel virtual reality platform for the measurement of drinking topography. Future studies should build on this foundation to increase the realism and immersion of the simulation and include a larger and more diverse sample, given that the young and relatively healthy participants included in this initial study may restrict generalizability of the results. Future studies could manipulate confederate characteristics besides drinking rate, including race, ethnicity, age, socioeconomic status, gender, and weight to enable nuanced investigations of social influences on drinking topography. We believe the INTACT VR platform has considerable translational potential to facilitate investigation of biopsychosocial mechanisms underlying drinking and help develop interventions reducing alcohol-related risks. Studies of the effect of pain on drinking topography could help characterize antecedents for hazardous alcohol use, while others might explore real-time feedback in VR to promote lower risk drinking behavior among at-risk populations.
Researchers interested in applying INTACT VR in their own work should contact the corresponding author to obtain the platform, which is available under an open-source license. We will provide the platform free of charge to not-for-profit researchers and assist with implementation.
Supplementary Material
Figure 3.
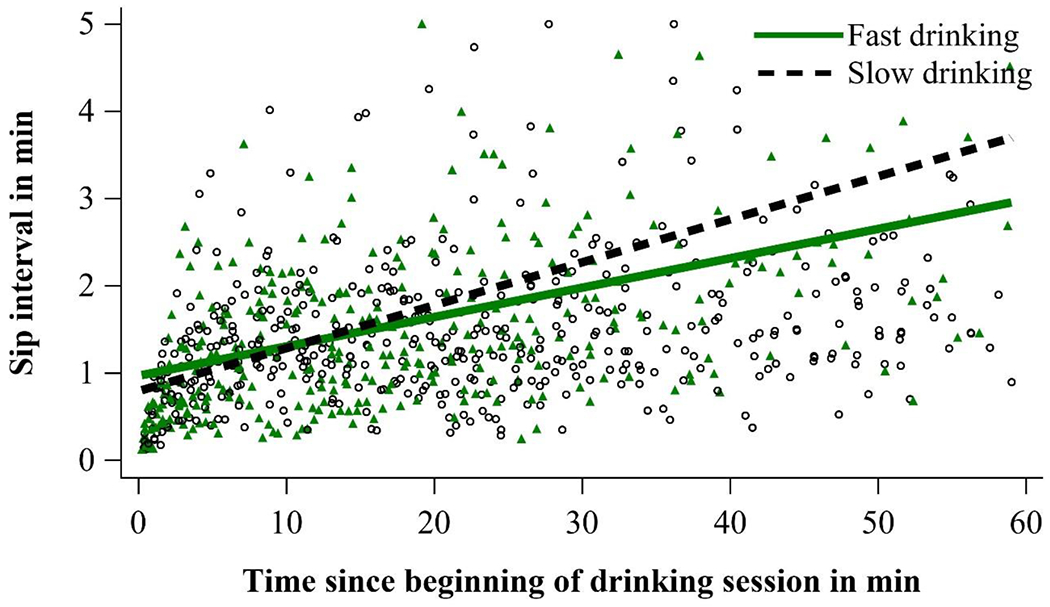
Association of virtual confederate condition (fast vs. slow drinking) with sip interval in seconds over time since the beginning of the drinking session. Note that smaller sip intervals indicate faster drinking. For presentation purposes, sip intervals greater than 5 min (300 sec; n = 3) were winsorized to 5 min.
Figure 4.

Association of virtual confederate condition (fast vs. slow drinking) with sip volume in grams over time since the beginning of the drinking session. For presentation purposes, sip volumes greater than 65 (n = 12) were winsorized to 65.
Footnotes
In sensitivity analyses, we examined whether gender interacted with our primary predictors. There were no significant two- or three-way interactions with gender for either model and these were therefore not included in the final analyses.
The simple slope for the slow-drinking condition (reference condition) equated to the main effect for time. There was also a main effect for sip interval (b=11.24, 95% CI=[0.21, 22.27], p=.046), which indicated that participants had a lower sip interval in the slow-drinking confederate condition at the very beginning of the drinking session. Gender was not significant (b=−8.00, 95% CI=[−17.42, 1.41], p=.096).
The simple slope for the slow-drinking condition (reference condition) equated to the main effect for time. There was also a main effect for sip volume (b=−3.49, 95% CI=[−6.10, −0.87], p=.009), which indicated that participants had a larger sip volume in the slow-drinking confederate condition at the very beginning of the drinking session.
References
- Acevedo MB, Eagon JC, Bartholow BD, Klein S, Bucholz KK, Pepino MY (2018) Sleeve gastrectomy surgery: when 2 alcoholic drinks are converted to 4. Surg Obes Relat Dis 14:277–283. 10.1016/j.soard.2017.11.010 [DOI] [PMC free article] [PubMed] [Google Scholar]
- Barnett NP, Ott MQ, Rogers ML, Loxley M, Linkletter C, Clark MA (2014) Peer associations for substance use and exercise in a college student social network. Health Psych 33(10) 1134. [DOI] [PubMed] [Google Scholar]
- Boissoneault J, Sklar A, Prather R, Nixon SJ (2014) Acute effects of moderate alcohol on psychomotor, set shifting, and working memory function in older and younger social drinkers. J Stud Alcohol Drugs 75:870–9. 10.15288/jsad.2014.75.870 [DOI] [PMC free article] [PubMed] [Google Scholar]
- Beck AT, Steer RA, Brown GK (1996) Beck Depression Inventory, Second Edition. San Antonio, TX: The Psychological Corporation. [Google Scholar]
- Burling TA, Stitzer ML, Bigelow GE, Mead AM (1985) Smoking topography and carbon monoxide levels in smokers. Addict Behav 10:319–323. 10.1016/0306-4603(85)90014-0 [DOI] [PubMed] [Google Scholar]
- Cahalan D, Cissin L, Crossley H (1969) American drinking practices: a national study of drinking behaviors and attitudes (monograph no. 6). New Brunswick, NJ: Rutgers Center of Alcohol Studies. [Google Scholar]
- Carpenter RW, Merrill JE (2021) How much and how fast: alcohol consumption patterns, drinking-episode affect, and next-day consequences in the daily life of underage heavy drinkers. Drug Alcohol Depend 218:108407. 10.1016/j.drugalcdep.2020.108407 [DOI] [PMC free article] [PubMed] [Google Scholar]
- Caudill BD, Marlatt GA (1975) Modeling influences in social drinking: an experimental analogue. J Consult Clin Psychol 43(3) 405–15. 10.1037/h0076689 [DOI] [PubMed] [Google Scholar]
- Centers for Disease Control and Prevention (CDC).Excessive drinking is draining the U.S. economy [CDC Web site]. December 30, 2019. Available at: https://www.cdc.gov/alcohol/pub-health-surveillance.htm. Accessed April 19, 2021.
- Centers for Disease Control and Prevention (CDC). About CDC’s alcohol program [CDC Web site]. November 9, 2020. Available at: https://www.cdc.gov/alcohol/about.htm. Accessed April 19, 2021.
- Cipresso P, Giglioli IAC, Raya M, Riva G (2018) The past, present, and future of virtual and augmented reality research: a network and cluster analysis of the literature. Front Psychol 9:2086. 10.3389/fpsyg.2018.02086 [DOI] [PMC free article] [PubMed] [Google Scholar]
- Collins RL, Parks GA, Marlatt GA (1985) Social determinants of alcohol consumption: the effects of social interaction and model status on the self-administration of alcohol. J Consult Clin Psychol 53(2):189–200. 10.1037//0022-006x.53.2.189 [DOI] [PubMed] [Google Scholar]
- Denlinger-Apte RL, Donny EC, Lindgren BR, Rubin N, Goodwin C, DeAtley T, Colby SM, Cioe PA, Hatsukami DK, Tidey JW (2020) Smoking topography characteristics during a 6-week trial of very low nicotine content cigarettes in smokers with serious mental illness. Nicotine Tob Res 22:1414–1418. 10.1093/ntr/ntz198 [DOI] [PMC free article] [PubMed] [Google Scholar]
- de Wit H, Metz J, Wagner N, Cooper M (1990) Behavioral and subjective effects of ethanol: relationship to cerebral metabolism using PET. Alcohol Clin Exp Res 14:482–9. 10.1111/j.1530-0277.1990.tb00508.x [DOI] [PubMed] [Google Scholar]
- Dimoff JD, Sayette MA (2017) The case for investigating social context in laboratory studies of smoking. Addiction 112:388–395. 10.1111/add.13503 [DOI] [PMC free article] [PubMed] [Google Scholar]
- Fillmore MT, Vogel-Sprott M (1998) Behavioral impairment under alcohol: cognitive and pharmacokinetic factors. Alcohol Clin Exp Res 22:1476–82. [PubMed] [Google Scholar]
- Garlington WK, Dericco DA (1977) The effect of modeling on drinking rate. J Appl Behav Anal 10:207–11. 10.1901/jaba.1977.10-207 [DOI] [PMC free article] [PubMed] [Google Scholar]
- Garrett B, Taverner T, Gromala D, Tao G, Cordingley E, Sun C (2018) Virtual reality clinical research: promises and challenges. JMIR Serious Games 6:e10839. 10.2196/10839 [DOI] [PMC free article] [PubMed] [Google Scholar]
- Gilbertson R, Ceballos NA, Prather R, Nixon SJ (2009) Effects of acute alcohol consumption in older and younger adults: perceived impairment versus psychomotor performance. J Stud Alcohol Drugs 70:242–52. 10.15288/jsad.2009.70.242 [DOI] [PMC free article] [PubMed] [Google Scholar]
- Green R, Bujarski S, Roche DJ, Ray LA (2016) Relationship between negative affect and smoking topography in heavy drinking smokers. Addict Behav 61:53–7. 10.1016/j.addbeh.2016.05.016 [DOI] [PMC free article] [PubMed] [Google Scholar]
- Kashinsky W, Collins BN, Brandon TH (1995) A telemetric device for measuring smoking topography. Behav Rsrch Meth 27:375–378. 10.3758/BF03200432 [DOI] [Google Scholar]
- Kenney SR, DiGuiseppi GT, Meisel MK, Balestrieri SG, Barnett NP (2018) Poor mental health, peer drinking norms, and alcohol risk in a social network of first-year college students. Addictive behaviors 84 151–159. [DOI] [PMC free article] [PubMed] [Google Scholar]
- King WC, Chen JY, Mitchell JE, Kalarchian MA, Steffen KJ, Engel SG, Courcoulas AP, Pories WJ, Yanovski SZ (2012) Prevalence of alcohol use disorders before and after bariatric surgery. JAMA: 307:2516–2525. 10.1001/jama.2012.6147 [DOI] [PMC free article] [PubMed] [Google Scholar]
- Olbrecht VA, O’Conor KT, Williams SE, Boehmer CO, Marchant GW, Glynn SM, Geisler KJ, Pickerill HM, Ding L, Yang G, King CD (2020) Transient reductions in postoperative pain and anxiety using virtual reality in children. medRxiv 2020.09.18.20192724 [Preprint]. 10.1101/2020.09.18.20192724 [DOI] [PubMed] [Google Scholar]
- Rosenberry ZR, Pickworth WB, Koszowski B (2018) Large cigars: smoking topography and toxicant exposure. Nicotine Tob Res 20:183–191. 10.1093/ntr/ntw289 [DOI] [PMC free article] [PubMed] [Google Scholar]
- Saunders JB, Aasland OG, Babor TF, de la Fuente JR, Grant M (1993) Development of the alcohol use disorders identification test (AUDIT): WHO collaborative project on early detection of persons with harmful alcohol consumption--II. Addiction 88:791–804. 10.1111/j.1360-0443.1993.tb02093.x [DOI] [PubMed] [Google Scholar]
- Spielberger CD (1983) Manual for state-trait anxiety inventory. Consulting Psychologists Press, Palo Alto, CA. [Google Scholar]
- Substance Abuse and Mental Health Services Administration. Results from the 2018 National Survey on Drug Use and Health: Detailed tables. 2019. Rockville, MD: Center for Behavioral Health Statistics and Quality, Substance Abuse and Mental Health Services Administration. Available at: https://www.samhsa.gov/data/. Accessed April 19, 2021. [Google Scholar]
- The University of Kansas. Alcohol and KU: Risky Behaviors. 2020. Available at: https://alcohol.ku.edu/risky-behaviors. Accessed April 19, 2021.
- U.S. Department of Health and Human Services and U.S. Department of Agriculture (2015). 2015 – 2020 dietary guidelines for Americans, 8th edition. Available at: https://health.gov/our-work/food-nutrition/previous-dietary-guidelines/2015. Accessed April 19, 2021.
- Veilleux JC, Kassel JD, Heinz AJ, Braun A, Wardle MC, Greenstein J, … & Conrad M (2011). Predictors and sequelae of smoking topography over the course of a single cigarette in adolescent light smokers. Journal of adolescent health, 48(2), 176–181. [DOI] [PMC free article] [PubMed] [Google Scholar]
- Virtual Reality Society. History of virtual reality. 2017. Available at: https://www.vrs.org.uk/virtual-reality/history.html. Accessed April 19, 2021.
- Yanina Pepino M, Okunade A, Christopher E, Bartholow B, Bucholz K, Klein S (2015) Roux-en-Y gastric bypass surgery converts two alcoholic drinks to four. JAMA Surgery 150: 1096–1098. https://dx.doi.org/10.1001%2Fjamasurg.2015.1884 [DOI] [PMC free article] [PubMed] [Google Scholar]
Associated Data
This section collects any data citations, data availability statements, or supplementary materials included in this article.