Abstract
Caecilians are elongate, limbless and annulated amphibians that, as far as is known, all have an at least partly fossorial lifestyle. It has been suggested that elongate limbless vertebrates show little morphological differentiation throughout the postcranial skeleton. However, relatively few studies have explored the axial skeleton in limbless tetrapods. In this study, we used μCT data and three‐dimensional geometric morphometrics to explore regional differences in vertebral shape across a broad range of caecilian species. Our results highlight substantial differences in vertebral shape along the axial skeleton, with anterior vertebrae being short and bulky, whereas posterior vertebrae are more elongated. This study shows that despite being limbless, elongate tetrapods such as caecilians still show regional heterogeneity in the shape of individual vertebrae along the vertebral column. Further studies are needed, however, to understand the possible causes and functional consequences of the observed variation in vertebral shape in caecilians.
Keywords: axial skeleton, geometric morphometrics, intracolumnar variation, postcranial, segmentation
It has been suggested that elongate limbless vertebrates show little morphological differentiation throughout the postcranial skeleton. However, our results show that, far from morphologically homogeneous, the post‐cranial skeleton of caecilians shows variations in vertebral shape. Whereas the anterior part of the body consists of short, bulky vertebrae, posterior vertebrae is elongated with pronounced basapophyseal processes.

1. INTRODUCTION
Caecilians (Gymnophiona) are a small (just over 200 currently recognized species) monophyletic group of elongate, totally limbless, and annulated amphibians (Pough et al., 1998; Taylor, 1968). Because most caecilians are fossorial, inconspicuous, and rarely encountered components of tropical ecosystems, many aspects of their biology remain poorly known (O'Reilly, 2000; Summers & O'Reilly, 1997; Wilkinson, 2012). Although their cranial osteology has been relatively well documented (e.g., Bardua et al., 2019; Lowie et al., 2021; Sherratt et al., 2014; Wake, 1993; Wilkinson & Nussbaum, 1997), few studies have focused on the vertebral morphology of adult extant caecilians (e.g., Peter, 1894; Renous et al., 1993; Renous & Gasc, 1989; Taylor, 1977; Wake, 1980; Wiedersheim, 1879). In general, vertebrate axial skeletons are not a homogenous series of vertebrae and two types of morphological variation have been documented in previous studies: regionalization and heterogeneity (Jones et al., 2018). Whereas regionalization defines the number of regions along the vertebral column and relies on the expression of Homeobox genes (Head & Polly, 2015), heterogeneity defines the degree of morphological disparity observed among regions (Jones et al., 2018). Although these two types of axial differentiation evolve independently, both increased during synapsid evolution and led to well‐defined vertebral regions in mammals (Jones et al., 2018). This combination of morphologically specialized vertebrae and regionalization allowed mammals to become functionally specialized for locomotion (Jones et al., 2020).
Although regionalization is also present in elongate limbless taxa without girdles such as snakes (Head & Polly, 2015), they show little heterogeneity compared to mammals (e.g., Polly et al., 2001; Sherratt & Sanders, 2019). Lawson (1963) moreover suggested that there was no regional variation across the vertebral column in the caecilian Hypogeophis rostratus. Generally, the small number of distinct regions and lack of morphological disparity in the vertebral column of elongate limbless tetrapods has been considered suggestive of a reduction in specialization and the presence of a functional conservatism. However, Wake (1980) identified gradual regional differences in the vertebrae of three caecilian species. Renous and Gasc (1989) further documented different vertebral types in different caecilians, ranging from extremely stout to thread‐like, but did not explore variation within the axial skeleton They did suggest, however, that the variation in stoutness of the body and vertebrae was associated with differences in locomotor types and substrate use (Renous et al., 1993; Renous & Gasc, 1989).
The goal of the present study was to describe vertebral shape variation across a broad range of caecilians using 3D geometric morphometric approaches. Despite their rather uniform bauplan, we hypothesize that shape variation may exist along vertebral column which could be indicative of regionalization and/or vertebral heterogeneity. Additionally, we assess the morphological disparity of the vertebrae along the vertebral column.
2. MATERIAL AND METHODS
2.1. Specimens
Based on vertebral anatomy, with the exception of a cervical region, no region can be precisely identified in all caecilians (Wake, 1980). Caecilians globally consist of an atlas followed by 67 (Hypogeophis pti Maddock et al., 2017) to 306 (Oscaecilia cf. bassleri [MW pers. Obs.]) trunk vertebrae with no sacrum and either a short or no tail (Dunn, 1942; Maddock et al., 2017; Nussbaum & Wilkinson, 1989). To be able to compare vertebral shape across species that differ in the number of vertebrae, we followed Wake (1980) in selecting six vertebrae: the atlas (V1), the second vertebra (V2), the third vertebra (V3), and the vertebrae at 20% (hereafter referred to as V20%), 60% (hereafter referred to as V60%) and 90% (hereafter referred to as V90%) of the total number of vertebrae. This selection was made under the assumption that all caecilians included in our study have a sufficiently similar vertebral organization. For the atlas (V1), 83 individuals from 28 species belonging to nine of the 10 currently recognized families were included in the dataset. Only the most recently discovered family, Chikilidae, morphologically close to the African Herpelidae, is missing. For the five other vertebrae of interest, the dataset was subsampled to 57 individuals from 24 species based on the availability of whole‐body μCT scans of high resolution (Table 1). Our sample was restricted to adults and included both males and females. Although some sexual dimorphism is present in caecilians (e.g., Kupfer, 2009; Maerker et al., 2016), interspecific variation largely exceeds the sex‐specific variation (Sherratt et al., 2014). Specimens were obtained primarily from our personal collections and completed with specimens from museum collections (Table S1).
TABLE 1.
Details of specimens used in this study with family, species names, and number of individuals (N) for each dataset
| Family | Species | N Atlas | N Vertebrae |
|---|---|---|---|
| Rhinatrematidae | Epicrionops bicolor | 1 | 1 |
| Rhinatrema bivittatum | 5 | 3 | |
| Ichthyophiidae | Ichthyophis bombayensis | 1 | 0 |
| Ichthyophis kohtaoensis | 4 | 3 | |
| Uraeotyphlus oxyurus | 1 | 0 | |
| Scolecomorphidae | Scolecomorphus kirkii | 1 | 1 |
| Scolecomorphus uluguruensis | 6 | 5 | |
| Herpelidae | Boulengerula boulengeri | 1 | 1 |
| Boulengerula fischeri | 5 | 4 | |
| Boulengerula taitanus | 5 | 3 | |
| Herpele squalostoma | 5 | 5 | |
| Caeciliidae | Caecilia museugoeldi | 1 | 1 |
| Caecilia tentaculata | 2 | 2 | |
| Typhlonectidae | Atretochoana eiselti | 2 | 1 |
| Potomotyphlus kaupii | 2 | 0 | |
| Typhlonectes compressicauda | 5 | 3 | |
| Typhlonectes natans | 2 | 1 | |
| Indotyphlidae | Gegeneophis ramaswamii | 4 | 0 |
| Grandisonia alternans | 4 | 3 | |
| Hypogeophis rostratus | 4 | 3 | |
| Sylvacaecilia grandisonae | 1 | 1 | |
| Siphonopidae | Microcaecilia unicolor | 2 | 1 |
| Mimosiphonops vermiculatus | 1 | 1 | |
| Siphonops annulatus | 3 | 1 | |
| Dermophiidae | Dermophis mexicanus | 4 | 4 |
| Geotrypetes seraphini | 6 | 4 | |
| Schistometopum gregorii | 1 | 1 | |
| Schistometopum thomense | 4 | 4 |
2.2. Micro‐computed tomography imaging
For this study, CT scans of different species were used (Table S1). About half of these scans were performed at the Centre for X‐Ray Tomography at Ghent University, Belgium (UGCT, www.ugct.ugent.be) using the HECTOR micro‐computed tomography (μCT) scanner (Masschaele et al., 2013). The scanner settings were sample dependent. The tube voltage varied between 100 and 120 kV and the amount of X‐ray projections taken over 360° was typically about 2000 per scan. Additional μCT scans were obtained from the online repository, Morphosource (morphosource.org), the Zoological Museum Hamburg (see Kleinteich et al., 2008 for scanner settings), the Royal Museum of Central Africa (75 kV, 1440 projections), and the Natural History Museum, London (100 kV, 3142 projections; see Table S1). The isotropic voxel size of all scans is listed in Table S1. All the μCT scans were processed using both automatic thresholding and manual segmentation to reconstruct the vertebrae in 3D using Amira 2019.3 (Visage Imaging). Using Geomagic Wrap (3D systems), surfaces were prepared by removing highly creased edges and spikes that may interfere with the placement of landmarks.
2.3. 3D Geometric Morphometrics
All the anatomical landmarks were placed by the same person (A.L.) using Stratovan Checkpoint (Stratovan corporation, v; 2020.10.13.0859). Nineteen homologous landmarks were placed on each atlas, whereas 22 homologous landmarks were placed on the other vertebrae included in our analyses (Figures S1, S2; Tables S2, S3). Because the atlas is morphologically and functionally very different from all other vertebrae, it was treated separately while all the other vertebrae were included in a second dataset. Generalized Procrustes analyses (GPA) were performed on each dataset (atlas and other vertebrae) using the ‘gpagen’ function in the geomorph R package v 3.3.1 (https://CRAN.R‐project.org/package=geomorph). Finally, prior to the analyses, asymmetry was removed from the datasets by extracting the symmetric component of shape variation using the ‘bilat.symmetry’ function of the geomorph package.
2.4. Phylogeny
Because vertebral data for species are expected to be phylogenetically structured and thus not statistically independent, phylogeny was taken into account in our comparative analyses (Felsenstein, 1985). The phylogenetic tree of Jetz and Pyron (2018) was pruned to only include the species used in our study. Using 10,000 trees from VertLife.org, the maximum credibility tree (Figure S3) was computed using the ‘maxCladeCred’ function in the phangorn package in R (https://CRAN.R‐project.org/package=phangorn).
2.5. Statistical analyses
All the statistical analyses were performed in R version 4.0.3 (http://www.R‐project.org/). The significance threshold (Type I error rate) was set at α = 0.05.
To assess the impact of size on shape, we performed a Procrustes regression on the means of the GPA coordinates per species using the ‘procD.pgls’ function from the geomorph package. The log10 centroid size was used as a proxy for size. Residuals for each vertebra were then computed and further referred to as allometry‐free shapes, allowing us to examine shape variation not attributable to allometry.
To visualize the evolutionary patterns of shape variation in the vertebrae across the whole body, and to assess the heterogeneity of the axial skeleton, we performed Principal Component Analyses (PCA) on the allometry‐corrected shapes using the ‘gm.prcomp’ function from the geomorph package. First, a global PCA including all the vertebrae, except the atlas was performed. Then, a PCA was performed for each vertebra separately. Next, phylomorphospaces were obtained by projecting estimated ancestral states for phylogenetic nodes and phylogenetic branches onto the morphospaces (Sidlauskas, 2008). Additionally, trajectories between vertebrae were added on the PCA plot to better observe how species differ in the pattern of heterogeneity along the axial skeleton.
We then tested whether the shape of the vertebrae differed depending on its position along the body (grouping variable) using a multivariate analysis of covariance (MANCOVA) with the log10 of the centroid size as the co‐variate. A pairwise comparison was then performed to explore which group differed from one another using the ‘pairwise’ function from the RRPP package with the distance between vectors as our method. The same function was used with the variance as a method to estimate morphological disparity and perform pairwise comparisons among groups.
A canonical variate analysis (CVA) maximizing the among‐group variation was performed on the vertebral shapes using the ‘CVA’ function from the Morpho package v.2.8. (https://CRAN.R‐project.org/package=Morpho). This analysis was used to visualize the variation among groups (V2 to V90%) by using the mean shapes for each group of vertebrae. Prior to the CVA, a test for multivariate normality, Box's M‐test, classifier analysis, and confusion matrix analysis with a Jackknife procedure were performed to confirm that assumptions of the CVA were met. Additionally, we explored the Procrustes variance of each group (V1 to V90%) of vertebrae using the ‘morphol.disparity’ function from the geomorph package. We used the log10 of the centroid size as the co‐variate and the vertebral number as our factor. The heterogeneity of the vertebral column across caecilians was assessed by comparing the variance of the sum of the PC‐scores per species. Additionally, the morphological disparity within the vertebral column for each species was assessed. To do so, the log10 of the centroid size was used as the co‐variate and species as group factor.
3. RESULTS
3.1. Shape allometry
The Procrustes regression of shape on log‐transformed centroid size revealed that only a small proportion of the vertebral shape variation was associated with size variation (V1: 6%, p = 0.11; V2: 7%, p = 0.001; V3: 10%, p = 0.001; V20%: 13%, p = 0.001; V60%: 9%, p = 0.001, V90%: 8%, p = 0.006).
3.2. Global axes of shape variation
The morphological space of the post‐atlantal vertebrae described by the first three principal components (PCs) explained 80% of the total allometry‐free shape variation. Each of the subsequent PCs explained less than 5% of the variation. PC1, explaining 62.5% of the total variation, describes the antero‐posterior variation along the axial skeleton with positive values corresponding to terminal vertebrae and negative values to the most anterior vertebrae. The anterior vertebrae are characterized by an antero‐posterior compression and by being dorsoventrally taller. The posterior side of the neural arch and the postzygapophyses are relatively large, whereas basapophyseal processes are strongly reduced in the most anterior vertebrae. The most posterior vertebrae are antero‐posteriorly elongated and dorso‐ventrally compressed with long basapophyseal processes (Figure 1).
FIGURE 1.
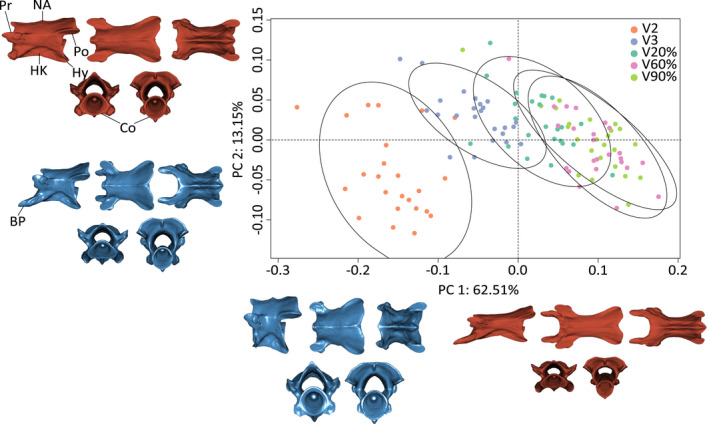
Results of the PCA performed on the allometry‐corrected vertebrae of caecilian amphibians (n = 285). Circles represent species means (n = 120) and are colored by vertebral position. Ellipsoids represent 95% confidence regions. Warped surfaces represent the shape variation associated with the extreme of the PCs. In blue, the minimum extreme and in red, the positive extreme. Top row, from left to right: lateral, dorsal and ventral view. Bottom row, left: proximal view, right: distal view. BP: basapophyseal processes, Co: cotyles, HK: hypapophyseal keel, Hy: Hypapophisis, NA: neural arch, Po: postzygapophysis, Pr: prezygapophysis
Unlike PC1, the 13.2% of shape variation explained by PC2 does not reflect regionalization, but rather corresponds to variation in the length of the basapophyseal processes. Negative values are associated with shorter and bulkier vertebrae with long basapophyseal processes. Positive values represent elongate vertebrae with reduced basapophyseal processes (Figure 1).
3.3. Principal axes of shape variation across vertebral positions
Only the two first principal components showing most of the variation were used to describe shape variation in caecilians as each of the subsequent PCs explains less than 10% of the variation.
3.4. V1
Unlike other vertebrae, V1 (the atlas) possesses large atlantal cotyles for the articulation with occipital condyles of the skull. The first principal component, accounting for 35.9% of the total variation, mainly explains the posterior elongation of the neural arch bearing the postzygapophyses. On the positive extreme of PC1, the dorsal side of the vertebrae is shortened with horizontal postzygapophyses in a relatively low position on the vertebra. Additionally, positive PC1 values are associated with a widening and a dorso‐ventral flattening of the atlas. On the negative extreme, the dorsal face of the atlas is antero‐posteriorly elongated with prezygapophyses being more dorsally positioned (Figure 2). The second principal component (15.9%) corresponds to an antero‐dorsal compression, especially at the level of the vertebral centrum. On the positive extreme are found atlases with a very short centrum. Moreover, the anterior lateral sides of the neural arch are concave, resulting in a bigger opening of the neural canal and flatter atlantal cotyles. High PC1 scores also correspond to a pointed anterior rim of the neural arch. Toward the minimum extreme, centrum is longer with more curved atlantal cotyles and the anterior rim of the neural arch is flat (Figure 2).
FIGURE 2.
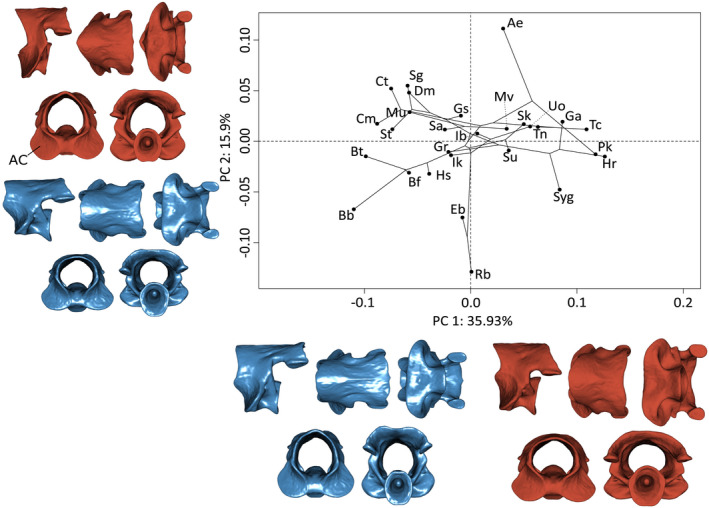
Phylomorphospace of the allometry‐corrected atlas of caecilian amphibians (V1; n = 83). Circles represent species means (n = 28). Warped surfaces represent the shape variation associated with the extreme of the PCs. In blue, the minimum extreme and in red, the positive extreme. AC: atlantal cotyle. See Figure 1 for complete legend and orientation of the vertebrae. Ae: Atretochoana eiselti, Bb: Boulengerula boulengeri, Bf: Boulengerula fischeri, Bt: Boulengerula taitanus, Cm: Caecilia museugoeldi, Ct: Caecilia tentaculata, Dm: Dermophis mexicanus, Eb: Epicrionops bicolor, Ga: Grandisonia alternans, Gr: Gegeneophis ramaswamii, Gs: Geotrypetes seraphini, Hr: Hypogeophis rostratus, Hs: Herpele squalostoma, Ib: Ichthyophis bombayensis, Ik: Ichthyophis kohtaoensis, Mu: Microcaecilia unicolor, Mv: Mimosiphonops vermiculatus, Pk: Potomotyphlus kaupii, Rb: Rhinatrema bivittatum, Sa: Siphonops annulatus, Sg: Schistometopum gregorii, Sk: Scolecomorphus kirkii, St: Schistometopum thomense, Su: Scolecomorphus uluguruensis, Syg: Sylvacaecilia grandisonae, Tc: Typhlonectes compressicauda, Tn: Typhlonectes natans, Uo: Uraeotyphlus oxyurus
3.5. V2
The first principal component accounting for 35.5% of the total shape variation explained variation in the length of the vertebrae. Negative PC1 scores correspond to slender and elongated vertebrae, whereas vertebrae toward the positive extreme are bulkier (Figure 3). Vertebrae associated with positive values on PC2 (21.7%) show dorso‐laterally directed pre‐ and postzygapophyses with a slight elongation of the basapophyseal processes. On the minimum extreme, pre‐ and postzygapophyses are more horizontal relative to the vertebrae and the basapophyseal processes are absent. Additionally, the most antero‐dorsal point of the neural arch is dorsally stretched resulting in a bigger opening of the neural canal (Figure 3).
FIGURE 3.
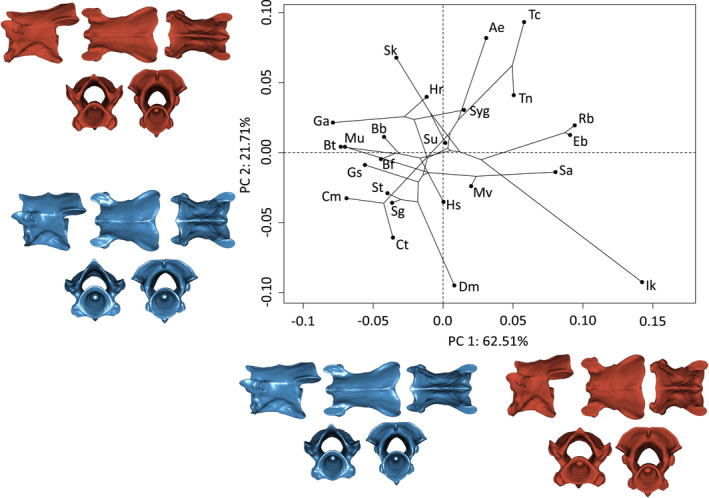
Phylomorphospace of the allometry‐corrected second vertebrae of caecilian amphibians (V2; n = 57). Circles represent species means (n = 24). Warped surfaces represent the shape variation associated with the extreme of the PCs. In blue, the minimum extreme and in red, the positive extreme. See Figures 1 and 2 for complete legend and orientation of the vertebrae
3.6. V3
PC1 (36.3%) explains variation in the length of the vertebrae, with antero‐dorsally compressed vertebrae being positioned toward the positive extreme and elongate vertebrae toward the negative side (Figure 4). PC2 (20.4%) explains the curvature of the ventral hypapophyseal keel and the direction of the prezygapophyses. Positive values are associated with horizontal prezygapophyses and a horizontal hypapophyseal keel. Negatives values are associated with dorsally curved prezygapophyses with a strongly curved hypapophyseal keel. A decrease in the relative horizontal distance between the basapophyseal processes is also observed in species with low PC2 scores (Figure 4).
FIGURE 4.
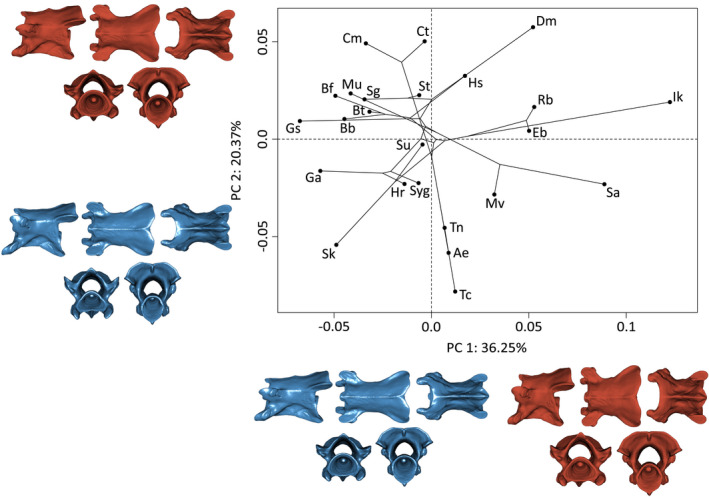
Phylomorphospace of the allometry‐corrected third vertebrae of caecilian amphibians (V3; n = 57). Circles represent species means (n = 24). Warped surfaces represent the shape variation associated with the extreme of the PCs. In blue, the minimum extreme and in red, the positive extreme. See Figures 1 and 2 for complete legend and orientation of the vertebrae
3.7. V20%
As for V3, PC1 (37.8%) explains variation in the length variation of V20%. Negative values are associated with shorter and taller vertebrae. Positive values are associated with slender and elongate vertebrae (Figure 5). The negative extreme of PC2 (18.9%) corresponds to slender vertebrae with more dorsally directed pre‐ and postzygapophyses, longer basapophyseal processes, a curved hypapophyseal keel and a ventro‐posteriorly elongated hypapophysis. Positive values represent vertebrae with more horizontal pre‐ and postzygapophyses, reduced basapophyseal processes, and a more horizontal ventral hypapophyseal keel (Figure 5).
FIGURE 5.
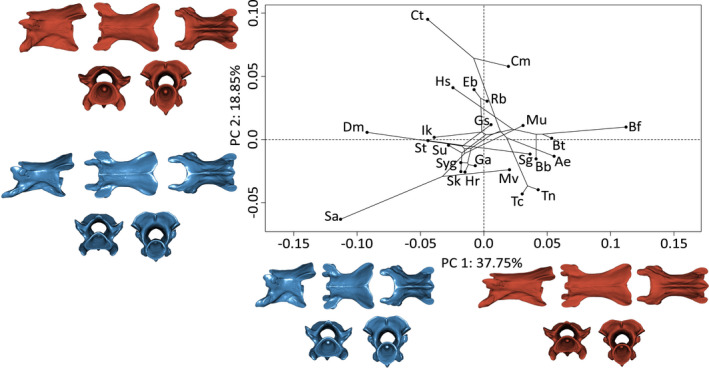
Phylomorphospace of the allometry‐corrected vertebrae at 20% of the total number of vertebrae of caecilian amphibians (V20%; n = 57). Circles represent species means (n = 24). Warped surfaces represent the shape variation associated with the extreme of the PCs. In blue, the minimum extreme and in red, the positive extreme. See Figures 1 and 2 for complete legend and orientation of the vertebrae
3.8. V60%
As for V3 and V20%, PC1 (49.2%) explains, to a larger extent, variation in the length of the vertebrae. Negative values are associated with shorter and taller vertebrae. Positive values are associated with slender and elongate vertebrae. Additionally, pre‐ and postzygapophyses are more horizontal toward the positive extreme of PC1 (Figure 6). The 12.7% of shape variation explained by PC2 mainly correspond to variation in the length of the basapophyseal processes. Negative values are associated with long basapophyseal processes. Positive values represent vertebrae with reduced basapophyseal processes (Figure 6).
FIGURE 6.
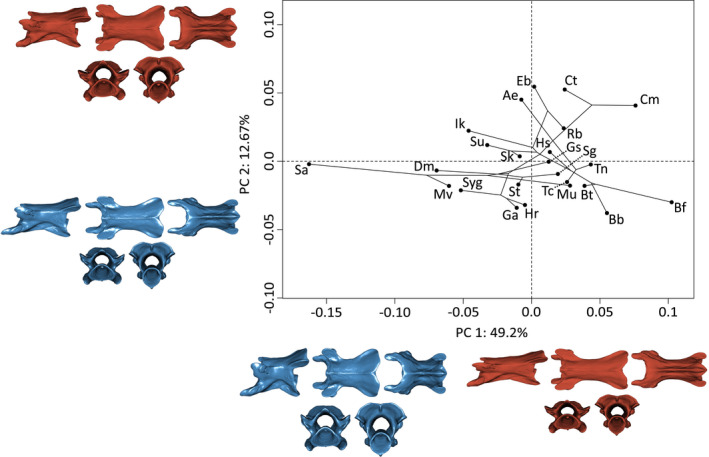
Phylomorphospace of the allometry‐corrected vertebrae at 60% of the total number of vertebrae of caecilian amphibians (V60%; n = 57). Circles represent species means (n = 24). Warped surfaces represent the shape variation associated with the extreme of the PCs. In blue, the minimum extreme and in red, the positive extreme. See Figures 1 and 2 for complete legend and orientation of the vertebrae
3.9. V90%
As for V60%, PC1 (48.5%) explains variation in the length of the vertebrae. Negative values are associated with shorter and taller vertebrae. Positive values are associated with slender and elongate vertebrae (Figure 7). The 14.9% of shape variation explained by PC2 mainly corresponds to shape variation around the cotyles of the vertebrae. Positive values are associated with wider, more open cotyles, whereas negative values are associated with more dorso‐ventrally compressed, and thus smaller, cotyles. Additionally, the width of the dorso‐posterior side of the neural arch and the basapophyseal processes are reduced, and the pre‐ and postzygapophyses are dorsally directed on the minimum extreme of PC2 (Figure 7).
FIGURE 7.
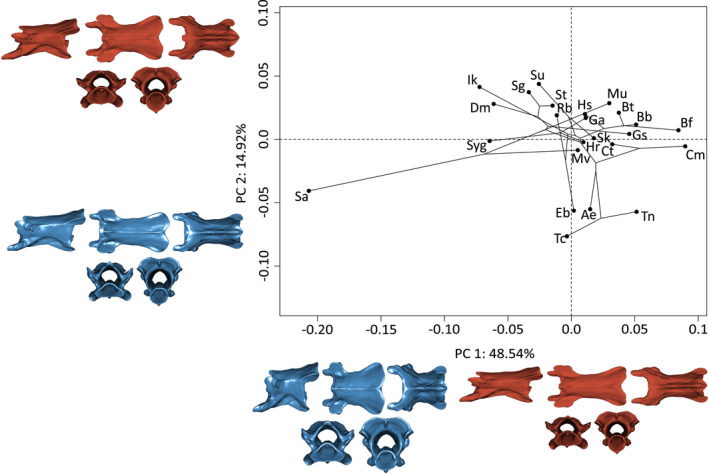
Phylomorphospace of the allometry‐corrected vertebrae at 90% of the total number of vertebrae of caecilian amphibians (V90%; n = 57). Circles represent species means (n = 24). Warped surfaces represent the shape variation associated with the extreme of the PCs. In blue, the minimum extreme and in red, the positive extreme. See Figures 1 and 2 for complete legend and orientation of the vertebrae
3.10. Vertebrae shape variation
The MANCOVA detected a highly significant effect of vertebral position on vertebral shape (R 2 = 0.32, p = 0.001). The pairwise comparisons based on the distance method showed a significant difference between all the vertebrae except between V60% and V90% (Table 2).
TABLE 2.
Pairwise distances between the mean vertebral shape (below diagonal) and pairwise differences in the variance of vertebral shape in caecilians (above diagonal)
| V2 | 0.0041 | 0.0041 | 0.0045 | 0.0028 | |
|---|---|---|---|---|---|
| V3 | 0.14 | 0.00391 | 0.00363 | 0.00133 | |
| V20% | 0.2 | 0.09 | 0.00324 | 0.00136 | |
| V60% | 0.26 | 0.16 | 0.08 | 0.00169 | |
| V90% | 0.25 | 0.16 | 0.09 | 0.04 |
Note: Bold values indicate significant differences (p < 0.05). Red colors represent high values, blue represents low values.
The morphological disparity observed across the vertebrae shows that V2 has the highest disparity (Procrustes variance = 0.01), followed by V90% (Procrustes variance = 0.007). The disparity of V3 and V20% was similar (Procrustes variance = 0.006) and the lowest disparity was observed for V60% (Procrustes variance = 0.005). The pairwise comparison between groups shows that the disparity only differed significantly between V2 and V3, V2 and V20%, and V2 and V60% (Table 2). The morphological disparity was slightly higher for V1 and V2 (respectively, 0.014 and 0.01) than for the rest of the vertebrae (V3, V20% and V60%: 0.006; V90%: 0.007).
The results of the canonical variate analysis showed a good discrimination between groups with an overall classification accuracy of 97% (Figure S4). The cross‐validation table showed that V2, V3, and V20% were always successfully classified, whereas V60% was sometimes misclassified as a V20% or a V90%. The V90% was also sometimes misclassified as a V60% (Table 3).
TABLE 3.
CVA classification result, in %. Percentage of correctly classified vertebrae
| V2 | V3 | V20% | V60% | V90% | |
|---|---|---|---|---|---|
| V2 | 100 | 0 | 0 | 0 | 0 |
| V3 | 0 | 100 | 0 | 0 | 0 |
| V20% | 0 | 0 | 100 | 0 | 0 |
| V60% | 0 | 0 | 4.17 | 87.5 | 8.33 |
| V90% | 0 | 0 | 0 | 4.17 | 95.83 |
3.11. Heterogeneity
The variance observed for the three first PC axes differs across species (Figure 8) but show no obvious differences related to ecology, number of vertebrae or phylogenetic affinity. Along the same lines, the morphological disparity observed among species shows no clear trend other than the unusually high disparity observed for S. annulatus (Figure 8). Trajectories between vertebrae are also quite similar across species (Figure S5).
FIGURE 8.
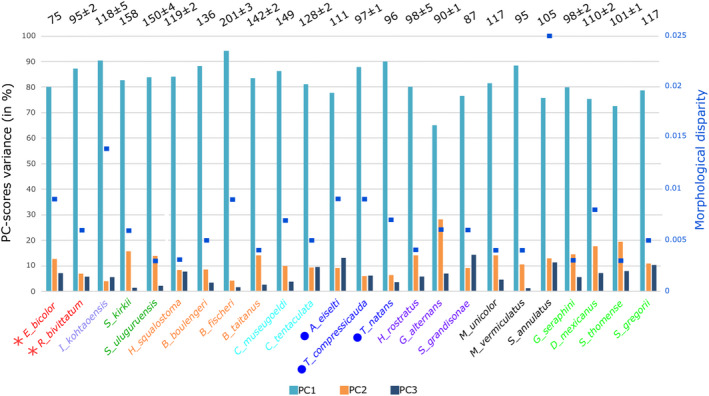
Heterogeneity of the vertebral column across caecilians (n = 285). Each bar represents the percentage of mean variance observed across the whole vertebral column for each species for the three first principal component axes. Numbers on top represent the total amount of vertebrae ± SD. Species names are colored by clades, see Table 1 for full species names and families. Circles represent aquatic species and asterisks represent surface dwellers. Note that Ichthyophis kohtaoensis may also be classified as a surface dweller, yet quantitative ecological data are rare. Other species are all active burrowers. The right Y‐axis represents the morphological disparity for each species and is represented by blue squares in the plot
4. DISCUSSION
Our results confirm previous findings that vertebral shape varies along the axial skeleton in caecilians, yet mostly in the cervical region (Peter, 1894; Wake, 1980, 1977; Wiedersheim, 1879). The principal component analyses and the canonical variate analysis show that vertebrae differ along the vertebral column, despite some similarities observed between V60% and V90%. Globally, anterior vertebrae are antero‐posteriorly compressed, whereas posterior vertebrae are elongated and possess long basapophyseal processes. These results suggest that, despite a uniform bauplan generally observed in elongate limbless tetrapods, vertebral shape variation can be observed in caecilians.
4.1. Anterior vertebrae
The shorter vertebrae found in the anterior region likely provide an increased cumulative angle of rotation important during head movements, whereas their robust morphology likely provides more resistance against the external loads incurred during burrowing. To burrow into the ground, caecilians use a combination of hydrostatic and internal concertina locomotion. These locomotor modes rely on the stiffness of the anterior part of the body while being forcefully pushed forward by the bent and anchored posterior part (Gaymer, 1971; O'Reilly et al., 1997). Robust, bulky anterior vertebrae are thus likely shaped to resist high pressures. Observations on caecilians suggest that the positioning of the head before the initial penetration is an important factor (Kleinteich et al., 2012). Moreover, as the posterior part of the body is not yet into the burrow during the initial penetration of the soil, the anterior part of the body may be critical to widen the tunnel (Gans, 1973). A succession of short vertebrae could allow to fine‐tune the angle of the head prior to the initial penetration as well as giving more flexibility to widen the tunnel. Moreover, the robustness of the nuchal region likely provides additional surface area for the insertion of the pars nuchalis of the m. obliquus externus is involved in the flexion of the cervical region (Wilkinson & Nussbaum, 1997). Anterior vertebrae also show a pronounced hypapophyseal keel gradually reducing in size toward the posterior end of the body. The hypapophyseal keel is the site of insertion of the basapophyseal muscles (Naylor & Nussbaum, 1980). These muscles originating on the basapophyseal processes of the preceding vertebra likely play a role in the flexibility of the vertebral column and their contraction may produce lateral movements between adjacent vertebrae. The head and the anterior part of the body are also implied in other functions such as food capture and processing. Apart from rotational feeding (Measey & Herrel, 2006), caecilians also use head movements to tear apart their prey on the surrounding walls of their burrows (Herrel & Measey, 2012). As noted by Wake (1980), the two first vertebrae show relatively little horizontal motion. The multiple head movements observed in caecilians during feeding are then probably also facilitated by an increased mobility of the shorter anterior vertebrae. Moreover, flexible articulations between anterior vertebrae could be important in orienting the head during prey capture.
4.2. Posterior vertebrae
Mid‐body to more posterior vertebrae were shown to be more elongated than anterior ones and bear marked basapophyseal processes. Their greater length also creates longer positional segments. The displacement of longer segments is needed for the internal concertina movements relying on the bending of a large portion of the vertebral column within the skin and external muscular sheath of the body. The most posterior to terminal vertebrae are thought to have a limited locomotor function compared to mid‐body vertebrae (Wake, 1980). In accordance, our results show only a little difference between V60% and V90% vertebrae. Although the most posterior vertebrae may have different functions than the mid‐body vertebrae (e.g., the positioning the posterior region during copulation, e.g., Kupfer et al., 2006), the constraints shaping mid‐body vertebrae and posterior vertebrae might be similar. Although the basapophyseal processes are rather reduced in the anterior part of the body, their length increases toward the end of the axial skeleton. However, the posteriormost vertebrae lack developed processes (Wake, 1980). Basapophyseal processes are major insertion points of hypaxial musculature and ligaments (Naylor & Nussbaum, 1980). The intercentral ligaments originate from the hypapophyseal keel and insert on the basapophyseal processes of the next vertebrae. Given the retention of amphicoelous vertebrae in caecilians and the absence of a ball‐socket interlocking system as observed in procoelous vertebrae, Naylor and Nussbaum (1980) hypothesized that the pronounced basapophyseal processes associated with the intercentral ligament may function to strengthen and realign the vertebral joints, thus replacing the procoelous ball‐and‐socket joints observed in other taxa such as burrowing squamates (e.g., Naylor & Nussbaum, 1980; Wendell Williston, 1925). Our results corroborate this hypothesis as an increase in the size of the basapophyseal processes is observed toward the posterior end of the body. Indeed, strong and firmly bounded vertebrae are likely needed to resist the reaction forces exerted onto the posterior anchored end of the body while pushing the head into the substrate.
4.3. Regional shape variation
Overall, our results show a continuum between a well‐developed hypapophyseal keel and reduced basapophyseal processes along the anterior part of the body, and reduced hypapophyseal keel and long basapophyseal processes toward the posterior end of the body. As the increased area of these attachment sites is likely related to an increase in the corresponding muscles and ligaments as mentioned above, this suggests that the anterior part of the axial skeleton may provide increased flexibility, whereas the posterior end probably provides strength and stability. Additionally, our results show that the three aquatic species included in our study (Atretochoana eiselti, Typhlonectes compressicauda and T. natans) all have longer, narrower and more slender posterior vertebrae with small cotyles compared to those of more terrestrial species. These adaptations are likely associated with their aquatic lifestyle and may render the posterior end of the body more rigid, thus increasing the efficiency of force transfer from the animal to the fluid.
Far from being homogeneous, the morphological variation observed across the axial skeleton in caecilians points toward a functional heterogeneity across the vertebral column as suggested previously by Renous and Gasc (1989). Our results may also explain the unexpected findings of Woltering et al. (2009) who found evidence of the differential expression of Hox genes through the vertebral column in caecilians. Although the shape of the anterior vertebrae is likely impacted by the multiple functions they need to perform (orient the head, withstand soil reaction
forces, provide muscle insertion points), that of the mid‐body and posterior vertebrae is most likely shaped by locomotion and the insertion of locomotor muscles (Wake, 1980). In mammals, morphological variation is often related to ecological specialization (Jones et al., 2020). As some caecilians are aquatic, some are surface dwellers, while others are active burrowers (Taylor, 1968), a more complete understanding of the ecology of each species could allow for the identification of morphologically specialized patterns along the axial skeleton. However, our preliminary results show no obvious difference in heterogeneity between species belonging to different ecologies or families. Our results provide a first qualitative and quantitative description of vertebral shape across a broad range of caecilians. The inclusion of additional variables, such as ecological parameters, or functional traits (i.e., burrowing forces or muscle cross‐sectional areas), could provide a deeper understanding of the factors that have driven variation in vertebral shape in caecilians. Additionally, although the caecilian fossil record is poor, it consists mostly of isolated vertebrae (e.g., Estes & Wake, 1972; Evans & Sigogneau‐Russel, 2001; Rage, 1986). Consequently, our study may serve as a reference to allocate vertebrae to body regions and to a certain degree, species.
5. CONCLUSION
Far from morphologically homogeneous, the post‐cranial skeleton of caecilians shows variations in vertebral shape. Whereas the anterior part of the body consists of short, bulky vertebrae, posterior vertebrae is elongated with pronounced basapophyseal processes. The inclusion of ecological and functional traits could shed lights on the constraints that shaped the axial skeleton in caecilians.
CONFLICT OF INTEREST
The authors declare no competing or financial interests.
AUTHOR CONTRIBUTIONS
A. L., A. H., and D. A. designed the study. A. L., A. H., B. DK., J. B., J. M., J. O'R., M.W., N. J. K., P. G., and T. K. acquired data. A. L. performed the analyses and drafted the manuscript. All authors contributed to the final manuscript, read and approved it.
Supporting information
Appendix S1
ACKNOWLEDGMENTS
We thank E. Sherratt and A. Kupfer for helpful and constructive comments on a previous version of the manuscript. We thank I. Josipovic and the people at the Centre for X‐Ray Tomography at Ghent University for their help for CT scanning. We thank the Museum of Zoology (University of Michigan), the Amphibian & Reptile Diversity Research Centre (University of Texas Arlington), the Royal Museum of Central Africa (Brussels) and the Zoological Museum (Hamburg), A. Kupfer and the Staatliches Museum für Naturkunde Stuttgart, and all the curators in these institutions for the loan of some key specimens. We also thank MorphoSource for making scans available. A. L. thanks M. Segall for her helpful discussions on the statistical analyses. A. L. also thanks M. H. Wake for the gift of Dermophis specimens.
Lowie, A. , De Kegel, B. , Wilkinson, M. , Measey, J. , O’Reilly, J.C. & Kley, N.J. et al. (2022) Regional differences in vertebral shape along the axial skeleton in caecilians (Amphibia: Gymnophiona). Journal of Anatomy, 241, 716–728. Available from: 10.1111/joa.13682
Anthony Herrel and Dominique Adriaens co‐last authors.
Funding informationThis study was supported by the Research Foundation, Flanders (Fonds Wetenschappelijk Onderzoek, grant 11D5819N), a Tournesol travel grant, the Royal Belgian Zoological Society and a European Union Marie Curie Fellowship (HPMF‐CT‐2001‐01407), fieldwork and visiting fellowship of the Fonds Wetenschappelijk Onderzoek, Flanders, Belgium (FWO‐Vl) to J.M. The special research fund of Ghent University (BOF‐UGent) is acknowledged for financial support of the UGCT Centre of Expertise (BOF.EXP.2017.0007).
DATA AVAILABILITY STATEMENT
The data that support the findings of this study are available from the corresponding author upon reasonable request.
REFERENCES
- Bardua, C. , Wilkinson, M. , Gower, D.J. , Sherratt, E. & Goswami, A. (2019) Morphological evolution and modularity of the caecilian skull. BMC Evolutionary Biology, 19, 1–24. [DOI] [PMC free article] [PubMed] [Google Scholar]
- Dunn, E.R. (1942) The American caecilians. Bulletin of the Museum of Comparative Zoology, 91, 437–540. [Google Scholar]
- Estes, R. & Wake, M.H. (1972) The first fossil record of caecilian amphibians. Nature, 239, 228–231. [Google Scholar]
- Evans, S.E. & Sigogneau‐Russel, D. (2001) A stem‐group caecilian (Lissamphibia: Gymnophiona) from the lower Cretaceous of North Africa. Paleontology, 44, 259–273. [Google Scholar]
- Felsenstein, J. (1985) Phylogenies and the comparative method. The American Naturalist, 125, 1–15. [DOI] [PubMed] [Google Scholar]
- Gans, C. (1973) Locomotion and burrowing in limbless vertebrates. Nature, 242, 414–415. [Google Scholar]
- Gaymer, R. (1971) New method of locomotion in limbless terrestrial vertebrates. Nature, 234, 150–151. [Google Scholar]
- Head, J.J. & Polly, P.D. (2015) Evolution of the snake body form reveals homoplasy in amniote Hox gene function. Nature, 520, 86–89. [DOI] [PubMed] [Google Scholar]
- Herrel, A. & Measey, G.J. (2012) Feeding underground: kinematics of feeding in caecilians. J . Journal of Experimental Zoology Part A: Ecological Genetics and Physiology, 317, 533–539. [DOI] [PubMed] [Google Scholar]
- Jetz, W. & Pyron, R.A. (2018) The interplay of past diversification and evolutionary isolation with present imperilment across the amphibian tree of life. Nature Ecology & Evolution, 2, 850–858. [DOI] [PubMed] [Google Scholar]
- Jones, K.E. , Angielczyk, K.D. , Polly, P.D. , Head, J.J. , Fernandez, V. , Lungmus, J.K. et al. (2018) Fossils reveal the complex evolutionary history of the mammalian regionalized spine. Science, 361, 1249–1252. [DOI] [PubMed] [Google Scholar]
- Jones, K.E. , Gonzalez, S. , Angielczyk, K.D. & Pierce, S.E. (2020) Regionalization of the axial skeleton predates functional adaptation in the forerunners of mammals. Nature Ecology & Evolution, 4, 470–478. [DOI] [PubMed] [Google Scholar]
- Kleinteich, T. , Beckmann, F. , Herzen, J. , Summers, A.P. & Haas, A. (2008) Applying x‐ray tomography in the field of vertebrate biology: form, function, and evolution of the skull of caecilians (Lissamphibia: Gymnophiona). Proceedings of SPIE, 7078, 70780D. [Google Scholar]
- Kleinteich, T. , Maddin, H.C. , Herzen, J. , Beckmann, F. & Summers, A.P. (2012) Is solid always best? Cranial performance in solid and fenestrated caecilian skulls. The Journal of Experimental Biology, 215, 833–844. [DOI] [PubMed] [Google Scholar]
- Kupfer, A. , Kramer, A. , Himstedt, W. & Greven, H. (2006) Copulation and egg retention in an oviparous Caecilian (Amphibia: Gymnophiona). Zoologischer Anzeiger, 244, 223–228. [Google Scholar]
- Kupfer, A. (2009) Sexual size dimorphism in caecilian amphibians: analysis, review and directions for future research. Zoology, 112, 362–369. [DOI] [PubMed] [Google Scholar]
- Lawson, R. (1963) The anatomy of Hypogeophis rostratus Cuvier (Amphibia, Apoda) Part I. The skin and skeleton. Proceedings of the University Durham Phil. Society, 13, 254–273. [Google Scholar]
- Lowie, A. , De Kegel, B. , Wilkinson, M. , Measey, J. , O'Reilly, J.C. , Kley, N.J. et al. (2021) Under pressure: the relationship between cranial shape and burrowing force in caecilians (Gymnophiona). The Journal of Experimental Biology, 224, jeb242964. [DOI] [PubMed] [Google Scholar]
- Maddock, S.T. , Wilkinson, M. , Nussbaum, R.A. & Gower, D.J. (2017) A new species of small and highly abbreviated caecilian (Gymnophiona: Indotyphlidae) from the Seychelles Island of Praslin, and a recharacterization of Hypogeophis brevis Boulenger, 1911. Zootaxa, 4329, 301–326. [DOI] [PubMed] [Google Scholar]
- Maerker, M. , Reinhard, S. , Pogoda, P. & Kupfer, A. (2016) Sexual size dimorphism in the viviparous caecilian amphibian Geotrypetes seraphini (Gymnophiona: Dermophiidae) including an updated overview of sexual dimorphism in caecilian amphibians. Amphibia‐Reptilia, 37, 291–299. [Google Scholar]
- Masschaele, B. , Dierick, M. , Van Loo, D. , Boone, M.N. , Brabant, L. , Pauwels, E. et al. (2013) HECTOR: A 240 kV micro‐CT setup optimized for research. Journal of Physics Conference Series, 463, 012012. [Google Scholar]
- Measey, G.J. & Herrel, A. (2006) Rotational feeding in caecilians: putting a spin on the evolution of cranial design. Biology Letters, 2, 485–487. [DOI] [PMC free article] [PubMed] [Google Scholar]
- Naylor, B. & Nussbaum, R. (1980) The trunk musculature of caecilians (Amphibia: Gymnophiona). Journal of Morphology, 166, 259–273. [DOI] [PubMed] [Google Scholar]
- Nussbaum, R.A. & Wilkinson, M. (1989) On the classification and phylogeny of caecilians (Amphibia: Gymnophiona), a critical review. Herpetological Monographs, 3, 1–42. [Google Scholar]
- O'Reilly, J.C. (2000) Feeding in caecilians. In: Schwenk, K. (Ed.) Feeding: Form, Function, and Evolution in Tetrapod Vertebrates. San Diego, CA: Academic Press, pp. 149–166. [Google Scholar]
- O'Reilly, J.C. , Ritter, D.A. & Carrier, D.R. (1997) Hydrostatic locomotion in a limbless tetrapod. Nature, 386, 269–272. [Google Scholar]
- Peter, K. (1894) Die Wirbelsäule der Gymnophionen. Ber. Naturforsch. Ges. Freiburg, 9, 35–58. [Google Scholar]
- Polly, P.D. , Head, J.J. & Cohn, M.J. (2001) Testing modularity and dissociation: the evolution of regional proportions in snakes. In: Zelditch, M.L. (Ed.) Beyond Heterochrony: The Evolution of Development. New York, NY: Wiley & Sons, pp. 305–335. [Google Scholar]
- Pough, F.H. , Andrews, R.M. , Cadle, J.E. , Crump, M.L. , Savitzky, A.H. & Wells, K.D. (1998) Herpetology. Upper Saddle River, NJ: Prentice‐Hall. [Google Scholar]
- Rage, J.‐C. (1986) Le plus ancien amphibien apode (Gymnophiona) fossile. Remarques sur la répartition et l'histoire paléobiogéographique des gymnophiones. Academie des Sciences, 302, 1033–1036. [Google Scholar]
- Renous, S. & Gasc, J.‐P. (1989) Body and vertebral proportions in Gymnophiona (Amphibia): diversity of morphological types. Copeia, 1989, 837–847. [Google Scholar]
- Renous, S. , Gasc, J.‐P. & Ineich, I. (1993) Données préliminaires sur les capacités locomotrices des amphibiens gymnophiones. Annales des Sciences Naturelles, Zoologie, Paris, 14, 59–79. [Google Scholar]
- Sherratt, E. , Gower, D.J. , Klingenberg, C.P. & Wilkinson, M. (2014) Evolution of cranial shape in caecilians (Amphibia: Gymnophiona). Evolutionary Biology, 41, 528–545. [Google Scholar]
- Sherratt, E. & Sanders, K.L. (2019) Patterns of intracolumnar size variation inform the heterochronic mechanisms underlying extreme body shape divergence in microcephalic sea snakes. Evolution & Development, 22, 283–290. [DOI] [PubMed] [Google Scholar]
- Sidlauskas, B. (2008) Continuous and arrested morphological diversification in sister clades of characiform fishes: A phylomorphospace approach. Evolution, 62, 3135–3156. [DOI] [PubMed] [Google Scholar]
- Summers, A.P. & O'Reilly, J.C. (1997) A comparative study of locomotion in the caecilians Dermophis mexicanus and Typhlonectes natans (Amphibia: Gymnophiona). Zoological Journal of the Linnean Society, 121, 65–76. [Google Scholar]
- Taylor, E.H. (1968) The caecilians of the world. A taxonomic review. Lawrence, KS: University of Kansas Press. [Google Scholar]
- Taylor, E.H. (1977) Comparative anatomy of caecilian anterior vertebrae. University of Kansas Science Bulletin, 51, 219–231. [Google Scholar]
- Wake, M.H. (1977) The reproductive biology of caecilians: an evolutionary perspective. In: Taylor, D.H. & Guttman, S.I. (Eds.) The reproductive biology of amphibians. New York, NY: Plenum Press, pp. 73–101. [Google Scholar]
- Wake, M.H. (1980) Morphometrics of the skeleton of Dermophis mexicanus (Amphibia Gymnophiona). Part I. The vertebrae, with comparisons to other species. Journal of Morphology, 165, 117–130. [DOI] [PubMed] [Google Scholar]
- Wake, M.H. (1993) The skull as a locomotor organ. In: Hanken, J. & Hall, B.K. (Eds.) The Skull: Functional and Evolutionary Mechanisms. Chicago, IL: University of Chicago Press, pp. 197–240. [Google Scholar]
- Wendell Williston, S. (1925) The osteology of the reptiles. London: Oxford University Press. [Google Scholar]
- Wiedersheim, R. (1879) Die Anatomie der Gymnophionen. Jena: Gustav Fischer. [Google Scholar]
- Wilkinson, M. & Nussbaum, R.A. (1997) Comparative morphology and evolution of the lungless caecilian Atretochoana eiselti (Taylor) (Amphibia: Gymnophiona: Typhlonectidae). Biological Journal of the Linnean Society, 62, 39–109. [Google Scholar]
- Wilkinson, M. (2012) Caecilians. Current Biology, 22, 668–669. [DOI] [PubMed] [Google Scholar]
- Woltering, J.M. , Vonk, F.J. , Müller, H. , Bardine, N. , Tuduce, I.L. , de Bakker, M.A.G. et al. (2009) Axial patterning in snakes and caecilians: Evidence for an alternative interpretation of the Hox code. Developmental Biology, 332, 82–89. [DOI] [PubMed] [Google Scholar]
Associated Data
This section collects any data citations, data availability statements, or supplementary materials included in this article.
Supplementary Materials
Appendix S1
Data Availability Statement
The data that support the findings of this study are available from the corresponding author upon reasonable request.


