Abstract
The pelvic ring is a complex anatomical structure building up the connection between the trunk and the legs. Whilst there is a broad discussion in the literature about the dynamic interaction between spine, pelvis and the hip joints, there is still little information about the relation and interaction of the constant pelvic parameters. Based on a three‐dimensional (3D) statistical model consisting of 150 uninjured and bony healthy pelves (100 Europeans, 50 Japanese; 81 males, 69 females; average age 74.3 years ± 17.5 years) an evaluation of pelvic incidence (PI) and acetabular orientation in anteversion and inclination was performed and potential correlations of these intraindividual constant parameters were investigated. Pelvic incidence is defined as the angle between the perpendicular to the sacral plate at its midpoint and the line connecting this point to the middle axis of the femoral heads. Acetabular anteversion is defined as the angle between the perpendicular to the best‐fit plane on the acetabular rim and the coronal plane measured in strict lateral view. Acetabular inclination is defined as the angle between the perpendicular to the best‐fit plane on the acetabular rim and the sagittal plane in strict frontal view. Data were further analysed with regard to different subgroup's age, sex and ethnicity. A positive correlation between PI and acetabular anteversion could be demonstrated. Further, PI and also the acetabular parameters anteversion and inclination were found to be significantly higher in the European individuals than in the Asian. The results of the present study demonstrate a relation between the anatomical configuration of the constant pelvic parameters building up the connection points to the next proximal respectively caudal skeleton section. The findings might lead to more comprehensive treatment strategies in case of trauma or degenerative pathologies of the pelvis in the future.
Keywords: 3D statistical model, acetabular anteversion, acetabular inclination, acetabular orientation, pelvic incidence, pelvic ring
3D statistical model used to evaluate and analyse individual anatomy of the pelvis.
1. INTRODUCTION
The pelvic ring is a complex anatomical structure with central importance connecting the spine and lower extremities at the caudal part of the axial skeleton. The biomechanical interaction of the spine, pelvis and lower extremities is crucial for allowing an upright stand and gait without dysbalances. This functional interaction is affected and influenced by a lot of different factors like the spinal configuration and mobility (e.g. lumbal lordosis, scoliosis), pelvic anatomy and orientation (pelvic incidence [PI], pelvic tilt, sacral slope, pelvic inclination), the acetabular configuration (anteversion, inclination, dysplasia) and the surrounding tendons, muscles and ligaments. Spinopelvic balance is a frequently discussed issue especially in trying to describe and understand the interaction between the spine, pelvis and lower extremities (Hayden et al., 2018; Yoshioka et al., 2019). Several studies focus on the relation between spine configuration and pelvic anatomy, and the effect of impaired mobility of the lumbar spine on hip joint function. Eftekhary et al. (2019) published a systematic review article reflecting spinopelvic relationship, spinopelvic movement and the effect of dysfunctional disorders of the lumbar spine on the functional acetabular orientation. Whilst there is consensus that dysfunction of the lumbar spine or hip joints affect each other (Bernstein et al., 2019; Eyvazov et al., 2016; Fader et al., 2018; Morris et al., 2016; Weng et al., 2016), the discussion about a relation between PI and acetabular orientation remains controversial. Some authors consider PI as a predictive factor for three‐dimensional (3D) acetabular orientation (Boulay et al., 2014). In contrast, a retrospective study by Sautet et al. investigating 150 healthy pelves showed no correlation of PI with acetabular parameters (Sautet et al., 2018).
The aim of the present study was the evaluation of PI and acetabular orientation in anteversion and inclination, and the investigation of a potential relation of these parameters as they are all constant and independent of the individual's position.
Pelvic incidence is defined as the angle between the perpendicular to the sacral plate at its midpoint and the line connecting this point to the middle axis of the femoral heads (Legaye et al., 1998).
Acetabular anteversion is defined as the angle between the perpendicular to the best‐fit plane on the acetabular rim and the coronal plane measured in strict lateral view (Murray, 1993).
Acetabular inclination is defined as the angle between the perpendicular to the best‐fit plane on the acetabular rim and the sagittal plane in strict frontal view (Murray, 1993).
Analysis was performed based on a 3D statistical model of the pelvic ring including 150 individual and uninjured pelves of Asian and Caucasian adults. As there are known intraindividual asymmetries, PI was treated as a 3D parameter and calculated for the right and left sides separately, so that a side‐specific correlation could be analysed. Further, subgroup analysis was performed with regard to sex, ethnicity and age.
2. MATERIAL AND METHODS
Analysis was performed on the base of a 3D statistical model of the pelvic ring described by our group before (Arand et al., 2019). The model consists out of 150 computed tomography (CT) scans of individual uninjured pelves (100 European pelves: 51 male, 49 female, average age 60.0 years ± 13.1 years; 50 Japanese pelves: 30 male, 20 female, average age 74.3 years ± 17.5 years). Average image resolution was 0.7 × 0.7 × 0.6 mm. Computed tomography scans were performed for other reasons than suspicion of bony injuries or pathologies, and data were used retrospectively with the approval of the local ethics committee. Computation of the model and data processing was performed using the software AMIRA (Amira version 6.0.0; FEI).
As PI is defined as the angle between the perpendicular to the sacral plate at its midpoint and the line connecting this point to the middle axis of the femoral heads (Legaye et al., 1998), it was calculated landmark‐based according to these specifications. The geographical midpoint of the sacral plate was computed by calculating the midpoint between the landmarks defining the edges of the sacral plate. As the femoral head is not part of the 3D model of the pelvis, the middle axis of the connecting line between the centres of the acetabular cavities was used instead. The centre of the acetabulum was calculated using the best‐fit ball fitting the acetabular joint surface, and the midpoint of that ball was treated as the acetabular centre. Pelvic incidence was then calculated as the angle between the perpendicular to the sacral plate at its computed midpoint and the line connecting this point to the midpoint of the axis between the acetabular centres. Due to intraindividual anatomical variations and asymmetries, the calculated midpoint of the sacral plate and also the midpoint of the middle axis of the acetabular centre were not always situated in the strict centre of the sacrum in ap projection. To address those observed deviations from the midline, which might cause differences between the left and right sides, an additional angle was calculated taking those 3D aspects into account. This additional angle was calculated using the previously defined perpendicular to the sacral plate at its geographical midpoint and the connecting line between this point and the calculated centre of the acetabulum. The angle was measured separately for each side and designated PI 3D for the left and right sides, respectively (Figure 1).
FIGURE 1.
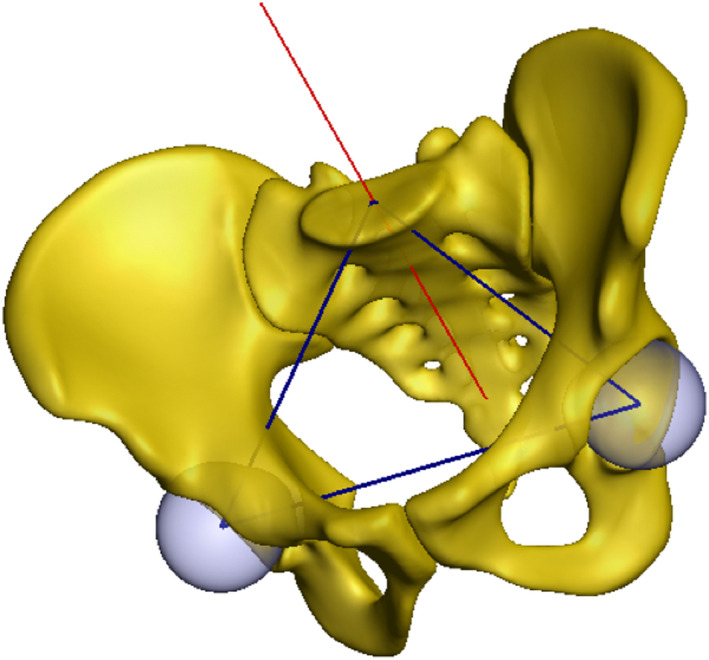
3D statistical model of the pelvic ring. The figure shows the mean model with the perpendicular to the sacral plate at its geographical midpoint (red line), the best‐fit balls inside the acetabular cavity (light blue) and the axis connecting the acetabular centre with the midpoint of the sacral plate as well as the interacetabular axis (blue lines). Based on these lines PI and PI 3D were calculated. 3D, three‐dimensional; PI, pelvic incidence.
Acetabular orientation in anteversion and inclination was also calculated landmark‐based and according to radiographic anteversion and inclination described by Murray (1993). A best‐fit plane was positioned on the acetabular rim and a normal of that plane was defined running through the centre of the acetabulum calculated before. The direction of this normal determines the acetabular orientation three‐dimensionally. To generate a reference independent of the spatial position of the pelvis a coordinate system was established based on the anterior pelvic plane (Figure 2a,b). The anterior pelvic plane is defined as a plane running through the anterior superior iliac spines and the anterior surface of the symphysis (Lewinnek et al., 1978). The coordinate system was then used to reference anteversion in lateral projection as the angle between the normal defining the acetabular orientation and the y‐axis (Figure 2b), and inclination in ap projection as the angle between the normal defining the acetabular orientation and the y‐axis as well (Figure 2a). Anteversion and inclination angle were measured on both sides of all included samples.
FIGURE 2.
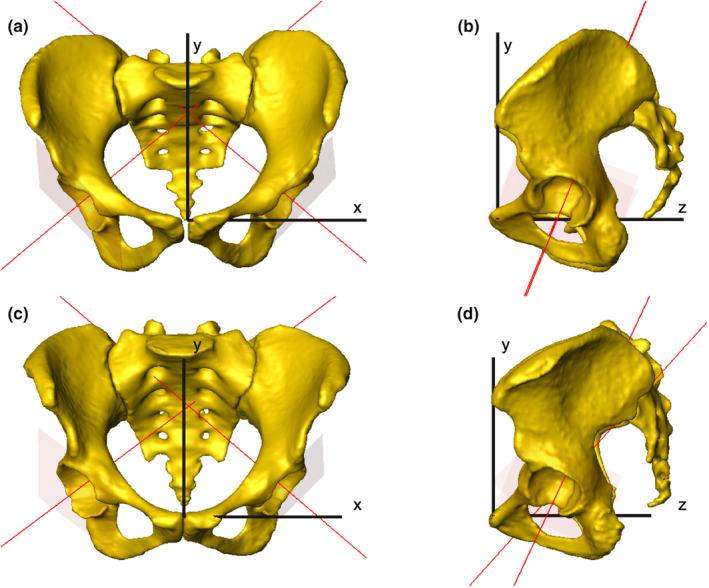
Coordinate system within the 3D model of two individual pelves established based on the anterior pelvic plane. Anteversion angle is built up by the red lines in strict lateral view and the y‐axis (b, d), inclination angle is built up by the red lines in ap view and the y‐axis (a, c). 3D, three‐dimensional.
Statistical analysis of the measured angles (PI, PI 3D, anteversion and inclination) and further evaluation of correlation were performed using the software SPSS (IBM SPSS Statistics 24; IBM) and GraphPad Prism (GraphPad Software).
Correlation analysis was performed between PI and PI 3D, side specific PI 3D and anteversion, side specific PI 3D and inclination and between anteversion and inclination. In addition, subgroups were analysed for measurable sex‐related (male vs. female), ethnicity‐related (European vs. Japanese) or age‐related (age ≤65 years vs. >65 years) differences. Statistical analysis was performed using Mann–Whitney‐U‐Test for independent samples, and for correlation analysis, Spearman's correlation was used.
3. RESULTS
Table 1 shows the frequency analysis of the whole data set. In subgroup analysis, PI and PI 3D were found to be significantly higher in Europeans than in Japanese (p < 0.05) (Table 2). In contrast, there were no statistically significant sex‐ or age‐related differences observed (Tables 3 and 4). Table 5 shows the frequency analysis of the whole data set concerning anteversion and inclination. Regarding acetabular orientation subgroup analysis showed significantly higher values for anteversion in females than in males (p < 0.05) as well as in Europeans compared to Japanese (p < 0.05). Whilst sex‐related differences were not observed in inclination, Europeans showed significantly higher inclination angles than the Japanese (p < 0.05) (Tables 6 and 7). Anteversion and inclination were shown to be statistically higher in the age group up to 65 years than in the group of individuals older than 65 years (p < 0.05) (Table 8).
TABLE 1.
Frequency analysis of all included samples (n = 150) regarding PI and PI 3D
| PI | PI 3D average | PI 3D left/right | diff PI 3D | |
|---|---|---|---|---|
| Median | 48.0° | 59.1° | 59.8°/58.5° | 2.7° |
| SD | 10.5 | 7.52 | 7.59/7.92 | 2.33 |
| Min | 28.5° | 46.7° | 48.0°/45.4° | 0.0° |
| Max | 86.0° | 87.1° | 89.2°/84.9° | 10.1° |
Abbreviations: 3D, three‐dimensional; PI, pelvic incidence; SD, standard deviation.
TABLE 2.
Frequency analysis of all samples included (n = 150) and comparison between Europeans (E) and Japanese (J)
| PI | PI 3D average | PI 3D left/right | ||||
|---|---|---|---|---|---|---|
|
E n = 100 |
J n = 50 |
E n = 100 |
J n = 50 |
E n = 100 |
J n = 50 |
|
| Median | 50.2° | 45.3° | 61.4° | 57.1° | 62.2°/61.1° | 57.9°/56.8° |
| SD | 10.67 | 8.04 | 7.76 | 5.6 | 7.93/7.98 | 5.35/6.59 |
| Min | 34.0° | 28.5° | 48.4° | 46.7° | 49.2°/47.5° | 48.0°/45.4° |
| Max | 86.0° | 67.4° | 87.1° | 73.4° | 89.2°/84.9° | 73.6°/75.2° |
| p‐value (α = 0.05) | <0.0001 | <0.0001 | ||||
Note: PI and PI 3D were significantly higher in Europeans than in Japanese individuals.
Abbreviations: 3D, three‐dimensional; PI, pelvic incidence; SD, standard deviation.
TABLE 3.
Frequency analysis of all samples included (n = 150) and comparison between males (♂) and females (♀)
| PI | PI 3D average | PI 3D left/right | ||||
|---|---|---|---|---|---|---|
|
♂ n = 81 |
♀ n = 69 |
♂ n = 81 |
♀ n = 69 |
♂ n = 81 |
♀ n = 69 |
|
| Median | 52.0° | 49.1° | 58.4° | 59.4° | 59.5°/57.3° | 60.7°/59.6° |
| SD | 13.61 | 10.34 | 7.71 | 7.34 | 7.49/7.93 | 7.74/7.92 |
| Min | 25.0° | 28.5° | 49.0° | 46.7° | 49.2°/46.1° | 48.0°/45.4° |
| Max | 85.0° | 76.6° | 87.1° | 80.7° | 89.2°/84.9° | 82.3°/79.0° |
| p‐value (α = 0.05) | 0.185 | 0.353 | ||||
Abbreviations: 3D, three‐dimensional; PI, pelvic incidence; SD, standard deviation.
TABLE 4.
Frequency analysis of all samples included (n = 150) and comparison between individuals ≤65 years and >65 years
| PI | PI 3D average | PI 3D left/right | ||||
|---|---|---|---|---|---|---|
|
≤65 n = 77 |
>65 n = 73 |
≤65 n = 77 |
>65 n = 73 |
≤65 n = 77 |
>65 n = 73 |
|
| Median | 49.9° | 48.3° | 60.90° | 59.0° | 61.5°/61.0° | 59.8°/58.5° |
| SD | 10.29 | 10.22 | 7.5 | 7.17 | 7.54/7.9 | 7.24/7.64 |
| Min | 34.0° | 28.5° | 48.4° | 46.7° | 49.2°/46.1° | 48.0°/45.4° |
| Max | 76.6° | 76.6° | 80.7° | 85.1° | 82.3°/79.1° | 89.2°/84.9° |
| p‐value (α = 0.05) | 0.125 | 0.075 | ||||
Note: PI and PI 3D were higher in the older age group, but without statistical significance.
Abbreviations: 3D, three‐dimensional; PI, pelvic incidence; SD, standard deviation.
TABLE 5.
Frequency analysis of all samples included (n = 150) regarding anteversion and inclination
| Anteversion | Inclination | |||
|---|---|---|---|---|
| Average | Left/right | Average | Left/right | |
| Median | 26.4° | 26.4°/26.7° | 51.0° | 50.3°/51.3° |
| SD | 9.11 | 9.13/9.61 | 3.72 | 3.91/4.21 |
| Min | 7.7° | 5.8°/6.5° | 41.4° | 41.6°/40.3° |
| Max | 52.2° | 53.4°/50.9° | 60.4° | 59.4°/62.2° |
Abbreviation: SD, standard deviation.
TABLE 6.
Frequency analysis of all samples included (n = 150) and comparison between males (♂) and females (♀)
| Anteversion | Inclination | |||||||
|---|---|---|---|---|---|---|---|---|
| Average | Left/right | Average | Left/right | |||||
|
♂ n = 81 |
♀ n = 69 |
♂ n = 81 |
♀ n = 69 |
♂ n = 81 |
♀ n = 69 |
♂ n = 81 |
♀ n = 69 |
|
| Median | 24.4° | 28.1° | 24.4°/25.6° | 27.7°/28.9° | 51.2° | 51.1° | 50.4°/50.9° | 50.2°/51.7° |
| SD | 8.98 | 8.95 | 9.09/9.43 | 9.17/9.29 | 3.76 | 3.69 | 3.74/3.74 | 4.1/4.01 |
| Min | 8.9° | 7.7° | 6.6°/6.5° | 5.8°/7.4° | 41.4° | 44.0° | 42.4°/40.3° | 41.6°/43.0° |
| Max | 52.2° | 46.8° | 53.4°/50.9° | 43.7°/49.8° | 60.4° | 60.0° | 59.4°/61.4° | 58.6°/62.2° |
| p‐value (α = 0.05) | 0.0085 | 0.878 | ||||||
Note: Anteversion was significantly higher in female samples, regarding inclination no sex‐related differences could be shown.
Abbreviation: SD, standard deviation.
TABLE 7.
Frequency analysis of all samples included (n = 150) and comparison between Europeans (E) and Japanese (J)
| Anteversion | Inclination | |||||||
|---|---|---|---|---|---|---|---|---|
| Average | Left/right | Average | Left/right | |||||
| E n = 100 |
J n = 50 |
E n = 100 |
J n = 50 |
E n = 100 |
J n = 50 |
E n = 100 |
J n = 50 |
|
| Median | 29.8° | 21.6° | 29.1°/29.0° | 19.4°/22.5° | 51.8° | 49.9° | 50.7°/52.3° | 49.6°/49.5° |
| SD | 9.08 | 6.97 | 9.02/9.73 | 7.08/7.49 | 3.79 | 3.32 | 4.05/4.22 | 3.5/3.83 |
| Min | 7.7° | 9.4° | 6.6°/6.5° | 5.8°/7.3° | 41.4° | 44.2° | 42.0°/40.3° | 41.6°/42.8° |
| Max | 52.2° | 39.3° | 53.4°/50.9° | 40.4°/38.2° | 60.4° | 55.3° | 59.4°/62.2° | 55.4°/57.4° |
| p‐value (α = 0.05) | <0.0001 | 0.0088 | ||||||
Note: Anteversion and inclination were significantly higher in Europeans than in Japanese individuals.
Abbreviation: SD, standard deviation.
TABLE 8.
Frequency analysis of all samples included (n = 150) and comparison between individuals ≤65 years and >65 years
| Anteversion | Inclination | |||||||
|---|---|---|---|---|---|---|---|---|
| Average | Left/right | Average | Left/right | |||||
| ≤65 | >65 | ≤65 | >65 | ≤65 | >65 | ≤65 | >65 | |
| Median | 28.8° | 22.9° | 28.9°/28.7° | 23.1°/24.2° | 52.2° | 49.9° | 51.3°/52.6° | 49.6°/50.3° |
| SD | 9.48 | 8.14 | 9.34/10.28 | 8.43/8.34 | 3.67 | 3.42 | 3.78/4.16 | 3.74/3.4 |
| Min | 7.7° | 9.4° | 7.9°/6.5° | 5.8°/7.3° | 44.0° | 41.4° | 42.9°/43.3° | 41.6°/40.3° |
| Max | 52.2° | 41.6° | 53.4°/50.9° | 40.3°/42.9° | 60.4° | 55.3° | 59.4°/62.2° | 58.0°/59.6° |
| p‐value (α = 0.05) | 0.0027 | <0.0001 | ||||||
Note: Anteversion and inclination were significantly higher in the younger age group.
Abbreviation: SD, standard deviation.
Correlation analysis of the acquired data using Spearman's correlation (Table 9; Figure 3) showed a strong positive correlation between PI and PI 3D (r = 0.9812, both‐sided statistically significant with p < 0.0001) (Figure 4) and also a slightly positive correlation between PI and anteversion could be shown (r = 0.2612, both‐sided statistically significant with p = 0.0012) (Figure 5). PI and inclination showed no correlative relation (Figure 6). Between anteversion and inclination a relevant positive correlation was observed (Figures 7 and 8, r = 0.5215, both‐sided statistically significant with p < 0.0001) (Figure 9). Table 10 shows the correlation analysis within the defined subgroups.
TABLE 9.
Correlation analysis of PI, PI 3D, anteversion and inclination using Spearman's correlation
| Correlation coefficient r | PI | PI 3D | Anteversion | Inclination |
|---|---|---|---|---|
| PI | 1 | 0.9812**** | 0.2612** | −0.03250 |
| PI 3D | 0.9812**** | 1 | 0.2869*** | −0.03407 |
| Anteversion | 0.2612** | 0.2869*** | 1 | 0.5215**** |
| Inclination | −0.03250 | −0.03407 | 0.5215**** | 1 |
Abbreviations: 3D, three‐dimensional; PI, pelvic incidence.
p = 0.0012 (both sides).
p = 0.0004 (both sides).
p < 0.0001 (both sides).
FIGURE 3.
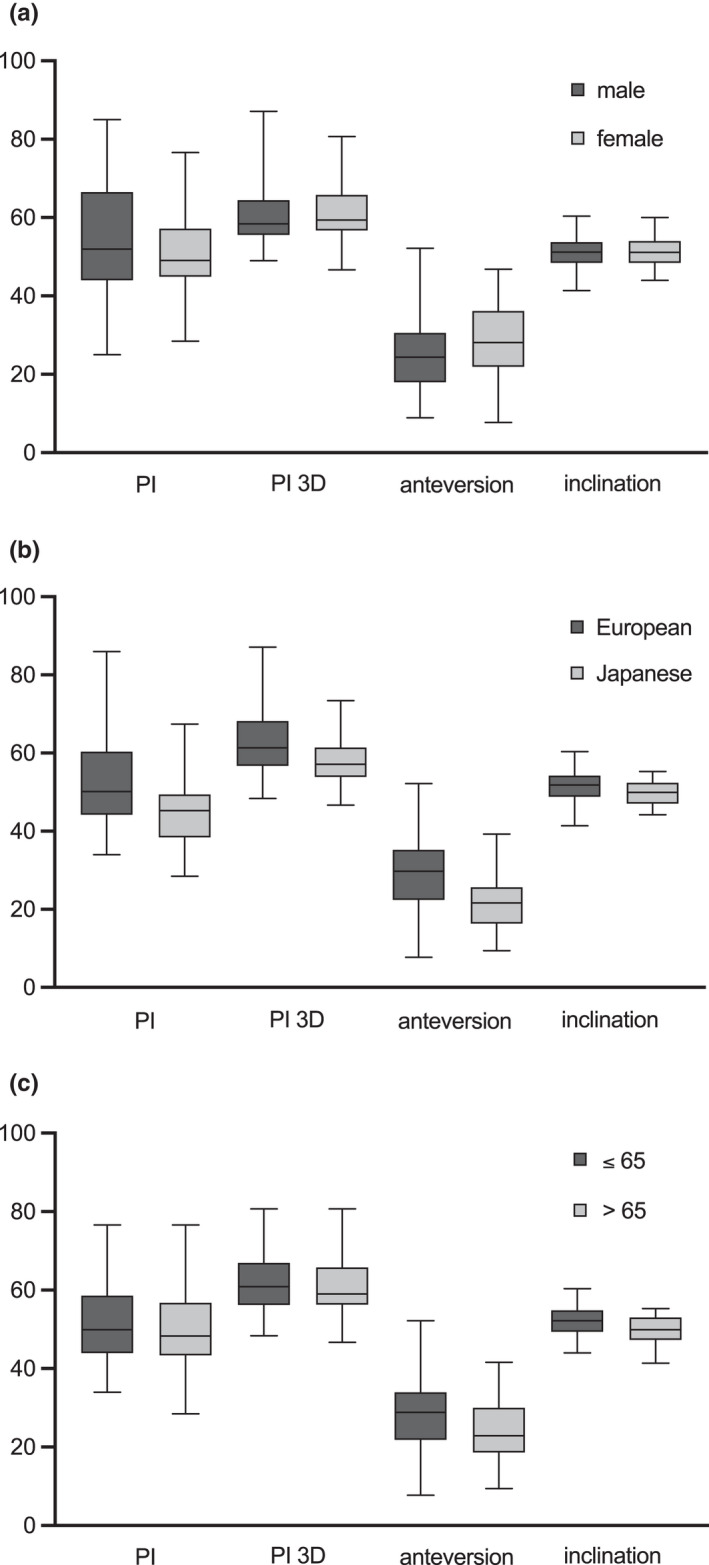
Frequency analysis of all samples included (n = 150) and comparison between (a) males and females, (b) comparison between Europeans and Japanese and (c) comparison between individuals ≤65 years and >65 years.
FIGURE 4.
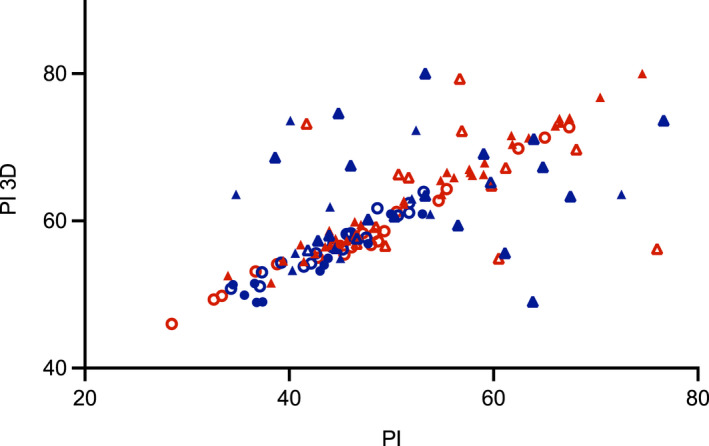
Correlation between PI and PI 3D; red = female, blue = male, triangle = European, circle = Japanese, filled = ≤65 years, unfilled = >65 years. 3D, three‐dimensional; PI, pelvic incidence.
FIGURE 5.
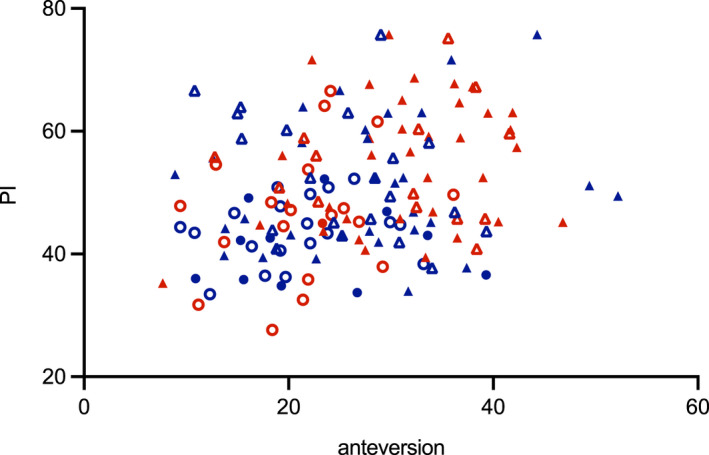
Correlation between anteversion and PI; red = female, blue = male, triangle = European, circle = Japanese, filled = ≤65 years, unfilled = >65 years. PI, pelvic incidence.
FIGURE 6.
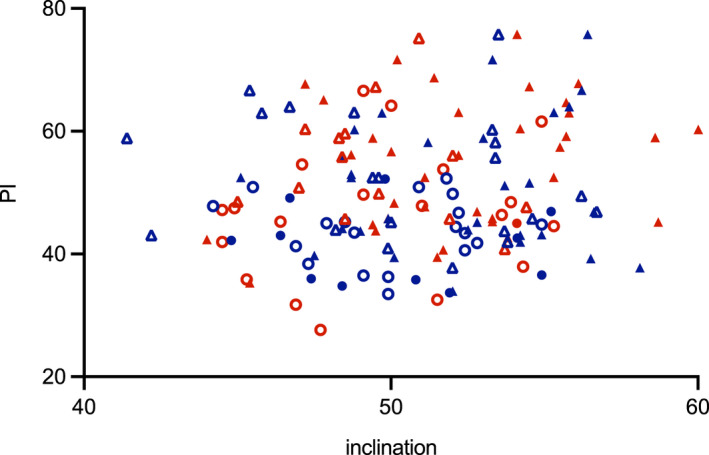
Correlation between inclination and PI; red = female, blue = male, triangle = European, circle = Japanese, filled = ≤65 years, unfilled = >65 years. PI, pelvic incidence.
FIGURE 7.
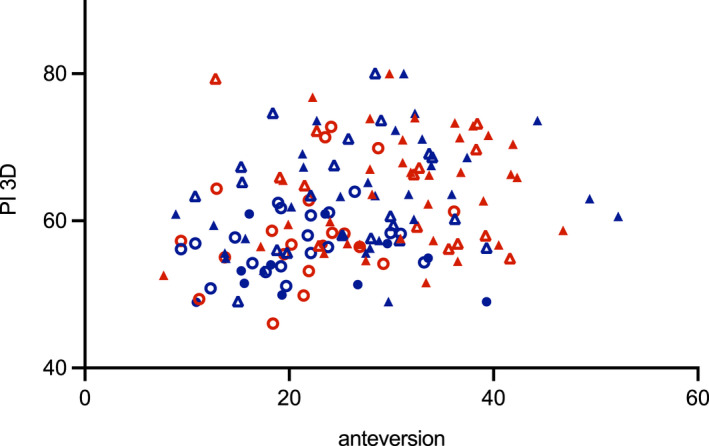
Correlation between anteversion and PI 3D; red = female, blue = male, triangle = European, circle = Japanese, filled = ≤65 years, unfilled = >65 years. PI, pelvic incidence. 3D, three‐dimensional; PI, pelvic incidence.
FIGURE 8.
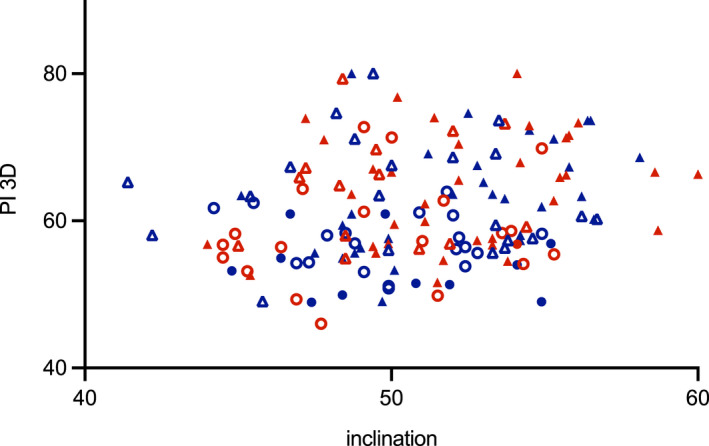
Correlation between inclination and PI 3D; red = female, blue = male, triangle = European, circle = Japanese, filled = ≤65 years, unfilled = >65 years. PI, pelvic incidence. 3D, three‐dimensional; PI, pelvic incidence.
FIGURE 9.
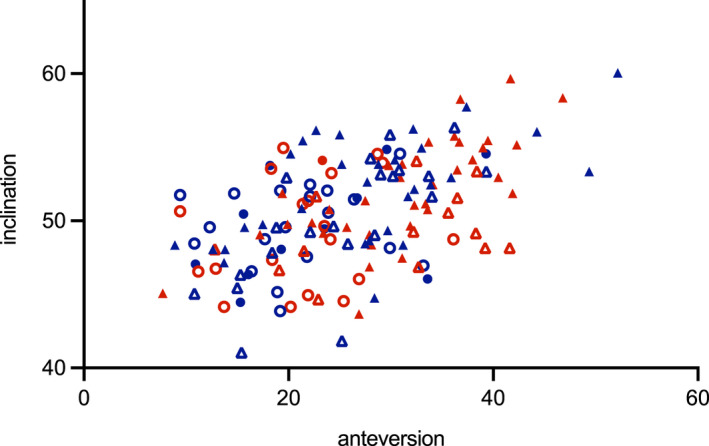
Correlation between anteversion and inclination; red = female, blue = male, triangle = European, circle = Japanese, filled = ≤65 years, unfilled = >65 years.
TABLE 10.
Correlation analysis of PI, PI 3D, anteversion and inclination within the defined subgroups using Spearman's correlation
| Correlation coefficient r | PI | PI 3D | Anteversion | Inclination | |
|---|---|---|---|---|---|
| PI | ♂ | 1 | 0.3512** | 0.09498 | −0.08610 |
| ♀ | 0.9755*** | 0.1108 | 0.2371* | ||
| E | 0.9830*** | 0.1720 | −0.1772 | ||
| J | 0.9647*** | 0.2179 | 0.05241 | ||
| ≤65 | 0.9788*** | 0.2755* | 0.1547 | ||
| >65 | 0.9825*** | 0.1476 | −0.03298 | ||
| PI 3D | ♂ | 0.3512** | 1 | 0.3346** | 0.3022 |
| ♀ | 0.9755*** | 0.1341 | 0.2329 | ||
| E | 0.9830*** | 0.2030* | −0.1731 | ||
| J | 0.9647*** | 0.2486 | 0.03087 | ||
| ≤65 | 0.9788*** | 0.2751* | 0.1498 | ||
| >65 | 0.9825*** | 0.1838 | −0.01326 | ||
| Anteversion | ♂ | 0.09498 | 0.3346** | 1 | 0.5531*** |
| ♀ | 0.1108 | 0.1341 | 0.5217*** | ||
| E | 0.1720 | 0.2030* | 0.5676*** | ||
| J | 0.2179 | 0.2486 | 0.2670 | ||
| ≤65 | 0.2755* | 0.2751* | 0.5958*** | ||
| >65 | 0.1476 | 0.1838 | 0.1350 | ||
| Inclination | ♂ | −0.08610 | 0.3022 | 0.5531*** | 1 |
| ♀ | 0.2371* | 0.2329 | 0.5217*** | ||
| E | −0.1772 | −0.1731 | 0.5676*** | ||
| J | 0.05241 | 0.03087 | 0.2670 | ||
| ≤65 | 0.1547 | 0.1498 | 0.5958*** | ||
| >65 | −0.03298 | −0.01326 | 0.1350 | ||
Abbreviations: 3D, three‐dimensional; PI, pelvic incidence.
p < 0.05 (both sides).
p < 0.01 (both sides).
p < 0.0001 (both sides).
4. DISCUSSION
The interaction between the axial skeleton and the lower extremity is of central importance for the human's mobility. The pelvis represents the crucial connective part. Further, it is the biomechanical point of force distribution sharing the central weight force of the body to both legs. The description of this force‐distributing process remains a difficult and not fully managed task. In addition, force distribution is not static but changes with body position and load patterns of the legs which vary continuously during walking.
The present study represents an attempt to utilize the technology of a 3D statistical model of the pelvic ring to analyse and describe the anatomic characteristics of the pelvis building up the connection points to the lumbar spine, the hip joint and the proximal femur, respectively, as those are the directly adjacent functional units with direct interplay. Therefore, the analysis of PI and acetabular orientation was performed as these parameters do not change with the individual's position. As PI defines the main axis of sagittal spinopelvic balance (Legaye et al., 1998) and, therefore, also the connection to the spine as the neighbouring cranial functional unit, a potential relation to the acetabular orientation, as the anatomic structure defining the connection to the adjacent caudal functional unit, was investigated. Median PI was 48.0° (standard deviation [SD] ± 10.5) within the collective, median PI 3D was 59.1° (SD ± 7.52) about 10° higher than PI (Table 1), and, as expected, both parameters showed a strong positive correlation (Table 9). Median acetabular anteversion was measured at 26.4° (SD ± 9.11), median acetabular inclination was 51.0° (SD ± 3.72) (Table 5) and both parameters showed a positive correlation as well (Table 9). A positive correlation between PI, PI 3D and acetabular anteversion was also observable whilst there was no correlation between PI or PI 3D and acetabular inclination (Table 9). Further analysis of the defined subgroups showed statistically significant higher anteversion in females than in males (Table 6). Regarding acetabular inclination, no sex‐related differences were observed. Differentiating between European and Japanese samples PI, PI 3D, acetabular anteversion and inclination were shown to be significantly higher in Europeans (Tables 2 and 7). As expected no differences were observed between the age cohorts ≤65 years and >65 years regarding PI and PI 3D (Table 4), as PI is described as a constant parameter during adulthood (Legaye et al., 1998; Roussouly & Pinheiro‐Franco, 2011). Comparing the age groups, a significantly higher anteversion and inclination were displayed within the younger collective (Table 8) which might be explained by increasing degenerative changes.
There is a broad discussion in the literature about the dynamic interaction between the spine, pelvis and the hip joints trying to understand and explain how the functional units affect each other, and how pathologies of the spine affect the hip joint and vice versa (Bernstein et al., 2019; Celestre et al., 2018; Eftekhary et al., 2019; Eyvazov et al., 2016; Hasegawa et al., 2016; Hayden et al., 2018; Heckmann et al., 2018; Ochi et al., 2016). But there is little information about the interaction and relation between PI and acetabular version as the constant parameters build up the basis for dynamic interaction. Le Huec and Hasegawa (2016) investigated spinopelvic parameters on 268 Caucasian and Japanese asymptomatic individuals and found no differences between the two populations. In contrast, our results show a statistically significant difference between Europeans and Japanese regarding the constant pelvic parameters. Boulay et al. (2014) performed a study on 12 anatomic pelvis specimens and identified PI to be a predictive factor for three‐dimensional acetabular orientation). In a CT‐based study by Sautet et al. (2018) 150 pelves without bony pathologies were analysed regarding acetabular orientation, PI and sacro‐pubic angle. Mean PI was 58.6° (SD ± 10.2) and thereof about 10° higher as in our study (48.0°; SD ± 10.5). Acetabular anteversion was also observed to be higher in females than in male samples, but with a mean of 23.4° in females and 20.0° in males slightly lower than in our study (28.1° in females, 24.4° in males). The authors used the anatomical definition of anteversion as described by Murray (1993) whilst in the present study the radiographic definition was used. In contrast to our results, the study of Sautet et al. (2018) observed no correlation between PI and acetabular orientation which might be caused by a different definition of anteversion used. Veilleux et al. (2020) performed a study on 200 CT scans of uninjured pelves realizing an automated assessment of pelvic and acetabular parameters. Besides PI they calculated also pelvic tilt and sacral slope as pelvic parameters and found a slight correlation between pelvic parameters and acetabular inclination. In contrast to our results, they observed no sex‐related differences in the pelvic parameters.
As a limitation of the present study, it has to be stated that information about individual pathologies or clinical symptoms of the individuals included was not available. Degenerative changes of the pelvis like coxarthrosis were not considered.
In conclusion, the study provides a detailed analysis of the constant pelvic parameters (PI, PI 3D, acetabular anteversion and inclination) performed on 150 individual CT data sets based on a 3D statistical model. The data set including European and Japanese males and females with an age range from 23 to 90 years allowed for subgroup analysis regarding sex, ethnicity and age group. Despite the differences described within the subgroup analysis, we found a statistically significant correlation between PI, PI 3D and acetabular anteversion, as well as between anteversion and inclination. The findings support the process of better understanding of the functional interaction of the spine, pelvis and hip joints.
AUTHOR CONTRIBUTIONS
Charlotte Arand: Corresponding author, study design and concept, data processing, data analysis and interpretation, manuscript. Hansrudi Noser: Data processing, critical revision of the manuscript. Lukas Kamer: Contribution to concept and study design, data acquisition, critical revision of the manuscript, approval of the article. Dominic Gehweiler: Data analysis, critical revision of the manuscript. Kristin Handrich: Contribution to the concept, critical revision of the manuscript. Pol M. Rommens: Initiation of the project, data interpretation, critical revision of the manuscript, approval of the article. Daniel Wagner: Contribution to the concept, critical revision of the manuscript.
ACKNOWLEDGEMENTS
Charlotte Arand received a research fellowship grant from the AO Research Institute Davos, Davos, Switzerland.
Arand, C. , Noser, H. , Kamer, L. , Gehweiler, D. , Handrich, K. & Rommens, P.M. et al. (2022) Is there a correlation between pelvic incidence and orientation of the acetabulum? An analysis based on a three‐dimensional statistical model of the pelvic ring. Journal of Anatomy, 241, 756–764. Available from: 10.1111/joa.13708
DATA AVAILABILITY STATEMENT
The data that support the findings of this study are available from the corresponding author upon reasonable request.
REFERENCES
- Arand, C. , Wagner, D. , Richards, R.G. , Noser, H. , Kamer, L. , Sawaguchi, T. et al. (2019) 3D statistical model of the pelvic ring ‐ a CT‐based statistical evaluation of anatomical variation. Journal of Anatomy, 234(3), 376–383. [DOI] [PMC free article] [PubMed] [Google Scholar]
- Bernstein, J. , Charette, R. , Sloan, M. & Lee, G.C. (2019) Spinal fusion is associated with changes in acetabular orientation and reductions in pelvic mobility. Clinical Orthopaedics and Related Research, 477(2), 324–330. [DOI] [PMC free article] [PubMed] [Google Scholar]
- Boulay, C. , Bollini, G. , Legaye, J. , Tardieu, C. , Prat‐Pradal, D. , Chabrol, B. et al. (2014) Pelvic incidence: a predictive factor for three‐dimensional acetabular orientation‐a preliminary study. Anatomy Research International, 2014, 594650. [DOI] [PMC free article] [PubMed] [Google Scholar]
- Celestre, P.C. , Dimar, J.R., 2nd & Glassman, S.D. (2018) Spinopelvic parameters: lumbar lordosis, pelvic incidence, pelvic tilt, and sacral slope: what does a spine surgeon need to know to plan a lumbar deformity correction? Neurosurgery Clinics of North America, 29(3), 323–329. [DOI] [PubMed] [Google Scholar]
- Eftekhary, N. , Shimmin, A. , Lazennec, J.Y. , Buckland, A. , Schwarzkopf, R. , Dorr, L.D. et al. (2019) A systematic approach to the hip‐spine relationship and its applications to total hip arthroplasty. Bone & Joint Journal, 101‐B(7), 808–816. [DOI] [PubMed] [Google Scholar]
- Eyvazov, K. , Eyvazov, B. , Basar, S. , Nasto, L.A. & Kanatli, U. (2016) Effects of total hip arthroplasty on spinal sagittal alignment and static balance: a prospective study on 28 patients. European Spine Journal, 25(11), 3615–3621. [DOI] [PubMed] [Google Scholar]
- Fader, R.R. , Tao, M.A. , Gaudiani, M.A. , Turk, R , Nwachukwu, B.U. , Esposito, C.I. et al. The role of lumbar lordosis and pelvic sagittal balance in femoroacetabular impingement. Bone & Joint Journal 2018;100‐B(10):1275–9. [DOI] [PubMed] [Google Scholar]
- Hasegawa, K. , Okamoto, M. , Hatsushikano, S. , Shimoda, H. , Ono, M. & Watanabe, K. (2016) Normative values of spino‐pelvic sagittal alignment, balance, age, and health‐related quality of life in a cohort of healthy adult subjects. European Spine Journal, 25(11), 3675–3686. [DOI] [PubMed] [Google Scholar]
- Hayden, A.M. , Hayes, A.M. , Brechbuhler, J.L. , Israel, H. & Place, H.M. (2018) The effect of pelvic motion on spinopelvic parameters. The Spine Journal, 18(1), 173–178. [DOI] [PubMed] [Google Scholar]
- Heckmann, N. , McKnight, B. , Stefl, M. , Trasolini, N.A. , Ike, H. & Dorr, L.D. (2018) Late dislocation following total hip arthroplasty: spinopelvic imbalance as a causative factor. The Journal of Bone and Joint Surgery. American Volume, 100(21), 1845–1853. [DOI] [PubMed] [Google Scholar]
- Le Huec, J.C. & Hasegawa, K. (2016) Normative values for the spine shape parameters using 3D standing analysis from a database of 268 asymptomatic Caucasian and Japanese subjects. European Spine Journal, 25(11), 3630–3637. [DOI] [PubMed] [Google Scholar]
- Legaye, J. , Duval‐Beaupere, G. , Hecquet, J. & Marty, C. (1998) Pelvic incidence: a fundamental pelvic parameter for three‐dimensional regulation of spinal sagittal curves. European Spine Journal, 7(2), 99–103. [DOI] [PMC free article] [PubMed] [Google Scholar]
- Lewinnek, G.E. , Lewis, J.L. , Tarr, R. , Compere, C.L. & Zimmerman, J.R. (1978) Dislocations after total hip‐replacement arthroplasties. The Journal of Bone and Joint Surgery. American Volume, 60(2), 217–220. [PubMed] [Google Scholar]
- Morris, W.Z. , Fowers, C.A. , Yuh, R.T. , Gebhart, J.J. , Salata, M.J. & Liu, R.W. (2016) Decreasing pelvic incidence is associated with greater risk of cam morphology. Bone & Joint Research, 5(9), 387–392. [DOI] [PMC free article] [PubMed] [Google Scholar]
- Murray, D.W. (1993) The definition and measurement of acetabular orientation. Journal of Bone and Joint Surgery. British Volume (London), 75(2), 228–232. [DOI] [PubMed] [Google Scholar]
- Ochi, H. , Baba, T. , Homma, Y. , Matsumoto, M. , Nojiri, H. & Kaneko, K. (2016) Importance of the spinopelvic factors on the pelvic inclination from standing to sitting before total hip arthroplasty. European Spine Journal, 25(11), 3699–3706. [DOI] [PubMed] [Google Scholar]
- Roussouly, P. & Pinheiro‐Franco, J.L. (2011) Biomechanical analysis of the spino‐pelvic organization and adaptation in pathology. European Spine Journal, 20(Suppl 5), 609–618. [DOI] [PMC free article] [PubMed] [Google Scholar]
- Sautet, P. , Giorgi, H. , Chabrand, P. , Tropiano, P. , Argenson, J.N. , Parratte, S. et al. (2018) Is anatomic acetabular orientation related to pelvic morphology? CT analysis of 150 healthy pelvises. Orthopaedics & Traumatology, Surgery & Research, 104(3), 347–351. [DOI] [PubMed] [Google Scholar]
- Veilleux, N.J. , Kalore, N.V. , Vossen, J.A. & Wayne, J.S. (2020) Automatic characterization of pelvic and sacral measures from 200 subjects. The Journal of Bone and Joint Surgery. American Volume, 102(23), e130. [DOI] [PubMed] [Google Scholar]
- Weng, W. , Wu, H. , Wu, M. , Zhu, Y. , Qiu, Y. & Wang, W. (2016) The effect of total hip arthroplasty on sagittal spinal‐pelvic‐leg alignment and low back pain in patients with severe hip osteoarthritis. European Spine Journal, 25(11), 3608–3614. [DOI] [PubMed] [Google Scholar]
- Yoshioka, K. , Murakami, H. , Demura, S. , Kato, S. , Kawashima, H. , Sanada, S. et al. (2019) The large individual differences in the range of hip joint motion rather than lumbar spine motion affect dynamic spinopelvic rhythm. Spine Surgery and Related Research, 3(3), 255–260. [DOI] [PMC free article] [PubMed] [Google Scholar]
Associated Data
This section collects any data citations, data availability statements, or supplementary materials included in this article.
Data Availability Statement
The data that support the findings of this study are available from the corresponding author upon reasonable request.


