

Abstract
The SAE International has published Aerospace Information Report (AIR) 6241 which outlined the design and operation of a standardized measurement system for measuring non-volatile particulate matter (nvPM) mass and number emissions from commercial aircraft engines. Prior to this research, evaluation of this system by various investigators revealed differences in nvPM mass emissions measurement on the order of 15–30% both within a single sampling system and between two systems operating in parallel and measuring nvPM mass emissions from the same source. To investigate this issue, the U. S. Environmental Protection Agency in collaboration with the U. S. Air Force’s Arnold Engineering Development Complex initiated the VAriable Response In Aircraft nvPM Testing (VARIAnT) research program to compare nvPM measurements within and between AIR-compliant sampling systems used for measuring combustion aerosols generated both by a 5201 Mini-CAST soot generator and a J85-GE-5 turbojet engine burning multiple fuels. The VARIAnT research program has conducted four test campaigns to date. The first campaign (VARIAnT 1) compared two essentially identical commercial versions of the sampling system while the second campaign (VARIAnT 2) compared a commercial system to the custom-designed Missouri University of Science and Technology’s North American Reference System (NARS) built to the same specifications. Comparisons of nvPM particle mass (i.e., black carbon), number, and size were conducted in both campaigns. Additionally, the sensitivity to variation in system operational parameters was evaluated in VARIAnT 1. Results from both campaigns revealed agreement of about 12% between the two sampling systems, irrespective of manufacturer, in all aspects except for black carbon determination. The major source of measurement differences (20–70%) was due to low BC mass measurements made by the Artium Technologies LII-300 as compared to the AVL 483 Micro-Soot Sensor, the Aerodyne Cavity Attenuated Phase Shift (CAPS PMSSA) monitor, and the thermal-optical reference method for elemental carbon (EC) determination, which was used as the BC reference.
Keywords: Combustion aerosols, Aerosol sampling systems, Aircraft turbine engines, Black carbon, Elemental carbon, Laboratory generated soot
1. Introduction
The fine particulate matter (PM) emissions from aircraft gas turbine engines can impact local air quality around airports (National Academies of Sciences, 2008a) and contribute to the formation of contrails and contrail-induced cirrus clouds (Lee et al., 2010). Fine particulate matter in the stratosphere also impacts light absorption and scattering (Bond et al., 2013; Schwarz et al., 2006, 2008). The PM emissions at the aircraft turbine engine exit plane consist mainly of nonvolatile PM, i.e., black carbon (BC), trace quantities of metal oxides, metallic wear particles, and similar constituents (National Academies of Sciences, 2008a; Abegglen et al., 2016). Volatile PM emissions from aircraft turbine engines are comprised primarily of sulfur and organic compounds and generally do not form until the exhaust plume has sufficiently diluted and cooled in the atmosphere downstream of the engine (National Academies of Sciences, 2008b; Onasch et al., 2009; Kinsey et al., 2010; Kinsey et al., 2011; Kinsey et al., 2019).
The International Civil Aviation Organization (ICAO) has regulated the emissions from large commercial aircraft gas turbine engines since the 1970s. Included in these regulations was a standard for Smoke Number which only addresses the visible plume. Due to increasing health and environmental concerns, the Smoke Number standard is now considered obsolete and a new emissions standard for PM mass and number is needed. To support the new regulation, in 2007 the ICAO requested that the SAE International E-31 Aircraft Engine Gas and Particulate Emissions Measurement Committee (E-31) develop a method for quantitatively measuring PM emissions. In response to this request, in 2013 SAE E-31 published AIR6241: Procedure for the Continuous Sampling and Measurement of Non-Volatile Particle Emissions from Aircraft Turbine Engines (SAE, 2013). In 2018, SAE E-31 published Aerospace Recommended Practice (ARP) 6320 (SAE, 2018) based on AIR6241. ARP6320 is a refinement of AIR6241. ARP6320 is subsequently referenced in this paper because it is the most recent SAE document that has clarified wording and improved figures.
ARP6320 defines nvPM as those particles present at the aircraft engine exit plane at exhaust temperatures >350 °C and does not include the volatile sulfur and organics formed in the downstream plume. Due to the impracticality1 of PM filter sampling and analysis, the SAE method also specifies the continuous measurement of BC mass as a surrogate for nvPM. The document also specifies the determination of nvPM particle number concentration down to 10 nm in electrical mobility diameter.
Early testing of ARP6320 compliant sampling and measurement systems revealed unresolved differences up to 30% in the nvPM measurements made using multiple instruments within a single sampling system as well as between multiple ARP6320 compliant systems sampling the same engine aerosol (Lobo et al., 2015, 2020). Although the most significant differences were observed in nvPM mass measurements, smaller variations in nvPM number measurements were also observed. Additionally, works by Lobo et al. (2015) and Lobo et al. (2020) did not perform the reference EC mass measurements (e.g., SAE, 2018; Birch and Cary, 1996) in parallel with the nvPM mass instrument measurements and the comparison was performed using the nvPM mass instrument measurement averages, rather than the reference EC mass measurement.
Size distributions of nvPM particles generated by commercial aircraft engines are generally lognormal with geometric mean electrical mobility diameters smaller than 70 nm. Given the small particle size and because the ARP6320 method specifies a long (≈35 m) sampling train, the system has particle losses ranging from 50% to 90% in particle number concentrations and 10%–50% in particle mass concentration (SAE, 2019). Particle size distribution measurements can be used to estimate the size dependent losses in the sampling system.
To further assess variability in measurements for aircraft engine nvPM number and mass emissions, the U. S. Environmental Protection Agency (EPA) Office of Transportation and Air Quality (NVFEL) in Ann Arbor, MI in collaboration with EPA’s National Risk Management Research Laboratory (NRMRL) in Research Triangle Park, NC and the U. S. Air Force’s Arnold Engineering Development Complex (AEDC) at Arnold Air Force Base in Tullahoma, TN, initiated the VAriable Response In Aircraft nvPM Testing (VARIAnT) research program. To date four test campaigns have been conducted. VARIAnT 1, conducted in September 2014, was designed to evaluate inter- and intra-system variability by sampling the same aerosol while changing the sampling system operational parameters within and beyond the allowable ranges set forth in ARP6320 and to investigate the response of the different mass and number instruments. VARIAnT 2, performed in August 2015, was designed to further examine the differences among mass instruments and to confirm model predicted size-dependent system particle losses through direct measurement. This paper describes the results of the VARIAnT 1 and 2 campaigns using two combustion aerosol sources, a General Electric J85-GE-5 (J85) turbojet engine burning multiple fuels and a Jing Model 5201 Mini-CAST burner (Jing, 1999; Jing, n.d.). Results relating to system particle losses and the results of VARIAnT 3 and 4 will be addressed in future publications.
2. Methods
2.1. Test facility, engine, and fuels
The research was conducted at the Propulsion Research Facility located at the University of Tennessee Space Institute and operated by AEDC. The test engine was a well-maintained J85 engine rated at 11 kN (without afterburner) located in Bay No. 1 of the facility as shown in Fig. S-1 of the Supporting Information (SI). Although the J85 uses older turbojet engine combustor technology, the PM emissions from the J85 burning Jet-A fuel are similar to modern commercial aircraft engines, i.e., mass concentrations were as low as ~100 μg/m3 at the engine exit plane. The particle size distributions generated by the J85 had geometric mean electrical mobility diameters ranging from about 10 to 35 nm over a range of operating conditions and fuel types. General specifications of the test engine and normalized thrust values corresponding to the J85 engine power lever angle (PLA) are shown in Tables S-1 and S-2, respectively, of the SI.
Neat (unmixed, pure) Jet-A, neat Camelina, and various blends of Camelina with Jet-A fuel were used in both campaigns. The Camelina fuel was derived from camelina sativa, a low-input nonfood oil seed plant. This type of fuel is manufactured by catalytic hydroprocessing to produce primarily n-paraffins and iso-paraffins, which meets all applicable specifications established by ASTM Standard D7566 for alternative jet fuel (Corporan et al., 2011; ASTM, 2020). Typical properties of these fuels are provided in Table 1.
Table 1.
Typical properties of fuels used in the J85 engine for the VARIAnT 1 and 2 studies.
| Fuel type | VARIAnT 1 (Mass Percent)a | VARIAnT 2 (Mass Percent)a | ||
|---|---|---|---|---|
| Carbon Contentb | Hydrogen Contentc | Carbon Contentb | Hydrogen Contentc | |
| Jet-A | 86.09 | 13.83 | 85.85 | 14.12 |
| Camelina | 84.95 | 15.02 | 85.30 | 14.67 |
| 50% blend | 85.58 | 14.37 | 85.57d | 14.40d |
Campaign average values.
Calculated assuming fuel is composed of only hydrogen, sulfur, and carbon.
Measured by ASTM method D3701.
Calculated based on blend average.
During VARIAnT 1 and 2 the exhaust aerosol from a Jing 5201 Mini-CAST diffusion flame aerosol generator was also utilized to provide a controlled, black carbon aerosol with different characteristics (Durdina et al., 2016; Maricq, 2014) from that produced by the J85 engine. Different propane (C3H8), air, and N2 flows were used in the Mini-CAST burner to vary the particle characteristics for a more comprehensive evaluation of the measurement systems. A description of the Mini-CAST set-up and operating conditions for each campaign is provided in Section 3 of the SI.
2.2. Description of sampling system
Unlike other transportation sources, the high temperature (up to 700 °C) and pressure (close to Mach 1) of the exhaust from aircraft gas turbine engines presents unique challenges for PM emissions sampling. In general, dilution of the exhaust sample (typically 10:1) and long sampling lines are needed to condition and transport the aerosol from the engine exit to the emissions measurement equipment which is normally located in the control room of the test cell. Also, as mentioned above, due to the especially high cost of operating aircraft engines for long periods of time, any type of filter sampling was found to be impractical. For this reason, only real time instruments are used in the ARP6320 sampling system.
The sampling systems used in both campaigns complied with the design specifications and operational requirements of ARP6320. These requirements were adopted and published by ICAO as Annex 16, Volume II, Appendix 7 Instrumentation and measurement techniques for non-volatile particulate matter emissions (ICAO, 2017). A diagram of this system is shown in Fig. 1 and described briefly below. More specific details of the system and its operation can be found in ARP6320.
Fig. 1.

Diagram of ARP6320 sampling and measurement system. Standard conditions are 0 °C and 101.325 Pa.
The sampling and measurement system consists of five sections. In the first section, exhaust from the engine is extracted by a sampling rake consisting of one or more gas sampling probes located near the engine exit. In the second section, the sample passes through a three-way splitter with one line supplying sampled exhaust to the standard ICAO Annex 16, Volume II defined continuous gas analyzer bench (and optional smoke meter), the second leg supplies sampled exhaust to the nvPM sampling system, and the third leg contains a valve used to regulate pressure in the nvPM sampling line. The nvPM sample stream in the second leg then passes through an isolation valve to an ejector diluter (Dekati Model DI-1000 or equivalent) where the aerosol is diluted with HEPA filtered and heated air or nitrogen to achieve dilution factors between 8 and 14 and provide a flow rate of 25 ± 2 standard liters/min (slpm) to the instruments. Excess diluted aerosol is vented to atmosphere. The sample line temperature from the sampling rake exit to the inlet of the diluter is maintained at a minimum of 160 °C.
The diluted aerosol enters the third section which is a 24.5 ± 0.5 m sampling line constructed of conductive, carbon-loaded PTFE heated uniformly to 60 ± 15 °C. As the diluted sample enters the fourth section, it passes through a cyclone separator to remove particles ≳ 1 μm in aerodynamic diameter (i.e., the 50% cut-point of the cyclone), which may have been dislodged from the sampling system upstream. Upon exiting the cyclone, a three-way splitter distributes sample to the instruments in the fifth section of the system. Typically, this section consists of a single black carbon (BC) instrument on one line to measure nvPM mass concentration, an oxidation catalyst-based volatile particle remover (VPR) (e.g., Abdul-Khalek and Kittelson, 1995) and condensation particle counter (CPC) on the second line to measure the particle number concentration with diameters > 10 nm (SAE, 2018), and a sample flow make-up line connected to a mass flow controller, a non-dispersive infrared (NDIR) analyzer measuring CO2, and a vacuum pump. Additional dilution (ranging from about 70:1 to 700:1) occurs before and after the VPR to keep the CPC in single count mode. By means of the vacuum pump and mass flow controller, the third line of the splitter provides the additional flow necessary to maintain the constant 25 ± 2 slpm flow of diluted aerosol through Section 3 and 4 as specified in ARP6320.
At the time of VARIAnT 1 and 2, two BC analyzer types were qualified to make compliant nvPM mass measurements: the AVL Model 483 Micro Soot Sensor (Schindler et al., 2004) and the Artium Model LII-300 laser induced incandescence analyzer (Bachalo et al., 2002; Michelsen et al., 2015). A third BC instrument, the Aerodyne CAPS PMSSA Monitor (Onasch et al., 2015), was also evaluated during VARIAnT 2. For particle number, an AVL Particle Counter (APC) Aviation was employed in all sampling systems as was a Dekati DI-1000 as the primary diluter.
In the VARIAnT 1 and 2 test campaigns, two ARP6320-compliant sampling systems were used to simultaneously sample the exhaust aerosol from either the Mini-CAST burner or the J85 turbojet engine. In VARIAnT 1 two essentially identical, compliant systems manufactured by AVL (Graz, Austria) (AVL, n.d.) were compared. One system was owned by AEDC and the other system was on loan from Pratt Whitney (PW). In the VARIAnT 2 campaign AEDC’s AVL system and the North American Reference System (NARS) (Lobo et al., 2015, 2016) developed by Missouri University of Science and Technology (MST) in Rolla, MO were compared.
2.3. Equipment layout and instrumentation
During testing, each sampling system was connected to a non-heated probe located at the centerline of the J85 exhaust nozzle. During VARIAnT 1, the probes were mounted side by side in a small rake (Fig. S-2 of the SI) with one probe dedicated to each of the two sampling systems. A third probe was used to supply undiluted raw sample to the AEDC gas analyzers. During VARIAnT 2 testing, a fourth probe was added to provide sample to a separate near-source sampling system (Figs. S-1, S-3, S-7, and S-9 of the SI), which was located adjacent to Bay 1 between the control room and the test bay building. Probe switching experiments were conducted to assure that an equivalent sample was supplied to all measurement systems regardless of probe position as discussed in the SI Section 6.1.
In conjunction with the standard equipment supplied with each of the two ARP6320 compliant sampling systems, additional PM analyzers were connected to the make-up flow line of each sampling system. These analyzers were connected through one or more flow splitters depending on the specific configuration used during testing. The specific analyzer location was varied from test to test depending on the individual experiment being conducted. Further details on the system configurations used during each campaign are listed in Table S-4 of the SI.
As discussed above, a separate near source sampling and measurement system was also employed during VARIAnT 2 to obtain data on the characteristics of near-source particles and to characterize particle losses in the 25 m heated line. This system, shown in Fig. S-9 of the SI, was comprised of equipment to collect and condition a raw gas sample with appropriate measurements conducted with instruments downstream.
A variety of different particle analyzers and filter samplers were used to determine the characteristics of the aerosol sample provided by the two compliant systems as well as the near source sampling system used in VARIAnT 2. These instruments are described in Table 2.
Table 2.
Specifications of measurement equipment during VARIAnT 1 and 2.
| Measured Parameter (s) | Principle of Operation | Instrument Make/Model | Campaigna | |
|---|---|---|---|---|
| V1 | V2 | |||
| Black carbon mass concentration | Optical light absorption (photoacoustic soot sensing) | AVL Model 483 Micro Soot Sensor (MSS)b | X | X |
| Optical light absorption (laser-induced incandescence) | Artium Technologies LII-300c | X | X | |
| Optical light extinction and scattering (cavity attenuated phase shift spectroscopy) | Aerodyne CAPS PMssAd | X | ||
| Organic and elemental carbon (OCEC) | Thermal-optical transmittance (ToT) | Sunset Model 3 (AEDC) and Model 4 Semi-Continuous OCEC Analyzers (PW or MST) | X | X |
| Filter sampling + thermal-optical transmittance (ToT) | Multifilter Sampler w/25-mm quartz filters + Sunset Laboratory Model 4L OCEC Analyzere,f | X | X | |
| Particle number concentration | Catalytic stripper + condensation particle counting | AVL Particle Counter (APC) Aviation | X | X |
| Particle size distribution | Differential mobility analysis + condensation particle counting | TSI Model 3936 Scanning Mobility Particle Sizer (Model 3081 [long] differential mobility analyzer + Model 3025a condensation particle counter) | X | X |
| TSI Model 3936 Scanning Mobility Particle Sizer (Model 3081 [long] differential mobility analyzer + Model 3776 condensation particle counter) | X | X | ||
| TSI Model 3938 Scanning Mobility Particle Sizer (Model 3081 [long] differential mobility analyzer + Model 3776 condensation particle counter) | X | |||
| TSI Model 3936 Scanning Mobility Particle Sizer (Model 3085 [nano] differential mobility analyzer + Model 3025a condensation particle counter)g | X | |||
| TSI Model 3936 Scanning Mobility Particle Sizer (Model 3085 [nano] differential mobility analyzer + Model 3776 condensation particle counter)g | X | |||
| Particle mass distribution | An electric field and rotating flow are used to maintain particles of a particular mass in a helical path to determine particle mass distribution | Combustion Centrifugal Particle Mass Analyzer (CPMA)g | X | |
| Particle chemical characteristics | Size-resolved non-refractory particle mass spectrometry | Aerodyne Aerosol Mass Spectrometerg | X | |
| SAE Smoke Number | Visible light reflectance from a loaded filter | AEDC Smoke Meter (SAE ARP1179 specifications) | X | |
| Carbon dioxide in diluted sample | Nondispersive infrared (NDIR) analysis (sampling system) | ABB EL3020 | X | X |
| LiCor 840A | X | |||
| Nondispersive infrared (NDIR) analysis (near-source) | CAI 601 | X | ||
| Carbon dioxide | Fourier transform infrared spectroscopy | MKS 2030 FTIR MultiGas Analyzer | X | X |
| Carbon monoxide | Fourier transform infrared spectroscopy | MKS 2030 FTIR MultiGas Analyzer | X | X |
| Total hydrocarbons | Flame ionization detector | CAI 300 HFID Hydrocarbon Analyzer | X | X |
| Nitrogen oxides | Fourier transform infrared spectroscopy | MKS 2030 FTIR MultiGas Analyzer | X | X |
V1 = VARIAnT 1 campaign; V2 = VARIAnT 2 campaign. An X indicates use in that campaign and a blank indicates the instrument was not used.
The laser wavelength used in the MSS is 808 nm.
The laser wavelength used in the LII is 1064 nm.
Two CAPS PMSSA instruments were used, one operating at a wavelength of 660 nm and the other at a wavelength of 630 nm with mass absorption coefficients (MACs) of 6.3 m2/g and 6.6 m2/g, respectively. The CAPS PMSSA measures extinction and scattering coefficients and derives the absorption coefficient from the difference. Black carbon (BC) mass concentrations (μg/m3) are obtained by dividing the absorption coefficients (Mm−1) by the wavelength-dependent MAC (m2/g).
Note that a single 47-mm quartz filter was used in the near source sampling system during VARIAnT 2.
This Model 4L method of EC mass determination is the EC mass measurement reference method used in this work.
No data from these instruments reported here.
2.4. Calibrations and test procedures
2.4.1. Real time mass instrument calibrations
Prior to each sampling campaign, detailed multi-point calibrations were performed in Ottawa at the National Research Council-Canada (NRC) on all the instruments listed for real-time measurements of black carbon mass, except for the CAPS . An inverted flame burner (Coderre et al., 2011) was used as the source of black carbon aerosol and thermal optical analysis of PM samples collected on quartz filters was used to determine elemental/organic carbon (EC/OC) concentrations. The calibrations were performed in accordance with the protocol outlined in SAE ARP6320.
All the VARIAnT 1 test campaign mass instrument calibrations were performed at NRC at the same time and no calibration inconsistencies were observed. However, the VARIAnT 2 campaign instruments were calibrated in two different batches, Batch A and Batch B. The Batch A and Batch B instrument calibration factors differed substantially from one another (e.g., Table S-5 of the SI). To address concerns with the VARIAnT 2 calibrations, instrument comparison (IC) tests were performed before, IC-1, and after, IC-2, the main test program. The results of the post-test evaluation (Test IC-2) were used to adjust the calibration factors for the BC mass instruments as discussed in the SI. These adjusted calibration factors were applied to all data collected during the VARIAnT 2 campaign. Additional details of the VARIAnT 2 calibration can be found in Section 6 of the SI.
2.4.2. EC mass reference method OCEC analyzers
Using a standard sucrose solution (C12H22O11 plus distilled water) prior to the start of each experimental program, calibrations were performed for both semi-continuous OCEC analyzers (Sunset Laboratory, Inc., n.d.) listed in Table 2. Sucrose checks were also conducted during testing for quality control purposes. For the laboratory OCEC analyzer (Sunset Laboratory, Inc., n.d.), calibration checks of the instrument were conducted each day. These checks consisted of multi-point tests using a range of sucrose loadings, as well as running filter blanks. Both types of OCEC analyzers used the same operating parameter (NIOSH870.par) file supplied by Sunset Laboratories. Prior to each campaign, all quartz filters were pre-baked at a temperature of 550 °C for at least 12 h and stored in a laboratory freezer at a nominal temperature of − 50 °C. All filters were stored in a portable freezer at a nominal temperature of − 20 °C prior to sampling and analysis including transport to the test site in the EPA vehicle.
Quartz filter loadings were based on a survey of the sample mass concentration read from the real-time BC mass instruments for a given test condition, the Sunset labs semi-continuous instrument sample flow rate (2 lpm), and the quartz filter area (1.08 cm2). The semi-continuous instrument filter loadings were targeted for about 6 μg/cm.2 Actual EC mass filter loadings ranged 2–6 μg/cm.2 EC mass filter loadings for the Sunset laboratory instrument ranged from 1.1 to 6 μg/cm2 (2.84 cm2 filter deposition area). These filter loadings are well within the specified range for Sunset labs OCEC instrument types.
2.4.3. Electrical mobility analyzers
Prior to VARIAnT 2, a pre-test evaluation of SMPSs to verify manufacturer specified operation was performed by the University of Minnesota. These evaluations included both operational and performance testing using a reference oil aerosol of dioctyl sebacate (DOS) diluted in isopropyl alcohol, silver aggregates generated by a tube furnace, and a diesel aerosol from a John Deere 4045 engine. During VARIAnT 2, daily SMPS consistency checks were run using a DOS aerosol. On site at AEDC at the end of the campaign a final consistency test was conducted of all SMPSs using a DOS aerosol. Concentrations ranged from 7.8 × 10⁴ to 5.1 × 10⁵ particles/cm3 and GMDs from 37 to 39 nm. These checks showed agreement within about 5% for number concentrations and about 2 nm for GMDs.
2.4.4. Particle number analyzers
Calibrations of the AVL 489 APCs were conducted (e.g., SAE 2018) by the manufacturer within 1 year of each campaign.
2.4.5. General operating and quality control procedures
All tests conducted followed consistent, rigorous instrument manufacturer operating procedures and SAE recommended practices to ensure proper operation of all instruments and sampling systems. In addition, to assure proper operation of the measurement equipment, a daily checklist was prepared and used as part of the instrument and measurement system start-up and shut-down procedures. Daily quality control (QC) procedures included the zero and span of the gas analyzers using NIST traceable gas concentrations before and after each day of sampling as well as the various operational checks of the BC mass instruments (especially the MSSs and LIIs). OCEC analyzer standard sucrose solution checks were performed in addition to daily QC procedures including the collection of blank filters and method blank filters (internal filter with no actual sample collected). Before and after each test, zero and ambient air background checks (for nvPM mass concentration, nvPM particle concentration, and CO2 concentration) were also performed on the ARP6320 compliant measurement systems.
2.5. Experimental test matrix
A total of 17 tests (7 with a Mini-CAST burner and 10 with the J85 turbojet engine) were conducted during VARIAnT 1 while 10 tests (5 with a Mini-CAST burner and 5 with the J85) were conducted in VARIAnT 2. Each test series was comprised of individual test points at a specific steady-state engine power or Mini-CAST settings, fuel type, operating period, and sampling system configuration. Table 3 provides the test matrix, including the test ID, test date, aerosol source tested, and run conditions for each test conducted, for both test campaigns. Additional information on the testing performed is provided in the SI.
Table 3.
Experimental test matrix for VARIAnT 1 and 2.
| Test Campaign | Test ID | Date | Source Tested | Run Conditionsa |
|---|---|---|---|---|
| VARIAnT 1 | CAST 1 | 09/04/14 | Mini-CAST | Shake down |
| CAST 2 | 09/05/14 | Mini-CAST | Probe switching | |
| CAST 3 | 09/05/14 | Mini-CAST | Probe switching | |
| CAST 4 | 09/05/14 | Mini-CAST | Probe switching | |
| CAST 5 | 09/06/14 | Mini-CAST | Calibration of semi-continuous OCEC | |
| CAST 6 | 09/06/14 | Mini-CAST | Calibration of semi-continuous OCEC | |
| CAST 7 | 09/07/14 | Mini-CAST | Varying sampling system operating parameters | |
| Engine 1 | 09/08/14 | J85 w/Jet-A | Probe switching at 15, 40, 60, 80, and 90 PLA | |
| Engine 2 | 09/09/14 | J85 w/Jet-A | Baseline sampling at 15, 40, 60, and 80 PLA | |
| Engine 3 | 09/10/14 | J85 w/100% Camelina | Baseline sampling at 50 and 90 PLA | |
| Engine 4 | 09/12/14 | J85 w/Jet-A | Varying diluent at 15, 50, and 90 PLA | |
| Engine 5 | 09/13/14 | J85 w/Jet-A | Varying sampling system operating parameters at 15, 60, and 90 PLA | |
| Engine 6 | 09/14/14 | J85 w/Jet-A | Varying sampling system operating parameters at 15, 40, and 90 PLA | |
| Engine 7 | 09/15/14 | J85 w/91% Camelina blend | Baseline sampling at 45 and 90 PLA | |
| Engine 8 | 09/15/14 | J85 w/50% Camelina blend | Varying sampling system operating parameters at 90 PLA | |
| Engine 9 | 09/16/14 | J85 w/50% Camelina blend | Varying sampling system operating parameters at 90 PLA | |
| Engine 10 | 09/16/14 | J85 w/50% Camelina blend | Single probe w/2-way splitter providing sample to the two systems at 15, 60, and 90 PLA | |
| CAST 8 | 09/17/14 | Mini-CAST | Different CAST settings | |
| VARIAnT 2 | IC1 | 08/21/15 | Mini-CAST | Instrument comparison of PM instruments on same source with multiple CAST settings |
| C2 | 08/23/15 | Mini-CAST | Probe and line switching with multiple CAST settings | |
| C3 | 08/24/15 | Mini-CAST | Comparison to EC reference method at various concentrations | |
| C4 | 08/24/15 | Mini-CAST | Intra-system instrument comparison at different concentrations | |
| E1 | 08/25/15 | J85 w/Jet-A | Probe switching by rake movement at 15, 60, and 90 PLA | |
| E2 | 08/26/15 | J85 w/Jet-A | Comparison to EC reference method at 15, 60, and 90 PLA | |
| E3 | 08/29/15 | J85 w/50% Camelina blend | Intra-system instrument comparison at 15, 60, and 90 PLA plus probe switching at 15, 20, 30, 40, 50, 60, 70, 80, and 90 PLA | |
| E4 | 08/27/15 | J85 w/50% Camelina blend and J85 w/Jet-A | Intra-system instrument comparison at 15, 60, and 90 PLA using Camelina blend plus intra-system instrument comparison at 90 PLA using Jet-A | |
| E5 | 08/28/15 | J85 w/Jet-A | Comparison to EC reference method at 15, 60, and 90 PLA | |
| IC2 | 08/30/15 | Mini-CAST | Instrument comparison of PM instruments on same source (used to adjust BC instrument calibration constants) | |
| C6 | 08/30/15 | Mini-CAST | Comparison to EC reference method at various concentrations |
2.6. Sample and data analyses3
As specified in ARP 6320, the EC mass concentration from quartz filter sample collection was used as the mass reference and determined by dividing the net mass collected on the filter by the total volume of sample gas passing through the filter during each test point. The net EC mass was calculated by subtracting the average EC mass on blank filters routinely collected during each campaign. EC Emission Indices (EIs; EC mass/mass of fuel burned) were then calculated from these data as outlined in ARP6320. The OC data from the OCEC thermal analysis are not reported here.
Analysis of the reference method manual OCEC filters was conducted daily on-site using the thermal-optical transmittance method (Birch and Cary, 1996). This procedure allowed for a continual evaluation of the instrumental data collected as well as the identification of any potential measurement issues. Test point averages from the BC analyzers used in both sampling systems during each campaign were compared to the corresponding reference method manual and semi-continuous EC mass values for both the Mini-CAST burner and J85 turbojet aerosol sources.
All continuous analyzers provided 1-Hz data, which was compiled and stored as individual data files for each instrument. For each test point the average EI (mass/mass of fuel burned for the nvPM mass instruments or number/mass of fuel burned for the nvPM number instruments) values were calculated for each instrument. Each EI was calculated using the pollutant concentration found in the sample stream, the associated average CO2 concentration, and the hydrogen to carbon ratio (H/C) of the fuel according to the method published in ARP6320. The daily summaries along with results of the OCEC analyses were then used as input to compile the data for comparisons and additional data analyses.
SMPS scans for particle size and number concentration were recorded continuously at one scan every 3 min. All scans over a single test point were averaged to provide an average size distribution from which the geometric mean diameter (GMD or Dg), geometric standard deviation (GSD or σg) and total concentration were calculated. Data was post processed in TSI Aerosol Instrument Manager (AIM) software version 10.2 to incorporate the updated corrections for diffusional losses. The SMPSs in VARIAnT 1 operated with a sheath flow and aerosol flow rates of 10 lpm and 1 lpm, respectively, compared to 15 lpm and 1.5 lpm, respectively, for VARIAnT 2. These TSI SMPS 3081 settings gave sizing ranges from 8 to 284 nm and 6–212 nm for VARIAnT 1 and VARIAnT 2, respectively. The data from the nano DMA column (TSI 3085) were not used because of instrument timing inconsistencies.
3. Results and discussion
3.1. Probe switching & sampling system parameter variations
During each campaign, probe switching experiments were conducted to compare the response of the instrument and sampling system by changing the probes between the sampling systems. VARIAnT 1 probe switching experiments consisted of changing the connection between the inlet probe and sampling system between 2 consecutive points at the same PLA. This was repeated over a range of engine PLAs. VARIAnT 2 probe switching experiments consisted of moving the probes in and out of the center line of the engine exit plane. Both campaigns showed agreement within 3% for the APC number concentration and 6% for the MSS & LII mass concentration. Additional details of the probe switching experiments performed in VARIAnT 1 are in section 6.1 of the SI.
The sampling system operational parameters were changed within and outside those specified in ARP6320. Variation of operational parameters did not seem to produce the large differences (up to 30%) previously observed for mass measurements. There are some extreme values of operational parameters that appear to affect the mass and number measurements. However, this variability largely shows up as random measurement errors. The variability associated with the operational parameters is detailed in sections 6.1 to 6.7 of the SI.
3.2. Total nvPM number
Comparison of the total nvPM particle number EIs determined by the AVL 489 APC in each sampling system for both aerosol source types during the two campaigns is provided in Fig. 2 panels A and B. The EIs are used here to normalize the data based on the CO2 concentration because each sampling system can have different dilution factors for any given test point. Also shown are the results of simple linear regressions including an intercept of the data as well as the 1:1 idealized agreement line (dashed line).
Fig. 2. Intersystem comparison of number and mass EI.

Panels A and B show the VARIAnT 1 and VARIAnT 2 comparisons of APC measurements of nvPM particle number EIs between sampling systems for all conditions and operational parameter variations. Panels C and D show the VARIAnT 1 and VARIAnT 2 comparisons of MSS mass EIs between sampling systems for all conditions and operational parameter variations. Also shown are linear regressions of the data (solid line) and a 1:1 line (dashed line). Fit parameters are listed in Tables 4 and 5.
Table 4 lists some of the regression statistics for linear fits of the total particle number data in Fig. 2. The slopes of the lines indicate the two sampling system measurements of total particle number EIs tested for all conditions and operational parameter variations agreed to within 11% for VARIAnT 1 CAST, VARIAnT 1 J85, and VARIAnT 2 J85. An exception to this observation is the Mini-CAST data during VARIAnT 2 when most of the Mini-CAST data were collected during the first three days of the campaign and the response of the two sampling systems differed from each other. The difference was not specific, rather it held true for mass, number, and size measurements (e.g., green highlighted data points in Fig. 2 panels B and D). After the first three days, the two systems agreed well with each other as shown by J85 and CAST measurements in the data not highlighted in Fig. 2 and Fig. S-17 in the SI. This difference between the systems was observed during the first three days of the VARIAnT 2 CAST tests, but not on the final day of VARIAnT 2 CAST tests as discussed in section 7 the SI.
Table 4. Intersystem comparison of number EI.
Linear fit results for AEDC APC nvPM number EIs vs. the APC nvPM number EIs in the second sampling system as shown in Panels A and B of Fig. 2. All squared correlation coefficient (r2) values are > 0.96.
| Y-axis Sampling System (APC)a | VARIAnT Campaign | Source | Slope | Slope Standard Error | Intercept (particles/kg fuel) | Intercept Standard Error (particles/kg fuel) |
|---|---|---|---|---|---|---|
| PW | 1 | J85 | 1.11 | 0.01 | 9.8E+12 | 1.9E+13 |
| PW | 1 | CAST | 0.95 | 0.02 | 3.3E+13 | 9.3E+12 |
| MST | 2 | J85 | 1.00 | 0.03 | 2.5E+12 | 3.3E+13 |
| MST | 2 | CAST | 0.74 | 0.04 | 4.2E+12 | 1.2E+13 |
PW = Pratt Whitney; MST = Missouri University of Science and Technology.
3.3. Black carbon mass
Similar to total particle number EI analysis, intersystem comparisons were made between BC mass instruments. Additionally, intra-system comparisons were made between the BC mass instruments and the associated EC reference method EIs calculated from the manual OCEC filter samples.
The intersystem comparison is shown for MSS measurements for both aerosol source types during the two campaigns in Fig. 2 panels C and D with regression statistics in Table 5. The data and simple linear regressions including an intercept of the data as well as the 1:1 idealized agreement line (dashed line) show results consistent with the number measurement comparisons. The VARIAnT 1 Mini-CAST, VARIAnT 1 and 2 J85 measurements show that the two sampling systems agree within 5%. The VARIAnT 2 Mini-CAST nvPM emissions system-to-system comparative measurements are also displayed in Fig. 2C and D and the fit statistics are also listed in Table 5. Although the EC reference method mass measurement system inter-comparisons are not graphed here, the linear fit statistics for those measurements are listed in Table 6 and are consistent with the MSS comparisons, but, are limited by the measurement statistics; not all test points included EC reference method measurements.
Table 5. Intersystem comparison of MSS mass EI.
Linear fit results for AEDC MSS mass EIs vs. the MSS mass EIs from the second sampling system as shown in Fig. 2 panels C and D; all r2 values are greater than 0.96.
| Y-axis Sampling System (MSS) | VARIAnT Campaign | Source | Slope | Slope Standard Error | Intercept (mg/kg fuel) | Intercept Standard Error (mg/kg fuel) |
|---|---|---|---|---|---|---|
| PW | 1 | J85 | 1.04 | 0.01 | −1.2 | 0.5 |
| PW | 1 | CAST | 1 | 0.02 | 0.05 | 1.5 |
| MST | 2 | J85 | 0.95 | 0.01 | −0.34 | 0.38 |
| MST | 2 | CAST | 0.81 | 0.02 | 0.12 | 5.18 |
Table 6. Intersystem comparison of reference method mass EIs.
Linear fit results for the AEDC sampling system EC reference method mass EI measurements on the X-axis and the reference method mass EI measurements from the PW (VARIAnT 1) or the MST (VARIAnT 2) sampling system on the Y-axis; all r2 values are greater than 0.98. The degrees of freedom for these fits were included to indicate the limited statistics for these data.
| Y-axis Sampling System (EC reference method) | VARIAnT Campaign | Source | Slope | Slope Standard Error | Intercept (mg/kg fuel) | Intercept Standard Error (mg/kg fuel) | Degrees of Freedom |
|---|---|---|---|---|---|---|---|
| PW | 1 | J85 | 1.10 | 0.04 | −0.56 | 1.37 | 3 |
| PW | 1 | CAST | 1.02 | 0.04 | 0.4 | 2.43 | 5 |
| PW | 1 | J85 and CAST | 1.03 | 0.03 | 0.45 | 1.4 | 10 |
| MST | 2 | J85 | 1.00 | 0.08 | 0.45 | 2.69 | 4 |
| MST | 2 | CAST | 0.83 | 0.09 | 27.4 | 33.6 | 2 |
| MST | 2 | J85 and CAST | 0.88 | 0.03 | 7.7 | 7.8 | 8 |
Intra-system comparisons were made between the BC mass instruments and the associated EC reference method EIs calculated from the manual filter samples. These comparisons are shown in Figs. 3–5 for the MSS, LII-300, and CAPS PMSSA instruments, respectively. Each data point represents the test point average EI for a specific BC mass instrument and the corresponding EC reference method result determined over the duration of a single test point. The linear regression statistics for these plots are listed in Table 7.
Fig. 3. Intra-system comparison of MSS mass EI to the reference method mass EI.

Comparison of MSS EI measurements to the reference method EI measurements within a single sampling system broken down by source, sampling system, and test campaign. Also shown are linear regressions of the data (solid lines) compared to a 1:1 line (dashed). The linear fit results are listed in Table 7.
Fig. 5. Intra-system comparison of CAPS PMSSA mass EI to reference method mass EI.

Comparison of CAPS PMSSA EI mass measurements to the reference method EI mass measurements broken down by source and sampling system during VARIAnT 2. Note that the instruments used in the AEDC and MST systems operated at wavelengths of 660 nm (MAC of 6.3 g/m2) and 630 nm (MAC of 6.6 g/m2), respectively. Also shown are linear regressions of the data (solid lines) compared to a 1:1 line (dashed). The linear fit results are listed in Table 7. [Fig. S-19 in the SI also illustrates the measured single scattering albedo (ratio of the measured scattering to extinction coefficients) versus J85 engine PLA.].
Table 7. Intra-system comparison of mass instrument mass EI to reference method mass EI.
| Y-axis Instrument | Sampling System | VARIAnT Campaign | Source | Slope | Slope Standard Error | Intercept (mg/kg fuel) | Intercept Standard Error (mg/kg fuel) |
|---|---|---|---|---|---|---|---|
| MSS | AEDC | 1 | CAST | 1.02 | 0.08 | −2.3 | 5.3 |
| MSS | AEDC | 1 | J85 | 1.00 | 0.03 | −0.6 | 1.0 |
| MSS | PW | 1 | CAST | 1.01 | 0.04 | −2.8 | 2.3 |
| MSS | PW | 1 | J85 | 0.99 | 0.02 | −0.6 | 0.7 |
| LII | AEDC | 1 | CAST | 0.89 | 0.21 | −9.9 | 13 |
| LII | AEDC | 1 | J85 | 0.55 | 0.02 | −1.6 | 0.5 |
| LII | PW | 1 | CAST | 0.93 | 0.05 | −9.1 | 3.6 |
| LII | PW | 1 | J85 | 0.66 | 0.01 | −0.9 | 0.2 |
| MSS | AEDC | 2 | CAST | 1.18 | 0.01 | −3.0 | 37 |
| MSS | AEDC | 2 | J85 | 0.94 | 0.03 | 0.1 | 1.2 |
| MSS | MST | 2 | CAST | 1.09 | 0.04 | −12 | 13 |
| MSS | MST | 2 | J85 | 0.86 | 0.05 | 0.6 | 1.8 |
| LII | AEDC | 2 | CAST | 1.18 | 0.07 | −16 | 23 |
| LII | AEDC | 2 | J85 | 0.71 | 0.04 | −0.8 | 1.4 |
| LII | MST | 2 | CAST | 1.04 | 0.04 | −3.7 | 11 |
| LII | MST | 2 | J85 | 0.71 | 0.03 | 0.0 | 1.1 |
| CAPS | AEDC | 2 | J85 | 1.12 | 0.06 | −0.7 | 1.9 |
| CAPS | MST | 2 | J85 | 0.94 | 0.05 | 0.7 | 1.9 |
As shown in Fig. 3, the MSS EIs in both campaigns across all sources regardless of sampling system or instrument calibration type agreed with the EC reference method to within 18% (this includes the first three days of VARIAnT 2 data) of a 1:1 correlation. In contrast to the MSS results, the LII-300s (Fig. 4) showed significantly lower responses (up to 45% lower) as compared to the reference EC method. This was true regardless of sampling system, except for tests with the Mini-CAST burner during VARIAnT 2. In the case of the VARIAnT 2 Mini-CAST tests, the two LIIs agreed within 18% of the EC reference method values. Recall the VARIAnT 1 data depend on the pre-test ARP6320-compliant calibration using an inverted flame burner source while the VARIAnT 2 results depend on the post-test IC-2 instrument inter-comparison which relied on a Mini-CAST source.
Fig. 4. Intra-system comparison of LII-300 mass EI to reference method mass EI.

Comparison of LII-300 EI measurements to the reference method EI measurements broken down by source, sampling system, and test campaign. Also shown are linear regressions of the data (solid lines) compared to a 1:1 line (dashed). The linear fit results are listed in Table 7.
The VARIAnT 2 CAPS PMSSA instrument comparisons are shown in Fig. 5. Two CAPS PMSSA instruments used in the AEDC and MST sampling systems operated at wavelengths of 660 nm and 630 nm, respectively. Data from both CAPS PMSSA instruments agree within 12% with the reference method EC measurements for the J-85, regardless of sampling system. The CAPS PMSSA instruments were alternated on the sample line with the reference method OCEC filters for the CAST measurements, such that CAPS PMSSA measurements were obtained for CAST sources, but not simultaneously with the reference method OCEC measurements. Thus, the CAPS PMSSA results for the J-85 are directly compared with the reference EC method, but the CAPS PMSSA results for the CAST are only compared relative to the MSS and LII-300. In addition to providing a measure of BC mass concentration, CAPS PMSSA monitors also provide a measured ratio of scattered light to total light extinction, the single scattering albedo (SSA). The SSA is a function of the chemical composition, shape, and size of the sampled particles. VARIAnT 2 SSA results show an increasing SSA with decreasing engine power as discussed in Section 9 of the SI, suggesting a change in these nvPM particle properties with engine power. These issues were investigated further in later VARIAnT studies.
In an effort to further highlight instrument-to-instrument differences within the same system, the LII-300 and CAPS PMSSA mass EIs were compared directly to the MSS EIs as depicted in Fig. 6 and Table 8. Fig. 6 shows that the LIIs consistently measured 12% to 45% lower than the MSS over all sources except for the Mini-CAST aerosol source which was used as a calibration source in VARIAnT 2. A similar lack of agreement was reported by Durdina et al. (2016), which varied particle size, morphology, and EC to total carbon mass ratios of the soot produced by Mini-CAST aerosol sources. In contrast, the CAPS PMSSA to MSS comparison was much closer, i.e., 8%–18% higher (see Table 8) regardless of soot source type. Increased variation at low nvPM mass emission levels may be explained by significant differences in instrument uncertainty at or near their limits of detection (LOD or 1 μg/m3). However, these systematic differences could reflect variable instrument response due to some physical aspect of nvPM at low concentrations. Since newer engines are expected to produce much lower nvPM mass emissions, the nature of this variation merits further investigation.
Fig. 6. Intra-system comparison of CAPS PMSSA mass EIs and LII mass EIs to MSS mass EIs.

CAPS PMSSA (top row) and LII-300 (middle and bottom row) EIs compared to MSS EIs for each sampling system. The CAPS PMSSA response is in general agreement with the MSS whereas the LII-300 response is significantly lower than the MSS except for the VARIAnT 2 CAST source (lower left panel). Note that the LII-300 to MSS mass EI linear comparisons apply only to EIs greater than 2 mg/kg fuel. For EI values below this value, the response between the two instruments was not linear. Also shown are linear regressions of the data (solid lines) compared to a 1:1 line (dashed). The fit parameters are listed in Table 8.
Table 8. Intra-system comparison of CAPS PMSSA mass EIs and LII-300 mass EIs to MSS mass EIs.
Linear fit results with MSS EIs on the X-axis for Fig. 6; all r2 values are greater than 0.98.
| Y-axis instrument | Sampling System | VARIAnT Campaign | Source | Slope | Slope Standard Error | Intercept (mg/kg fuel) | Intercept Standard Error (mg/kg fuel) |
|---|---|---|---|---|---|---|---|
| LII | AEDC | 1 | CAST | 0.81 | 5.00E-02 | −8.2 | 3.1 |
| LII | AEDC | 1 | J85 | 0.56 | 5.00E-03 | −1.4 | 0.3 |
| LII | PW | 1 | CAST | 0.88 | 3.00E-02 | −4.7 | 2.1 |
| LII | PW | 1 | J85 | 0.65 | 2.00E-03 | −0.5 | 0.1 |
| CAPS | AEDC | 2 | CAST | 1.08 | 7.00E-03 | −1.2 | 1.2 |
| CAPS | AEDC | 2 | J85 | 1.18 | 4.00E-03 | −0.4 | 0.1 |
| CAPS | MST | 2 | CAST | 1.12 | 3.00E-03 | 0.2 | 0.5 |
| CAPS | MST | 2 | J85 | 1.09 | 7.00E-03 | −0.1 | 0.2 |
| LII | AEDC | 2 | CAST | 1.00 | 2.00E-02 | −17 | 6.2 |
| LII | AEDC | 2 | J85 | 0.74 | 9.00E-03 | −0.6 | 0.3 |
| LII | MST | 2 | CAST | 0.96 | 8.00E-03 | 4.0 | 1.8 |
| LII | MST | 2 | J85 | 0.78 | 1.00E-02 | 0.3 | 0.3 |
In summary, the MSS and CAPS PMSSA measurements agreed to within 18% of the reference EC method as well as with each other making both well suited for measuring nvPM mass in aircraft engine exhaust. In contrast, the LII-300 consistently demonstrated a significantly lower (up to 45%) response with respect to the EC mass reference method as well as the MSS and CAPS PMSSA. The LII-300 response may indicate a dependency on the nature of the carbonaceous aerosol calibration source. In response to these results, the LII-300 manufacturer (Artium Technologies) has modified the instrument, which was evaluated in two subsequent VARIAnT test campaigns, and will be discussed in a follow-on paper.
3.4. Particle sizing
Several SMPSs were utilized to determine particle size distributions in aerosols sampled by each compliant sampling system over both test campaigns. The specific placement of these instruments within each system is provided in Table S-4 of the SI. The data from these instruments were used to obtain test point average particle size distributions (PSDs) at different sampling system locations for each test conducted. Typical PSDs (not corrected for diffusional particle losses in the sampling system) measured with the AEDC SMPS for the two aerosol sources evaluated in each campaign are shown in Fig. 7. The J85 engine source PSDs are shown for the engine operating on Jet-A fuel at PLA of 15 and 90 representing ~3.8% and 100% total rated thrust (non-afterburning, see Table S-2 in the SI), respectively. The Mini-CAST burner aerosol PSDs shown are derived from either the VARIAnT 1 or VARIAnT 2 Mini-CAST gas flow settings, which differed significantly (see Table S-3 of the SI for details).
Fig. 7. Particle Size Distributions.

Example average particle size distributions for J85 engine and Mini-CAST aerosols evaluated in the VARIAnT 1 and 2 campaigns. Size distributions were averaged over multiple scans at a single test point. The error bars indicate the stability of the aerosol source at the specific test point. The error bars for the J85 engine size distributions were smaller than that of the Mini-CAST.
As shown in Fig. 7, a single mode, essentially log-normal, distribution was typically observed for the J85 engine operating at these two power conditions. The GMDs associated with the distributions fell in the range of 18–31 nm, with the smallest particles generally produced at idle (PLA 15). The associated geometric standard deviations for the two operating conditions were within the range of 1.6–1.7.
Also shown in Fig. 7 are the PSDs for the Mini-CAST aerosols. The GMDs observed for the Mini-CAST aerosols ranged from 38 to 100 nm. The VARIAnT 2 CAST data for test point V1 (green PSD curve in upper right graph of Fig. 7), is suggestive of a bimodal PSD. The smaller sized particles in this PSD indicate the presence of semi-volatile particles. All other Mini-CAST burner aerosol PSDs were found to give a single mode distribution. Saffaripour et al. (2017) have indicated the larger particles generated by the Mini-CAST have EC content more similar to aircraft engine nvPM emissions.
The NRC Mini-CAST settings (see SI) were originally intended to better represent aircraft turbine engine exhaust (Saffaripour et al., 2017) by avoiding the presence of semi-volatile particles, although the particles produced were significantly larger than the size distributions generated by the J85 engine. The NRC flow settings, as compared to those from the VARIAnT 1 flow settings, had lower volatile (OC) content.
3.5. Sensitivity of black carbon instruments to particle mass concentration, particle source and particle size
To explore the mass instrument sensitivity to particle mass concentration, particle source and particle sizes the difference in the average instrument BC EIs relative to the EC reference method mass EIs was calculated and plotted both as a function of GMD (Fig. 8) and a function of the reference method EC mass EI (Fig. 9). Each data point represents a single test point comparison of a time resolved instrument and the corresponding EC filter result measured on the same sampling system. The error bars are estimated from the standard deviation of the time resolved instrument EIs and EC reference method filter measurements were assigned a 10% error based on uncertainties associated with analysis of reference method manual OCEC instrument, flow rates through the filter and time to load the filter.
Fig. 8.

Relative response of real-time mass instruments compared to reference method EC EI measurements as a function of measured geometric mean particle diameter. The dashed line represents an equal response between the BC instrument and the reference method EC (see also Fig. 9 with respect to mass concentration).
Fig. 9.
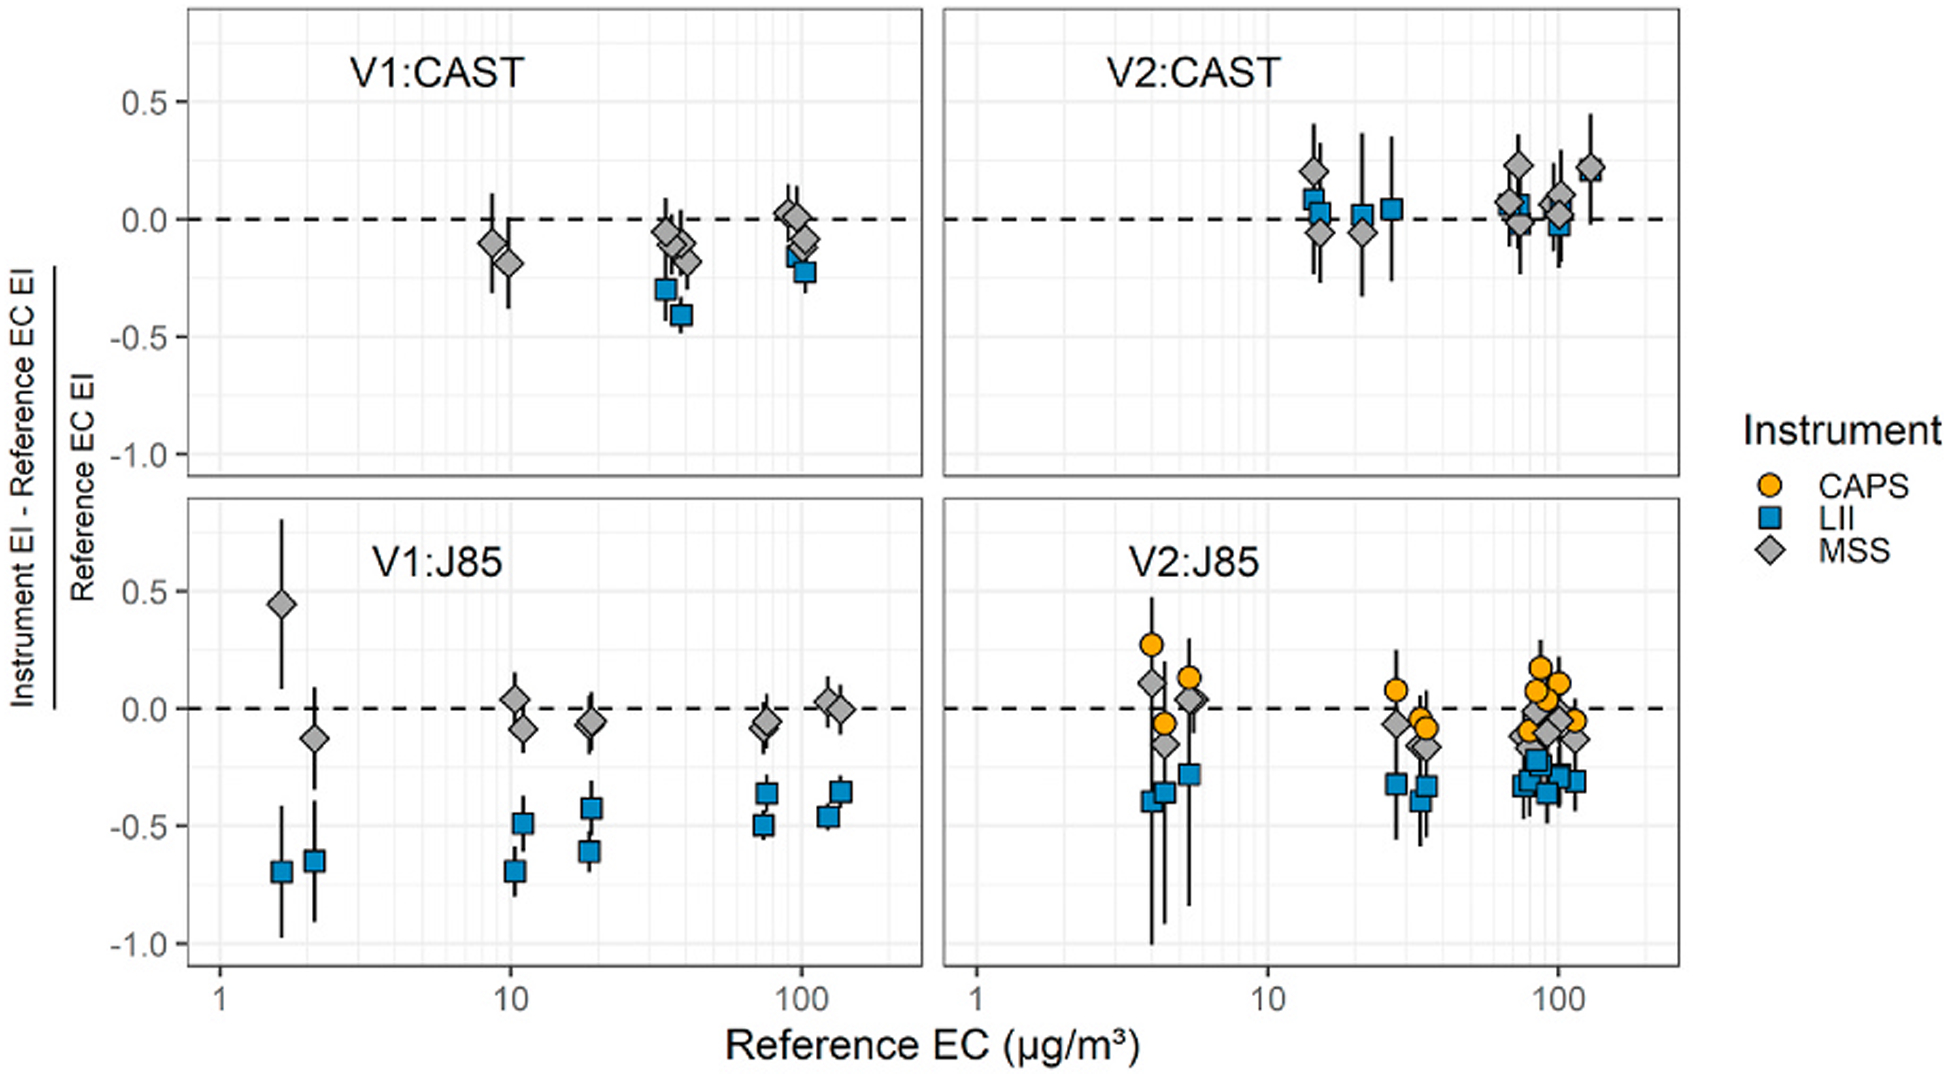
Relative difference between reference EC mass EI and BC instrument mass EI as a function of reference method EC mass concentration broken down by source and test campaign.
Figs. 8 and 9 show the same relative differences with respect to the reference method EC mass EI with each panel representing a single source for a given test campaign. The relative differences for the MSS and CAPS PMSSA data are largely constant as a function of concentration and in agreement with the reference method EC mass EIs within an average of about 10%. For the lowest mass concentration (near 2 μg/m3) measured in VARIAnT 1, the MSS showed differences that ranged between −5% and 50% from the reference method EC mass EI.
Figs. 8 and 9 show the MSS and CAPS PMSSA responses are in agreement with the EC measurement and show no size or concentration dependence within the experimental standard deviations of these measurements. The LII-300 response relative to the EC reference was always skewed low and significantly lower for smaller particles (Fig. 8) or concentrations below ~10 μg/m3 (Fig. 9). Deviations as high as ~70% were observed for aerosols with GMDs of 20 nm or less. The apparent size correlation may be due to the response of the LII-300 to the calibration source, a small offset which becomes important at small concentrations, or other factors, e.g., Durdina et al. (2016). Neither the MSS or CAPS instruments, which were calibrated in exactly the same way, showed any such correlation with either size or concentration. These LII-300 results indicate further investigation is warranted.
4. Conclusions
These studies compared multiple ARP6320 compliant sampling systems designed to deliver exhaust emissions to instruments which measure the nvPM mass and number concentrations generated by commercial aircraft engines. Combustion aerosols generated by both a Mini-CAST burner and a J85 turbojet engine were used as sources for these studies. Sampling systems were designed and operated according to the specifications published in ARP6320. Measurements were made for nvPM number and mass using the instrument types specified in ARP6320 and a reference EC mass measurement. Measurements were also made using a newer BC mass instrument, the CAPS PMSSA, as well as other diagnostic instruments to help assess the system operation.
Comparative results in this work for the mass instruments have been obtained using the EC mass reference method as well as instrument-to-instrument comparisons. The earlier work by Lobo et al. (2020) did not make reference EC mass measurements and their results are relative to the average of the mass instrument measurements rather than to reference EC mass measurements. The conclusions below for the mass instruments are based on the linear regressions between individual instruments and the differences with respect to the EC mass reference method.
Sampling system mass concentration measurement comparisons were performed with ARP6320 compliant mass instruments and reference EC mass concentration instruments, which allowed for a distinction between the sampling system variability and differences among the differing mass instrument responses. In contrast to earlier reported system-to-system differences of 30% or more for mass (Lobo et al., 2020) which did not include the reference EC mass measurements, the comparison between compliant systems for EC mass results presented here were ≤10% (excludes initial VARIAnT 2 CAST data) as determined by linear regression slopes.
Except for the first three days of VARIAnT 2, the VARIAnT 1 and 2 comparisons of nvPM number emission measurements between the three different sampling systems for both J85 and Mini-CAST were in close agreement. Excluding the VARIAnT 2 Mini-CAST data, the VARIAnT 1 and 2 system-to-system nvPM number measurements were within 11% of one another which was slightly better than the 15% previously reported (Lobo et al., 2020).
During VARIAnT 1, operational parameters of the sampling systems (dilution, inlet pressure, sampling line control temperature, etc.) were varied within and outside the values specified in ARP6320. These operational parameter variations had little effect on sampling system mass and number measurement comparisons. Specifically, in the VARIAnT 1 comparisons of the two different sampling systems, the nvPM reference EC mass and number measurements for both J85 and CAST nvPM emissions agreed within 11% or less.
In VARIAnT 2, however, even though operational parameters of the systems were not systematically varied, agreement between the sampling system nvPM reference EC mass and number measurements were within 17% and 26%, respectively, including the VARIAnT 2 CAST data. However, when the VARIAnT 2 CAST are excluded, the system-to-system agreement is nearly identical to one another. Thus, the differences reported prior to VARIAnT 1 for particle number and mass (Lobo et al., 2020) appear not to be related to the operational specifications of the ARP6320 compliant sampling systems.
Intra-system mass instrument differences were evaluated because the ARP6320 reference EC mass instruments were used and there were multiple mass instruments types on each sampling system. Intra-system differences were not possible for the nvPM number measurements.
For the intra-system mass comparisons, the MSS measurements were within 2% of the reference EC for the VARIAnT 1 test campaign and within 14% in VARIAnT 2 for all J85 operating conditions tested. The CAPS PMSSA instruments were within 12% of the reference EC mass for all J85 engine operating conditions tested in the VARIAnT 2 test campaign. The intra-system comparisons of the MSS and CAPS PMSSA mass measurements on the same system were all within 18%. In contrast, except for VARIAnT 2 CAST data, LII-300 mass measurements were substantially lower (up to 45% for the J85) than the reference EC mass measurements and the MSS and CAPS PMSSA mass measurements.
The nvPM mass intersystem variabilities as determined from the linear fit slopes of both the reference EC and MSS mass measurement comparisons were 5% or less when the VARIANT 2 CAST data are excluded (due to the unexplained behavior between the two systems) and 19% or less with the VARIAnT 2 CAST data. Although the LII-300 mass measurements differed from the MSS, CAPS PMSSA, and reference EC mass measurements, the intersystem LII-to-LII mass measurement comparisons showed differences of 11% or less without the VARIAnT 2 CAST data and 14% or less with the VARIAnT 2 CAST data. Taken together, the data show that although the LII-300 instruments agree with each other, they substantially diverge from the other mass measurements.
These results reported here reveal the large mass differences observed in previous test campaigns (Lobo et al., 2020) has been primarily due to the LII-300 mass instrument response. These observations are consistent with the Lobo et al. (2020) results in degree and direction. Subsequent VARIAnT 3 and 4 test campaigns show decreased differences with the reference EC method after changes to the LII-300 instrument and calibration of the LII-300 with a turbine engine combustor and turbine-powered start cart soot source. These data will be reported in a future publication.
Supplementary Material
Acknowledgements
Funding for this project was provided by the U.S. Environmental Protection Agency Office of Transportation and Air Quality (OTAQ) in Ann Arbor, MI, the U.S. Federal Aviation Administration under Grant No. 13-C-AJFE-MST, Amendment 004, and in-kind support from the U.S. Air Force at AEDC. We like to acknowledge the support of Bryan Manning and Glenn Passavant of OTAQ. Additional support came from Edwin Corporan of the U.S. Air Force Research Laboratory at Wright Patterson Air Force Base, OH who supplied the Camelina fuels, Scott MacDonald of Pratt and Whitney in East Hartford, CT who supplied the second AVL sampling and measurement system for VARIAnT 1, and the technical support of Steve Garner, Brad Besheres, Roy Carroll, Jason Smith, Gary Storey, Robert Baltz, Todd Vanpelt, Brad Winkleman, Kathleen Jones, Gary Teal, Bryon Weatherford, Mike Ferris, John King, Charles Easley, and Brian Anderson of the Aerospace Testing Alliance at Arnold Air Force Base, TN.
Footnotes
Diluted exhaust samples have PM mass concentrations in the range of 10–100 μg/m3. At idle it takes about 6 h to collect a filter sample.
The CAPS PMSSA systems used in VARIAnT 2 did not participate in the NRC pre-study calibrations and used the MACs listed in Table 2.
Note that the (standard) temperature and pressure used for all mass and number emission index calculations in this work are Tstd = 0 °C and Pstd = 101.325 kPa
Declaration of competing interest
The authors declare the following financial interests/personal relationships which may be considered as potential competing interests: Richard Miake-Lye and Timothy Onash are employees of Aerodyne Research, Billerica, MA which is the instrument manufacturer of the CAPS PMSSA.
William Bachalo is the president and CEO and Gregory Payne is an employee of ArtiumTechnologies, Inc. Sunnyvale, CA which is the instrument manufacturer of the LII-300.
William Silvis and Richard Frazee were employees of AVL List GmbH, Graz, AT during the test campaign and through part of the data analysis. They were not employed by AVL during the time of the writing of this paper.
Appendix A. Supplementary data
Supplementary data related to this article can be found at https://doi.org/10.1016/j.jaerosci.2020.105734.
Publisher's Disclaimer: Disclaimer
Publisher's Disclaimer: This document has been reviewed in accordance with the U. S. Environmental Protection Agency policy and approved for publication. Mention of trade names or commercial products does not constitute endorsement or recommendation for use. The views expressed in this journal article are those of the authors and do not necessarily reflect the views or policy of the U. S. Environmental Protection Agency.
References
- Abdul-Khalek IS, & Kittelson DB (1995). Real time measurement of volatile and solid exhaust particles using a catalytic stripper, SAE Technical Paper Series. Warrendale, PA: SAE International, 950236. [Google Scholar]
- Abegglen M, Brem BT, Ellenrieder M, Durdina L, Rindlisbacher T, Wang J, Lohmann U, & Sierau B (2016). Chemical characterization of freshly emitted particulate matter from aircraft exhaust using single particle mass spectrometry. Atmospheric Environment, 134, 181–197. 10.1016/j.atmosenv.2016.03.051 [DOI] [Google Scholar]
- ASTM International. (2020). Specification for aviation turbine fuel containing synthesized hydrocarbons, D7Vols. 566–20. West Conshohocken, PA. [Google Scholar]
- AVL. (n.d.). AVL particle sampling system Aviation. Retrieved September 1, 2020, from https://www.avl.com/-/avl-particle-sampling-system-aviation. [Google Scholar]
- Bachalo WD, Sankar SV, Smallwood GJ, & Snelling DR (2002. July 8–11). Development of the laser-induced incandescence method for the reliable characterization of particulate emissions [Paper presentation]. In 11th international symposium on applications of laser techniques to fluid mechanics (Lisbon, Portugal: ). [Google Scholar]
- Birch ME, & Cary RA (1996). Elemental carbon-based method for monitoring occupational exposures to particulate diesel exhaust. Aerosol Science and Technology, 25(3), 221–241. 10.1080/02786829608965393 [DOI] [PubMed] [Google Scholar]
- Bond TC, Doherty SJ, Fahey DW, Forster PM, Berntsen T, DeAngelo BJ, Flanner MG, Ghan S, Kärcher B, Koch D, Kinne S, Kondo Y, Quinn PK, Sarofim MC, Schultz MG, Schulz M, Venkataraman C, Zhang H, Zhang S, … Zender CS (2013). Bounding the role of black carbon in the climate system: A scientific assessment. Journal of Geophysical Research: Atmospheres, 118(11), 5380–5552. 10.1002/jgrd.50171 [DOI] [Google Scholar]
- Coderre AR, Thomson KA, Snelling DR, & Johnson MR (2011). Spectrally resolved light absorption properties of cooled soot from a methane flame. Applied Physics B, 104(1), 175–188. 10.1007/s00340-011-4448-9 [DOI] [Google Scholar]
- Corporan E, Edwards T, Shafer L, DeWitt MJ, Klingshirn C, Zabarnick S, West Z, Striebich R, Graham J, & Klein J (2011). Chemical, thermal stability, seal swell, and emissions studies of alternative jet fuels. Energy & Fuels, 25(3), 955–966. 10.1021/ef101520v [DOI] [Google Scholar]
- Durdina L, Lobo P, Trueblood MB, Black EA, Achterberg S, Hagen DE, Brem BT, & Wang J (2016). Response of real-time black carbon mass instruments to mini-CAST soot. Aerosol Science and Technology, 50(9), 906–918. 10.1080/02786826.2016.1204423 [DOI] [Google Scholar]
- International Civil Aviation Organization. (2017). International standards and recommended practices – Annex 16 to the convention on international Civil aviation. In Environmental protection, volume II - aircraft engine emissions (4th ed.). Montreal, QC: Canada. [Google Scholar]
- Jing. (n.d.). miniCAST series 5200, Retrieved September 1, 2020, from http://www.sootgenerator.com/midCAST_g.htm.. [Google Scholar]
- Jing L (1999). Standard combustion aerosol generator (SCAG) for calibration purposes. 3rd ETH workshop “nanoparticle measurement”. ETH, Zürich, 9.−10. August 1999. [Google Scholar]
- Kinsey JS, Corporan E, Pavlovic J, DeWitt M, Klingshirn C, & Logan R (2019). Comparison of measurement methods for the characterization of the black carbon emissions from a T63 turboshaft engine burning conventional and Fischer-Tropsch fuels. Journal of the Air & Waste Management Association, 69(5), 576–591. 10.1080/10962247.2018.1556188 [DOI] [PMC free article] [PubMed] [Google Scholar]
- Kinsey JS, Dong Y, Williams DC, & Logan R (2010). Physical characterization of the fine particle emissions from commercial aircraft engines during the Aircraft Particle Emissions eXperiment (APEX) 1–3. Atmospheric Environment, 44(17), 2147–2156. 10.1016/j.atmosenv.2010.02.010 [DOI] [PubMed] [Google Scholar]
- Kinsey JS, Hays MD, Dong Y, Williams DC, & Logan R (2011). Chemical characterization of the fine particle emissions from commercial aircraft engines during the aircraft particle emissions eXperiment (APEX) 1 to 3. Environmental Science & Technology, 45(8), 3415–3421. 10.1021/es103880d [DOI] [PubMed] [Google Scholar]
- Lee DS, Pitari G, Grewe V, Gierens K, Penner JE, Petzold A, Prather MJ, Schumann U, Bais A, Berntsen T, Iachetti D, Lim LL, & Sausen R (2010). Transport impacts on atmosphere and climate: Aviation. Atmospheric Environment, 44(37), 4678–4734. 10.1016/j.atmosenv.2009.06.005 [DOI] [PMC free article] [PubMed] [Google Scholar]
- Lobo P, Condevaux J, Yu Z, Kuhlmann J, Hagen DE, Miake-Lye RC, Whitefield PD, & Raper DW (2016). Demonstration of a regulatory method for aircraft engine nonvolatile PM emissions measurements with conventional and isoparaffinic kerosene fuels. Energy & Fuels, 30(9), 7770–7777. 10.1021/acs.energyfuels.6b01581 [DOI] [Google Scholar]
- Lobo P, Durdina L, Brem BT, Crayford AP, Johnson MP, Smallwood GJ, Siegerist F, Williams PI, Black EA, Llamedo A, Thomson KA, Trueblood MB, Yu Z, Hagen DE, Whitefield PD, Miake-Lye RC, & Rindlisbacher T (2020). Comparison of standardized sampling and measurement reference systems for aircraft engine non-volatile particulate matter emissions. Journal of Aerosol Science, 145, 105557. 10.1016/j.jaerosci.2020.105557 [DOI] [Google Scholar]
- Lobo P, Durdina L, Smallwood GJ, Rindlisbacher T, Siegerist F, Black EA, Yu Z, Mensah AA, Hagen DE, Miake-Lye RC, Thomson KA, Brem BT, Corbin JC, Abegglen M, Sierau B, Whitefield PD, & Wang J (2015). Measurement of aircraft engine non-volatile PM emissions: Results of the aviation-particle regulatory instrumentation demonstration experiment (A-PRIDE) 4 campaign. Aerosol Science and Technology, 49(7), 472–484. 10.1080/02786826.2015.1047012 [DOI] [Google Scholar]
- Maricq MM (2014). Examining the relationship between black carbon and soot in flames and engine exhaust. Aerosol Science and Technology, 48(6), 620–629. 10.1080/02786826.2014.904961 [DOI] [Google Scholar]
- Michelsen HA, Schulz C, Smallwood GJ, & Will S (2015). Laser-induced incandescence: Particulate diagnostics for combustion, atmospheric, and industrial applications. Progress in Energy and Combustion Science, 51, 2–48. 10.1016/j.pecs.2015.07.001 [DOI] [Google Scholar]
- National Academies of Sciences. (2008). Engineering, and medicine. Research needs associated with particulate emissions at airports. Washington, DC: The National Academies Press. 10.17226/14160 [DOI] [Google Scholar]
- National Academies of Sciences. (2008). Engineering, and medicine. Summarizing and interpreting aircraft gaseous and particulate emissions data. Washington, DC: The National Academies Press. 10.17226/14197 [DOI] [Google Scholar]
- Onasch TB, Jayne JT, Herndon S, Worsnop DR, Miake-Lye RC, Mortimer IP, & Anderson BE (2009). Chemical properties of aircraft engine particulate exhaust emissions. Journal of Propulsion and Power, 25(5), 1121–1137. 10.2514/1.36371 [DOI] [Google Scholar]
- Onasch TB, Massoli P, Kebabian PL, Hills FB, Bacon FW, & Freedman A (2015). Single scattering albedo monitor for airborne particulates. Aerosol Science and Technology, 49(4), 267–279. 10.1080/02786826.2015.1022248 [DOI] [Google Scholar]
- Saffaripour M, Tay L-L, Thomson KA, Smallwood GJ, Brem BT, Durdina L, & Johnson M (2017). Raman spectroscopy and TEM characterization of solid particulate matter emitted from soot generators and aircraft turbine engines. Aerosol Science and Technology, 51(4), 518–531. 10.1080/02786826.2016.1274368 [DOI] [Google Scholar]
- Schindler W, Haisch C, Beck HA, Niessner R, Jacob E, & Rothe D (2004). A photoacoustic sensor system for time resolved quantification of diesel soot emissions. Warrendale, PA: SAE International. SAE Technical Paper. 10.4271/2004-01-0968, 2004-01-0968. [DOI] [Google Scholar]
- Schwarz JP, Gao RS, Fahey DW, Thomson DS, Watts LA, Wilson JC, Reeves JM, Darbeheshti M, Baumgardner DG, Kok GL, Chung SH, Schulz M, Hendricks J, Lauer A, Kärcher B, Slowik JG, Rosenlof KH, Thompson TL, Langford AO, Loewenstein M, & Aikin KC (2006). Single-particle measurements of midlatitude black carbon and light-scattering aerosols from the boundary layer to the lower stratosphere. Journal of Geophysical Research: Atmospheres, 111(D16). 10.1029/2006JD007076 [DOI] [Google Scholar]
- Schwarz JP, Spackman JR, Fahey DW, Gao RS, Lohmann U, Stier P, Watts LA, Thomson DS, Lack DA, Pfister L, Mahoney MJ, Baumgardner D, Wilson JC, & Reeves JM (2008). Coatings and their enhancement of black carbon light absorption in the tropical atmosphere. Journal of Geophysical Research: Atmospheres, 113(D3). 10.1029/2007JD009042 [DOI] [Google Scholar]
- Society of Automotive Engineers (SAE) Aerospace Recommended Practice (ARP). (2018). Procedure for the continuous sampling and measurement of non-volatile particulate matter emissions from aircraft turbine engines (p. 6320). PA: Warrendale. 10.4271/ARP6320 [DOI] [Google Scholar]
- Society of Automotive Engineers (SAE) Aerospace Recommended Practice (ARP). (2019). Procedure for the calculation of non-volatile particulate matter sampling and measurement system losses and system loss correction factors (p. 6481). PA: Warrendale. 10.4271/ARP6481 [DOI] [Google Scholar]
- Society of Automotive Engineers (SAE) Aerospace information report (AIR). (2013). Procedure for the continuous sampling and measurement of non-volatile particle emissions from aircraft turbine engines, 6241. Warrendale. 10.4271/AIR6241. [DOI] [Google Scholar]
- Sunset Laboratory, Inc.. Products & services. Retrieved September 1, 2020, from https://www.sunlab.com/products-services/.
Associated Data
This section collects any data citations, data availability statements, or supplementary materials included in this article.