

Abstract
Saturation is a core guiding principle to determine sample sizes in qualitative research, yet little methodological research exists on parameters that influence saturation. Our study compared two approaches to assessing saturation: code saturation and meaning saturation. We examined sample sizes needed to reach saturation in each approach, what saturation meant, and how to assess saturation. Examining 25 in-depth interviews, we found that code saturation was reached at nine interviews, whereby the range of thematic issues was identified. However, 16 to 24 interviews were needed to reach meaning saturation where we developed a richly textured understanding of issues. Thus, code saturation may indicate when researchers have “heard it all,” but meaning saturation is needed to “understand it all.” We used our results to develop parameters that influence saturation, which may be used to estimate sample sizes for qualitative research proposals or to document in publications the grounds on which saturation was achieved.
Keywords: behavior, HIV/AIDS, infection, methodology, qualitative, saturation, in-depth interviews, USA
Introduction
“What is an adequate sample size for qualitative studies?” This is a common question for which there is not a straight-forward response. Qualitative studies typically use purposively selected samples (as opposed to probability-driven samples), which seek a diverse range of “information-rich” sources (Patton, 1990) and focus more on the quality and richness of data rather than the number of participants. Many factors influence sample sizes for qualitative studies, including the study purpose, research design, characteristics of the study population, analytic approach, and available resources (Bryman, 2012; Malterud, Siersma, & Guassora, 2015; Morse, 2000). However, the most common guiding principle for assessing the adequacy of a purposive sample is saturation (Morse, 1995, 2015). “Saturation is the most frequently touted guarantee of qualitative rigor offered by authors to reviewers and readers, yet it is the one we know least about” (Morse, 2015, p. 587). Although saturation is used as an indicator of an effective sample size in qualitative research, and is seen in quality criteria of academic journals and research funding agencies, it remains unclear what saturation means in practice. Saturation also has multiple meanings when applied in different approaches to qualitative research (O’Reilly & Parker, 2012). Therefore, unquestioningly adopting saturation as a generic indicator of sample adequacy is inappropriate without guidance from methodological research on how to assess saturation, how to document it, and what it means for different types of studies and different types of data. Few methodological studies have been conducted to examine sample sizes needed to achieve saturation in purposive samples and the parameters that may influence saturation. Our study contributes methodological research to document and assess two different approaches to saturation in qualitative research, to provide guidance for researchers to effectively gauge when saturation may occur, and to strengthen sample size estimates for research proposals and protocols.
Defining Saturation
The concept of saturation was originally developed by Glaser and Strauss (1967) as part of their influential grounded theory approach to qualitative research, which focuses on developing sociological theory from textual data to explain social phenomena. In grounded theory, the term theoretical saturation is used, which refers to the point in data collection when no additional issues or insights emerge from data and all relevant conceptual categories have been identified, explored, and exhausted. This signals that conceptual categories are “saturated”, and the emerging theory is comprehensive and credible. Thus, theoretical saturation is “the point at which gathering more data about a theoretical construct reveals no new properties nor yields any further theoretical insights about the emerging grounded theory” (Bryant & Charmaz, 2007, p. 611). The emphasis of theoretical saturation is more toward sample adequacy and less about sample size (Bowen, 2008). An important aspect of theoretical saturation is that it is embedded in an iterative process, whereby researchers are concurrently sampling, collecting data, and analyzing data (Sandelowski, 1995). This iterative process enables “theoretical sampling”, which involves identifying concepts from data that are used to guide participant recruitment to further explore those concepts in subsequent data collection until theoretical saturation is reached. Theoretical sampling is thereby inextricably linked to theoretical saturation to ensure that all constructs of a phenomenon (i.e., issues, concepts, categories, and linkages) are fully explored and supported so that the emerging theory is valid and robust. Theoretical saturation is therefore embedded in the goals and epistemological approach of grounded theory.
Challenges in Applying Saturation
Despite its origins in grounded theory, saturation is also applied in many other approaches to qualitative research. It is often termed data saturation or thematic saturation and refers to the point in data collection when no additional issues are identified, data begin to repeat, and further data collection becomes redundant (Kerr, Nixon, & Wild, 2010). This broader application of saturation is focused more directly on gauging sample size rather than the adequacy of data to develop theory (as in “theoretical saturation”). Taking the concept of saturation out of its methodological origins and applying it more generically to qualitative research has been somewhat unquestioned but remains problematic (Kerr et al., 2010). When used outside of grounded theory, saturation often becomes separated from the iterative process of sampling, data collection, and data analysis, which provide procedural structure to its application. Without adequate guidance on its application in this broader context, it is unclear what saturation means and how it can be achieved (Kerr et al., 2010). This issue is clearly reflected in published qualitative research. If saturation is mentioned, it is often glossed over with no indications for how it was achieved or the grounds on which it is justified (Bowen, 2008; O’Reilly & Parker, 2012). For example, Francis et al. (2010) reviewed all articles published in the multidisciplinary journal Social Science & Medicine over a 16-month period to identify how saturation is reported in health-related disciplines. Of the 18 articles that mentioned data saturation, 15 articles claimed they achieved saturation, but it was unclear how saturation was defined, achieved, or justified in these studies. Carlsen and Glenton (2011) conducted a systematic review of 220 studies using focus group discussions to identify how sample size was justified. They found that of those studies that explained sample size, 83% used saturation as the justification for their sample size. However, they found that these articles provided superficial reporting of how saturation was achieved, including unsubstantiated claims of saturation and reference to achieving saturation while still using the predetermined sample size. There is increasing concern over researchers claiming saturation without providing any justification or explanation of how it was assessed or the grounds on which it was achieved (Bowen, 2008; Green & Thorgood, 2009; Guest, Bunce, & Johnson, 2006; Kerr et al., 2010; Malterud et al., 2015; Morse, 1995, 2000, 2015).
Morse (1995) highlighted long ago that there exists a lack of published guidelines on sample sizes needed to reach saturation. A decade later, this situation remains, as confirmed by Guest et al. (2006), who reviewed 24 qualitative research textbooks and seven databases and found no guidelines on how to achieve saturation in purposive samples. The authors concluded that the literature does a “poor job of operationalizing the concept of saturation, providing no description of how saturation might be determined and no practical guidelines for estimating sample sizes for purposively sampled interviews” (Guest et al., 2006, p. 60). Another decade has passed, and many still agree that guidelines for assessing saturation in qualitative research remain vague and are not evidence-based (Carlsen & Glenton, 2011; Kerr et al., 2010). Despite its simple appeal, saturation is complex to operationalize and demonstrate. If saturation is to remain a criterion for assessing sample adequacy, it behooves us to conduct further methodological studies to examine how saturation is achieved and assessed. Ultimately without these studies, declarations of “reaching saturation” become meaningless and undermine the purpose of the term.
A further challenge is that saturation can only be operationalized during data collection, but sample sizes need to be stated in advance on research proposals and protocols. The need to identify sample sizes a priori is to a large extent “an institutionally generated problem for qualitative research” (Hammersley, 2015, p. 687). In addition, requirements mandated by ethics committees and funding agencies for a priori determination of sample sizes provide challenges in qualitative research because qualitative samples are typically defined, refined, and strengthened using an iterative approach in the field. Nonetheless, researchers do need to estimate their sample size a priori, yet there is little methodological research that demonstrates sample sizes needed to reach saturation for different types of qualitative studies to support these estimates. Most sample size recommendations for qualitative research are thus experiential or “rules of thumb” (Bryman, 2012; Guest et al., 2006; Kerr et al., 2010; Morse, 1995; Sandelowski, 1995). Furthermore, using an appropriate sample size is also an ethical issue (Carlsen & Glenton, 2011; Francis et al., 2010): qualitative samples that are larger than needed waste research funds, burden the study population, and lead to unused data, while samples that are too small may not fully capture phenomena, reduce the validity of findings, and waste resources that build interventions on those findings. Therefore, further methodological research is needed on the practical application of saturation to provide a body of evidence that can guide a priori estimates of sample sizes for different types of qualitative research.
Assessing Saturation
Numerous articles emphasize the need for more transparency in reporting saturation (Carlsen & Glenton, 2011; Fusch & Ness, 2015; Kerr et al., 2010; Morse, 2015; O’Reilly & Parker, 2012); however, few studies provide empirical data on how saturation was achieved that can be used to effectively assess, report, and justify saturation. There are two notable exceptions. Guest et al. (2006) used data from a study involving 60 in-depth interviews in two West African countries to systematically document data saturation during thematic analysis, identify the number of interviews needed to reach thematic exhaustion, and find when important themes were developed. They documented the progression of theme development by counting the number of content-driven themes raised in successive sets of six interviews, identifying when new themes were raised or changes were made to existing themes in the emerging codebook. They also assessed the importance of themes based on the frequency of code application across the study data. They concluded that saturation of themes was achieved by 12 interviews, but that the basic elements for themes were already present at six interviews. Saturation was assessed based on the extent of theme development and theme importance in these data. As such, by 12 interviews, 88% of all emergent themes had been developed, and 97% of all important themes were developed; therefore, the codebook structure had stabilized by 12 interviews with few changes or additions thereafter. The authors note that their relatively homogeneous sample, focused study objectives, and semistructured interview guide may have contributed to reaching data saturation by 12 interviews. They also caution against using 12 interviews as a generic sample size for saturation, stressing that saturation is likely dependent on a range of characteristics of the study, data, and researchers.
This was the first methodological study demonstrating the sample size required to achieve saturation; however, it has some limitations. The exact point of saturation is unclear. The authors state that saturation was achieved by 12 interviews, but interviews were reviewed in batches of six, so that saturation actually occurred somewhere between seven and 12 interviews. Codes are presented as uniform, so there is no consideration of different types of codes and how saturation may differ by code characteristics. It is also unclear whether iterative diversity sampling was used to recruit participants, so we cannot assess whether or how this may have influenced saturation in this study (Kerr et al., 2010). Perhaps the greatest limitation is the assessment of saturation by counting occurrences of themes, without also assessing the meaning of those themes. Identifying themes is just the first step in reaching saturation. “What is identified about the theme the first time it emerges may not be particularly insightful or revealing. Further data collection and analysis may be required to develop depth in the content and definition of a theme or concept” (Kerr et al., 2010, p. 276). Similarly, code importance is defined by the prevalence of codes across data rather than their contribution to understanding the phenomenon:
Without any qualitative judgement of the meaning and content of codes who is to say that one of the less prevalent codes was not a central key to understanding that would have been missed if fewer interviews had been conducted.
(Kerr et al., 2010, p. 274)
Therefore, a critical missing element in the work of Guest and colleagues is to assess the sample size needed to reach saturation in the meaning of issues and how this might compare with their sample size suggested by identifying the presence of themes in data. Therefore, this study does not provide guidance on the number of interviews needed to fully understand the issues raised in these data.
Another methodological study by Francis et al. (2010) identified when saturation of concepts occurs in theory-based interview studies (where conceptual categories were predetermined by the theory of planned behavior). They used their analysis to propose principles for establishing and reporting data saturation, including specifying a priori an initial number of interviews to conduct, identifying stopping criteria to use (based on the number of consecutive interviews that yield no further concepts), and reporting saturation in a transparent and verifiable way. In their analysis, they used an initial sample of 10 interviews (although they provide no justification for this number), a stopping criterion of three, and present cumulative frequency graphs to demonstrate saturation of concepts and overall study saturation. Within these parameters, they found that one study reached overall study saturation by 17 interviews, with each belief category reaching saturation at a different point. In a second study, saturation was achieved in one belief category but not in others; therefore, overall study saturation was not achieved in the 14 interviews conducted. These results highlight that saturation is not unidimensional; it can be assessed (or achieved) at different levels—by individual constructs or by overall study saturation. Thus, researchers need to be clear on the type of saturation they claim to have achieved. Francis et al.’s study begins to acknowledge the need to assess saturation in the meaning of issues in data; however, the results are limited to demonstrating saturation in studies using externally derived conceptual categories, rather than more inductive content-driven themes.
Study Aims
Our study responds to calls for more methodological research on operationalizing saturation (by Francis et al., 2010; Guest et al., 2006; Morse, 2015). We explore what saturation means in practice, how it can be assessed and documented, and we provide pragmatic guidance on estimating sample sizes in qualitative research. We focus on the general application of saturation, described earlier, as used outside of the grounded theory context. This focus is warranted due to the frequent use of saturation in other qualitative approaches without explanation of how it was applied or achieved and due to the lack of methodological guidance on the use of saturation in this broader context, as described above.
Our study explores two approaches to assessing saturation, which we term code saturation and meaning saturation. We first assessed code saturation, which we defined as the point when no additional issues are identified and the codebook begins to stabilize. We then assessed whether code saturation is sufficient to fully understand issues identified. Second, we assessed meaning saturation, which we defined as the point when we fully understand issues, and when no further dimensions, nuances, or insights of issues can be found. We also assessed whether certain characteristics of codes influence code or meaning saturation, to provide parameters for estimating saturation based on the nature of codes developed in a study. Our study sought to answer the following research questions:
Research Question 1: How many interviews are needed to reach code saturation?
Research Question 2: How many interviews are needed to reach meaning saturation?
Research Question 3: How do code characteristics influence saturation?
Research Question 4: What parameters can be used to assess saturation a priori to estimate qualitative sample sizes?
Our study focused on assessing saturation in applied qualitative research, typically used in health sciences and public health research to understand health behavior and develop interventions. In these applications, the research purpose and study population may be more defined than in other types of qualitative research, such as ethnographic studies.
Method
Study Background
We provide an overview of data collection for the original study as context for our analyses on saturation of these data. The research question of the original study was: what influences patient retention in HIV care? With the advent of antiretroviral therapy (ART), HIV infection has transitioned from a fatal disease to a chronic condition. ART is important for slowing progression of the disease and reducing HIV transmission to others (Attia, Egger, Müller, Zwahlen, & Low, 2009; Cohen et al., 2011; “Vital Signs,” 2011). Becoming linked to care soon after diagnosis with HIV is critical for early initiation of ART and regular monitoring of the viral load and other comorbidities. However, only 77% of those known to be HIV positive in the United States are linked to care, and only 51% are retained in regular care thereafter (Hall et al., 2012; “Vital Signs,” 2011). Therefore, the aim of the original study was to understand what influences retention in HIV care at the Infectious Disease Clinic (IDC) of the Atlanta VA Medical Center (AVAMC), the largest VA clinic caring for HIV-positive patients in the United States.
Data Collection and Analysis
Participants were eligible for the study if they were 18 years or older, first attended the IDC before January 2011, and were diagnosed as HIV positive. Study participants included two groups: patients currently receiving care at the IDC (in-care group) and patients who received at least 6 months of care at the IDC but had not attended a clinic visit for at least 8 months (out-of-care group). Patient records were screened to identify eligible participants due for a clinic appointment during the study period. Out-of-care patients were divided into quartiles by their time out of care and then purposively selected from each quartile. In-care patients were then selected to match out-of-care participants based on age, ethnicity, and gender. Participants were contacted by telephone and invited to participate in the study at their routine clinic appointment or a different time. Using clinic records enabled purposive diversity sampling by demographic and treatment retention characteristics; thereafter iterative recruitment was used to achieve diversity in other characteristics like employment. Data were collected from February to July 2013, through 25 in-depth interviews: 16 with those out of care and nine with those in care. A greater diversity of issues was raised in the out-of-care group which required more interviews to fully understand these issues. Interviews were conducted by researchers trained in qualitative research and experienced with HIV care and the AVAMC. Interviewers used a semistructured interview guide on the following topics: influence of military service on health care; HIV diagnosis; knowledge of HIV; HIV treatment, care, and support; and barriers and facilitators for receiving HIV care at the AVAMC. All interviews were conducted in a private room at the IDC, digitally recorded, and lasted approximately 60 minutes. The study was approved by Emory University Institutional Review Board (IRB00060643).
All interviews were transcribed verbatim, de-identified, and entered into MaxQDA11 software (1989–2016) for qualitative data analysis. We used thematic analysis to identify and describe core themes across all data. This involved reading all transcripts to identify issues raised by participants, which were verified by two analysts; giving each issue a code name; and listing all codes and code definitions in a codebook. The codebook included both deductive codes from topics in the interview guide and inductive content-driven codes. Intercoder agreement was assessed between two coders on a portion of coded data and coding discrepancies resolved before the entire data set was coded.
To assess saturation in these data, we needed to collect additional information regarding code development and then conduct separate analyses of these additional data. These additional data and analyses are described in the subsequent sections, and an overview of analytic methods is shown in Figure 1.
Figure 1.

Overview of analytic methods for assessing code saturation and meaning saturation.
Data for Assessing Code Saturation
To assess code saturation, we documented the process of code development by reviewing interview transcripts in the order in which they were conducted. For each interview, we recorded new codes developed and code characteristics, including the code name, code definition, type of code (inductive or deductive), any notes about the new code (e.g., clarity of the issue, completeness of the code definition), and whether any previously developed codes were present in the interview. Each code definition included a description of the issue it captured, criteria for code application and any exceptions, and an example of text relevant to the code. To identify the evolution of code development, we also recorded any changes made to codes developed in previous interviews, including the nature of the change and the interview number at which each change occurred. This documentation of code development and iterative refinement of codes continued for each interview individually until all 25 interviews were reviewed and the codebook was complete.
Codes were then categorized for analysis as follows. First, codes were categorized as inductive or deductive. Inductive codes were content-driven and raised by participants spontaneously, whereas deductive codes were researcher-driven and originated from the interview guide. Second, changes to codes were categorized as change in code name, change in code definition, code merged, and code split into separate codes. Code definition changes were further categorized as expanded conceptually, added examples, edited inclusion/exclusion criteria, and added negative component. Third, codes were also categorized as concrete or conceptual. Concrete codes were those capturing explicit, definitive issues in data; for example, the code “time” captured concrete issues such as travel time, waiting time, and appointment time. Similarly, the code “work commitments” captured explicit issues such as long hours, shift work, or getting time off work. Conceptual codes were those capturing abstract constructs such as perceptions, emotions, judgments, or feelings. For example, the conceptual code “comfort with virus” captures a subtle attitude toward HIV, a feeling of confidence, and a sense of control, as captured in this phrase: “I’ve embraced the fact that I am HIV positive . . . I guess I’m kinda passive to my virus . . . I’m gonna be OK.” Similarly, the conceptual code “responsibility for health” captures the concept of taking charge and being accountable for one’s own health, as shown in these phrases: “If you get sick you need to do something about it” (taking responsibility) or “I wasn’t focused on my HIV and . . . didn’t take medication” (lack of responsibility). These categorizations of codes were used to quantify the types of codes, types of changes to code development, and timing of code development to identify patterns that will be reported in the results.
To assess whether code saturation was influenced by the order in which interview transcripts were reviewed, we randomized the order of interviews, mapped hypothetical code development in the random order, and compared this with results from code development in the order in which interviews were actually reviewed. To do this, we first randomized interviews using a random number generator. We did not repeat the process of reviewing transcripts to develop codes, as this would be biased given that this process had already been completed with the same interviews in their actual order. Instead, we assumed that codes would be developed after the same number of repetitions of that theme across the interviews. For example, in actual code development, the code “forgot appointment” was created in the third interview, after this issue had been mentioned in Interviews 1 and 3. Thus, in the random order, we assumed that the “forgot appointment” code would likewise be created after two mentions of the theme. The aim here was that our hypothetical code development would reflect the researchers’ style of code development in the random order as in the actual order, so that we could assess the effect of interview order on code development more directly. We replicated the pattern of code development in the randomized interviews by calculating the number of times a theme was present (as indicated by the number of interviews in which the code was applied to the coded data) before the interview in which the code was created. We then used these numbers to map hypothetical code development in the randomized interviews. This calculation was done for all codes and was used to map code development in the randomized interviews.
Data for Assessing Meaning Saturation
To assess whether the sample size needed to reach code saturation was also sufficient to achieve meaning saturation, we compared code saturation with meaning saturation of individual codes. We also assessed whether the type of code or its prevalence in data influenced saturation of a code.
To identify meaning saturation, we selected nine codes central to the research question of the original study and comprising a mix of concrete and conceptual codes (as defined above) and high- and low-prevalence codes (as defined below). We developed a trajectory for each of these codes to identify what we learned about the code from successive interviews. This involved using the coded data to search for the code in the first interview, noting the various dimensions of the issue described, then searching for the code in the second interview and noting any new dimensions described, and continuing to trace the code in this way until all 25 interviews had been reviewed. We repeated this process for all nine codes we traced. We used the code trajectories to identify meaning saturation for each code, whereby further interviews provided no additional dimensions or understanding of the code, only repetition of these. We then compared the number of interviews needed to reach meaning saturation for individual codes with code saturation determined earlier.
To assess whether saturation was influenced by the type of code, we compared code saturation for the concrete codes (“time,” “feel well,” “enough medications,” and “work commitments”) with saturation for the conceptual codes (“comfort with virus,” “not a death sentence,” “disclosure,” “responsibility for health,” and “HIV stigma”). Finally, to assess whether code saturation was influenced by code prevalence, we compared code saturation by high-or low-prevalence codes. Code prevalence was defined by the number of interviews in which a code was present. On average, codes were present in 14.5 interviews; thus, we defined high-prevalence codes as those appearing in more than 14.5 interviews and low-prevalence codes as those appearing in fewer than 14.5 interviews. Of the codes assessed for meaning saturation, the high-prevalence codes included “time,” “disclosure,” “HIV stigma,” and “responsibility for health,” whereas the low-prevalence codes included “feel well,” “work commitments,” “enough medications,” “comfort with virus,” and “not a death sentence.”
Results
Part I: Code Saturation
Code development.
Figure 2 shows the timing of code development. We identified the number of new codes developed from each successive interview in the order in which they were conducted, the type of code that was developed (inductive or deductive), and the study population in which codes were developed (out-of-care or in-care group). Both inductive and deductive codes were developed from Interview 1 and thereafter only inductive codes were added. A total of 45 codes were developed in this study, with more than half (53%) of codes developed from the first interview. Interviews 2 and 3 added only five additional codes each; by Interview 6, 84% of codes were identified, and by Interview 9, 91% of all new codes had been developed. The remaining 16 interviews yielded only four additional codes (8% of all codes). These four codes developed after Interview 9 were more conceptual codes (“drug vacation,” “systemic apathy,” “not a death sentence,” and “helping others”) compared with the more concrete topic codes developed in earlier interviews. By Interview 16, when out-of-care group interviews were completed, we had developed 98% of the codes in the study, and adding the second study population (in-care group) yielded only one additional code, despite the different health care context of this group of participants.
Figure 2.
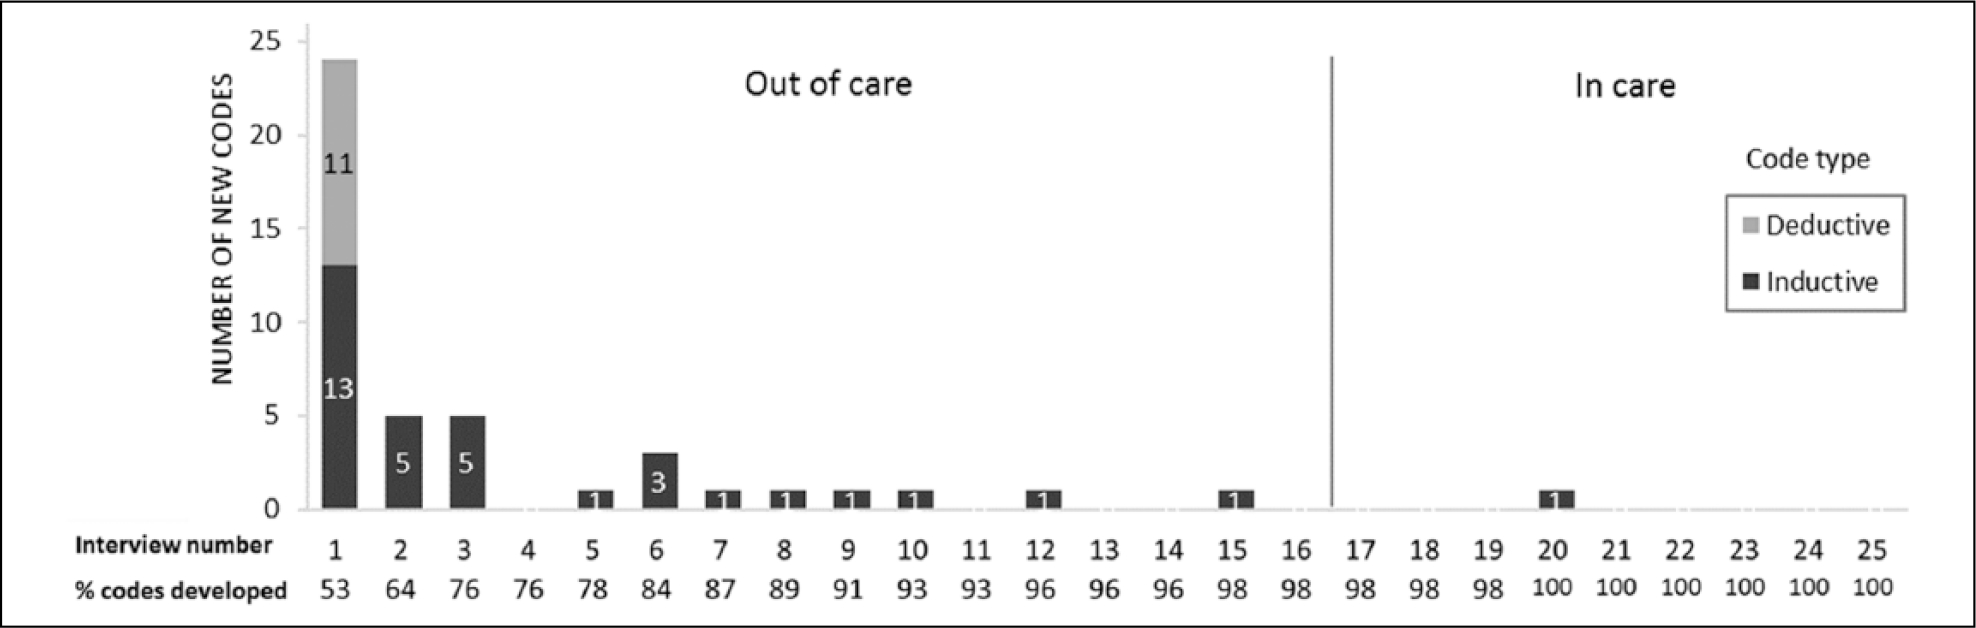
Timing of code development.
Note. Interviews 1 to 16 were with out-of-care patients, and Interviews 17 to 25 were with in-care patients.
Figure 2 shows that the majority of codes were developed from the very first interview reviewed. We asked whether the order in which interviews were reviewed had any influence on the pattern of new code development and in particular whether reviewing the out-of-care group first influenced code development. To assess this, we compared the number of new codes developed in our randomized interview order with code development in the actual order in which interviews were reviewed. Figure 3 shows that the same pattern of code development emerged in both the random and the actual order in which interviews were reviewed, whereby more than half of codes were still developed in the first interview and new code development tapers sharply with successive interviews. In both scenarios, the majority of codes were still developed by interview 9 (91% and 87% in the actual and random order, respectively). Thus, regardless of the order in which interviews are reviewed for code development, the same pattern of new code development is seen, whereby early interviews produce the majority of new codes.
Figure 3.
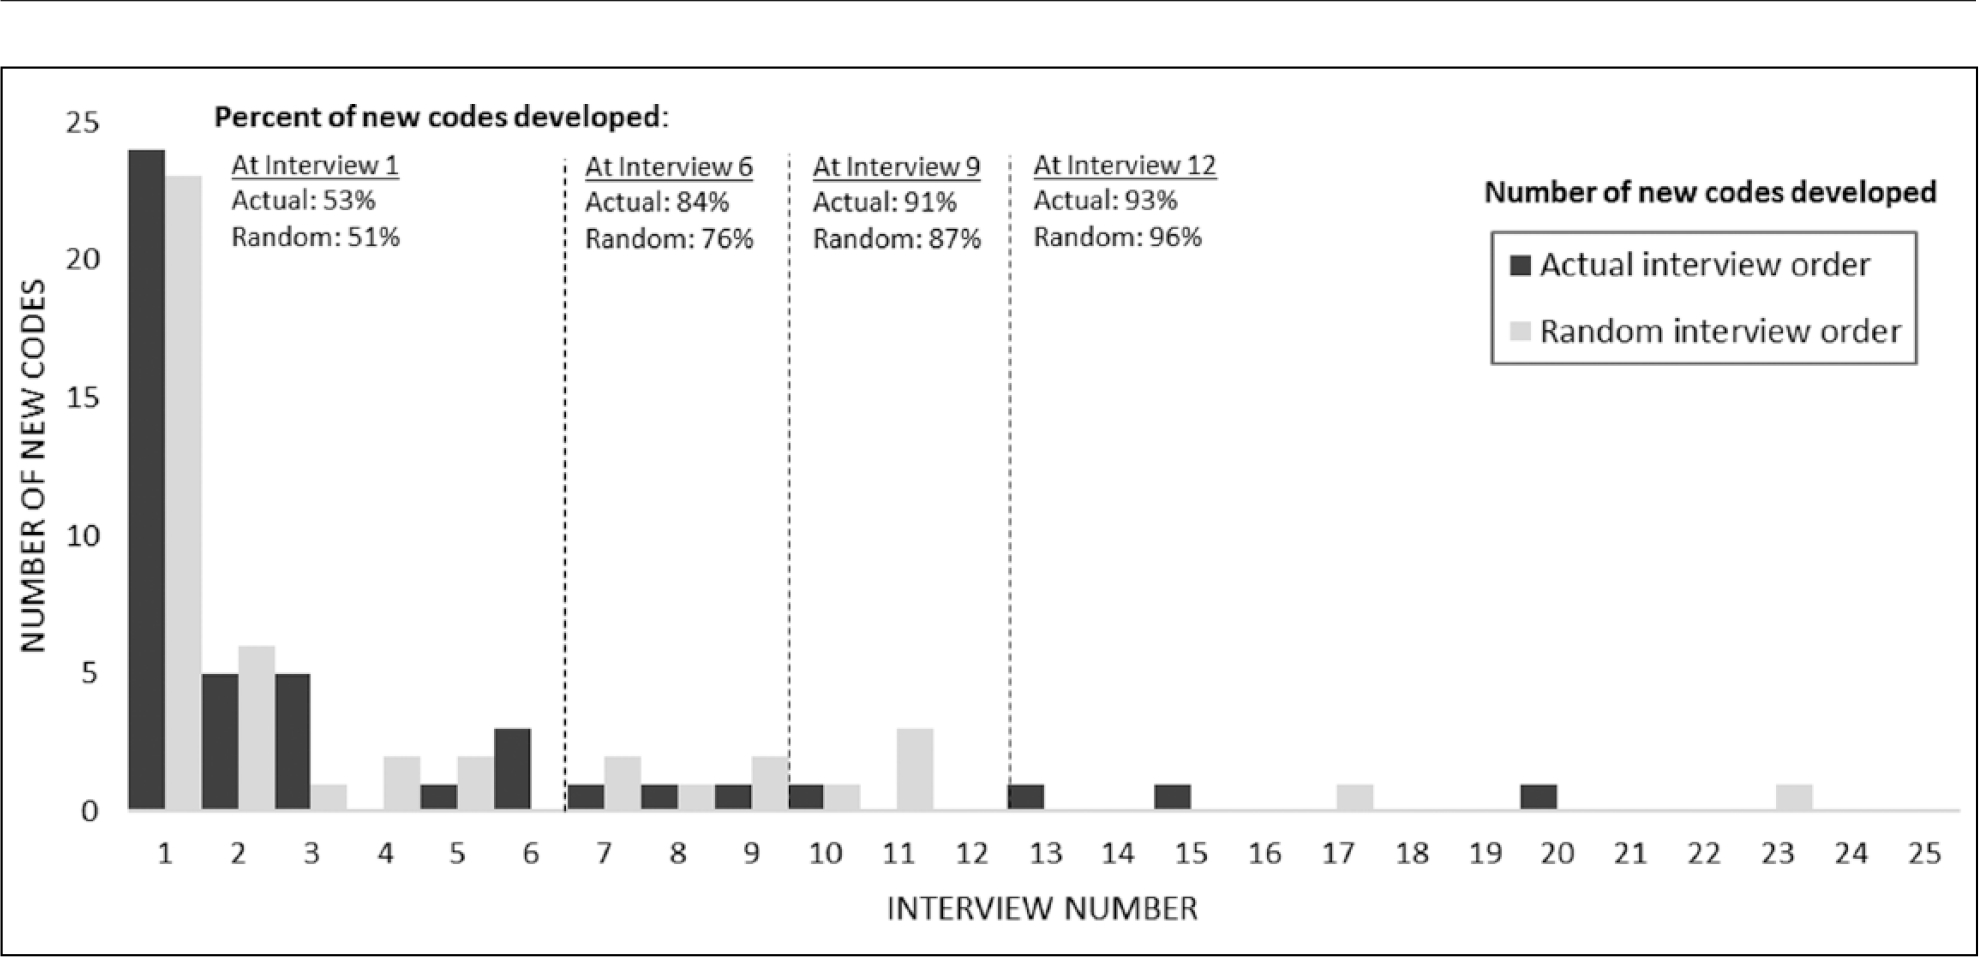
Timing of code development for randomized versus actual order of interviews.
Code definition changes.
Table 1 shows changes to code definitions during the process of code development. Twenty code definitions (44%) did not change at all throughout the code development process. Although there were no strong patterns, we did note that half of the unchanged codes captured more concrete issues or were derived directly from issues asked on the interview guide, and thus may be easier to define up front. Most of these concrete/deductive codes were developed early in the code development process (by Interview 6) and remained unchanged when reviewing later interviews. Examples of unchanged concrete codes include “knowledge of HIV”, “HIV treatment initiated”, “time out of treatment”, “return to treatment”, “incarceration”, and “having enough medication”. The other type of code that remained unchanged were conceptual codes, particularly those capturing emotions. This type of unchanged code was generally developed later in the coding process (after Interview 6), possibly once the nature of the issue was more fully understood, resulting in more inclusive initial code definitions that fit data well, thus requiring no changes. These issues may have been present in earlier interviews but lacked clarity until more data were reviewed. Examples of these unchanged conceptual codes were anger, gratitude, denial of HIV, disclosure, systemic apathy, and drug vacation.
Table 1.
Changes to Code Definitions.
| New Codes Created | Code Definitions Changed (Total) | Expanded Conceptually | Split Into Separate Codes | Added Examples | Edited Inclusion/Exclusion Criteria | Added Negative | Changed Code Name | |
|---|---|---|---|---|---|---|---|---|
|
| ||||||||
| Interviews 1–6 | 38 | 49 | 15 | 2 | 13 | 5 | 9 | 5 |
| Interviews 7–12 | 5 | 10 | 5 | — | 3 | — | 1 | 1 |
| Interviews 13–18 | 1 | 3 | 2 | — | — | 1 | — | — |
| Interviews 19–25 | 1 | 1 | 1 | — | — | — | — | — |
|
| ||||||||
| Total | 45 | 63 | 23 | 2 | 16 | 6 | 10 | 6 |
|
| ||||||||
| Total (inductive) | 34 (76%) | 47 (75%) | 19 (83%) | 2 (100%) | 13 (81%) | 4 (67%) | 6 (60%) | 3 (50%) |
| Total (deductive) | 11 (24%) | 16 (25%) | 4 (17%) | — | 3 (19%) | 2 (33%) | 4 (40%) | 3 (50%) |
For the remaining 25 codes, a total of 63 changes were made to the code definitions (see Table 1). Three quarters (75%) of these changes were made to inductive, content-driven codes; however, changes were still made to the deductive codes after their initial development. As expected, many definition changes occurred early in the code development process. About half (49%) of the changes to code definitions occurred while reviewing Interviews 2 to 4 (data not shown), 78% of definition changes were made by Interview 6, and 92% of definition changes were made by Interview 9 (data not shown). Thus, the code definitions began to stabilize after reviewing nine interviews. When reviewing interviews from the second study population (in-care group), there were very few changes to the code definitions. Therefore, the code structure and definitions initially developed and refined using interviews in the first study population remained applicable to the second study population.
Table 1 also shows the types of changes made to code definitions. Two types of changes were common: expanding the code definition and refining the parameters of code application. One third (36%) of changes to a code definition involved conceptually expanding the definition to be more inclusive of different aspects of the issue captured. This type of change was mostly made to inductive content-driven codes that were refined as further interviews were reviewed and the variation within specific codes was revealed; thus, some code definitions changed multiple times through this process. For example, the code “too sick” was initially defined to capture a one-off physical illness preventing clinic visits, such as a flu-like illness, but was expanded to also capture cumulative exhaustion and fatigue from living with HIV and experiencing multiple HIV-related health conditions that led to missed clinic visits. Similarly, the code “side effects” was initially defined to capture experiences of side effects from taking HIV drugs, then expanded to also include avoidance of HIV drugs due to the side effects caused, and then further expanded to capture compliance with taking HIV drugs to avoid symptoms from not taking these drugs.
The second common type of change involved refining the parameters of code application, such as adding examples of the issue being captured by a code (25%), refining inclusion or exclusion criteria (10%), and adding negative components to a definition (16%). For example, we included lack of support in the code definition of “source of support,” and no experience of HIV stigma in the “HIV stigma” code definition. Other changes to codes were less common, such as editing the code name to better reflect the issue and splitting a code into two separate codes to capture different components of the issue separately. No codes were changed to narrow the code definition.
Code prevalence.
We wanted to determine when the most prevalent codes in the study were developed. Figure 4 represents each code as a separate bar: The location of a code on the x-axis indicates in which interview a code was developed, and the height of the bar indicates the number of interviews in which a code was used. For example, the first four bars indicate that these four codes were developed in Interview 1 and were used in all 25 interviews. The horizontal dashed line shows the average number of interviews in which a code appears in this study, which is 14.5 interviews. Thus, a code appearing above the dashed line has a higher than average prevalence across the data set as a whole. Thus, 24 codes were of high prevalence and 21 of low prevalence in these data. Figure 4 shows that 75% (18/24) of high-prevalence codes were already identified from the first interview, 87% (21/24) by Interview 6, and 92% (22/24) of high-prevalence codes were developed by Interview 9. Therefore, the vast majority of the high-prevalence codes are identified in early interviews. Most of the codes developed after Interview 1 were less prevalent across the data set.
Figure 4.

Code prevalence and timing of code development, by type of code.
Note. The horizontal axis shows when codes were developed during the process of codebook development. All interviews were then coded using the final codebook, and the number of interviews where a code was applied is shown on the vertical axis. IDI = In-depth interview.
Figure 4 also shows the type of codes developed (concrete or conceptual), when each type of code was developed, and the prevalence of different types of codes across these data as a whole. This figure shows that three quarters (18/24) of codes developed from the first interview were concrete codes, with only 25% of codes from the first interview being conceptual. Codes developed after Interview 6 were mainly low-prevalence codes and were almost exclusively conceptual codes (7/9, 78%), with 43% (3/7) of these conceptual codes being high-prevalence codes. Overall, these figures show that codes developed early were high prevalence, concrete codes, while those developed later were less prevalent, conceptual codes, although some high prevalent, conceptual codes were developed in later interviews in the study.
Code saturation.
We did not have an a priori threshold to determine code saturation; rather, it was determined based on results of our analysis. We determined that code saturation was reached at nine interviews based on the combination of code identification (91% of codes were identified), code prevalence (92% of high-prevalence codes were identified), and codebook stability (92% of code definition changes had been made). Although nine interviews were sufficient to identify the range of new issues raised in these data, we asked whether nine interviews were also sufficient to fully understand all of the issues raised, compared with having simply outlined the issues at that point. Were nine interviews also sufficient to reach meaning saturation of the issues across data? We explore this question in the next section.
Part II: Meaning Saturation
Meaning saturation.
In Part II, we assess whether nine interviews were indeed sufficient to gain a comprehensive understanding of the issues raised in the data. Thus, we assess the congruence between code saturation and meaning saturation. To do so, we recorded the information gained about a code from each successive interview in the study, to identify in greater detail what we learn about a code from individual interviews and to assess when individual codes reach meaning saturation. We traced nine codes central to the research question of the original study and included a mix of concrete, conceptual, and high- and low-prevalence codes. Table 2 shows the nine codes we traced, listing the various dimensions of each code that were identified by interview. Meaning saturation was determined to occur at the last interview in which a novel code dimension is identified. As such, the code “feel well” comprises five dimensions that were identified from Interviews 1, 3, and 4; thus, it reached meaning saturation at Interview 4. The code “disclosure” has 13 dimensions, identified across numerous interviews, and it reached meaning saturation at Interview 17. Figure 5 visually depicts when each of these nine codes was developed and when each code reached meaning saturation.
Table 2.
Dimensions of Codes by Interview Where Code Identified.
| Code Dimensions |
||||
|---|---|---|---|---|
| Code Name | By Interview 6 | By Interview 9 | By Interview 12 | After Interview 12 |
|
| ||||
| Feel well | No illness (1) Feel well (3) Know viral load is stable (3) Illness triggers clinic visit (3) Have medication supply (4) |
None | None | None |
| Time | Travel/parking time (1) Consultation time (1) Time for other commitments (1) Clinic time management (1) Time for other treatment (2) Waiting time (3) Lab test time (3) Waste of time (3) |
Taking time off work (9) | None | None |
| Enough medication | Get medication by mail (2) Feeling healthy (4) Taking regular medication (4) Have supply of medication (4) Too busy for appointment (4) Appointment not needed (4) |
No medication triggers appointment (7) | None | None |
| Comfort with virus | From denial to surrender (3) Have good viral load (3) Not going to die (4) Virus is controlled (6) Understand the virus (6) Comfort with virus (6) |
Medication manage virus (7) Gives reason to live (8) In control of disease (9) |
None | None |
| Work commitments | Long work hours (5) Work prioritized (6) Work during clinic hours (6) Inflexible work schedule (6) Work regulations on time off (6) Avoid problems at work (6) |
None | None | Employer questions time off (13) |
| Not a death sentence | Perception of death (1) No longer death sentence (1) Medical staff educate (1) Survive with medication (4) HIV survivors give hope (6) |
Have reason to live (8) | Can live with HIV (10) Live many years (10) Have a future (11) |
HIV survival strategies (16) Positive attitude (16) Education and technology (16) |
| Disclosure | Stigma of disclosure (1) Selective disclosure (1) Disclose close family/partner (1) Conceal HIV for stigma (1) Fear violence from disclosure (3) Delayed disclosure (3) Others disclosed status (6) |
Clinic confidentiality (7) Disclosure to others HIV+ (8) Disclosure to friends (9) |
Workplace disclosure (11) | Negative disclosure experience (13) Public disclosure (17) |
| Responsibility (resp.) for health | Self-resp. for health (1) Resp. for others (blood safety) (3) Military instills health resp. (4) Sexual resp. (don’t spread HIV) (6) Lack of resp. (caused HIV) (6) Resp. for HIV medication (6) Resp. use VA services (6) |
Resp. for HIV knowledge (7) Influences on health resp. (7) Prioritize resp. (8) Resp. increases with age (9) Resp. to monitor health (9) |
Resp. know viral load (10) Resp. for clinic visits (12) |
Clinic resp. for follow-up (15) Determination to survive (18) AIDS triggers health resp. (18) Resp. as HIV advocate (25) |
| HIV stigma | No stigma/conceal status (1) Social stigma (1) Witness others stigma (1) Health treatment stigma (3) Historic violence stigma (3) Workplace stigma (3) Friends avoid you (5) |
Gay stigma (9) Education on stigma (9) |
Stress of stigma (10) Sexual disease stigma (12) Health staff attitude (12) Friends fear death (12) |
Self-stigma (13) Intimate partner stigma (13) Disclose to avoid stigma (17) Family stigma (18) Stigma of HIV death (22) Job seekers disclosures (23) Health insurance stigma (23) Perception of VA stigma (24) |
Note. Numbers in parentheses denote the interview number where the code was identified.
Figure 5.
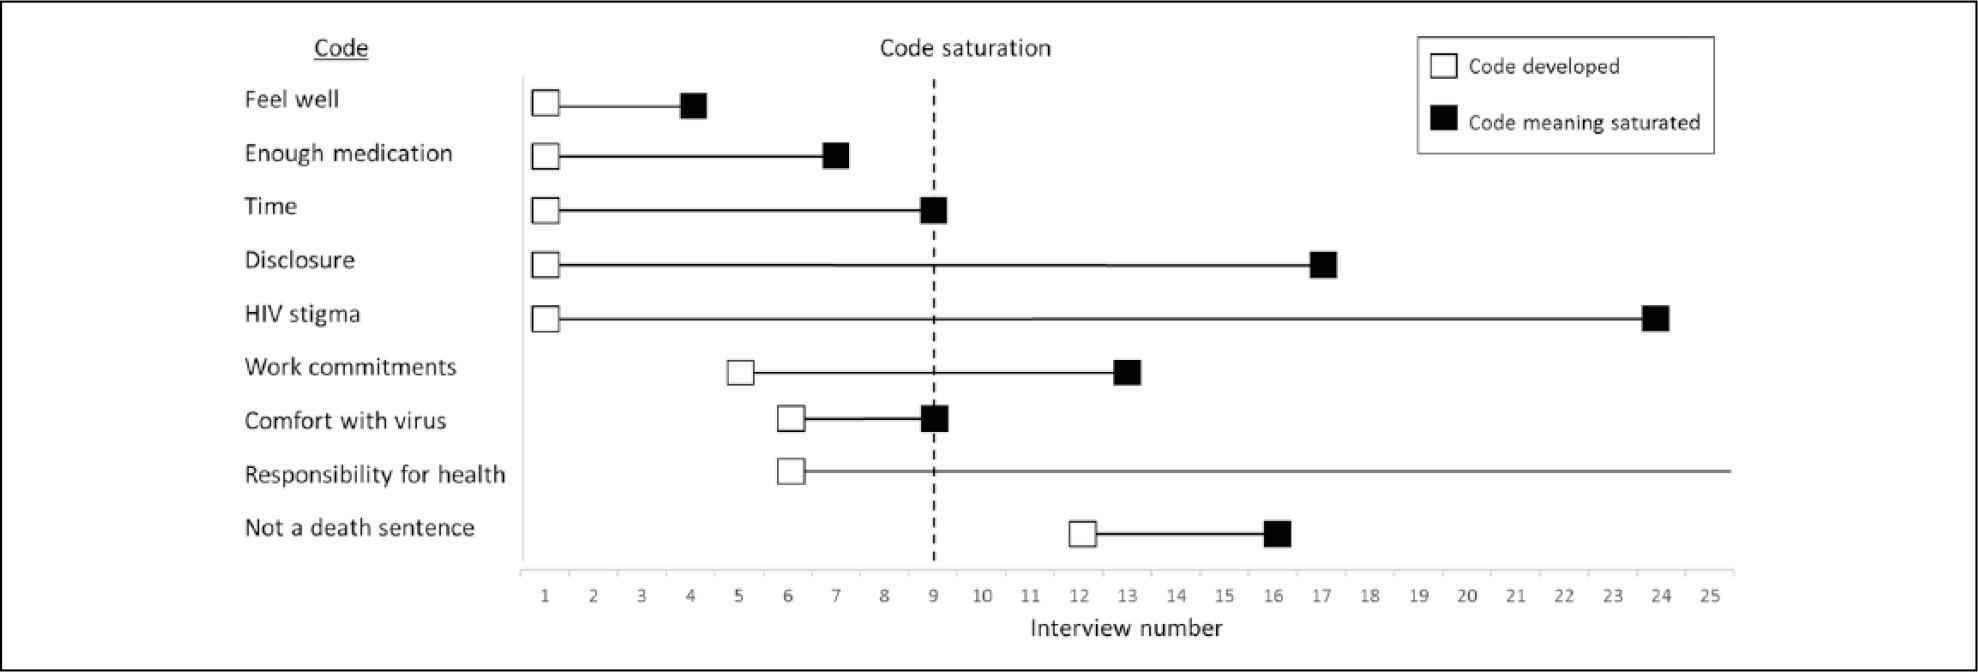
Timing of code development versus timing of meaning saturation.
Note. Code saturation is depicted at Interview 9 which reflects our finding from earlier analyses and refers to code saturation across the entire data set.
Table 2 shows that many dimensions of codes are captured in early interviews. By Interview 6, multiple dimensions of each code are already identified, with one code reaching meaning saturation at this point. By Interviews 9 and 12, fewer new dimensions are added to each code, and five codes have now reached meaning saturation. After Interview 12, several codes have not reached meaning saturation, with multiple dimensions of codes still being identified until the last interview. Therefore, a sample size of nine interviews is sufficient for capturing all dimensions of some codes but not others; we explore this further below. Table 2 also highlights that meaning saturation requires a range of interviews, with different interviews contributing a new dimension or nuance of the code toward a comprehensive understanding of the issue. For example, the various dimensions of the code “disclosure” were identified from nine different interviews, with some interviews providing several dimensions of disclosure. Even a concrete code such as “time” requires four different interviews to fully capture all dimensions and thus understand the issue. Therefore, a code may be initially identified in one interview, but it requires multiple interviews to capture all dimensions of the code to fully understand the issue. This implies that assessing saturation may need to go beyond code saturation (whereby codes are simply identified) toward meaning saturation (where codes are fully understood), which requires more data.
Figure 5 demonstrates that individual codes reached meaning saturation at different points in these data. While some codes reached meaning saturation by Interview 9, other codes reached meaning saturation much later or not at all. Codes representing concrete issues reached meaning saturation by Interview 9 or sooner. For example, the concrete codes “feel well,” “enough medications,” and “time” reached meaning saturation by Interviews 4, 7, and 9, respectively. However, codes representing more conceptual issues reached meaning saturation much later in the data, between Interviews 16 and 24. For example, the codes “not a death sentence,” “disclosure,” and “HIV stigma” reached meaning saturation by Interviews 16, 17, and 24, respectively. The code “responsibility for health” did not reach meaning saturation, as new dimensions were still identified at the last interview conducted.
Figure 5 also visually depicts the point at which a code was developed and the point at which all dimensions of that code were captured, thus highlighting the number of additional interviews after code creation that are needed to gain a full understanding of each code (as depicted by the length of the horizontal line). This highlights that fully understanding all dimensions of conceptual codes requires much more data than fully understanding concrete codes. For example, the concrete code “feel well” required only four interviews to identify all its dimensions, whereas the conceptual code “disclosure” required 17 interviews to identify its multiple dimensions. For some conceptual codes, the more tangible concrete dimensions of that code are captured early, whereas the more abstract dimensions require more data to capture all dimensions. For example, in the code “HIV stigma”, the concrete types of stigma are identified from early interviews, but more data are required to reveal the more nuanced dimensions of stigma such as self-stigma, stress of stigma, stigma of dying from HIV, and disclosure of HIV status to avoid stigma (see Table 2). In sum, a sample size of nine would be sufficient to understand the concrete codes in these data, but it would not be sufficient to fully understand conceptual codes or conceptual dimensions of these concrete codes.
We asked if meaning saturation is influenced by whether a code is of high or low prevalence in these data but found no clear patterns by code prevalence. In Figure 5, high-prevalence codes of “time,” “disclosure,” “HIV stigma,” and “responsibility for health” reached meaning saturation between Interviews 9 and 24 or did not reach saturation. Low-prevalence codes reached meaning saturation between Interviews 6 and 16. This suggests that codes found more frequently in data may not require fewer interviews to understand the issue than codes found less frequently. In these data, both the high- and low-prevalence codes were equally important for the research question of the original study.
Discussion
This study contributes to a limited body of methodological research assessing saturation in qualitative research. We sought to document two approaches to saturation, the sample sizes needed to reach saturation for each approach, and whether the nature of codes influences saturation. We used our results to develop parameters that influence sample sizes for reaching saturation.
Our results show that code saturation was reached after nine interviews; even after adding the second study population, saturation was not altered. We also show that the first interview conducted contributed more than half (53%) of new codes and three quarters (75%) of high-prevalence codes, with subsequent interviews adding a few new codes each until saturation. Thus, by nine interviews, the range of common thematic issues was identified, and the codebook had stabilized. These results are remarkably similar to those of Guest et al. (2006), who identified that data saturation occurred between seven and 12 interviews, with many of the basic elements of themes present between Interviews 1 and 6. Our findings also concur with Namey, Guest, McKenna, and Chen (2016), who identified that saturation occurred between eight and 16 interviews, depending on the level of saturation sought. However, our study provides greater precision than previous work by delineating codes developed in individual interviews (rather than in batches of six as done by Guest et al.); thus, we identify the significant contribution of the first interview to code development and specify the timing and trajectory of code saturation more precisely.
Code saturation is often used during data collection to assess saturation, by claiming that the range of issues pertinent to the study topic have been identified and no more new issues arose. However, our results show that reaching code saturation alone may be insufficient. Code saturation will identify issues and lead to a robust codebook, but more data are needed to fully understand those issues. It is not only the presence or frequency of an issue that contributes to saturation but more importantly the richness of data derived from an issue that contributes to understanding of it (Emmel, 2015; Morse, 1995):
[A] mistaken idea about saturation is that data become saturated when the researcher has “heard it all” . . . When used alone, this criterion is inadequate and may provide a shallow . . . understanding of the topic being studied.
(Morse, 2015, p. 587)
Thus, code saturation may be reached with few interviews as it provides an outline of the main domains of inquiry, but further data are needed to provide depth, richness, and complexities in data that hold important meaning for understanding phenomena of interest.
Perhaps the most compelling results of our study relate to our second approach of assessing meaning saturation and how code characteristics influence meaning saturation, which has not been assessed in other studies. Our results show that codes are not uniform; rather, they reach meaning saturation at different points or do not reach saturation. For some codes, reaching code saturation was also sufficient to achieve meaning saturation, but for other codes, much more data were needed to fully understand the issue. We found that high-prevalence concrete codes were typically identified in early interviews and reached meaning saturation by nine interviews or sooner. However, codes identified in later interviews were low-prevalence conceptual codes that required more data to reach meaning saturation, between 16 and 24 interviews, or they did not reach meaning saturation. Thus, a sample size of nine—as suggested by code saturation—would only be sufficient to develop a comprehensive understanding of explicit concrete issues in data and would miss the more subtle conceptual issues and conceptual dimensions of concrete codes, which require much more data. Another way to consider this is that understanding any code requires a range of interviews, with different interviews contributing new dimensions that build a complete understanding of the issue. Even concrete codes required between four and nine interviews to understand all dimensions; however, conceptual codes required an even greater range of data (i.e., between 4 and 24 interviews) to fully capture their meaning. Therefore, a code may be identified in one interview and repeated in another, but additional interviews are needed to capture all dimensions of the issue to fully understand it. These findings underscore the need to collect more data beyond the point of identifying codes and to ask not whether you have “heard it all” but whether you “understand it all”—only then could data saturation be claimed. Achieving meaning saturation also necessitates using an iterative process of sampling to monitor diversity, clarity, and depth of data, and to focus data collection on participants or domains that are less understood.
We found no pattern of saturation by code prevalence. Issues raised more frequently in data did not reach meaning saturation sooner than issues mentioned less frequently. Therefore, code prevalence is not a strong indicator of saturation, as it provides no indication of when the meaning of that issue may be reached. This should not be surprising because “it is not so much the frequency with which data relevant to a theme occurs that is important but rather whether particular data segments allow a fruitful analytic argument to be developed and tested” (Hammersley, 2015, p.688). Code prevalence should also not be equated with code importance; in other words, if most high-prevalence codes have been identified, this does not necessarily equate to important issues having been captured. Less prevalent codes may contribute equally to understanding themes in data; thus, they become important not for their frequency but for their contribution to understanding. Morse (2015) described this well by highlighting that data accrue along a normal curve, with common data in the middle and less common data at the tails of the curve. However,
in qualitative inquiry, the data at the tails of the curve are equally important . . . The risk is that the data in the center of the curve will overwhelm the less common data, and we will ignore the equally significant data at the tails. (p. 587)
Therefore, justifying saturation by capturing high-prevalence codes misses the point of saturation; striving for meaning saturation flattens the curve to treat codes equally in their potential to contribute to understanding phenomena. This stresses the importance of demonstrating that the meaning of codes were captured instead of counting the prevalence of codes when claiming saturation.
Our results highlight that saturation is influenced by multiple parameters (Figure 6). These parameters can be used in a research proposal to estimate sample sizes needed a priori for a specific study or they can be used to demonstrate the grounds on which saturation was assessed and achieved thereby justifying the sample size used. Each parameter acts as a fulcrum and needs to be “weighed up” within the context of a particular study. A sample size is thus determined by the combined influence of all parameters rather than any single parameter alone. For example, where some parameters indicate a smaller sample for saturation and others suggest a larger sample, the combined influence would suggest the need for an intermediate sample size.
Figure 6.
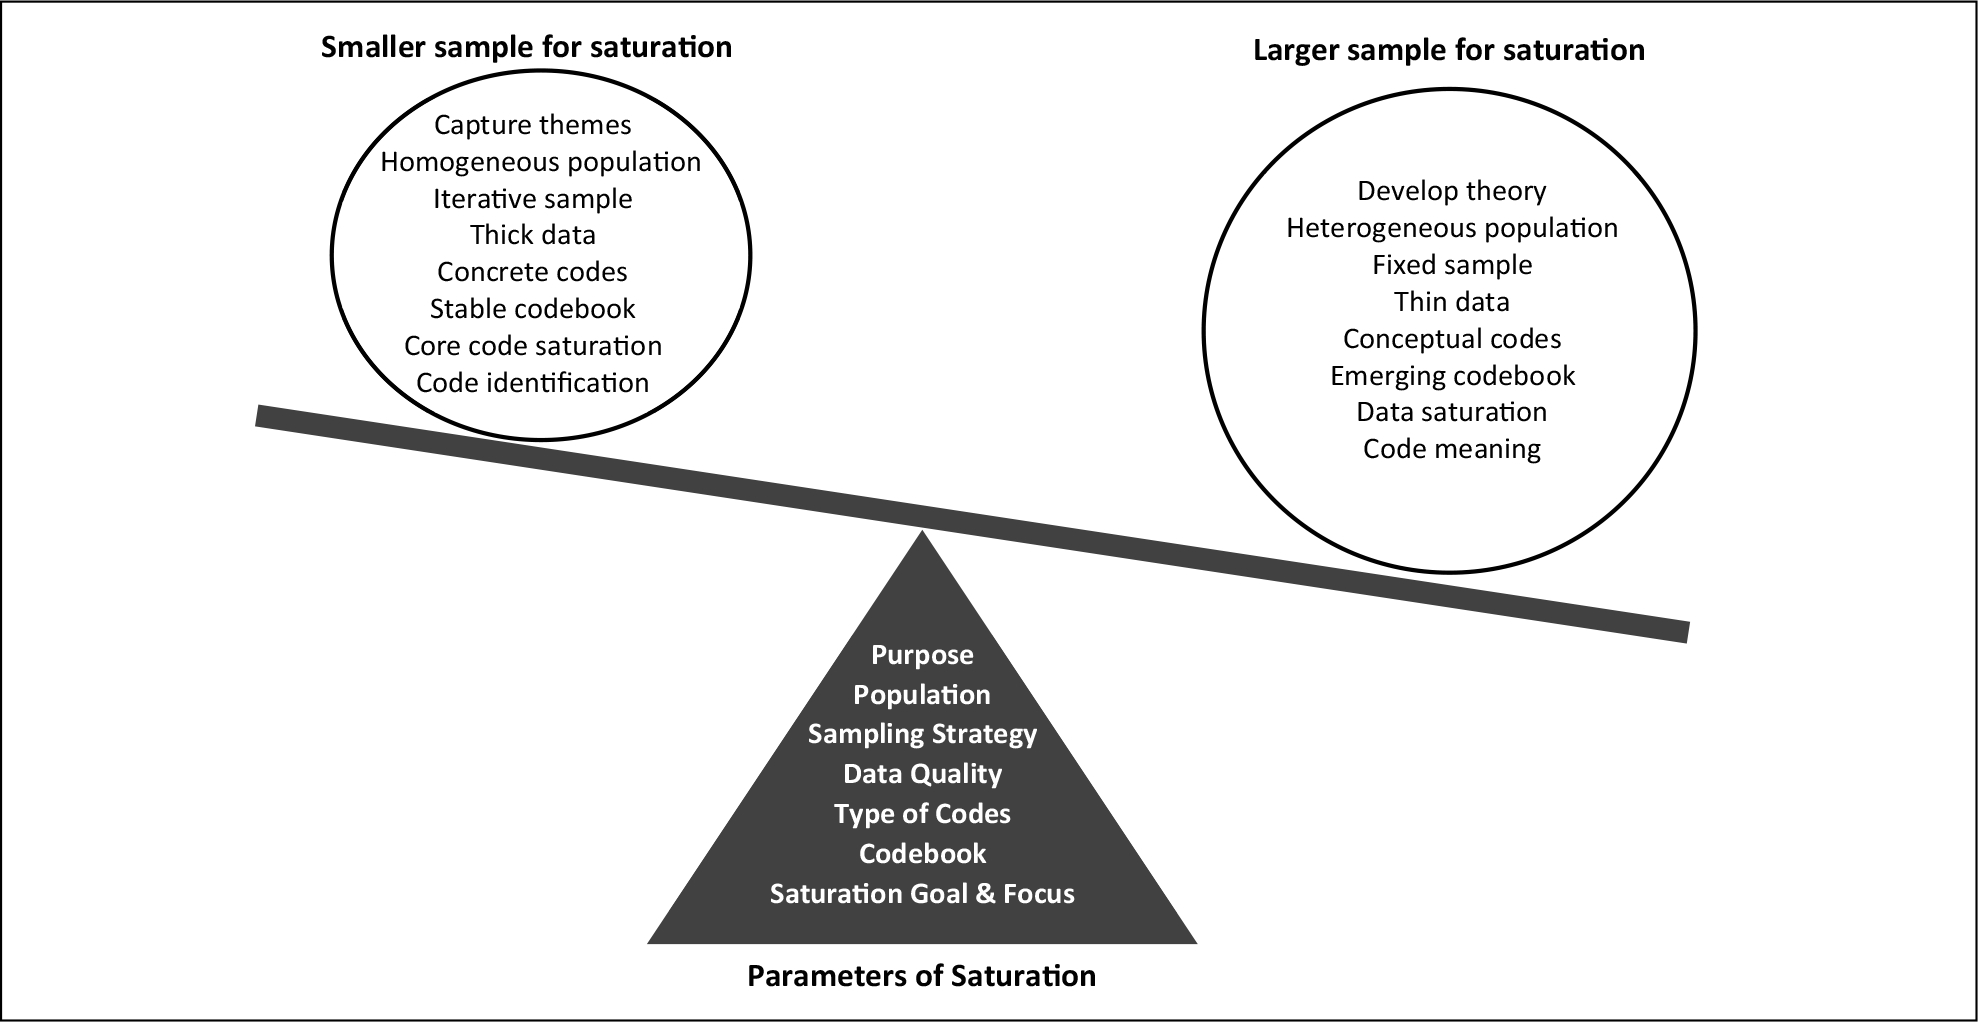
Parameters of saturation and sample sizes.
The study purpose influences saturation. We show that code saturation may be reached at nine interviews, which may be sufficient for a study aiming to outline broad thematic issues or to develop items for a survey instrument, but a larger sample is needed if meaning saturation is needed to understand or explain complex phenomena or develop theory. Characteristics of the study population influence saturation. Our study included a relatively homogeneous sample of veterans receiving HIV care at a specific clinic, but we anticipate a larger sample size would be needed to achieve both code and meaning saturation if the study population were more diverse. The sampling strategy used may influence saturation, whereby iterative sampling may require a smaller sample to reach saturation than using fixed recruitment criteria; however, iterative sampling may also uncover new data sources that ultimately expand the sample size. Thus, sampling strategies may have differing influences on sample size. Data quality influences saturation, as “thick” data provide deeper, richer insights than “thin” data; however, the latter may be sufficient to achieve code saturation if that aligns with the study goals. The type of codes developed influences saturation. We show that a smaller sample is needed to capture explicit, concrete issues in our data, and a much larger sample is needed to capture subtle or conceptual issues. The complexity and stability of the codebook influences saturation. Our codebook included a broad range of codes, including explicit, subtle, and conceptual codes; therefore, some codes stabilized and reached saturation, while dimensions of other codes were still emerging at 25 interviews. Finally, the goal and focus of saturation influence where saturation is achieved. Our results show that “reaching saturation” is not a uniform accomplishment. Achieving code saturation is different from reaching meaning saturation, and each requires different sample sizes. Individual codes also reach saturation at different points in the data, and overall percentage of saturation desired may differ between studies or researchers (e.g., 80% vs. 90%). Therefore, identifying the goal of saturation (e.g., in core codes or in all data), the focus of saturation (e.g., code saturation or meaning saturation), and the level of saturation desired (e.g., 80%, 90%) also determines the sample size and provides greater nuance in determining where saturation is achieved.
Assessing saturation is more complex than it appears at the outset. Researchers need to provide a more nuanced description of their process of assessing saturation, the parameters within which saturation was achieved and where it was not achieved and why. This declaration should not be viewed as a limitation but an indicator of researchers’ attention to assessing saturation and awareness of how it applies to a particular study.
Study Limitations
Our analysis of meaning saturation was conducted on a diverse range of codes, but not all codes in our study were used for this analysis. We encourage further methodological research to confirm whether the patterns we found can be replicated in other study data. Also, we assessed saturation using data for applied qualitative research, in which the study purpose and study participants may be more defined than in other types of qualitative research. Our results should not be taken as generic for other types of data or approaches to qualitative research. Finally, qualitative researchers may have different styles of developing codes (i.e., broad or specific codes), and our results may also reflect our code development style.
Conclusion
“Saturation is an important component of rigor. It is present in all qualitative research, but unfortunately, it is evident mainly by declaration” (Morse, 2015, p. 587). Our study provides methodological research to document two different approaches to saturation and draws out the parameters that influence saturation in each approach to guide sample size estimates for qualitative studies. We identified that a small number of interviews can be sufficient to capture a comprehensive range of issues in data; however, more data are needed to develop a richly textured understanding of those issues. How much additional data are needed will depend on a range of parameters of saturation, including the purpose of the study, study population, types of codes, and the complexity and stability of the codebook. Using these parameters of saturation to guide sample size estimates a priori for a specific study and to demonstrate within publications the grounds on which saturation was assessed or achieved will likely result in more appropriate sample sizes that reflect the purpose of a study and the goals of qualitative research.
Acknowledgments
The authors would like to acknowledge the contributions of those involved in the original RETAIN study, including the veterans who participated in the interviews and the following individuals: Jed Mangal, MD, Runa Gokhale MD., Hannah Wichmann, and Susan Schlueter-Wirtz, MPH.
Funding
The author(s) disclosed receipt of the following financial support for the research, authorship, and/or publication of this article: The original RETAIN study was funded by the Emory Center for AIDS Research (Grant P30AI050409) and the Infectious Disease Society of America Medical Scholars Program. The authors did not receive financial support for the secondary data analysis presented in this study.
Biographies
Monique M. Hennink, PhD, is an associate professor in the Hubert Department of Global Health, Rollins School of Public Health, Emory University, Atlanta.
Bonnie N. Kaiser, PhD, MPH, is a post-doctoral associate at the Duke Global Health Institute at Duke University, North Carolina.
Vincent C. Marconi, MD, is a professor of medicine at the Division of Infectious Diseases and professor of global health at the Rollins School of Public Health. He is an Infectious Disease physician and the Director of Infectious Diseases Research at the Atlanta Veterans Affairs Medical Center.
Footnotes
Declaration of Conflicting Interests
The author(s) declared no potential conflicts of interest with respect to the research, authorship, and/or publication of this article.
References
- Attia S, Egger M, Müller M, Zwahlen M, & Low N (2009). Sexual transmission of HIV according to viral load and antiretroviral therapy: Systematic review and meta-analysis. AIDS, 23, 1397–1404. [DOI] [PubMed] [Google Scholar]
- Bowen G (2008). Naturalistic inquiry and the saturation concept: A research note. Qualitative Research, 8, 137–152. [Google Scholar]
- Bryant A, & Charmaz K (Eds.). (2007). The SAGE handbook of grounded theory. London: Sage. [Google Scholar]
- Bryman A (2012). Social research methods (4th ed.). Oxford, UK: Oxford University Press. [Google Scholar]
- Carlsen B, & Glenton C (2011). What about N? A methodological study of sample-size reporting in focus group studies. BMC Medical Research Methodology, 11, Article 26. [DOI] [PMC free article] [PubMed] [Google Scholar]
- Cohen M, Chen Y, McCauley M, Gamble T, Hosseinipour M, Kumarasamy N, . . . Fleming TR (2011). Prevention of HIV-1 infection with early antiretroviral therapy. New England Journal of Medicine, 365, 493–505. [DOI] [PMC free article] [PubMed] [Google Scholar]
- Emmel N (2015). Themes, variables, and the limits to calculating sample size in qualitative research: A response to Fugard and Potts. International Journal of Social Research Methodology, 18, 685–686. [Google Scholar]
- Francis J, Johnson M, Robertson C, Glidewell L, Entwistle V, Eccles M, & Grimshaw J (2010). What is an adequate sample size? Operationalising data saturation for theory-based interview studies. Psychology & Health, 25, 1229–1245. [DOI] [PubMed] [Google Scholar]
- Fusch P, & Ness L (2015). Are we there yet? Data saturation in qualitative research. The Qualitative Report, 20, 1208–1416. [Google Scholar]
- Glaser B, & Strauss A (1967). The discovery of grounded theory: Strategies for qualitative research. Chicago: Aldine. [Google Scholar]
- Green J, & Thorgood N (2009). Qualitative methods for health research (2nd ed.). London: Sage. [Google Scholar]
- Guest G, Bunce A, & Johnson L (2006). How many interviews are enough? An experiment with data saturation and variability. Field Methods, 18, 59–82. [Google Scholar]
- Hall HI, Gray KM, Tang T, Li J, Shouse L, & Mermin J (2012). Retention in care of adults and adolescents living with HIV in 13 US areas. Journal of Acquired Immune Deficiency Syndromes, 60, 77–82. [DOI] [PubMed] [Google Scholar]
- Hammersley M (2015). Sampling and thematic analysis: A response to Fugard and Potts. International Journal of Social Research Methodology, 18, 687–688. [Google Scholar]
- Kerr C, Nixon A, & Wild D (2010). Assessing and demonstrating data saturation in qualitative inquiry supporting patient-reported outcomes research. Expert Review of Pharmacoeconomics & Outcomes Research, 10, 269–281. [DOI] [PubMed] [Google Scholar]
- Malterud K, Siersma V, & Guassora A (2015). Sample size in qualitative interview studies: Guided by information power. Qualitative Health Research. Advance online publication. doi: 10.1177/1049732315617444 [DOI] [PubMed] [Google Scholar]
- MaxQDA Software for qualitative analysis, 1989–2016. Berlin, Germany: VERBI Software - Consult - Sozialforschung GmbH. [Google Scholar]
- Morse J (1995). The significance of saturation [Editorial]. Qualitative Health Research, 5, 147–149. [Google Scholar]
- Morse J (2000). Determining sample size [Editorial]. Qualitative Health Research, 10, 3–5. [Google Scholar]
- Morse J (2015). Data were saturated . . . [Editorial]. Qualitative Health Research, 25, 587–588. [DOI] [PubMed] [Google Scholar]
- Namey E, Guest G, McKenna K, & Chen M (2016). Evaluating bang for the buck: A cost-effectiveness comparison between individual interviews and focus groups based on thematic saturation levels. American Journal of Evaluation, 37, 425–440. doi: 10.1177/1098214016630406 [DOI] [Google Scholar]
- O’Reilly M, & Parker N (2012). “Unsatisfactory saturation”: A critical exploration of the notion of saturated sample sizes in qualitative research. Qualitative Research, 13, 190–197. [Google Scholar]
- Patton M (1990). Qualitative research & evaluation methods (2nd ed.). Newbury Park, CA: Sage. [Google Scholar]
- Sandelowski M (1995). Sample size in qualitative research. Research in Nursing & Health, 18, 179–183. [DOI] [PubMed] [Google Scholar]
- Vital signs: HIV prevention through care and treatment—United States. (2011). Morbidity Mortality Weekly Report, 60, 1618–1623. [PubMed] [Google Scholar]