

Abstract
Purpose:
To investigate the choroidal vascularity index (CVI) and morphological features of the choroid in anisometropic amblyopia.
Methods:
In this prospective cross-sectional study, 39 patients with unilateral anisometropic amblyopic patients and 33 eyes of 33 healthy control participants were involved. These participants were examined in terms of axial length (AL), spherical equivalent (SE), central macular thickness (CMT), choroidal thickness (CT), total choroidal area (TCA), luminal area (LA), stromal area (SA), LA/SA ratio, and CVI. All parameters were compared between amblyopic eyes, healthy fellow eyes, and healthy control eyes. The Shapiro–Wilk tests, Chi-square test, the paired t-test, Wilcoxon signed-rank test, Mann–Whitney U test, Kruskal–Wallis test, and Pearson/Spearman correlation tests were used.
Results:
In the hyperopic patients; SE, subfoveal CT, nasal CT, temporal CT, TCA, LA, SA, and CMT were greater in amblyopic eyes than in healthy fellow eyes and control eyes (P < 0.001, P < 0.001, P < 0.001, P < 0.001, P < 0.001, P < 0.001, and P < 0.001, respectively), and CVI, LA/SA ratio, and AL were smaller in amblyopic eyes than in healthy fellow eyes and control eyes ([P < 0.001, P = 0.006], P < 0.001, and P < 0.001, respectively). In the myopic patients, subfoveal CT, nasal CT, temporal CT, TCA, LA, SA values were statistically smaller in amblyopic eyes than in healthy eyes and control eyes ([P < 0.001, P = 0.002), [P = 0.004, P = 0.012], [P = 0.012, P = 0.032], [P < 0.001, P = 0.013], [P < 0.001, P = 0.024], and [P < 0.001, P = 0.047], respectively). The differences in the AL and choroidal parameters were due to myopia and hyperopia.
Conclusion:
The choroidal structural parameters of the amblyopic eyes were different from that of the healthy eyes.
Keywords: Anisometropia, axial length, binarization, choroidal vascularity index, enhanced-depth imaging optical coherence tomography
Amblyopia is a preventable serious disorder that can be defined as reduced best-corrected visual acuity (BCVA) in one or two eyes during the developmental period of the visual system. Anisometropia is the second most common cause of amblyopia after strabismus.[1] Recently, there is no consensus about the threshold for anisometropia, one or more diopter (D) interocular difference is being accepted by some authors.[2,3] The lack of a complete cure for the disease after the childhood period is the main reason for studies to investigate the pathophysiology of amblyopia.
Optical coherence tomography (OCT) technologies have been developing day by day and it is well known that OCT allows ophthalmologists in retinochoroidal diseases to diagnose, categorize, and follow-up such as age-related macular degeneration, Vogt–Koyanagi–Harada disease, and central serous chorioretinopathy. In this context, ocular structures, especially central macular thickness, retinal nerve fiber layer, and choroidal thickness (CT) have been investigated in anisometropic patients by authors using OCT.[4,5] In general, it was found that CT was thicker in amblyopic eyes than in non-amblyopic eyes.[6,7]
The choroid is a densely vascularized tissue that has the highest blood flow in the human body. It supplies oxygen and nutrients to the outer retinal layers and thermoregulates the retina. Organic pathologies have not been considered present in the visual system of amblyopic eyes. In contrast, OCT studies reported the thickening in CT in hyperopic anisometropic patients.[6,7]
Because the choroid is a vascular structure, investigation of CVI may be more useful than CT. CVI is a novel imaging tool for the measurement and analysis of the choroidal vascular system. Binarization analyses are used to measure the CVI.[8] In this analysis, the total choroidal area (TCA), luminal area (LA), and CVI can be measured. A few studies have investigated the CVI in amblyopia and insufficient data await clarification.[9,10,11] For example, Araki et al.[9] found similar choroidal vessel density among amblyopic and healthy eyes. In contrast, Baek et al.[10] reported that the mean CVI of amblyopic eyes was bigger than control eyes. These two authors investigated the CVI in hyperopic patients. Wu et al.[12] reported lower choroidal vascularity in myopes. In contrast, Yazdani found CVI greater in myopes than in healthy participants.[13]
We wanted to design this study because of the role of choroidal tissue in ocular growth and the development of the refractive error.[14]
In the present study, we evaluated and compared the CVI in anisometropic eyes and healthy fellow eyes using the enhanced-depth imaging (EDI) mode of OCT. According to the results, we aimed to understand whether CVI was affected more in amblyopic eyes than in healthy eyes.
Methods
Before starting the study, ethical approval was obtained from the local ethics committee. From each participant, a written informed consent form was obtained and all participants agreed to participate in the present study voluntarily. The present study was in accordance with the tenets of the Declaration of Helsinki.
Patients with anisometropic amblyopia were selected from the participants who applied to our outpatient clinic between March 2021 and September 2021.
This study included 39 Turkish anisometropic subjects with a difference of at least 1.00 D between the two eyes in the spherical equivalent component. 1.00 D difference between two eyes was accepted as anisometropia. In addition, this study included 33 healthy control eyes of 33 participants. Amblyopic eyes were defined as “amblyopic eyes,” the fellow eyes of the same subjects were defined as “healthy eyes,” and healthy eyes of healthy participants were defined as “control eyes.” The difference in the best-corrected visual acuity (BCVA) between study and healthy eyes was at least two lines of Snellen acuity. The BCVA of healthy and control eyes was 10/10 in all participants.
Participants who had a history of intraocular surgery, presence of any intraocular diseases (including glaucoma, uveitis, and retinochoroidal pathologies), history of laser treatment and trauma, active ocular infection (conjunctivitis, keratitis), using any eye drops, intraocular pressure (IOP) greater than 21 mmHg, and inability to comply with the OCT examination were excluded from the study.
All participants underwent a full ophthalmologic examination including measurement of refraction, BCVA using the Snellen chart, IOP measurement with Goldmann applanation tonometry, anterior segment examination with slit-lamp biomicroscopy, and fundus examination. The manifest refraction was measured using an automatic refractometer (Topcon KR-8900; Topcon Corporation, Tokyo, Japan.) The spherical equivalent refractive error was calculated by adding the sum of the sphere power with half of the cylindrical power. Nidek AL-Scan (Nidek Co., Aichi, Japan) optical biometer was used to measure the axial length (AL).
Enhanced depth imaging (EDI) mode was used from Heidelberg Spectralis® OCT (Heidelberg Engineering) (excitation wavelength = 840 nm, 40,000 A-scans/s, and 5 ml axial resolution) to image the choroid after dilatation of the pupil with 1% tropicamide. A 6-mm horizontal single line scan, through the fovea between 10.00 and 12.00 in the morning (to avoid the diurnal variation of the CT). CT measurements were performed by measuring between the sclera and retinal pigment epithelium using a caliper system in the OCT device software manually. Measurements were taken at the subfoveal region, 1000 mm nasal to the fovea, and 1000 mm temporal to the fovea. Central macular thickness (CMT) measurement was also performed. Two masked and independent ophthalmologists (MBU and SC) measured CT to eliminate inter-observer variability. The mean value of the measurements was calculated. If more than a 15% difference was detected between the reports of the two ophthalmologists, these measurements were excluded from the study.
Image binarization
As described by Agrawal et al.,[15] the raster scan passing through the fovea was selected and segmented to assess CVI. A public domain software, Fiji (http://fiji.sc/Fiji) was used for image binarization.[16] Total choroidal area (TCA) was selected with the polygonal tool using manual drawing. It was added to the ROI manager. As an upper border, the retina pigment epithelium was used and as a lower border, the choroid-scleral junction was used. After images were converted to an 8-bit form, Niblack’s auto local threshold was applied. The stromal area (SA) was highlighted and subsequently added to the ROI manager after applying the color threshold tool. TCA and SA in the ROI manager were selected and merged via an “AND” operation. This third area was added to the ROI manager. The first area in the ROI manager represented the TCA, whereas the third merged area represented the luminal area (LA). The CVI was calculated by dividing the LA by the TCA. Fig. 1 shows examples of images before and after binarization with SD-OCT.
Figure 1.
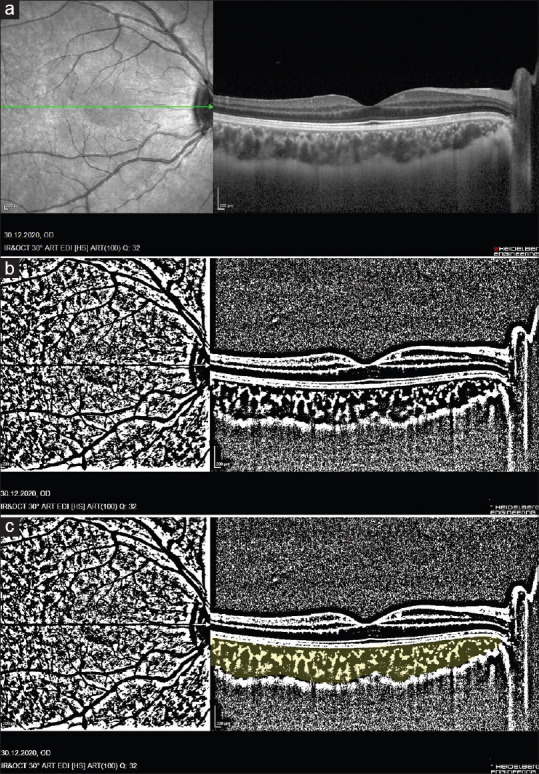
(a) Enhanced-depth optical coherence tomography image. (b) The image was binarized using Niblack’s auto-local threshold. (c) The color threshold tool was used to select the dark pixels, representing the luminal area
Statistical analysis
Statistical analysis of the data was performed using the SPSS (SPSS Inc., Chicago, IL, USA) package program. The normal distribution of the data was tested using the Shapiro–Wilk test. Descriptive statistics for normally distributed continuous data are reported as mean ± standard deviation (SD) and non-normally distributed data with median (min–max). Descriptive statistics for categorical variables are presented as frequency and percentage. Proportion comparisons between research groups were performed using the Chi-square test depending on the sample size in the crosstab cells. A comparison of continuous data between the two independent groups was conducted using Student’s t-test for normally distributed data, and Mann–Whitney U test for non-normally distributed data. A comparison of continuous data between the two dependent groups was conducted using the paired t-test for normally distributed data, and Wilcoxon signed-rank test for non-normally distributed data. The Kruskal–Wallis test was used in the comparison of continuous data between more than two independent groups because the data were not normally distributed. Correlations between numerical variables were investigated with Pearson or Spearman correlation coefficient in accordance with the data normal distribution. Simple linear regression analysis was used to determine the cause and effect relationship between two numerical variables with significant correlations. The statistical significance level was accepted as P < 0.05.
Results
Data of 39 patients and 33 healthy control subjects were analyzed in the study. Descriptive statistics for the participants are presented in Tables 1 and 2. The comparison of subfoveal CT, nasal CT, temporal CT, TCA, LA, SA, CVI, LA/SA ratio, CMT, AL, K1, K2, and SE values between control eyes, amblyopic, and healthy eyes of hyperopic amblyopic patients are presented in Table 3. The comparison of subfoveal CT, nasal CT, temporal CT, TCA, LA, SA, LA/SA ratio, CMT, AL, K1, K2, and SE values between control eyes, amblyopic, and healthy eyes of myopic amblyopic patients are presented in Table 4. The distributions of TCA, LA, SA, CVI, and LA/SA ratio between amblyopic eyes and healthy eyes for hyperopic and myopic types are shown by the boxplot in Fig. 2.
Table 1.
Descriptive statistics of patient characteristics
| Frequency (n) | Percentage (%) | |
|---|---|---|
| Amblyopic eyes | ||
| Right | 17 | 43.6 |
| Left | 22 | 56.4 |
| Healthy eyes | ||
| Right | 22 | 56.4 |
| Left | 17 | 43.6 |
| Type of amblyopia | ||
| Hyperopic | 22 | 30.6 |
| Myopic | 17 | 23.6 |
Table 2.
Descriptive statistics of patient characteristics
| Hyperopic (n=22) | Myopic (n=17) | Control (n=33) | P | |
|---|---|---|---|---|
| Gender n (%) | ||||
| Female | 6 (19.4%) | 11 (35.5%) | 14 (45.2%) | 0.064a |
| Male | 16 (39%) | 6 (14.6%) | 19 (46.3%) | |
| Age | ||||
| median (min-max) | 27 (20-40) | 25 (19-39) | 23 (20-39) | 0.216b |
| mean±SD | 29.04±7.51 | 26.11±5.87 | 25.33±5.49 |
aChi square test, bKruskal-Wallis test SD: standard deviation
Table 3.
Comparison of subfoveal CT, nasal CT, temporal CT, TCA, LA, SA, CVI, LA/SA ratio, CMT, AL, K1, K2, and SE values between amblyopia and healthy eyes of hyperopic patients and healthy eyes of the control group
| Mean±SD Median (min-max) | P | |||
|---|---|---|---|---|
|
| ||||
| Healthy eyes (n=22) (1) | Amblyopic eyes (n=22) (2) | Control (n=33) (3) | ||
| Subfoveal CT, µm | 395±106.08 369.5 (245-608) |
473.6±108.6 488 (269-638) |
372.5±70.75 358 (269-518) |
1-2:< 0.001b 1-3:0.389c 2-3:0.001c |
| Nasal CT, µm | 371.9±96.33 364 (215-578) |
468.4±117.04 475 (275-666) |
330.6±70.97 320 (220-464) |
1-2:<0.001b 1-3:0.073c 2-3:<0.001c |
| Temporal CT, µm | 371.2±94.19 352.5 (258-566) |
447±89.79 434 (266-641) |
353.9±66.95 344 (220-488) |
1-2:<0.001a 1-3:0.462c 2-3: <0.001c |
| TCA, mm2 | 0.61±0.15 0.63 (0.36-1.03) |
0.81±0.16 0.81 (0.54-1.16) |
0.54±0.10 0.53 (0.33-0.78) |
1-2:<0.001b 1-3:0.063c 2-3: <0.001c |
| LA, mm2 | 0.40±0.08 0.40 (0.25-0.60) |
0.50±0.09 0.48 (0.36-0.69) |
0.36±0.06 0.35 (0.24-0.47) |
1-2:<0.001b 1-3:0.051c 2-3: <0.001c |
| SA, mm2 | 0.21±0.06 0.21 (0.11-0.43) |
0.32±0.09 0.32 (0.18-0.53) |
0.18±0.04 0.19 (0.09-0.31) |
1-2:<0.001b 1-3:0.134d 2-3: <0.001c |
| CVI | 0.65±0.03 0.66 (0.58-0.74) |
0.62±0.03 0.63 (0.54-0.69) |
0.65±0.04 0.65 (0.58-0.77) |
1-2:<0.001a 1-3:0.744c 2-3: 0.006c |
| LA/SA ratio | 1.98±0.29 1.97 (1.39-2.84) |
1.61±0.26 1.63 (1.14-2) |
1.99±0.40 1.87 (1.5-3.4) |
1-2:<0.001b 1-3:0.588d 2-3:<0.001d |
| CMT, µm | 270.54±16.43 268 (240-298) |
275.81±17.84 273 (248-315) |
266.39±14.52 271 (230-289) |
1-2:0.001b 1-3:0.329c 2-3: 0.036c |
| AL, mm | 23.03±0.92 23 (21.48-24.51) |
21.78±1.23 21.45 (19.72-23.94) |
23.32±0.74 23.3 (21.91-25.32) |
1-2:<0.001b 1-3:0.053c 2-3: <0.001c |
| K1 | 42.58±1.48 42.53 (40.13-45.55) |
42.27±1.60 42.16 (39.75-45.5) |
42.94±1.32 42.99 (40.27-45.67) |
1-2:0.008b 1-3:0.353c 2-3: 0.096c |
| K2 | 43.40±1.50 43.52 (41.16-46.04) |
43.93±1.71 43.85 (41.06-47.27) |
43.84±1.33 43.95 (41.06-46.11) |
1-2:0.019a 1-3:0.261c 2-3:0.832c |
| SE, diopter | 0.59±1.17 0.06 (-0.75-3.50) |
4.04±2.25 3.68 (1.00-7.50) |
-0.53±1.21 - 0.50 (-3.63-2) |
1-2:<0.001a 1-3:0.004d 2-3:<0.001d |
aPaired t-test bWilcoxon signed-rank test. cStudent’s t-test dMann-Whitney U test. Abbreviations: CT: choroidal thickness; TCA: total choroidal area; LA: luminal area; SA: stromal area, CVI: choroidal vascularity index; CMT: central macular thickness; AL: axial length; SE: spherical equivalent
Table 4.
Comparison of subfoveal CT, nasal CT, temporal CT, TCA, LA, SA, CVI, LA/SA ratio, CMT, AL, K1, K2, and SE values between amblyopia and healthy eyes of myopic patients and healthy eyes of the control group
| Mean±SD Median (min-max) | P | |||
|---|---|---|---|---|
|
| ||||
| Healthy eyes (n=17) (1) | Amblyopic eyes (n=17) (2) | Control (n=33) (3) | ||
| Subfoveal CT, µm | 362.7±105.09 331 (207-591) |
301±76.08 296 (167-510) |
372.5±70.75 358 (269-518) |
1-2:<0.001b 1-3: 0.697c 2-3:0.002c |
| Nasal CT, µm | 326.05±97.7 305 (200-582) |
272.58±80.26 255 (168-454) |
330.6±70.97 320 (220-464) |
1-2:0.004b 1-3: 0.850c 2-3:0.012c |
| Temporal CT, µm | 345.05±108.64 323 (198-563) |
303.82±91.34 302 (132-495) |
353.9±66.95 344 (220-488) |
1-2:0.012a 1-3:0.761c 2-3: 0.032c |
| TCA, mm2 | 0.54±0.11 0.57 (0.32-0.76) |
0.46±0.11 0.51 (0.27-0.62) |
0.54±0.10 0.53 (0.33-0.78) |
1-2:<0.001b 1-3:0.985c 2-3: 0.013c |
| LA, mm2 | 0.35±0.07 0.37 (0.22-0.47) |
0.30±0.06 0.32 (0.18-0.39) |
0.36±0.06 0.35 (0.24-0.47) |
1-2:<0.001b 1-3:0.712c 2-3: 0.024d |
| SA, mm2 | 0.19±0.05 0.2 (0.10-0.30) |
0.15±0.04 0.16 (0.08-0.25) |
0.18±0.04 0.19 (0.09-0.31) |
1-2:<0.001a 1-3:0.558c 2-3: 0.047c |
| CVI | 0.64±0.04 0.64 (0.54-0.70) |
0.65±0.04 0.65 (0.57-0.72) |
0.65±0.04 0.65 (0.58-0.77) |
1-2:0.086a 1-3:0.227c 2-3: 0.788c |
| LA/SA ratio | 1.84±0.31 1.84 (1.20-2.37) |
1.98±0.39 2 (1.31-2.66) |
1.99±0.40 1.87 (1.5-3.4) |
1-2:0.041a 1-3:0.430d 2-3: 0.870d |
| CMT, µm | 264.7±20.56 261 (241-317) |
265.5±19.18 260 (244-316) |
266.39±14.52 271 (230-289) |
1-2:0.819b 1-3:0.330d 2-3: 0.401d |
| AL, mm | 23.95±0.83 23.9 (22.35-25.53) |
24.81±0.80 24.65 (23.34-26.37) |
23.32±0.74 23.3 (21.91-25.32) |
1-2:<0.001b 1-3:0.069c 2-3:<0.001c |
| K1 | 42.69±0.92 42.72 (41.51-44.41) |
42.54±0.91 42.5 (41.31-44.25) |
42.94±1.32 42.99 (40.27-45.67) |
1-2:0.187a 1-3:0.492c 2-3:0.274c |
| K2 | 44.21±1.28 44 (42.24-47.14) |
44.31±1.39 43.98 (42.62-47.90) |
43.84±1.33 43.95 (41.06-46.11) |
1-2:0.216a 1-3:0.362c 2-3: 0.461d |
| SE, diopter | -1.34±1.04 - 1.125 (-4-0.25) |
-3.90±1.47 - 3.75 (-6.87-(-2)) |
-0.53±1.21 - 0.50 (-3.63-2) |
1-2:<0.001b 1-3:0.023c 2-3:<0.001c |
aPaired t-test. bWilcoxon signed-rank test. cStudent’s t-test. dMann-Whitney U test. Abbreviations: CT: choroidal thickness; TCA: total choroidal area; LA: luminal area; SA: stromal area, CVI: choroidal vascularity index; CMT: central macular thickness; AL: axial length; SE: spherical equivalent
Figure 2.

Distribution of TCA, LA, SA, CVI, and LA/SA ratio values between amblyopic and healthy eyes of patients by hyperopic (n = 22) and myopic types (n = 17)
The results of correlation analysis between the AL of healthy, amblyopic eyes, and control eyes and subfoveal CT, nasal CT, temporal CT, TCA, LA, SA, CVI, and LA/SA ratio for both hyperopic and myopic types are presented in Table 5. The scatter plot and the regression curve showing the relationship between the axial lengths of the amblyopic eyes and the ratio of TCA, LA, and SA are shown in Fig. 3. According to simple linear regression analysis, a 1-unit increase in AL of amblyopic eyes reduces TCA by 0.08 units [Fig. 3a], SA by 0.05 units [Fig. 3b], and LA by 0.04 units [Fig. 3c].
Table 5.
Correlation analysis results between axial lengths and the subfoveal CT, nasal CT, temporal CT, TCA, LA, SA, CVI, and LA/SA ratio of healthy and amblyopic eyes by hyperopic (n=22) and myopic types (n=17) and control group
| Subfoveal CT | Nasal CT | Temporal CT | TCA | LA | SA | CVI | LA/SA ratio | |
|---|---|---|---|---|---|---|---|---|
| Hyperopic | ||||||||
| Axial lengths (Healthy eyes) | ||||||||
| r | -0.128 | -0.058 | 0.021 | 0.382 | 0.405 | 0.326 | -0.164 | -0.180 |
| P | 0.570a | 0.798a | 0.926a | 0.079a | 0.060a | 0.139b | 0.467a | 0.423a |
| Axial lengths (amblyopic eyes) | ||||||||
| r | -0.130 | -0.262 | -0.227 | -0.076 | -0.099 | -0.148 | -0.035 | 0.162 |
| P | 0.566a | 0.239a | 0.309a | 0.737a | 0.661a | 0.512a | 0.876a | 0.472a |
| Myopic | ||||||||
| Axial lengths (healthy eyes) | ||||||||
| r | 0.017 | -0.029 | 0.092 | -0.014 | -0.127 | 0.149 | -0.348 | -0.396 |
| P | 0.947a | 0.913a | 0.727a | 0.957a | 0.626a | 0.568a | 0.172a | 0.115a |
| Axial lengths (amblyopic eyes) | ||||||||
| r | -0.193 | -0.221 | -0.409 | -0.131 | -0.088 | -0.107 | -0.130 | -0.128 |
| P | 0.457a | 0.394a | 0.103a | 0.616a | 0.738b | 0.684a | 0.620a | 0.625a |
| Control | ||||||||
| Axial lengths | ||||||||
| r | 0,143 | 0,160 | 0,264 | 0,210 | 0,124 | 0,295 | -0,336 | -0,422 |
| P | 0,428a | 0,374a | 0,138a | 0,240a | 0,491a | 0,096a | 0,056a | 0,015b |
aPearson’s correlation coefficient. bSpearman’s correlation coefficient. Abbreviations: CT: choroidal thickness; TCA: total choroidal area; LA: luminal area; SA: stromal area, CVI: choroidal vascularity index
Figure 3.
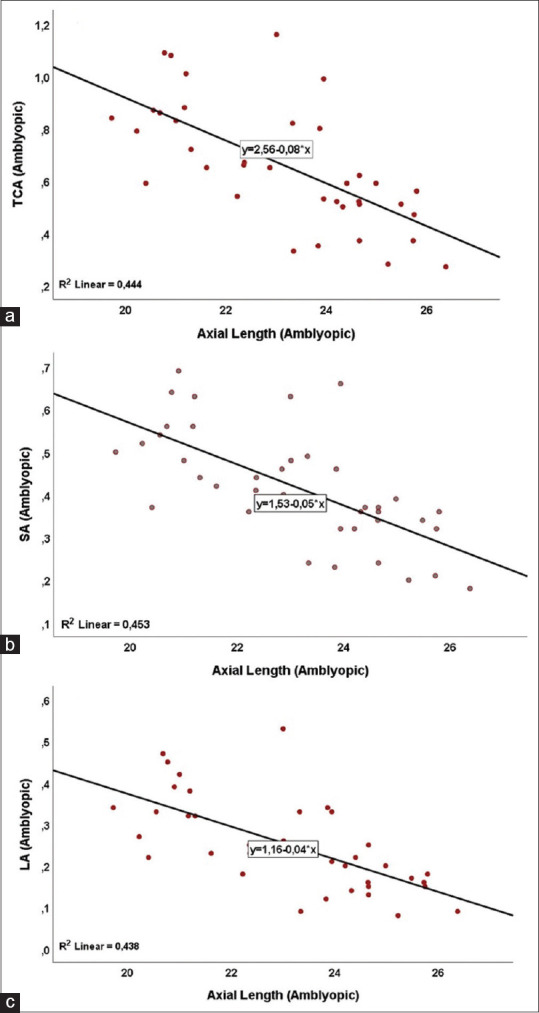
Scatter plot and regression curve showing the relationship between axial lengths and TCA (a), SA (b), and LA (c) values of amblyopic eyes (n = 39)
Discussion
The researchers have been investigated the possible effects of amblyopia on both retinal and choroidal structures.[6,17,18] The main goal of many studies about amblyopia is to find markers that are used in clinical practices. Many researchers found similar results between amblyopic eyes and healthy eyes in terms of both CMT and retinal nerve fiber layer thickness.[17,18] In addition, a meta-analysis reported that amblyopic eyes had thicker CT than normal eyes.[6] In contrast, most of the previous studies usually focused on CT and most of them did not provide a detailed description of the choroidal architecture.[6,7] Therefore, a method in which the choroid is examined in more detail is more valuable to better understand the role of the choroid in the pathogenesis of amblyopia. It is known that the accommodative performance of amblyopic eyes is poorer than normal eyes[19] and it was reported that accommodation is directly related to the structure of the choroidal tissue.[20] CT and CVI are the biomarkers of choroidal tissue. CT has been investigated in many diseases. During the measurement of CT, both stromal and vascular components of the tissue are measured and this situation can limit the use of CT in some pathologies. CVI, a novel choroidal biomarker, is defined as the ratio of LA to TCA. Considering that the main task of the choroidal tissue is to provide nutrition to the retina and take waste materials from the retina, and if we consider that the choroidal tissue is the most vascular tissue of the body, CVI can be a more useful biomarker than CT. In addition, in the study of Agrawal et al.,[15] it was reported that CVI was independent of ocular and systemic factors such as axial length, intraocular pressure, age, and systolic blood pressure. The results of our study confirmed that there was no correlation between AL and CVI. It is well known that CT is associated with these factors. This study mainly focuses on CVI.
In the present study, we found that TCA, LA, and SA values of amblyopic eyes of hyperopic patients were higher than those of healthy eyes. In contrast, CVI and LA/SA ratio were lower in amblyopic eyes than in healthy eyes. Considering that CT of hyperopic patients has thicker choroid, an increase in TCA, SA, and LA values can naturally be met. However, a low CVI indicates that LA and SA do not increase at the same rate. Our results show that an increase in LA was lower than an increase in SA. This finding can explain the low CVI and LA/SA ratio in amblyopic eyes in hyperopic patients.
In the literature, most of the studies on this subject have been conducted on pediatric patients. Nishi et al.[8] found larger LA and smaller SA in amblyopic eyes of hyperopic children than in healthy control eyes. They did not measure CVI but we can understand that CVI was higher in amblyopic hyperopic eyes. Parallel to the study of Nishi et al., Baek et al. found greater choroidal vascularity in hyperopic amblyopic eyes than in control eyes in the pediatric population.[10] In contrast, Araki et al.[9] did not find a statistical difference in choroidal vessel density (equal to CVI) values in hyperopic amblyopic children and control eyes. In our study, we found an increase in TCA, LA, and SA values in hyperopic amblyopic eyes and we detected that these eyes had lower CVI and LA/SA ratio than in healthy fellow eyes. The mean age of the study population of Nishi et al.,[8] Araki et al.,[9] and Baek et al.[10] were 5.9 ± 2.1 years, 6.8 ± 3.0 years, and 6.9 ± 2.9 years, respectively. These patients are in the stage of emmetropization and the ocular structures of these patients are constantly changing and developing. However, we investigated adult amblyopic patients and the emmetropization of our study patients was completed. We can explain the decrease in the CVI value in the adult patient group (our study), which was high in the pediatric patient group (previous studies),[8,9,10] by the fact that the SA may increase more than the LA during the emmetropization period. A similar study in terms of study group age was conducted by Alis et al.[21] They investigated CVI in different refractive statuses. They found that hyperopic patients had lower CVI than emmetropic and myopic patients. Our study results were parallel to the study of Alis et al.[21]
It is well known that CT is thinner in myopic patients than in emmetropes and hyperopic patients. We found similar results in the literature. In our study, we detected that myopic amblyopic patients had lower TCA, LA, and SA values than healthy patients. In contrast, CVI (without a statistical difference) and LA/SA ratio (with a statistical difference) were detected higher in amblyopic eyes than in healthy eyes. In our study, our findings are parallel to the previous studies. Gupta et al.,[22] found lower TCA, LA, and SA values in high myopic patients than in emmetropic patients. In addition, they found statistically higher CVI in high myopic patients. In another study from Iran, Yazdani et al. reported that myopic patients had higher CVI compared with emmetropes.[13] Similarly, Alshareef et al.[23] reported greater CVI in myopes than the healthy control group. The following conclusion can be drawn from these findings; with myopization, both LA and SA decrease, and the decrease in SA is greater than in LA. Our study found that a 1-unit increase in AL of amblyopic eyes reduces TCA by 0.08 units, LA by 0.04 units, and SA by 0.05 units. Therefore, in our world where myopia has become a pandemic, we think that these parameters may be important in myopization and we think that these parameters can direct the efforts to pause myopia.
In contrast, although we found CVI greater in myopic amblyopic eyes than in healthy fellow eyes, there was no statistically significant difference. In our study, the mean AL in myopic amblyopic eyes and healthy fellow eyes was 24.81 mm and 23.95 mm. The difference in AL between the study group and control group was smaller in our study than in other studies. This can explain the insignificant difference. We think that in the myopic population, CVI increases, and the increase in CVI becomes more significant as the AL increases.
This study has some limitations. First, the study population was relatively small. Second, CT was conducted manually because the Heidelberg Spectralis OCT equipment does not provide automatic segmentation of the choroid. Third, in the myopic amblyopic group, the study population included relatively low to moderate myopia. Therefore, future larger studies are needed to examine these choroidal parameters.
Conclusion
To the best of our knowledge, there has yet to be a study to compare the choroidal structural parameters with amblyopic eye and healthy eye in both unilateral hyperopic and myopic anisometropic amblyopia patients. We especially included patients with unilateral myopic and hyperopic amblyopic patients because we thought that a comparison of the amblyopic eyes and healthy fellow eyes in the same patients may give us important findings. Thus, we wanted to see the direct effects of both hyperopia and myopia on choroidal structures. The present study contributed to the literature by finding that TCA, LA, and SA are high and CVI and LA/SA ratio are low in hyperopic patients and that TCA, LA, and SA are low and CVI and LA/SA ratio are high in myopic patients. In addition, there is another valuable aspect of this study; our study gives the numerical value of how the change in AL changes TCA, LA, and SA.
Financial support and sponsorship
Nil.
Conflicts of interest
There are no conflicts of interest.
References
- 1.Beck RW. Clinical research in pediatric ophthalmology:The pediatric eye disease investigator group. Curr Opin Ophthalmol. 2002;13:337–40. doi: 10.1097/00055735-200210000-00008. [DOI] [PubMed] [Google Scholar]
- 2.Akbarzadeh S, Vahabi R, Bazzazi N, Roshanaei G, Heydarian S, Fouladi DF. The burden of pure anisometropic amblyopia:A cross-sectional study on 2800 Iranians. Int Ophthalmol. 2018;38:29–34. doi: 10.1007/s10792-017-0784-z. [DOI] [PubMed] [Google Scholar]
- 3.Raashid RA, Liu IZ, Blakeman A, Goltz HC, Wong AM. The ınitiation of smooth pursuit is delayed in anisometropic amblyopia. Invest Ophthalmol Vis Sci. 2016;57:1757–64. doi: 10.1167/iovs.16-19126. [DOI] [PMC free article] [PubMed] [Google Scholar]
- 4.Al-Haddad C, Fattah MA, Ismail K, Bashshur Z. Choroidal changes in anisometropic and strabismic children with unilateral amblyopia. Ophthalmic Surg Lasers Imaging Retina. 2016;47:900–7. doi: 10.3928/23258160-20161004-02. [DOI] [PubMed] [Google Scholar]
- 5.Taşkıran Çömez A, Şanal Ulu E, Ekim Y. Retina and optic disc characteristics in amblyopic and non-amblyopic eyes of patients with myopic or hyperopic anisometropia. Turkish J Ophthal. 2017;47:28–33. doi: 10.4274/tjo.54289. [DOI] [PMC free article] [PubMed] [Google Scholar]
- 6.Liu Y, Dong Y, Zhao K. A meta-analysis of choroidal thickness changes in unilateral amblyopia. J Ophthalmol. 2017;2017:2915261. doi: 10.1155/2017/2915261. [DOI] [PMC free article] [PubMed] [Google Scholar]
- 7.Araki S, Miki A, Goto K, Yamashita T, Takizawa G, Haruishi K, et al. Effect of amblyopia treatment on choroidal thickness in hypermetropic anisometropic amblyopia using swept-source optical coherence tomography. BMC Ophthalmol. 2018;18:227. doi: 10.1186/s12886-018-0894-z. [DOI] [PMC free article] [PubMed] [Google Scholar]
- 8.Nishi T, Ueda T, Mizusawa Y, Shinomiya K, Semba K, Mitamura Y, et al. Choroidal structure in children with Anisohypermetropic amblyopia determined by Binarization of optical coherence tomographic images. PLoS One. 2016;11:e0164672. doi: 10.1371/journal.pone.0164672. [DOI] [PMC free article] [PubMed] [Google Scholar]
- 9.Araki S, Miki A, Goto K, Yamashita T, Yoneda T, Fujiwara A, et al. Choroidal vessel density in unilateral hyperopic amblyopia using en-face optical coherence tomography. BMC Ophthalmol. 2020;20:472. doi: 10.1186/s12886-020-01735-z. [DOI] [PMC free article] [PubMed] [Google Scholar]
- 10.Baek J, Lee A, Chu M, Kang NY. Analysis of choroidal vascularity in children with unilateral hyperopic amblyopia. Sci Rep. 2019;9:12143. doi: 10.1038/s41598-019-48613-3. [DOI] [PMC free article] [PubMed] [Google Scholar]
- 11.Nishi T, Ueda T, Mizusawa Y, Semba K, Shinomiya K, Mitamura Y, et al. Effect of optical correction on choroidal structure in children with anisohypermetropic amblyopia. PLoS One. 2020;15:e0231903. doi: 10.1371/journal.pone.0231903. [DOI] [PMC free article] [PubMed] [Google Scholar]
- 12.Wu H, Zhang G, Shen M, Xu R, Wang P, Guan Z, et al. Assessment of choroidal vascularity and choriocapillaris blood perfusion in anisomyopic adults by SS-OCT/OCTA. Invest Ophthalmol Vis Sci. 2021;62:8. doi: 10.1167/iovs.62.1.8. [DOI] [PMC free article] [PubMed] [Google Scholar]
- 13.Yazdani N, Ehsaei A, Hoseini-Yazdi H, Shoeibi N, Alonso-Caneiro D, Collins MJ. Wide-field choroidal thickness and vascularity index in myopes and emmetropes. Ophthalmic Physiol Opt. 2021;41:1308–19. doi: 10.1111/opo.12875. [DOI] [PubMed] [Google Scholar]
- 14.Prousali E, Dastiridou A, Ziakas N, Androudi S, Mataftsi A. Choroidal thickness and ocular growth in childhood. Surv Ophthalmol. 2021;66:261–75. doi: 10.1016/j.survophthal.2020.06.008. [DOI] [PubMed] [Google Scholar]
- 15.Agrawal R, Gupta P, Tan KA, Cheung CM, Wong TY, Cheng CY. Choroidal vascularity index as a measure of vascular status of the choroid:Measurements in healthy eyes from a populationbased study. Sci Rep. 2016;6:21090. doi: 10.1038/srep21090. [DOI] [PMC free article] [PubMed] [Google Scholar]
- 16.Schindelin J, Arganda-Carreras I, Frise E, Kaynig V, Longair M, Pietzsch T, et al. Fiji:An opensource platform for biological-image analysis. Nat Methods. 2012;9:676–82. doi: 10.1038/nmeth.2019. [DOI] [PMC free article] [PubMed] [Google Scholar]
- 17.Celik E, Çakır B, Turkoglu EB, Doğan E, Alagoz G. Evaluation of the retinal ganglion cell and choroidal thickness in young Turkish adults with hyperopic anisometropic amblyopia. Int Ophthalmol. 2016;36:515–20. doi: 10.1007/s10792-015-0157-4. [DOI] [PubMed] [Google Scholar]
- 18.Kantarci FA, Tatar MG, Uslu H, Colak HN, Yildirim A, Goker H, et al. Choroidal and peripapillary retinal nerve fiber layer thickness in adults with anisometropic amblyopia. Eur J Ophthalmol. 2015;25:437–42. doi: 10.5301/ejo.5000594. [DOI] [PubMed] [Google Scholar]
- 19.Manh V, Chen AM, Tarczy-Hornoch K, Cotter SA, Candy TR. Accommodative performance of children with unilateral amblyopia. Invest Ophthalmol Vis Sci. 2015;56:1193–207. doi: 10.1167/iovs.14-14948. [DOI] [PMC free article] [PubMed] [Google Scholar]
- 20.Woodman-Pieterse EC, Read SA, Collins MJ, Alonso-Caneiro D. Regional changes in choroidal thickness associated with accommodation. Invest Ophthalmol Vis Sci. 2015;56:6414–22. doi: 10.1167/iovs.15-17102. [DOI] [PubMed] [Google Scholar]
- 21.Guler Alis M, Alis A. Choroidal vascularity index in adults with different refractive status. Photodiagnosis Photodyn Ther. 2021;36:102533. doi: 10.1016/j.pdpdt.2021.102533. [DOI] [PubMed] [Google Scholar]
- 22.Gupta P, Thakku SG, Saw SM, Tan M, Lim E, Tan M, et al. Characterization of choroidal morphologic and vascular features in young men with high myopia using spectral-domain optical coherence tomography. Am J Ophthalmol. 2017;177:27–33. doi: 10.1016/j.ajo.2017.02.001. [DOI] [PubMed] [Google Scholar]
- 23.Alshareef RA, Khuthaila MK, Goud A, Vupparaboina KK, Jana S, Chhablani J. Subfoveal choroidal vascularity in myopia:Evidence from spectral-domain optical coherence tomography. Ophthalmic Surg Lasers Imaging Retina. 2017;48:202–7. doi: 10.3928/23258160-20170301-02. [DOI] [PubMed] [Google Scholar]