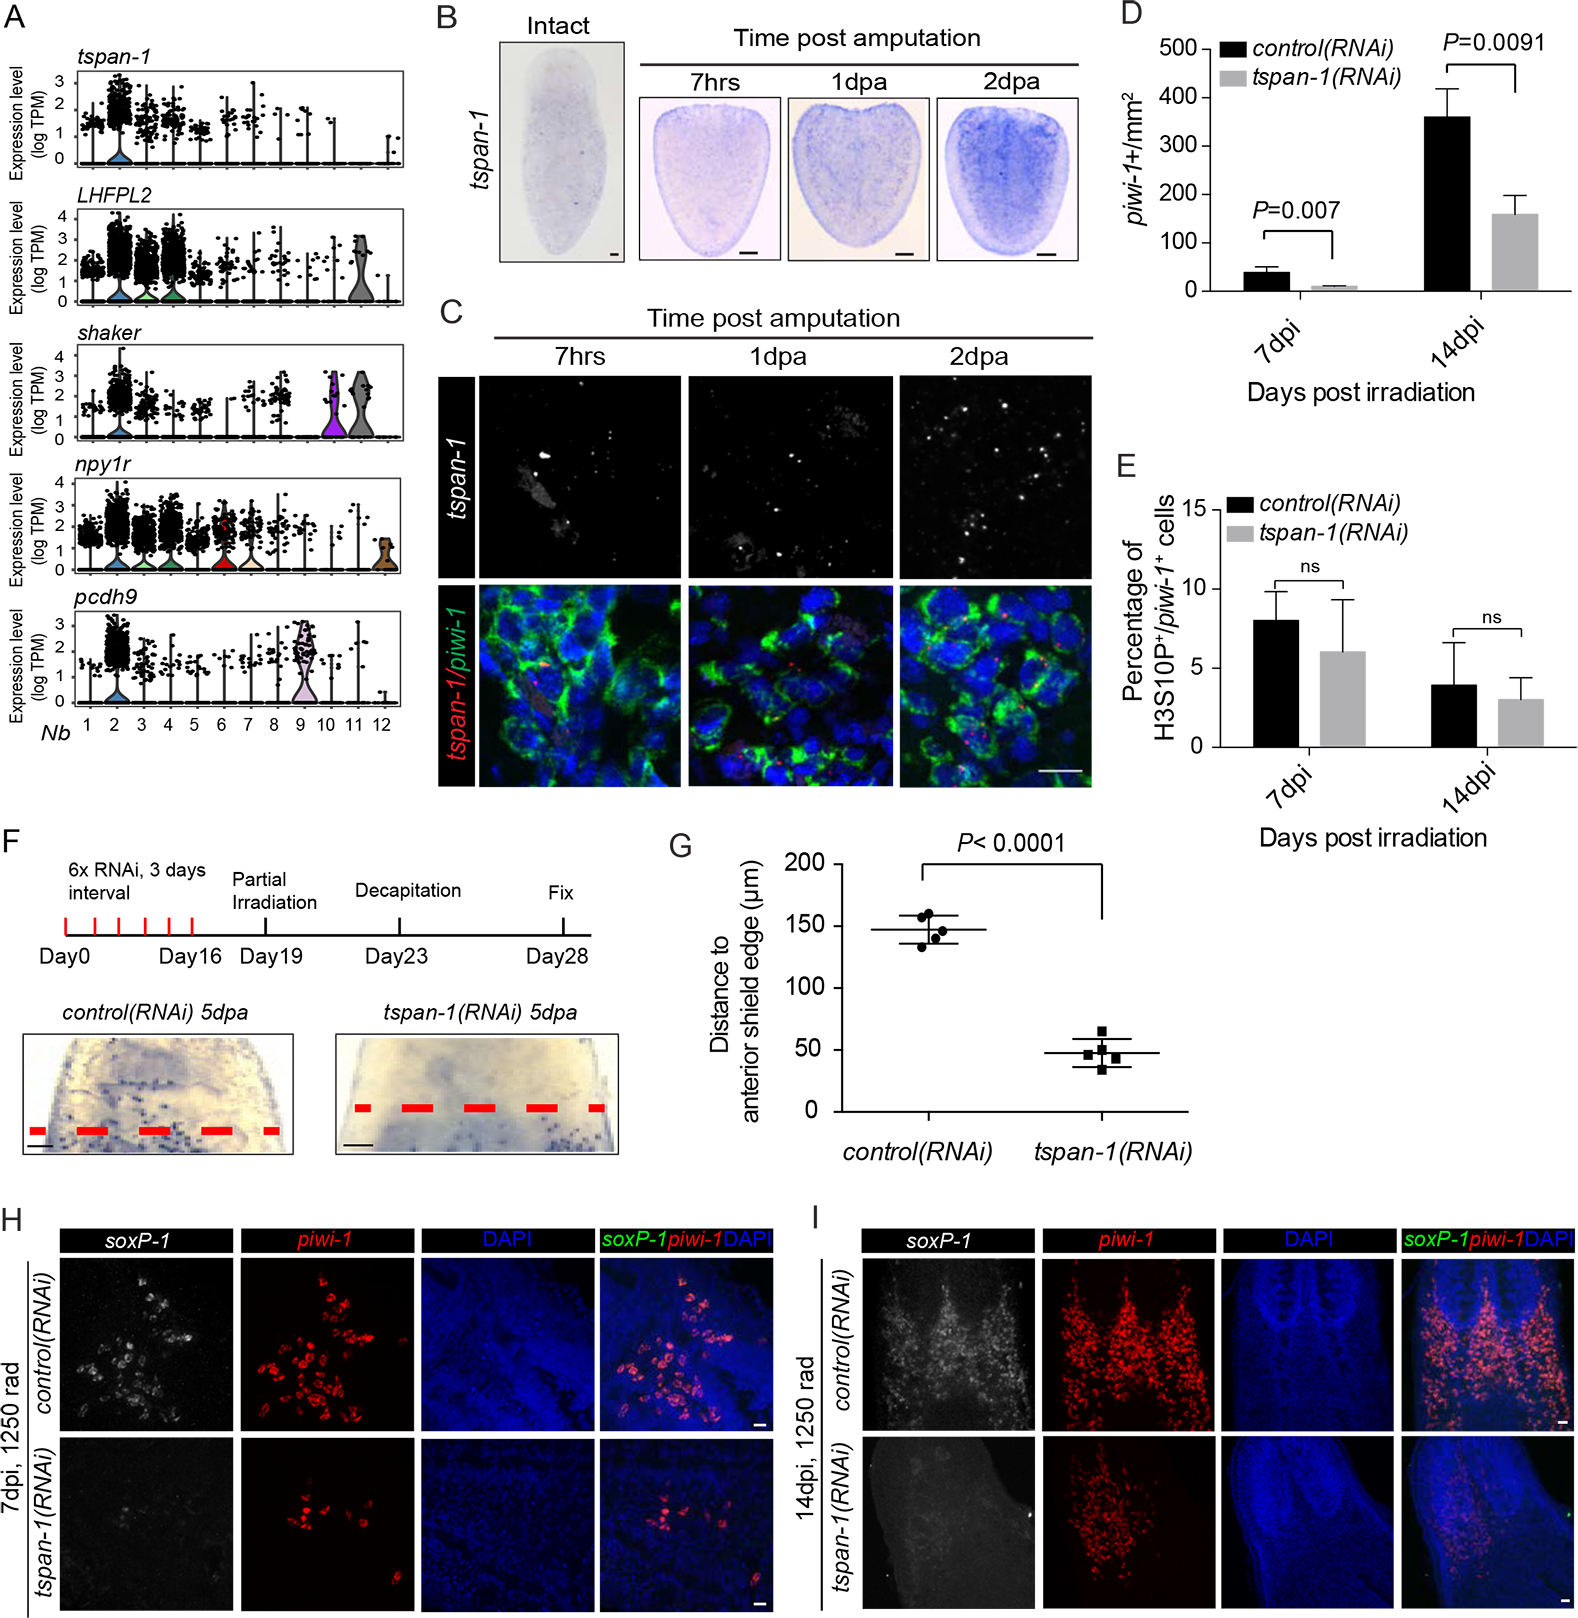
Figure 4. RNAi depletion of Nb2 marker genes affects Nb2 cell repopulation and mobilization after sublethal and partial irradiation.

(A) Violin plots show distribution of expression levels for each of top-five predicted cell-surface protein coding genes enriched in Nb2 group.
(B) tspan-1 temporal expression assessed by in situ hybridization in tail fragments post amputation. Representative animals shown, n>5 for each condition. Scale bar, 100 μm.
(C) Double-labeled FISH using RNAscope for piwi-1 and tspan-1 mRNA in tail fragments fixed 7 hours (7hrs), 1-day, and 2-day post-amputation (dpa). Representative areas shown. n≥ 5 animals per condition. Scale bar, 10 μm.
(D-E) Quantification of piwi-1+ cells (D) and mitotic index (E) in control(RNAi) and tspan-1(RNAi) animals at indicated time points after sub-lethal irradiation. Error bar, SD.
(F-G) Cell dispersion assessed by piwi-1 staining (E) and quantified at anterior boundaries in decapitated animals at 9dpi, corresponding to 5 dpa. Representative animals shown. n≥5 animals per condition. Error bar, SD. Scale bar, 100 μm.
(H and I) tspan-1(RNAi) knockdown impairs σ-class cell repopulation after sub-lethal irradiation. Representative areas shown. n≥5 animals per condition. Scale bar, 10 μm. See also Fig. S5.
