

Abstract
Background
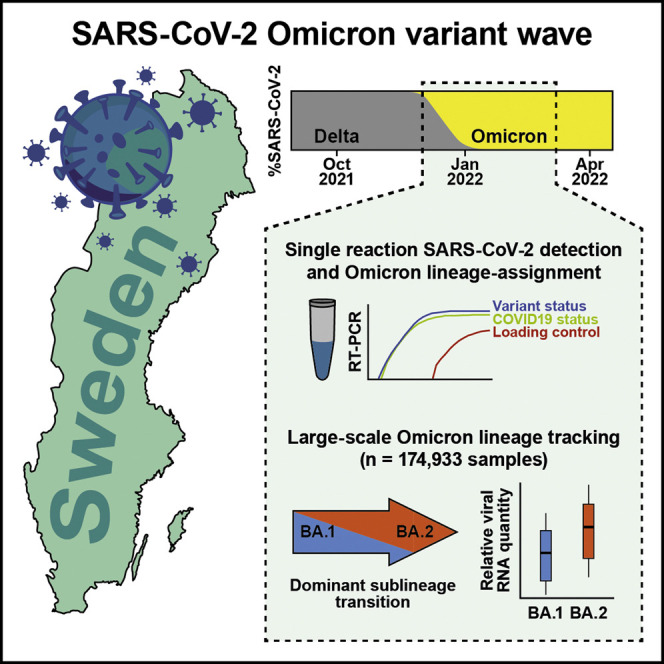
Throughout the SARS-CoV-2 pandemic, multiple waves of variants of concern have swept across populations, leading to a chain of new and yet more contagious variants dominating COVID-19 cases. Here, we tracked the remarkably rapid shift from Omicron BA.1 to BA.2 sublineage dominance in the Swedish population in early 2022 at a day-by-day basis.
Methods
Using a custom SARS-CoV-2 Omicron BA.1 lineage-typing RT-PCR assay, we analyzed 174,933 clinical upper airway samples collected during January to March 2022.
Findings
Our study demonstrates the feasibility and reliability of parallel lineage assignment of select variants at population scale, tracking the dominant sublineage transition from BA.1 to BA.2 at day-to-day resolution and uncovering nearly 2-fold higher levels of viral RNA in cases infected with Omicron BA.2 relative to BA.1.
Conclusions
Our data provide unique insights into the Omicron BA.1 to BA.2 transition that occurred in Sweden during early 2022, and later, across the world. This may help to understand the increased transmissibility of the BA.2 variant.
Keywords: SARS-CoV-2, Omicron, BA.1, BA.2, RT-PCR, viral load, transmissibility, nasopharyngeal, upper airways, CDC
Graphical abstract
Context and significance
Early population tracking is critical for informed decision-making and handling of the SARS-CoV-2 pandemic during outbreaks of variant strains of concern. Omicron variant infections emerged during late 2021, but at the time, lineage assignment relied on sequencing or separate genotyping assays in addition to the clinical SARS-CoV-2 RT-PCR, burdening laboratories and restricting the scope of lineage monitoring. Here, researchers at the Karolinska Institute and ABC Labs developed a single RT-PCR assay to simultaneously classify COVID-19 and Omicron BA.1 lineage status and demonstrated the feasibility of parallel lineage assignment of select variants at population scale. The authors show, at day-to-day resolution, the rapid transition from Omicron BA.1 to BA.2 sublineage dominance in the Swedish population, exposing factors that could influence this transition.
The SARS-CoV-2 pandemic has been characterized by waves of novel mutated virus variants. Lentini et al. tracked the ongoing Omicron emergence in the Swedish population in real time, showing how population-scale lineage tracking can be achieved with a single laboratory test and revealing the rapid shift in dominant subvariant.
Introduction
The SARS-CoV-2 pandemic has been characterized by the emergence and subsequent dominance of new variants of concern, such as Alpha B.1.1.7 during late 2020, Delta B.1.617.2 in mid-2021, and the Omicron variant B.1.1.529.1 (BA.1) in late 2021 and early 2022.1 It is estimated that a peak of nearly 50 million new infections occurred daily worldwide during the Omicron wave of January 2022, far exceeding the peak of 14 million daily Delta infections during April 20212 and signifying an unprecedented level of transmission of Omicron. In late December 2021, during the midst of the Omicron BA.1 wave in Sweden, the Omicron sublineage BA.2 (B.1.1.529.2) arrived and rapidly spread through the population. At this time, we had in place an RT-PCR assay capable of genotyping Omicron BA.1 cases directly in primary SARS-CoV-2 RT-PCR testing, enabling day-by-day tracking of the BA.1 frequency at massive scale. Here, we provide details of this assay and present data from 174,933 clinical upper airway samples analyzed with the method in the Swedish population January to March 2022, demonstrating how the Omicron BA.1 wave was consistently outcompeted by BA.2. Importantly, we report approximately twice as high viral RNA levels detected in upper airway samples from Omicron BA.2 cases, suggesting that a higher viral load might contribute to the increased transmissibility of the BA.2 lineage.
Results
As we observed an acceleration of Omicron BA.1 cases across several European countries in early December of 2021, we rapidly developed a modified version of the CDC SARS-CoV-2 RT-PCR assay,3 simultaneously detecting general SARS-CoV-2 infection status (N1-FAM), human RNaseP sample integrity (RP-HEX), and Omicron BA.1-lineage status (S BA1 -Cy5) leveraging BA.1-specific indels in the spike (S) gene (Figure 1A). To attain a multiplex assay of high sensitivity and specificity, suitable for RNA-extraction-free RT-PCR on heat-inactivated samples employed in mass testing,4 we designed 144 combinatorial S BA1 -primer-probe sets, matching CDC N1 properties and with minimized amplicon length (Figure S1A and Table S1). We obtained the first in vitro expanded Omicron BA.1 inoculate in Sweden (GISAID: EPI_ISL_7452247) that was used to identify a BA.1-specific primer-probe set for large-scale oligonucleotide production at an early phase of the Omicron wave (Figures 1B and S1B). By serial dilution of clinical BA.1 specimens, we found that the detection sensitivity and log-linear cycle thresholds (CT) range were similar for both the N1 and S BA1 sets in the assay conditions (Figure 1C). Using 185 clinical upper airway samples (combined throat swab, nose swab, and saliva; see STAR Methods) of known COVID19-infection status, we validated that addition of S BA1 -Cy5 probes did not affect N1 CT values and the sensitivity to detect general SARS-CoV-2 infection in primary RT-PCR (Figure 1D and Table S2). Parallel genotyping of 133 SARS-CoV-2-positive samples using Thermo Fisher TaqMan SARS-CoV-2 Mutation Panel Assay as well as whole-genome sequencing (WGS, n = 103 samples) provided Omicron BA.1-case classification that was 100% consistent with our direct RT-PCR assay (Figures 1E and 1F). Omicron (both the BA.1 and BA.2 lineage) carries a C28311T substitution at the third base position of the N1 probe, which we confirmed had negligible effect on CT values by tests using CDC N1 and custom Omicron N1 probes (Figure S1C).
Figure 1.

An RT-PCR assay providing general SARS-CoV-2 infection status and Omicron BA.1 classification in parallel
(A) Mutational spectrum of the S protein among different SARS-CoV-2 lineages and location of Omicron BA.1-specific primer-probes used in the assay. Mutation prevalence data adapted from outbreak.info/compare-lineages, accessed 03-23-2022, where prevalence is based on total GISAID sequence data.
(B) RT-PCR amplification curves for N1, SBA1, and RNaseP targets in representative Omicron BA.1-positive (top) and BA.1-negative (bottom) samples.
(C) RT-PCR sensitivity of N1 (top) and SBA1 targets in dilution series of a BA.1-positive sample. Each dilution point represented by n = 8 replicates.
(D) Linear relationship between N1 RT-PCR Ct between the N1 assay and N1+SBA1 assay for n = 185 clinical specimens.
(E) Agreement between lineage assignment of N1+SBA1 RT-PCR assay and Thermo Fisher TaqMan SARS-CoV-2 Mutation Panel (colors) for n = 133 COVID-19 positive samples (See also Table S2).
(F) Agreement between N1+SBA1 RT-PCR assay and WGS lineage calls for n = 103 clinical specimens.
Having optimized and validated the assay, it was deployed to monitor the Omicron wave across central Sweden day by day, totaling 174,933 clinical samples from nine healthcare regions analyzed between January 26 and March 8, 2022, using a standard operation procedure and self-sampling kit (Table S3, see STAR Methods and Data S1 for details of specimen collection). While BA.1 was the dominant lineage among COVID-19-positive cases during January, the BA.1 fraction steadily decreased to as low as 11% by March (Figure 2A). This trend was observed in all monitored healthcare regions across Sweden (Figure 2B), indicating that Omicron BA.1 was being outcompeted by another lineage. To trace this lineage switch, we whole-genome sequenced and lineage-assigned 698 samples picked among SARS-CoV-2-positive cases. Strikingly, 100% of clinical samples typed as Omicron BA.1 negative in our direct RT-PCR assay were found to be of the Omicron BA.2 lineage by WGS (Figure 2C), lacking the BA.1-specific “EPE” insertion in the S gene targeted by our S BA1 -probe (Figure S1A), demonstrating that Omicron BA.2 was the lineage outcompeting BA.1 in the Swedish population. Combining these sequenced cases with the validation set of 103 samples mentioned in a previous section, we had classified a total of 801 clinical samples by WGS (Table S4), demonstrating >99% agreement with the BA.1 calls obtained directly in the RT-PCR (796/801 samples) (Figure 2D). In summary, our RT-PCR data demonstrated in real time that two Omicron waves co-occurred in the Swedish population and that BA.2 outcompeted BA.1. Why Omicron BA.2 is more contagious and replaced BA.1 is not well understood, and multiple non-exclusive mechanisms such as increased binding affinity of the spike protein to host angiotensin-converting enzyme two receptor, evasion of neutralizing antibodies, and increased viral load are plausible. Our massive RT-PCR dataset allowed us to compare viral RNA levels detected in BA.1 and BA.2 cases with high statistical power. Intriguingly, samples genotyped as BA.1-negative in RT-PCR contained 1.9-fold higher levels of viral RNA than BA.1-positive samples (median N1 CT BA.1Neg = 24.50, CI95%: 24.45–24.55 versus BA.1Pos = 25.43, CI95%: 25.37–25.47; p = 1.54 x 10−180, Mann-Whitney U-test) (Figure 2E). Importantly, higher viral RNA levels in BA.2 were not due to differences in sample material amounts (Figure S2B) and were consistently detected across day-by-day timepoints spanning the length of the study, with sampling date having negligible effects (βDate = −0.00016, P Date = 0.944, βBA.1 = 0.928, P BA.1 < 2 x 10−308, median quantile regression) (Figure S2C), as well as across originating healthcare regions (average BA.1-BA.2 difference = 0.9 ± 0.14 CT ± 1 SD, p < 1.5 x 10⁻⁷, Mann-Whitney U-test) (Figure 2F). As the N1 target sequences utilized for RNA quantification in our assay are identical in the BA.1 and BA.2 genomes, the same RT-PCR efficiency (E) is expected and should not influence their relative CT values, which we experimentally confirmed by serial dilution of BA.1 and BA.2 positive clinical samples (mean N1 E BA.1 = 94%, SEM = 1.7%; mean N1 E BA.2 = 94%, SEM = 2.3%; Figure S2D). A similar efficiency was recorded for the S BA.1 primer-probe set (mean S E BA.1 = 94%, SEM = 4.1%). The difference in viral RNA load between the BA.1 and BA.2 cases remained when N1 CT values were normalized to sample-specific RNaseP amounts as well as after correcting for plate variation using a standardized calibrator sample that was included in each RT-PCR run (Figures S2E–S2G). Furthermore, the viral RNA level for Omicron BA.1 was similar to that of Delta cases sampled in mid-December (p = 0.77, Mann-Whitney U-test) (Figure 2G). Similar viral RNA levels between Delta and BA.1 have previously been reported,5 , 6 whereas the increased load in BA.2 cases was surprising. To ensure that the difference in viral RNA quantity detected in samples of Omicron BA.1 and BA.2 cases was not attributed to our specific RT-PCR assay, nor due to potential differences in amplification of the 3′-end of the SARS-CoV-2 genome (where the N gene is located) due to unequal discontinuous transcription found in coronaviruses,7 we subjected 3,392 samples in parallel to both our N1/RP/S BA1 assay and an extraction-based assay (SARS-CoV-2 One-Step RT-PCR Kit, RdRp and N Genes, IVD, NZYTech; Table S5) targeting N as well as RdRp, located further 5′ inside ORF1ab. Our RT-PCR assay for the N gene showed a strong linear correlation with both N and RdRp in the extraction-based assay (R2 > 0.949) (Figure S2H), and we indeed confirmed increased copy numbers in BA.1-negative COVID-19 samples in both assays and genes probed (Figure S2I). Furthermore, lineage classification by WGS for 118 of these samples confirmed that BA.1-negative samples were indeed of BA.2 lineage (81/81 samples tested) (Figure S2J). Between March and May 2022, additional BA.2 sublineages were annotated, and we therefore retrospectively repeated lineage classification of our sequenced samples, which showed good agreement with our initial lineage assignments (Figure S3A). Interestingly, a considerable fraction of BA.2 samples could now be assigned to the sublineage BA.2.9, demonstrating its presence in the Swedish population at the time of our study. Notably, the viral RNA levels of BA.2.9 samples were on par with BA.2 samples (p = 0.74, Mann-Whitney U-test) (Figure S3B), and BA.2.9 sublineage was primarily found in the southern-most healthcare region in our data (Figure S3C). Finally, Delta-Omicron recombination events have previously been reported,8 but such cases were not detected in our sequenced data (Figures S3D and S3E and Table S6).
Figure 2.

Omicron BA.1/BA.2 lineage transition and viral load in Swedish COVID-19 cases
(A) Omicron BA.1 lineage assignment by RT-PCR over time in n = 93,126 SARS-CoV-2-positive cases (174,933 tests performed including negative cases).
(B) Same as (A) but separated by originating Swedish healthcare regions.
(C) SARS-CoV-2 Lineage assignment by WGS based on qPCR lineage call (x axis) for n = 698 biological replicates.
(D) Agreement between lineage calls for RT-PCR and WGS for n = 801 clinical specimens.
(E) Difference in viral RNA load (N1 RT-PCR Ct) for BA.1-positive and -negative, SARS-CoV-2-positive, samples based on RT-PCR calls for n = 93,264 COVID-19-positive cases. Data are shown as median, first, and third quartiles, and 1.5x inter-quartile range. p values calculated using two-tailed Mann-Whitney U-tests.
(F) Same as (E) but with samples separated based on originating health-care region.
(G) Same as (E) but with classification based on WGS lineage calls for n = 791 sequenced clinical specimens.
Discussion
Together, we devised an effective RT-PCR assay to call general COVID-19 status and Omicron BA.1 lineage status simultaneously and robustly in a single RT-PCR reaction, which enabled day-by-day monitoring of the Omicron BA.1/BA.2 transition in Sweden at immense scale. As such, our work demonstrates the feasibility of lineage typing of selected relevant lineages or variants for population monitoring directly in the primary SARS-CoV-2 RT-PCR, without straining the clinical laboratory with separate genotyping RT-PCR assays and the logistics and time lag of WGS. We observed in real time that the predominant Omicron BA.1 lineage was gradually and consistently outcompeted by Omicron BA.2 throughout nine Swedish health-care regions (Figures 2A and 2B). Retrospective analysis of lagging WGS data from the same time period indeed confirmed this trend at the national level (Figure S3F), visualizing the co-occurrence of the BA.1/BA.2 waves in Sweden. Importantly, our data showed that cases of BA.2 infection presented nearly 2-fold higher levels of viral RNA in the upper airways compared with BA.1 infection. Given droplet and aerosol transmission of the virus, this result is consistent with the notion of an elevated viral load contributing to increased transmissibility of BA.2, as immune evasion does not seem to be increased compared to BA.1.9, 10, 11 However, our results do not exclude or question the possibility of other mechanisms that might add to the BA.2 transmissibility. Our direct Omicron BA.1-typing assay is a directly compatible addition to the well-established CDC N1/RNaseP probe sets and extraction-free SARS-CoV-2 RT-qPCR4 and can thus easily be deployed for instant monitoring of the Omicron BA.1/BA.2 transition where needed, avoiding the time lag and sample number bottleneck of genotyping by WGS. Importantly, lineage assignment in the primary RT-PCR enabled an inclusive quantification of viral RNA levels in all samples of a large population. This is in contrast to backtracking RNA levels after obtained WGS results, which biases sample inclusion toward strongly positive samples from which successful WGS libraries can be obtained (Figure S2A). The S BA1 -Cy5 primer-probe set that we developed could readily be replaced to target and monitor other SARS-CoV-2 variants, and our approach can be adapted to other viruses of interest in the future.
Limitations of the study
Here, we have measured viral RNA levels by quantitative RT-PCR, which although being the gold standard for clinical testing, may not necessarily scale with amounts of active viral particles.6 Coronaviruses generate subgenomic RNAs that are more abundant than genomic RNA copies,7 which could affect quantification of SARS-CoV-2 copy numbers by RT-PCR. Quantification of infectious viral levels requires active virus isolation in cell culture, which is not practically feasible to achieve from clinical samples at a large scale, such as in this study. We present our RT-PCR data in qualitative (e.g., COVID-19 and BA.1 status) or relative terms (e.g., BA.1 versus BA.2 CT values/fold changes), which we thoroughly show to be robust within our experimental settings. However, exact CT values, while correlative, will differ depending on sample preparation procedures and experimental protocols (e.g., see Figures S2E and S2F).
Ethics statement
Ethical oversight and approval were obtained by the Swedish Ethical Review Authority (Dnr 2020-01945 and 2022-01139-02, Etikprövningsmyndigheten).
STAR★Methods
Key resources table
| REAGENT or RESOURCE | SOURCE | IDENTIFIER |
|---|---|---|
| Bacterial and virus strains | ||
| SARS-CoV-2 Omicron BA.1 in vitro expanded | Public Health Agency of Sweden | N/A |
| SARS-CoV-2 Alpha strain in vitro expanded | Public Health Agency of Sweden | N/A |
| Biological samples | ||
| SARS-CoV-2 upper airway samples (throat, saliva, and bilateral nostril sampling) | Public Health Agency of Sweden | N/A |
| Critical commercial assays | ||
| TaqPath 1-Step RT-qPCR Master Mix, CG | Thermo Fisher | Cat#A15300 |
| Thermo Fisher TaqMan SARS-CoV-2 Mutation Panel Assay | Thermo Fisher | Cat#A51814 Cat#A51808 Cat#A51813 Cat#A51819 |
| SARS-CoV-2 One-Step RT-PCR Kit, RdRp and N Genes, IVD | NZYTech | Cat#MD0483 |
| Illumina COVIDSeq Test | Illumina | Cat#20043675 |
| MagMAX Viral/Pathogen II Nucleic Acid Isolation Kit | Thermo Fisher | Cat#A48383 |
| Deposited data | ||
| Raw sequencing data | ArrayExpress | E-MTAB-11650 |
| Assembled SARS-CoV-2 genomes | GISAID | EPI_ISL_11414777 - 11415389 and EPI_ISL_11450500 - 11450677 |
| RT-PCR CT values | This paper | Table S2, S3, and S5 |
| Tables S1, S2, S3, S4, S5, and S6 | Mendeley Data | https://doi.org/10.17632/2z3t52wdy8.1 |
| Oligonucleotides | ||
| SARS-CoV-2 primers and probes | This paper | Table S1 |
| Software and algorithms | ||
| QuantStudio Design & Analysis Software | Applied Biosystems | v1.5.2 |
| fastp | github.com/OpenGene/fastp | v0.20.0 |
| MEGAHIT | github.com/voutcn/megahit | v1.2.9 |
| RagTag | github.com/malonge/RagTag | v2.1.0 |
| Pangolin | pangolin.cog-uk.io | v3.1.20 / v4.0.6 |
| Minimap2 | github.com/lh3/minimap2 | v2.24-r1122 |
| Nextclade | clades.nextstrain.org | v1.14.0 |
| R | r-project.org | v4.2.0 |
| data.table | CRAN | v1.14.2 |
| ggplot2 | CRAN | v3.3.6 |
| quantreg | CRAN | v5.93 |
| Other | ||
| Computational code | This paper | https://doi.org/10.5281/zenodo.6866026 |
Resource availability
Lead contact
Further information and requests for resources and reagents should be directed to and will be fulfilled by the lead contact, Björn Reinius (bjorn.reinius@ki.se).
Materials availability
-
•
This study used custom RT-PCR primer-probe sets. Their sequences and oligonucleotide modifications of these are provided in Table S1.
Experimental model and subject details
In vitro expanded SARS-CoV-2 strains
The in vitro expanded Omicron BA.1 reference RNA sample used for the evaluation of SBA1 primer-probe sets (Figures S1A and S2B) was obtained from the Public Health Agency of Sweden (sample isolated Nov 30, 2021; GISAID Accession ID: EPI_ISL_7452247), and the non-Omicron BA.1 reference sample (lacking “S:N211IN212-” and “S:214:EPE”) was an Alpha B.1.1.7 (sample isolated Feb 1, 202112).
Human SARS-CoV-2 samples
Following the initial selection of the SBA1 primer-probe set, which was performed on in vitro specimens to allow timely large-scale oligonucleotide synthesis needed for the population monitoring, all further evaluation was performed on anonymized clinical specimens, as described in the results. All samples were collected by self-sampling using the same kit and a standard operating procedure for throat, saliva, and bilateral nostril sampling, established by the Public Health Agency of Sweden (See instructions in Data S1). 174,933 upper pharynx samples were analysed January 26th – March 8th 2022 (Table S3). The specimens were collected in a fixed volume of 1 mL physiological saline (0.9% NaCl). Upon arrival to the laboratory, the tubes were inactivated by heating at 70°C for 50 min in a hot air oven. All samples included in the study were analysed for presences of SARS-CoV-2 as part of clinical diagnostics performed at ABC Labs, Stockholm, by demand of the Public Health Agency of Sweden. The self-testing program as stated by the Public Health Agency of Sweden was open during the whole period, and sampling was open on Monday through Saturday every week. Indication for testing was self-assessed symptoms up until the 9th of February 2022, at which the Swedish national COVID-19 testing policy changed. From the 9th of February and onwards, testing was restricted to persons with medical indication, patients and care givers in elderly care, tracing, and regional screening of patients. This policy shift is reflected as a drop in overall sample numbers after February 9th (Figure 2A). Importantly, we registered the difference in SARS-CoV-2 viral RNA load between BA.1 and non-BA.1 SARS-CoV-2 positive cases consistently before as well as after the change in testing policy (P Before = 7.35x10−157, NBefore = 80,264 SARS-CoV-2 positive samples, P After = 5.78x10⁻¹⁴, NAfter = 12,862 SARS-CoV-2 positive samples, Mann-Whitney U-test) (Figure S2C). Testing was provided free of charge. The use of the Omicron BA.1 screening protocol was validated at ABC Labs and approved by the Public Health Agency of Sweden. For the purpose and analyses of the current study, sample identities were anonymised, and IDs were replaced by a randomized code (i.e., those listed in supplementary tables). The vaccination status of the individual specimens included in this study was not accessible, but the overall vaccination rate in Sweden was: 86.4% (1 dose); 83.5% (≥2 doses) at the start of the study January 26th, and 86.8% (1 dose); 84.5% (≥2 doses) at the end of the study March 8th (data obtained from the Public Health Agency of Sweden). Informed consent for the use of anonymized CT values or samples obtained in routine clinical diagnostics was not obtained and not required, in accordance with the study permit obtained by the Swedish Ethical Review Authority (Dnr 2020-01945 and 2022-01139-02, Etikprövningsmyndigheten).
Method details
SARS-CoV-2 RT-PCR
The SARS-CoV-2 RT-PCR assay used in this study represents an improved, multiplex-version of our previously described RNA-extraction-free protocol4 with increased sample and reaction volume and increased sensitivity. For each reaction, 24 uL RT-PCR master mix was prepared, containing 7.5 μL TaqPath 1-Step RT-qPCR Master Mix, CG (Thermo Fisher, containing ROX as passive reference), 0.9 μL 10% Tween20 (Sigma), N1 primer-probe mix (IDT 2019-nCov CDC; FAM/BHQ1, Integrated DNA Technologies), SBA1 primer-probe mix (Cy-5/BHQ2; Merck), RNaseP primer-probe mix (HEX/BHQ1; Merck), and nuclease free water up to 24 uL. Primer/Probe concentrations in the final reactions were 246/62 nM (N1), 491/125 nM (SBA1), and 122/37 nM (RNaseP). Primer and probe sequences of the final assay are provided in Table S1B. For RT-PCR testing, 6 μL heat-inactivated nasopharyngeal swab sample (in 0.9% NaCl) was added to optical 96-well PCR plates (EnduraPlate, Applied Biosystems) containing 24 μL master mix, using a liquid handling robot with automatic sample barcode scanner (Fluent 480, Fluent 780, or Fluent 1080; Tecan). Each PCR plate contained a negative control (water) and an Omicron BA.1 positive control sample of low viral load (median N1 CT = 30.4), utilized as calibrator sample (Figures S2F and S2G). Plates were sealed and centrifuged for 30 s at 1500 g. RT-PCR was performed on QuantStudio real-time PCR machines (Applied Biosystems) using the QuantStudio Design & Analysis Software v1.5.2 and temperature cycles: 25 °C for 2 min, 50 °C for 10 min, 95 °C for 2 min, and 40 cycles of 95 °C for 3 s and 56 °C for 30 s. To test log-linear CT range for the N1 and S BA1 primer-probe sets in the assay conditions, a strongly positive Omicron BA.1 clinical sample was serial-diluted 1:10 in steps and RT-PCR was performed in 8 replicates per concentration. To test whether addition of the S BA1 primer-probe affected N1 CTs, we performed SARS-CoV-2 RT-PCR with and without presence of the SBA1 primer-probe set in parallel on 185 clinical samples (133 known positives, 52 negatives) and compared N1 CTs (Figure 1D). Plate-normalized CT values (Figure S2F) were calculated C T N1 sample i, plate j – (median(C T N1 calibrator, plate 1-1952 ) – C T N1 calibrator, plate j ). In the parallel genotyping of 133 SARS-CoV-2-positive samples (Figure 1E), we used the Thermo Fisher TaqMan SARS-CoV-2 Mutation Panel Assay (according to the manufacturer’s instructions) and our SARS-CoV-2 N1/RP/S BA1 assay. Extraction-based SARS-CoV-2 One-Step RT-PCR Kit, RdRp and N Genes, IVD (NZYTech) (Figures S2H–SJ) was performed according to the manufacturer’s instructions (Version 13/2021, December 2021).
SARS-CoV-2 WGS
For sequencing of SARS-CoV-2 genomes, we used the Illumina COVIDSeq Test kit (Illumina) and sequencing was performed on the Illumina NextSeq 550 Sequencing System. RNA extraction prior to WGS library preparation was performed using the KingFisher Flex System and the MagMAX Viral/Pathogen II Nucleic Acid Isolation Kit (Cat. A48383).
Sequencing data analysis
Raw data was quality trimmed using fastp13 v0.20.0 and de novo assembled using MEGAHIT14 v1.2.9 [--min-contig-len 5000]. Disjoint contigs were scaffolded against the SARS-CoV-2 reference genome [ASM985889v3] using RagTag15 v2.1.0 and SARS-CoV-2 lineage was assigned using pangolin16 v3.1.20 [lineages version 2022-02-28] and repeated using pangolin v4.0.6 [pangolin-data v1.8] for updated sublineage classification. Alignment statistics was obtained using Minimap217 v2.24-r1122 [-ax sr Sars_cov_2.ASM985889v3.dna_sm.toplevel.fa.gz] and samtools18 v1.10 [stats] [coverage]. Identification of SARS-CoV-2 mutations was performed using Nextclade19 v1.14.0. Fraction of total sequenced genomes falling into defined variant or lineage groups at national level was obtained for Swedish samples from Covariants.org, accessed 2022-05-24. Computational code is available at https://github.com/reiniuslab/OmicronWaves/ and https://doi.org/10.5281/zenodo.6866026.
Acknowledgments
We are grateful to members of the Reinius lab and ABC Labs, helping at various stages of the project. In vitro expanded Omicron BA.1 inoculate was kindly provided by the Public Health Agency of Sweden, and we thank Sandra Söderholm and Shaman Muradrasoli for facilitating transfer of this sample. We thank Jessica Alm at the National Pandemic Center (NPC), Karolinska Institutet, for providing anonymized control samples. Research was funded by the SciLifeLab/KAW National COVID-19 Research Program (2020.0182, 2020.0241, V-2020-0699), the Swedish Research Council (2017-01723), the Ragnar Söderberg Foundation (M16/17), and the Knut and Alice Wallenberg Foundation (KAW 2021.0142). In accordance with the funding agencies’ policy for COVID-19-related research, the results of this study were made publicly available in preprint form (https://doi.org/10.1101/2022.03.26.22272984, first version online March 27, 2022).
Author contributions
A.L. performed WGS data processing, data analysis and visualization, statistical analyses, prepared figures, wrote the initial draft, and edited the manuscript. A.P. performed Thermo Fisher TaqMan SARS-CoV-2 Mutation Panel Assay. O.W. provided resources, coordinated the project, and edited the manuscript. B.R. provided resources, coordinated the project, designed the BA.1 assay, performed RT-PCR, analyzed the data, prepared figures, wrote the initial draft, and edited the manuscript. All authors had unrestricted access to all data, read and approved the final version of the manuscript, and take responsibility for its content.
Declaration of interests
Björn Reinius is a founder and a shareholder of GeneBeats and has worked as a consultant on SARS-CoV-2 RT-PCR diagnostics. Ola Winqvist is a founder and a shareholder of ABC Labs.
Published: August 8, 2022
Footnotes
Supplemental information can be found online at https://doi.org/10.1016/j.medj.2022.07.007.
Supplemental information
Data and code availability
-
•
Raw sequencing data have been deposited at ArrayExpress and are publicly available as of the date of publication. Assembled SARS-CoV-2 genomes have been deposited at GISAID and are publicly available as of the date of publication. Accession numbers are listed in the key resources table.
-
•
All original code has been deposited at https://github.com/reiniuslab/OmicronWaves/ and is publicly available as of the date of publication. Release version is listed in the key resources table.
-
•
Any additional information required to reanalyse the data reported in this paper is available from the lead contact upon request.
References
- 1.World Health Organization Tracking SARS-CoV-2 variants. https://www.who.int/en/activities/tracking-SARS-CoV-2-variants/
- 2.Institute for Health Metrics and Evaluation IHME | COVID-19 Projections. https://covid19.healthdata.org/ Institute for Health Metrics and Evaluation.
- 3.Lu X., Wang L., Sakthivel S.K., Whitaker B., Murray J., Kamili S., Lynch B., Malapati L., Burke S.A., Harcourt J., et al. US CDC real-time reverse transcription PCR Panel for detection of severe acute respiratory syndrome coronavirus 2. Emerg. Infect. Dis. 2020;26:1654–1665. doi: 10.3201/eid2608.201246. [DOI] [PMC free article] [PubMed] [Google Scholar]
- 4.Smyrlaki I., Ekman M., Lentini A., Rufino de Sousa N., Papanicolaou N., Vondracek M., Aarum J., Safari H., Muradrasoli S., Rothfuchs A.G., et al. Massive and rapid COVID-19 testing is feasible by extraction-free SARS-CoV-2 RT-PCR. Nat. Commun. 2020;11:4812. doi: 10.1038/s41467-020-18611-5. [DOI] [PMC free article] [PubMed] [Google Scholar]
- 5.Hay J.A., Kissler S.M., Fauver J.R., Mack C., Tai C.G., Samant R.M., Connelly S., Anderson D.J., Khullar G., MacKay M., et al. Viral dynamics and duration of PCR positivity of the SARS-CoV-2 Omicron variant. Epidemiology. 2022 doi: 10.1101/2022.01.13.22269257. [DOI] [Google Scholar]
- 6.Puhach O., Adea K., Hulo N., Sattonnet P., Genecand C., Iten A., Jacquérioz F., Kaiser L., Vetter P., Eckerle I., Meyer B. Infectious viral load in unvaccinated and vaccinated individuals infected with ancestral, Delta or Omicron SARS-CoV-2. Nat. Med. 2022;28:1491–1500. doi: 10.1038/s41591-022-01816-0. [DOI] [PubMed] [Google Scholar]
- 7.Sawicki S.G., Sawicki D.L. In: Corona- and Related Viruses. Talbot P.J., Levy G.A., editors. Springer US; 1995. Coronaviruses use discontinuous extension for synthesis of subgenome-length negative strands; pp. 499–506. [DOI] [PubMed] [Google Scholar]
- 8.Colson P., Fournier P., Delerce J., Million M., Bedotto M., Houhamdi L., Yahi N., Bayette J., Levasseur A., Fantini J., et al. Culture and identification of a “Deltamicron” SARS-CoV-2 in a three cases cluster in southern France. J. Med. Virol. 2022;94:3739–3749. doi: 10.1002/jmv.27789. [DOI] [PMC free article] [PubMed] [Google Scholar]
- 9.Arora P., Zhang L., Rocha C., Sidarovich A., Kempf A., Schulz S., Cossmann A., Manger B., Baier E., Tampe B., et al. Comparable neutralisation evasion of SARS-CoV-2 Omicron subvariants BA.1, BA.2, and BA.3. Lancet Infect Dis. 2022;22:766–767. doi: 10.1016/S1473-3099(22)00224-9. S1473309922002249. [DOI] [PMC free article] [PubMed] [Google Scholar]
- 10.Chen L.-L., Chu A.W.-H., Zhang R.R.-Q., Hung I.F.-N., To K.K.-W. Serum neutralisation of the SARS-CoV-2 Omicron sublineage BA.2. Lancet Microbe. 2022;3:e404. doi: 10.1016/S2666-5247(22)00060-X. S266652472200060X. [DOI] [PMC free article] [PubMed] [Google Scholar]
- 11.Yu J., Collier A.R.Y., Rowe M., Mardas F., Ventura J.D., Wan H., Miller J., Powers O., Chung B., Siamatu M., et al. Neutralization of the SARS-CoV-2 Omicron BA.1 and BA.2 variants. N. Engl. J. Med. 2022;386:1579–1580. doi: 10.1056/NEJMc2201849. [DOI] [PMC free article] [PubMed] [Google Scholar]
- 12.Lentini A., Papanicolaou N., Reinius B. 2021. Whole genome sequencing of in vitro propagated SARS-CoV-2 at the Karolinska Institutet BSL-3 core facility. [DOI] [Google Scholar]
- 13.Chen S., Zhou Y., Chen Y., Gu J. fastp: an ultra-fast all-in-one FASTQ preprocessor. Bioinformatics. 2018;34:i884–i890. doi: 10.1093/bioinformatics/bty560. [DOI] [PMC free article] [PubMed] [Google Scholar]
- 14.Li D., Liu C.-M., Luo R., Sadakane K., Lam T.-W. MEGAHIT: an ultra-fast single-node solution for large and complex metagenomics assembly via succinct de Bruijn graph. Bioinformatics. 2015;31:1674–1676. doi: 10.1093/bioinformatics/btv033. [DOI] [PubMed] [Google Scholar]
- 15.Alonge M., Lebeigle L., Kirsche M., Aganezov S., Wang X., Lippman Z.B., Schatz M.C., Soyk S. Automated assembly scaffolding elevates a new tomato system for high-throughput genome editing. Plant Biol. 2021 doi: 10.1101/2021.11.18.469135. [DOI] [PMC free article] [PubMed] [Google Scholar]
- 16.O’Toole Á., Scher E., Underwood A., Jackson B., Hill V., McCrone J.T., Colquhoun R., Ruis C., Abu-Dahab K., Taylor B., et al. Assignment of epidemiological lineages in an emerging pandemic using the pangolin tool. Virus Evolution. 2021;7:veab064. doi: 10.1093/ve/veab064. [DOI] [PMC free article] [PubMed] [Google Scholar]
- 17.Li H. Minimap2: pairwise alignment for nucleotide sequences. Bioinformatics. 2018;34:3094–3100. doi: 10.1093/bioinformatics/bty191. [DOI] [PMC free article] [PubMed] [Google Scholar]
- 18.Li H., Handsaker B., Wysoker A., Fennell T., Ruan J., Homer N., Marth G., Abecasis G., Durbin R., 1000 Genome Project Data Processing Subgroup The sequence alignment/map format and SAMtools. Bioinformatics. 2009;25:2078–2079. doi: 10.1093/bioinformatics/btp352. [DOI] [PMC free article] [PubMed] [Google Scholar]
- 19.Aksamentov I., Roemer C., Hodcroft E., Neher R. Nextclade: clade assignment, mutation calling and quality control for viral genomes. J. Open Source Softw. 2021;6:3773. [Google Scholar]
Associated Data
This section collects any data citations, data availability statements, or supplementary materials included in this article.
Supplementary Materials
Data Availability Statement
-
•
Raw sequencing data have been deposited at ArrayExpress and are publicly available as of the date of publication. Assembled SARS-CoV-2 genomes have been deposited at GISAID and are publicly available as of the date of publication. Accession numbers are listed in the key resources table.
-
•
All original code has been deposited at https://github.com/reiniuslab/OmicronWaves/ and is publicly available as of the date of publication. Release version is listed in the key resources table.
-
•
Any additional information required to reanalyse the data reported in this paper is available from the lead contact upon request.