

Abstract
Introduction
Multiple positron emission tomography (PET) tracers are available for amyloid imaging, posing a significant challenge to consensus interpretation and quantitative analysis. We accordingly developed and validated a deep learning model as a harmonization strategy.
Method
A Residual Inception Encoder‐Decoder Neural Network was developed to harmonize images between amyloid PET image pairs made with Pittsburgh Compound‐B and florbetapir tracers. The model was trained using a dataset with 92 subjects with 10‐fold cross validation and its generalizability was further examined using an independent external dataset of 46 subjects.
Results
Significantly stronger between‐tracer correlations (P < .001) were observed after harmonization for both global amyloid burden indices and voxel‐wise measurements in the training cohort and the external testing cohort.
Discussion
We proposed and validated a novel encoder‐decoder based deep model to harmonize amyloid PET imaging data from different tracers. Further investigation is ongoing to improve the model and apply to additional tracers.
Keywords: Alzheimer's disease, amyloid PET, Centiloid
1. BACKGROUND
Amyloid and tau are the defining pathologies of Alzheimer's disease (AD) and their abnormality initiates long before clinical symptom onset. 1 While postmortem neuropathological assessments are the gold standard for determining the existence and severity of these pathologies, 2 , 3 the development of radio‐labelled tracers allows the in vivo detection and quantification of amyloid and tau burdens using positron emission tomography (PET). 4 , 5 Since the development of these PET tracers, they have been adopted in many research studies including the Alzheimer's Disease Neuroimaging Initiative, 6 the Dominantly Inherited Alzheimer's Network 7 and others. 8 , 9 It is determined that amyloid plaques can be detected at least 15 years prior to AD symptom onset 10 and the prevalence of amyloid positivity increases with age from approximately 10% at age 50% to 44% at age 90 in cognitively normal populations. 11 Imaging measurements of brain amyloid and tau pathology help to define AD in its preclinical stage and allow the investigation of the genesis and progression of AD. 12 Many clinical trials have been designed to include amyloid and tau PET imaging for the assessment of treatment efficacy and target engagement as surrogate biomarkers. 13 , 14 , 15 , 16 Human amyloid imaging started more than 15 years ago with the development of Pittsburgh Compound‐B (PIB), 17 and has since been widely adopted by many research groups. 18 , 19 Because of its short half‐life (20 min), the use of PIB is limited to large research centers with access to onsite cyclotron and experienced radiochemistry teams. A number of F18 labeled amyloid tracers were later developed to address this limitation including florbetapir (FBP), 20 florbetaben (FBB), 21 flutemetamol, 22 and NAV4694, 23 with the first three subsequently receiving FDA approval for amyloid imaging. With multiple PET tracers designed for the same target pathology, each tracer has its own target binding affinity, tracer kinetic behavior, non‐specific binding, and tissue retention, hence the imaging data that are acquired display tracer‐dependent characteristics. Recent cross‐sectional comparison studies demonstrated that the global amyloid burden measures derived from PIB and FBP have a shared variance ranging from approximately 70% to 90% depending on the quantification pipelines and cohorts. 24 , 25 , 26 These tracers also show different levels of variability in the amyloid burden measurements. 24 , 25 , 26 Inter‐tracer variability leads to inconsistent amyloid positivity threshold and poses challenges for multicenter studies. A mean cortical FBP standard uptake value ratio (SUVR) cutoff of 1.17 was determined to detect moderate to frequent brain amyloid burden based on pathological assessment 27 and this can be converted to a Centiloid (CL) cutoff of 37.1 CL using published equations 24 ; a recent study based on PIB imaging found a threshold of 20.1 CL to be optimal 28 ; and a FBB based study determined a threshold of 19 CL. 29 The CL approach 30 was proposed to define a common numerical scale hoping to unify the global amyloid measures derived from different tracers and analysis pipelines. However, the amyloid measurements still have the same level of correlation between tracers, and the inherent signal to noise property also remains the same. Differences in amyloid measurements across tracers also pose problems for longitudinal studies. The tracer difference results in different capabilities of tracking longitudinal amyloid accumulation which is especially important in clinical trials. In our recent study, we estimated that the sample size needed to detect a 20% reduction in the rate of amyloid accumulation was 305 per arm when PIB is used as the amyloid tracer while a sample size of 2156 is needed for FBP. 25 Furthermore, strategies enabling the detection of focused changes and investigating the spatial patterns of pathological changes which require regional and voxel‐level details are currently lacking. One viable solution may be the emerging Artificial Intelligence technology: deep learning (DL).
RESEARCH‐IN‐CONTEXT
Systematic review: To quantify beta‐amyloid deposition in the brain, the use of multiple amyloid tracers with varied characteristics poses a major challenge to interpretation, to the ability to combine results from cross‐center studies, and to efforts to define a common positivity threshold. We propose a deep learning (DL) model as a harmonization strategy to generate imputed amyloid PET images of one amyloid tracer to the images of another.
Interpretation: We demonstrate that DL is an effective approach for harmonizing PET imaging data obtained from different tracers targeting the same underlying pathophysiology.
Future directions: This technique can potentially allow interchangeable use of amyloid tracers in research and clinical applications without the need to develop tracer specific interpretations of the images in PET imaging. The approach has the potential to be extended to tau PET imaging.
Deep learning has been successfully implemented in computer vision domains for decades. Only recently has it become a technique used in medical imaging and AD research. 31 , 32 , 33 DL, a subset of Machine Learning 34 is an end‐to‐end framework for prediction and biomarker discovery. Most recently, one DL approach is gaining traction to generate synthetic images of a missing modality based on input images of a related but different modality. 33 , 35 This approach was initially developed to address the missing data problem 33 and later adopted in estimating the attenuation map from magnetic resonance (MR) imaging data to allow accurate attenuation correction for PET/MR hybrid scanners. 35 We previously developed a new model termed Residual Inception Encoder‐Decoder Neural Network (RIED‐Net) 36 to render enhanced images from Contrast‐Enhanced Digital Mammography and support breast cancer diagnosis. The success of RIED‐Net motivated this research to explore its applicability to harmonizing PET imaging from different tracers, specifically, generating synthetic PIB images from FBP data and evaluate its performance using two independent datasets, one for training, validation, and testing, and one for external validation.
2. METHODS
2.1. Participants
From the Open Access Series of Imaging Studies‐3 dataset, 37 92 participants aged 43 to 88 years were identified who had PIB and FBP PET scans within 3 months (the acronym OASIS is used herein for the selected dataset). This dataset was used for training and cross‐validation of the RIED‐Net as a PET harmonization model. An independent dataset 24 of 46 participants aged 21 to 89 years with paired PIB and FBP PET scans were downloaded from the Centiloid Project website (http://www.gaain.org/centiloid‐project) and served as the external testing set (herein referred to as GAAIN). Demographic information of the two cohorts is summarized in Table 1 and the Supplementary Material (in the Supporting Information). All studies were approved by their corresponding institutional review boards and written informed consent was obtained for each participant.
TABLE 1.
Summary of demographic information of the two cohorts used in the study
| OASIS (n = 92) | GAAIN (n = 46) | P‐value | |
|---|---|---|---|
| Age | 68 ± 9 (43 to 88) | 58 ± 21 (21 to 89) | .000092 |
| Sex(M/F) | 44/48 | 27/19 | .228 |
| APOE4 (NC/HT/HM) | 60/27/5 | 31/13/2 | .95 |
| MMSE | 29.2 ± 1.0 (26 to 30) | 25.8 ± 4.9 (8 to 30) | 2.39E‐09 |
| Amyloid burden in Centiloid | 14.0 ± 29.7 | 47.8 ± 54.1 | .0002 |
| (–12.8 to 146.3) | (–9.2 to 151.9) |
Abbreviations: OASIS, Open Access Series of Imaging Studies; GAAIN, Centiloid Project; MMSE, Mini‐Mental State Exam.
2.2. Imaging
For the OASIS dataset, dynamic PIB PET scan was acquired on a Siemens Biograph 40 PET/CT or a Siemens/CTI EXACT HR+ scanner for 60 minutes after tracer administration and reconstructed using standard iterative methods with attenuation and scatter correction. Dynamic FBP PET was acquired on a Siemens Biograph mMR scanner for 70 minutes after FBP administration and reconstructed using an OSEM algorithm and attenuation/scatter corrected using a separately acquired low dose CT scan. For each participant, a T1‐weighted MR scan was also acquired using a 3T MR scanner. All imaging was conducted at the Washington University in St. Louis, and individual scans for each participant were completed within 3 months. The imaging acquisition information for the GAAIN dataset has been previously described in. 24 Briefly, PIB PET was acquired between 50 and 70 minutes post‐injection, and FBP PET was acquired 50 to 60 minutes. The imaging pair was obtained on average of 18 days apart, and a 3T T1 MR image was obtained for each subject within 6 months of PET acquisition. One participant in the GAAIN cohort was excluded from further analysis due to poor quality of the T1 MR scan.
The T1‐weighted MR data were analyzed using FreeSurfer (Martinos Center for Biomedical Imaging, Charlestown, Massachusetts, USA) to define anatomical regions. Amyloid PET imaging quantification was then performed using our standard protocols that included scanner harmonization, motion correction, target registration, and regional value extraction 38 , 39 using a PET unified pipeline. The output included a SUVR image using cerebellar cortex as the reference region and a mean cortical SUVR (MCSUVR) as the global index of brain amyloid burden. 38 , 39 For the OASIS cohort, the PIB PET data were summed between 30 and 60 minutes and the FBP data were summed between 50 and 70 minutes post‐injection to generate the SUVR images and the MCSUVR global indices. For the GAAIN cohort, the PIB and FBP PET data were summed between the 50 and 70 minutes and a post‐injection window of 50 to 60 minutes for the quantification. The SUVR images were transformed in to the MNI152 template space via affine transformation established based on the T1 MR image and served as the input to the RIED‐Net model for training, internal validation, and external validation. All MCSUVR measurements were also converted to the CL scale using pre‐established equations and procedures 25 , 40 to facilitate the cross‐tracer comparison and interpretation.
2.3. Deep learning model for PET harmonization
RIED‐Net was designed to estimate the voxel‐wise non‐linear mapping between input (FBP) and output (PIB) images. In this mapping, letting the FBP image be , and the PIB image be , the relationship between the two can be defined as
where denotes the nonlinear mapping between the FBP‐PIB pair. The image synthesis problem is to make an estimation of the function
The overall architecture of RIED‐Net is shown in Figure 1. It consists of nine residual blocks, where the encoding path consists of five blocks and the decoding path of the remaining four blocks using an architecture similar to U‐Net 41 and with the addition of a residual inception shortcut path that has been shown to improve training efficiency. 42 Each block has a conventional convolution/deconvolution path with two convolutional layers, and in parallel a convolution path, and the output matrices from these two parallel paths are summed together and down/up sampled by a factor of 2 to serve as the input to the next block. Additional technical details are provided in Supplementary Material.
FIGURE 1.
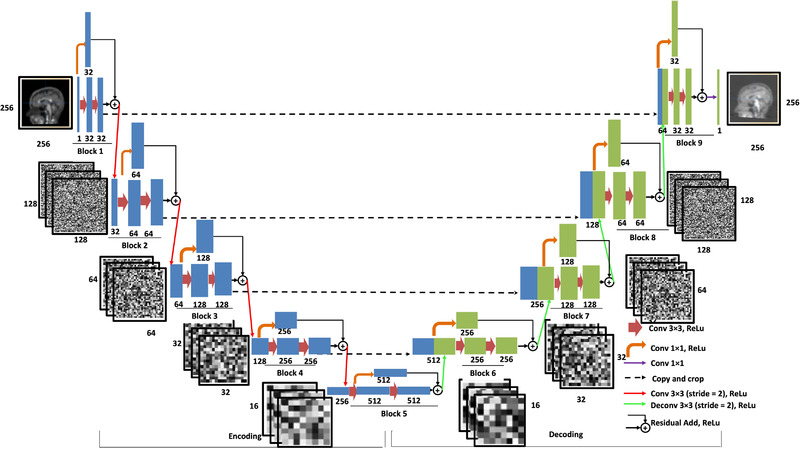
Overall architecture of RIED‐Net. The RIED‐Net model in this work adopted a U‐Net‐like architecture with the addition of a residual inception short‐cut path which has been shown to improve the efficiency of model training. The overall model has five encoding blocks and four decoding blocks. Each blue rectangle represents a data matrix generated from the convolution operations (arrows) within the encoding blocks, and the number below each rectangle indicates the number of channels within each matrix. The leftmost thin blue rectangle represents the input data, a 2D slice from the florbetapir image (256 × 256 × 1 matrix, i.e., one channel). Similarly, each green rectangle represents a data matrix generated from the convolution/deconvolution operations within the decoding blocks, and again the number below indicates the number of channels within the corresponding matrix. Notice as the input of each decoding layer, a blue rectangle from the matching encoding block is appended by a green rectangle from the output of the previous block. Each brown arrow represents a multi‐channel convolutional operation with a 3 × 3 kernel and a rectified linear unit (ReLu) as the activation function (Conv 33, ReLu). Each orange arrow denotes a 11 convolutional operation with a ReLu as the activation function (Conv 1 × 1). The single purple arrow (representing the last step in this network) denotes a 11 convolutional operation that generates the output of synthetic 2D Pittsburgh Compound‐B slice. Each black dotted arrow denotes a copying operation. Each red arrow denotes a 33 convolutional operation (stride = 2, with a ReLu as the activation function), and each green arrow denotes a 33 deconvolutional operation (stride = 2, with a ReLu as the activation function). Additional details of the model are included in the supplementary material
We used 10‐fold cross validation in the training. Specifically, for the OASIS dataset, we shuffled the dataset randomly and created 10 different groups of the dataset; for an even split, we decided to use 90 out of 92 total samples (excluding the last two participants according to alphabetical order) and created 10 different folds of size 81:9 (total 90), where 81 were used for training and validation, and nine were used for testing. These folds are generated such that there is no overlap among the training and testing samples and the test dataset in each fold is always unique. We performed this 10‐fold cross‐validation technique for all three views: coronal, sagittal, and axial. For each view and fold, individual FBP 2D slices (256 × 256) from the 81 patients were used as the input, and the PIB 2D slices with respect to the same patients were taken as output to train and validate the RIED‐Net model. Among the 2D slices obtained from 81 patients, we used a 90:10 split for training and internal validation. For each fold, we trained the model for a total of 40 epochs with a batch‐size of 16 (determined by the computing resource) and the mean absolute error (MAE) as the loss function optimized by the model. We used Adam 43 as the optimizer with a learning rate of 0.002 and a decay rate of 0.0005. For the other parameters we used default settings of the Keras platform. The validated model for that fold was then used to generate synthetic PIB SUVR images from FBP image for the remaining nine patients serving as testing. Using the 10‐fold CV procedure, a synthetic PIB SUVR image was generated for each view and an average synthetic 3D PIB SUVR image was then generated combining the three views which was used as the main target for performance evaluation.
To obtain a single model from the OASIS dataset and test its performance on the independent GAAIN dataset to further evaluate the generalizability of our approach, we retrained the models using 80 out of the 92 OASIS samples that had the largest field of view coverage and applied the models to generate synthetic PIB SUVR images for samples within the independent GAAIN dataset. Similar to the experiment with the OASIS dataset only, synthetic PIB SUVR images for the GAAIN dataset were generated for each view and the average 3D image across all three views was used as the main target for performance evaluation.
2.4. Statistical analysis
We assessed the performance of RIED‐Net in harmonizing the PIB and FBP images using two different metrics. To determine how well the model harmonized global amyloid measures derived from the two tracers, we used the Pearson's correlation coefficients between the PIB‐derived global amyloid burden measure in CL units (CL_PIB) and the FBP‐derived measure (CL_FBP) before and after applying the harmonization model across participants. To determine the effectiveness of the RIED‐Net model at the local level, voxel‐wise correlation between PIB and FBP SUVR images were evaluated before and after applying the RIED‐Net model to the FBP data. Steiger's test was used to test whether the agreement in global amyloid burden measures was improved after applying the RIED‐Net model and the paired two‐sample t test was used to determine whether there was an improvement in voxel‐wise spatial correlation after Fisher's Z‐transform of the correlation coefficients. To examine the real‐world impact of our proposed harmonization technique, the mean and standard deviation of global amyloid burden in CL scale were also calculated for the young control subjects within the GAAIN dataset to evaluate the signal to noise properties of the global amyloid burden measurements. In addition, amyloid positivity thresholds were estimated based on the 95% specificity criterion and the highest amyloid burden in the young control group for PIB, FBP, and harmonized FBP data.
3. RESULTS
Figure 2 demonstrates MAE loss function convergence for models trained on the three views with 10 folds generated on the OASIS dataset across a total number of 40 epochs. It is known that when the validation cohort loss function value approaches the one in the training cohort, this indicates the model is not overfitting. Under these guidelines and empirical evaluation, we determined the number of epochs as 40. In addition, Figure 2 showed a consistent decrease in loss function (to ∼0.01) with fewer spikes and hence our DL model is stable across all the folds generated on the dataset.
FIGURE 2.
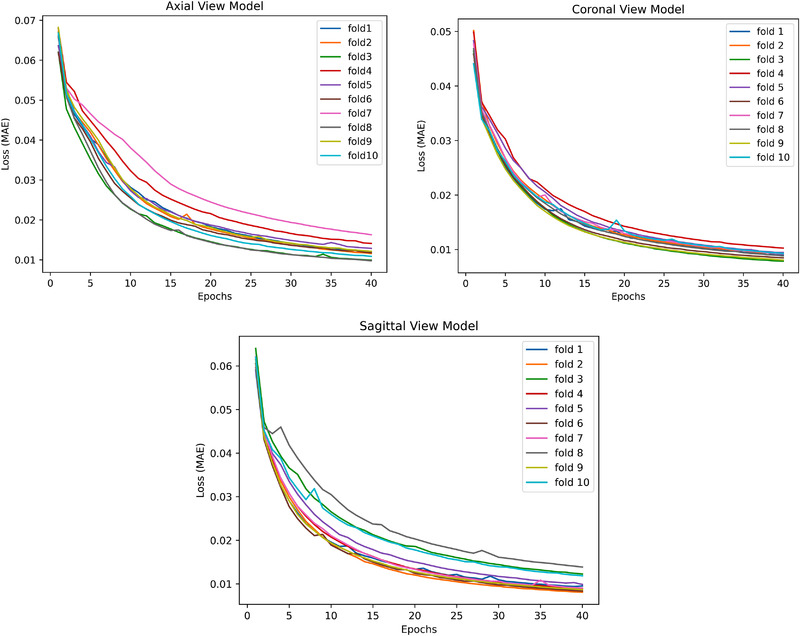
Convergence of MAE (Mean Absolute Error) loss function for models trained on all the three views
Synthetic PIB SUVR images were visually more similar to real PIB data for both the OASIS dataset which was used for training and cross validation and the independent GAAIN dataset (Figure 3). The RIED‐Net model was able to suppress the white matter signal in FBP data as well as non‐brain tissue uptake (most obvious for Figure 3A and D). Quantitatively, the global amyloid burden index was in greater (P = .0006) agreement with the CL_PIB after application of the RIED‐Net model (r = 0.95) (Figure 4B) than before (r = 0.90) (Figure 4A) in the cross‐validation dataset (OASIS). Similar improvements (r = 0.97 vs r = 0.93, P = .0001) were also observed in the independent testing dataset (GAAIN) (Figure 4C and D). Voxel‐wise spatial correlation improved from r = 0.89 before harmonization to r = 0.95 after for the cross‐validation dataset (OASIS) (P < .0001), and from r = 0.90–0.95 with harmonization for the independent testing dataset (GAAIN) (P < .0001). For the young control subjects in the GAAIN dataset, the global amyloid burden measurements were 0.8 ± 4.5 CL based on PIB imaging and 3.9 ± 7.4 CL based on FBP; after the RIED‐Net model was applied to the FBP data the same metric becomes 2.0 ± 3.5 CL (Table 2). The 95% specificity thresholds for amyloid positivity were 8.2, 16.1, and 7.7 CL based on PIB, FBP, and harmonized FBP, respectively, and the thresholds determined from young control max were 11.3, 19.9, and 8.5 CL, respectively, for the same sets of measurements (Table 2).
FIGURE 3.
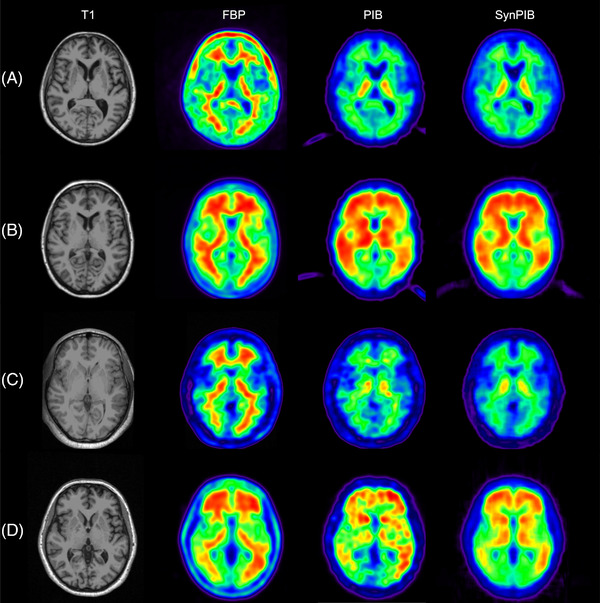
Visual comparison of synthetic images generated using RIED‐Net to real Pittsburgh Compound‐B (PIB) data for the OASIS (Open Access Series of Imaging Studies; panels A and B) and GAAIN (Centiloid Project; panels C and D) datasets used in our study. Panels A and C show representative images from amyloid negative participants and panels B & D are examples from amyloid positive participants. Abbreviations: FBP, florbetapir; SynPIB, synthetic PIB.
FIGURE 4.
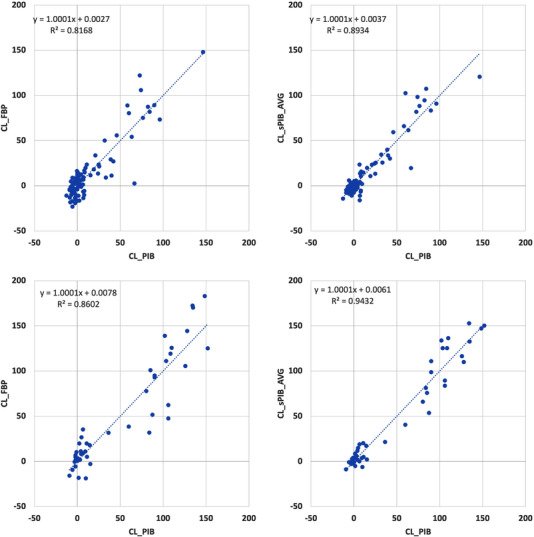
Global amyloid burden index before (A and C) and after (B and D) application of RIED‐Net model on the OASIS (Open Access Series of Imaging Studies) dataset (A and B) and on the GAAIN (Centiloid Project) dataset (C and D). Improved agreement as shown by greater shared variance and Pearson's correlation was observed after using the RIED‐Net model on both datasets (P < .001)
TABLE 2.
Global amyloid burden measurements in centiloid scale (CL) for young control (YC) subjects in GAAIN dataset, 95% specificity thresholds for amyloid positivity and threshold from young control max
| CL_PIB | CL_FBP | CL_PIB_syn | |
|---|---|---|---|
| Mean_YC | 0.8 | 3.9 | 2.0 |
| SD_YC | 4.5 | 7.4 | 3.5 |
| 95% TH | 8.2 | 16.1 | 7.7 |
| YC Max | 11.3 | 19.9 | 8.5 |
Abbreviation: GAAIN, Centiloid Project; PIB, Pittsburgh Compound‐B; FBP, florbetapir.
4. DISCUSSION
We reported for the first time the application of DL techniques to harmonize amyloid PET images acquired using different tracers and demonstrated that the RIED‐Net was able to improve the agreement in amyloid measures from two different tracers for both global indices and voxel‐wise similarities. Furthermore, we demonstrated that our technique is generalizable to external imaging data and achieves favorable performance without additional tuning of the model, considering that the GAAIN dataset was from multiple imaging centers with different image acquisition protocols and cohort characteristics than the OASIS dataset. Our results suggest that the model is robust to variabilities in imaging acquisition protocols and scanner differences when standard scanner harmonization protocols 44 are implemented. The RIED‐Net model is readily applicable to new FBP scans, provided that the FBP scans are fully processed following the same procedure described in our Methods section. Therefore, our proposed DL technique is a promising approach for the harmonization of PET imaging data obtained from different tracers targeting the same underlying pathophysiology.
Compared to DL models from the literature, RIED‐Net has two major advantages. First, existing methods use patch‐based approaches to alleviate computational burden, but this sacrifices synthesis performance at the voxel level. RIED‐Net was designed focusing on voxel mapping with its performance proven to be satisfactory using two separate datasets for validation and testing in this study. The second advantage is from the residual inception block which made RIED‐Net computational affordable, thus it has the potential to perform PET harmonization task in 3D which is one ongoing effort. Recent studies 45 , 46 , 47 have also proposed to use Generative Adversarial Networks (GANs) for image‐to‐image translation and generating highly realistic images. GAN models estimate complex non‐linear relationships by learning estimation of joint probability distribution of the paired images at the whole image scale, but we contend the performance of GAN models on voxel‐to‐voxel level translation may be questionable. In our current implementation, a 2D RIED‐net model was adopted to work with the limited tracer comparison data that are currently available to train a DL model which typically requires thousands of images. Operating in 2D mode, a moderate sized dataset like the OASIS cohort we used in this study with 92 subjects provided more than 20 thousand slices that can be used to train the model and evaluate the performance using cross‐validation strategies. However, a 2D model cannot account for the inherent spatial continuity between adjacent slices and thus results in unwanted noise across slices which can be visually observed. To address this limitation, we trained the RIED‐net model based on each of the three orthogonal views of the input 3D images and then focused our performance evaluation on the average images from the three views. When the RIED‐net model from each single view was evaluated on its own, statistically significant improvements were observed for both global amyloid burden index (P < .01) and voxel‐wise spatial correlation (P < .0001) for the cross‐validation experiment. The improvements remained highly significant when the single view model trained on the OASIS cohort was applied to the independent GAAIN dataset for both metrics (P < .005). The improvements to the global amyloid burden measure were comparable across the different views and the average of three views, while voxel‐wise agreement was significantly better for the average image from three views than individual views in both the OASIS cohort (P < .0001) and the GAAIN cohort (P < .0001).
In this work, SUVR images were first transformed into template space before feeding to the RIED‐net model and only slices within a common field of view were used so that the model was less affected by the variability of patient orientation and field of view coverage. When native space images were used to train the RIED‐net model, similar performance was achieved within the cross‐validation process but failed to generalize to the independent testing data. This suggests spatial normalization as a necessary preprocessing step to obtain favorable results, at least with the moderate amount of data available. Further investigation is warranted to determine whether rigid transformation or a full nonlinear spatial normalization procedure would further improve the model.
The goal of a harmonization technique for amyloid PET imaging is to allow interchangeable use of amyloid tracers in research and clinical applications without the need to design and develop tracer specific interpretations of the images both qualitatively and quantitatively. To demonstrate the effectiveness of our DL approach in achieving this goal, we examined the amyloid positivity threshold determined using a 95% specificity criterion based on the GAAIN dataset. Without applying our RIED‐Net model, the positivity threshold derived from PIB imaging data was 8.2 CL while the threshold derived from FBP data was 16.1 CL, reflecting the higher variability of the amyloid burden measurement using FBP within brains with minimal amyloid deposition. After the application of the RIED‐Net model to generate synthetic PIB images from FBP scans, the positivity threshold became 7.7 CL which is much closer to the PIB‐based positivity threshold. Therefore, our proposed DL approach can substantially improve the interchangeability of amyloid burden measures from PIB and FBP. It should be noted that, in this study, we derived the amyloid positivity threshold based on the 95% specificity criterion using the GAAIN dataset which includes a subset of young adults who are not expected to have amyloid pathology in their brains. These cutoffs are different from the cutoffs that were described in the previous studies where pathological assessment was used as the gold standard. Future studies are warranted to confirm the agreement in amyloid positivity cutoffs in pathologically confirmed cohorts. Further investigation is warranted to reach the goal of a generalizable model that allows full interchangeable use of amyloid PET tracers for clinical interpretation, quantitative determination of amyloid positivity, and longitudinal tracking of amyloid accumulations. This can potentially be achieved by using a larger training dataset, investigative alternative model structures, and leveraging additional imaging modalities such as MR.
In summary, we demonstrated for the first time that a DL approach can be used to harmonize amyloid PET imaging data from two different tracers to provide highly interchangeable amyloid measurement. This approach may also become invaluable for addressing similar problems such as the harmonization of tau PET imaging data from different tracers.
CONFLICT OF INTEREST
Yi Su was supported by NIH grants R01AG031581, R01AG069453, P30AG019610, and Arizona Department of Health Services (ADHS) and the State of Arizona, ADHS Grant No. CTR040636 in partial support of this research work; Yi Su was also supported by NIH grant R01AG055444, R01AG058468, U19AG024904, R42AG053149, R21AG065942, Alzheimer's Association AARG17532945, BrightFocus Foundation ADR A2017272S outside of this work; Yi Su also received consulting fees from Green Valley Pharmaceuticals, LLC. Fei Gao has a patent filing unrelated to this work: “Deep learning based blob detection systems and methods,” and serves as Director/Board Member of DAIS division, IISE (unpaid). Baoxin Li received grant funding outside of this work from Office of Navy Research, served as a consultant for the University of Oklahoma, and received an honorarium for an invited talk at Department of Homeland Security. Eric M. Reiman received NIH grants P30AG019610, U19AG024904, and funding from the State of Arizona in partial support of this research; Eric M. Reiman also received funding from NIH R01AG069453, R01AG031581, R01AG055444, R01AG058468, U01NS093334, OT2OD026549, P01AG052350, U54MD000507, U01AG016976, and R01AG054671, NOMIS Foundation, Gates Venture and State of Arizona; Eric M. Reiman is also a PI of public‐private partnerships that including funding from Roche, Novartis, and Cerveaux; Eric M. Reiman has been a compensated scientific advisor and/or received travel support from Alzheon, Aural Analytics, Denali, Green Valley, Retromer Therapeutics, and Vaxxinity; Eric M. Reiman also has received honoraria for presentations to several academic organizations; Eric M. Reiman is a co‐inventor of a pending patent related to the role of the APOE Christchurch variant in the treatment and prevention of Alzheimer's disease; Eric M. Reiman serves on the Flinn Foundation Board of Directors and is a co‐founder and shareholder of ALZPath, a start‐up company related to the advancement of blood‐based biomarkers in research, treatment development and care. Kewei Chen received funding from NIH and the State of Arizona in partial support of this research and outside of this work; Kewei Chen also served as paid consultant to Green Valley Pharmaceuticals, Beijing Normal University, and the Sixth People's Hospital in Shanghai; Kewei Chen has a patent linking multi‐modal data; Jay Shah, Valentina Ghisays, Ji Luo, Yinghua Chen, Wendy Lee, Yuxiang Zhou, Tammie L.S. Benzinger, and Teresa Wu have nothing further to disclose.
Supporting information
Supporting information
ACKNOWLEDGMENTS
The research is supported in part by R01AG031581, R01AG069453, P30AG019610, Arizona Department of Health Services (ADHS) and the State of Arizona, ADHS Grant No. CTR040636. The funding sources did not play a role in the study design, in the collection, analysis, and interpretation of data, in writing of the report, or in the decision to submit the article for publication. Data were provided in part by OASIS‐3: Principal Investigators: T. Benzinger, D. Marcus, J. Morris; NIH P50 AG005681, P30 NS098577, P01 AG026276, P01 AG003991, R01 AG043434, UL1 TR000448, R01 EB009352. AV‐45 doses were provided by Avid Radiopharmaceuticals, a wholly owned subsidiary of Eli Lilly.
Shah J, Gao F, Li B, et al. Deep residual inception encoder‐decoder network for amyloid PET harmonization. Alzheimer's Dement. 2022;18:2448–2457. 10.1002/alz.12564
Yi Su and Teresa Wu contributed equally to this work.
REFERENCES
- 1. Long JM, Holtzman DM. Alzheimer disease: an update on pathobiology and treatment strategies. Cell. 2019;179(2):312‐339. [DOI] [PMC free article] [PubMed] [Google Scholar]
- 2. Price JL, Davis PB, Morris JC, White DL. The distribution of tangles, plaques and related immunohistochemical markers in healthy aging and Alzheimer's disease. Neurobiol Aging. 1991;12:295‐312. [DOI] [PubMed] [Google Scholar]
- 3. Braak H, Braak E. Neuropathological stageing of Alzheimer‐related changes. Acta Neuropathol. 1991;82:239‐259. [DOI] [PubMed] [Google Scholar]
- 4. Mathis CA, Wang Y, Holt DP, Huang GF, Debnath ML, Klunk WE. Synthesis and evaluation of 11C‐labeled 6‐substituted 2‐arylbenzothiazoles as amyloid imaging agents. J Med Chem. 2003;46:2740‐2754. [DOI] [PubMed] [Google Scholar]
- 5. Chien DT, Bahri S, Szardenings AK, et al. Early clinical PET imaging results with the novel PHF‐tau radioligand [F‐18]‐T807. J Alzheimers Dis. 2013;34:457‐468. [DOI] [PubMed] [Google Scholar]
- 6. Jagust WJ, Landau SM, Koeppe RA, et al. The Alzheimer's Disease Neuroimaging Initiative 2 PET Core: 2015. Alzheimers Dement. 2015;11:757‐771. [DOI] [PMC free article] [PubMed] [Google Scholar]
- 7. Morris JC, Aisen PS, Bateman RJ, et al. Developing an international network for Alzheimer research: the Dominantly Inherited Alzheimer Network. Clin Investig (Lond). 2012;2:975‐984. [DOI] [PMC free article] [PubMed] [Google Scholar]
- 8. Villemagne VL, Pike KE, Chételat G, et al. Longitudinal assessment of Aβ and cognition in aging and Alzheimer disease. Ann Neurol. 2011;69:181‐192. [DOI] [PMC free article] [PubMed] [Google Scholar]
- 9. Fleisher AS, Chen K, Quiroz YT, et al. Florbetapir PET analysis of amyloid‐β deposition in the presenilin 1 E280A autosomal dominant Alzheimer's disease kindred: a cross‐sectional study. Lancet Neurol. 2012;11(12):1057‐1065. 10.1016/s1474-4422(12)70227-2 [DOI] [PMC free article] [PubMed] [Google Scholar]
- 10. Bateman RJ, Xiong C, Benzinger TL, et al. Clinical and biomarker changes in dominantly inherited Alzheimer's disease. N Engl J Med. 2012;367:795‐804. [DOI] [PMC free article] [PubMed] [Google Scholar]
- 11. Jansen WJ, Ossenkoppele R, Knol DL, et al. Prevalence of cerebral amyloid pathology in persons without dementia: a meta‐analysis. JAMA. 2015;313:1924‐1938. [DOI] [PMC free article] [PubMed] [Google Scholar]
- 12. Jack CR Jr, Bennett DA, Blennow K, et al. NIA‐AA research framework: toward a biological definition of Alzheimer's disease. Alzheimers Dement. 2018;14:535‐562. [DOI] [PMC free article] [PubMed] [Google Scholar]
- 13. Rios‐Romenets S, Lopera F, Sink KM, et al. Baseline demographic, clinical, and cognitive characteristics of the Alzheimer's Prevention Initiative (API) Autosomal‐Dominant Alzheimer's Disease Colombia Trial. Alzheimers Dement. 2020;16:1023‐1030. [DOI] [PMC free article] [PubMed] [Google Scholar]
- 14. Lopez Lopez C, Tariot PN, Caputo A, et al. The Alzheimer's Prevention Initiative Generation Program: study design of two randomized controlled trials for individuals at risk for clinical onset of Alzheimer's disease. Alzheimers Dement (N Y). 2019;5:216‐227. [DOI] [PMC free article] [PubMed] [Google Scholar]
- 15. Mills SM, Mallmann J, Santacruz AM, et al. Preclinical trials in autosomal dominant AD: implementation of the DIAN‐TU trial. Rev Neurol (Paris). 2013;169:737‐743. [DOI] [PMC free article] [PubMed] [Google Scholar]
- 16. Sperling RA, Rentz DM, Johnson KA, et al. The A4 study: stopping AD before symptoms begin? Sci Transl Med. 2014;6:228fs13. [DOI] [PMC free article] [PubMed] [Google Scholar]
- 17. Klunk WE, Engler H, Nordberg A, et al. Imaging brain amyloid in Alzheimer's disease with Pittsburgh Compound‐B. Ann Neurol. 2004;55:306‐319. [DOI] [PubMed] [Google Scholar]
- 18. Mintun MA, LaRossa GN, Sheline YI, et al. [11C]PIB in a nondemented population: Potential antecedent marker of Alzheimer disease. Neurology. 2006;67(3):446‐452. 10.1212/01.wnl.0000228230.26044.a4 [DOI] [PubMed] [Google Scholar]
- 19. Raniga P, Bourgeat P, Fripp J, et al. Automated (11)C‐PiB standardized uptake value ratio. Acad Radiol. 2008;15:1376‐1389. [DOI] [PubMed] [Google Scholar]
- 20. Wong DF, Rosenberg PB, Zhou Y, et al. In vivo imaging of amyloid deposition in Alzheimer disease using the radioligand 18F‐AV‐45 (florbetapir [corrected] F 18). J Nucl Med. 2010;51:913‐920. [DOI] [PMC free article] [PubMed] [Google Scholar]
- 21. Barthel H, Gertz H‐J, Dresel S, et al. Cerebral amyloid‐β PET with florbetaben (18F) in patients with Alzheimer's disease and healthy controls: a multicentre phase 2 diagnostic study. Lancet Neurol. 2011;10(5):424‐435. 10.1016/s1474-4422(11)70077-1 [DOI] [PubMed] [Google Scholar]
- 22. Nelissen N, Van Laere K, Thurfjell L, et al. Phase 1 study of the Pittsburgh compound B derivative 18F‐flutemetamol in healthy volunteers and patients with probable Alzheimer disease. J Nucl Med. 2009;50:1251‐1259. [DOI] [PubMed] [Google Scholar]
- 23. Cselényi Z, Jönhagen ME, Forsberg A, et al. Clinical validation of 18F‐AZD4694, an amyloid‐β‐specific PET radioligand. J Nucl Med. 2012;53:415‐424. [DOI] [PubMed] [Google Scholar]
- 24. Navitsky M, Joshi AD, Kennedy I, et al. Standardization of amyloid quantitation with florbetapir standardized uptake value ratios to the Centiloid scale. Alzheimers Dement. 2018;14(12):1565‐1571. [DOI] [PubMed] [Google Scholar]
- 25. Su Y, Flores S, Wang G, et al. Comparison of Pittsburgh compound B and florbetapir in cross‐sectional and longitudinal studies. Alzheimers Dement (Amst). 2019;11:180‐190. [DOI] [PMC free article] [PubMed] [Google Scholar]
- 26. Landau SM, Breault C, Joshi AD, et al. Amyloid‐β imaging with Pittsburgh compound B and florbetapir: comparing radiotracers and quantification methods. J Nucl Med. 2013;54:70‐77. [DOI] [PMC free article] [PubMed] [Google Scholar]
- 27. Fleisher AS, Chen K, Liu X, et al. Using positron emission tomography and florbetapir F18 to image cortical amyloid in patients with mild cognitive impairment or dementia due to Alzheimer disease. Arch Neurol. 2011;68:1404‐1411. [DOI] [PubMed] [Google Scholar]
- 28. Amadoru S, Doré V, McLean CA, et al. Comparison of amyloid PET measured in Centiloid units with neuropathological findings in Alzheimer's disease. Alzheimers Res Ther. 2020;12:22. [DOI] [PMC free article] [PubMed] [Google Scholar]
- 29. Doré V, Bullich S, Rowe CC, et al. Comparison of 18F‐florbetaben quantification results using the standard Centiloid, MR‐based, and MR‐less CapAIBL® approaches: validation against histopathology. Alzheimers Dement. 2019;15:807‐816. [DOI] [PubMed] [Google Scholar]
- 30. Klunk WE, Koeppe RA, Price JC, et al. The Centiloid Project: standardizing quantitative amyloid plaque estimation by PET. Alzheimers Dement. 2015;11:1‐15.e4. [DOI] [PMC free article] [PubMed] [Google Scholar]
- 31. Lee G, Nho K, Kang B, et al. For Alzheimer's disease neuroimaging I. Predicting Alzheimer's disease progression using multi‐modal deep learning approach. Sci Rep. 2019;9:1952. [DOI] [PMC free article] [PubMed] [Google Scholar]
- 32. Gao F. Novel Deep Learning Models for Medical Imaging Analysis. Dissertation. Arizona State University; 2019. https://hdl.handle.net/2286/R.I.55510 [Google Scholar]
- 33. Li R, Zhang W, Suk HI, et al. Deep learning based imaging data completion for improved brain disease diagnosis. Med Image Comput Comput Assist Interv. 2014;17:305‐312. [DOI] [PMC free article] [PubMed] [Google Scholar]
- 34. LeCun Y, Bengio Y, Hinton G. Deep learning. Nature. 2015;521:436‐444. [DOI] [PubMed] [Google Scholar]
- 35. Liu F, Jang H, Kijowski R, Bradshaw T, McMillan AB. Deep learning MR imaging‐based attenuation correction for PET/MR imaging. Radiology. 2018;286:676‐684. [DOI] [PMC free article] [PubMed] [Google Scholar]
- 36. Gao F, Wu T, Chu X, Yoon H, Xu Y, Patel B. Deep residual inception encoder‐decoder network for medical imaging synthesis. IEEE J Biomed Health Inform. 2020;24:39‐49. [DOI] [PubMed] [Google Scholar]
- 37. LaMontagne PJ, Benzinger TL, Morris JC, et al. OASIS‐3: longitudinal neuroimaging, clinical, and cognitive dataset for normal aging and Alzheimer disease. Preprint. Posted online December 15, 2019. medRxiv. 2019.12.13.19014902; 10.1101/2019.12.13.19014902 [DOI]
- 38. Su Y, D'Angelo GM, Vlassenko AG, et al. Quantitative analysis of PiB‐PET with FreeSurfer ROIs. PLoS One. 2013;8:e73377. [DOI] [PMC free article] [PubMed] [Google Scholar]
- 39. Su Y, Blazey TM, Snyder AZ, et al. Partial volume correction in quantitative amyloid imaging. Neuroimage. 2015;107:55‐64. [DOI] [PMC free article] [PubMed] [Google Scholar]
- 40. Su Y, Flores S, Hornbeck RC, et al. Utilizing the Centiloid scale in cross‐sectional and longitudinal PiB PET studies. Neuroimage Clin. 2018;19:406‐416. [DOI] [PMC free article] [PubMed] [Google Scholar]
- 41. Ronneberger O, Fischer P, Brox T. U‐Net: convolutional networks for biomedical image segmentation. In: Navab N., Hornegger J., Wells W., Frangi A. (eds), Medical Image Computing and Computer‐Assisted Intervention ‐ MICCAI 2015. Cham: Springer; 2015: 234‐241. 10.1007/978-3-319-24574-4_28 [DOI] [Google Scholar]
- 42. He K, Zhang X, Ren S & Sun J. Deep residual learning for image recognition in Proceedings of the 2016 IEEE Conference on Computer Vision and Pattern Recognition, 770‐778. 10.1109/CVPR.2016.90 [DOI]
- 43. Kingma DP & Ba, J . Adam: A method for stochastic optimization. Preprint. Posted online December 22, 2014. arXiv 1412.6980. https://arxiv.org/abs/1412.6980
- 44. Joshi A, Koeppe RA, Fessler JA. Reducing between scanner differences in multi‐center PET studies. Neuroimage. 2009;46:154‐159. [DOI] [PMC free article] [PubMed] [Google Scholar]
- 45. Goodfellow I, Pouget‐Abadie J, Mirza M, et al. Generative adversarial networks. Communications of the ACM, 2020;63(11):139‐144. 10.1145/3422622 [DOI] [Google Scholar]
- 46. Zhu JY, Park T, Isola P & Efros AA. Unpaired image‐to‐image translation using cycle‐consistent adversarial networks. In the Proceedings of 2017 IEEE International Conference on Computer Vision (ICCV), 2242‐2251. 10.1109/ICCV37128.2017 [DOI]
- 47. Armanious K, Jiang C, Fischer M, et al. MedGAN: medical image translation using GANs. Comput Med Imaging Graph. 2020;79:101684. [DOI] [PubMed] [Google Scholar]
Associated Data
This section collects any data citations, data availability statements, or supplementary materials included in this article.
Supplementary Materials
Supporting information