Abstract
The human microRNA 133A (MIR133A) was identified as a CRC-associated miRNA. It was down-regulated in human CRC tissues. We identified the putative MIR133A1 and A2 target genes by comparing the transcriptome analysis data of MIR133A1 and A2 knock-in cells with the candidate MIR133A target genes predicted by bioinformatics tools. We identified 29 and 33 putative MIR133A and A2 direct target genes, respectively. Among them, we focused on the master transcription regulator gene SRY-box transcription factor 9 (SOX9), which exhibits a pleiotropic role in cancer. We confirmed that SOX9 is a direct target gene of MIR133A by luciferase reporter assay, quantitative RT-PCR, and western blot analysis. Overexpression of MIR133A in CRC cell lines significantly decreased SOX9 and its downstream PIK3CA-AKT1-GSK3B-CTNNB1 and KRAS-BRAF-MAP2K1-MAPK1/3 pathways and increased apoptosis. Furthermore, functional studies reveal that cell proliferation, colony formation, and migration ability were significantly decreased by MIR133A-overexpressed CRC cell lines. Knockdown of SOX9 in CRC cell lines by SOX9 gene silencing showed similar results. We also used a xenograft model to show that MIR133A overexpression suppresses tumor growth and proliferation. Our results suggest that MIR133A regulates cell proliferation, migration, and apoptosis by targeting SOX9 in human colorectal cancer.
Keywords: MIR133A, SOX9, cell proliferation, apoptosis, colorectal cancer
Introduction
Colorectal cancer (CRC) is a common public health issue and a lethal disease, increasingly affecting the population of highly developed countries [1]. Over the last four decades, the prevalence of CRC has climbed at an alarming rate. In 2020, 1.9 million new CRC cases and 0.9 million deaths were reported, accounting for almost 10% of all new cancer cases and deaths worldwide [2,3]. Several meticulous scientific studies have revealed that genetic variation, epigenetic modification, age, diet, smoking, drinking, microbiome, sedentary lifestyle, and environmental factors cause CRC [4,5]. Multimodal treatment approaches, such as surgical resection combined with chemotherapy and radiotherapy, are routinely used as conventional therapies for people with CRC. However, due to the formation of CRC chemoresistance, toxicity, and other unfavorable side effects, the clinical outcome of advanced-stage illness remains gloomy [6]. Hence, it is necessary to develop new strategies to overcome these limits. miRNA-based gene therapy is becoming a new strategy for cancer treatment because it has been found that many miRNA target sites are localized in cancer-associated genomic regions [7,8]. It is believed that CRC is a genetically susceptible disease, and estimates are that between 25% and 50% of CRCs show some familial predisposition [9]. However, the complete set of colorectal cancer driver genes, including their contributions to hereditary disease susceptibility and underlying mechanisms of action, has yet to be fully described.
MicroRNAs are short (19-25 nucleotides), non-coding, endogenous, single-stranded RNAs that bind to the 3’-untranslated region (3’-UTR) of their target mRNA and can repress mRNA translation or induce mRNA degradation by cleavage of the target mRNA [8]. These master gene regulators (miRNAs) affect the pathogenesis of various cancer types by functioning as oncogenes or tumor suppressor genes and are significantly involved in critical events of carcinogenesis [10,11]. Endogenous miRNAs regulate more than 50% of human genes, and their abnormal expression causes various biological modifications such as apoptosis, cell differentiation, proliferation, migration, invasion, and angiogenesis [11,12]. According to miRNA genomic expression profiling studies, MIR133A is aberrantly expressed in several tissues or organs and has been confirmed as a tumor suppressor in various cancers, including CRC, by suppressing cell proliferation, metastasis, migration, and invasion [13,14]. Conversely, there are some reports that dispute MIR133A’s role in CRC initiation, tumorigenesis, and metastasis, and it was persistently up-regulated in human airway epithelial cells, contributing to epithelial-mesenchymal transition (EMT) of cancer [15]. Likewise, a study reported that MIR133A was upregulated along with MIR1 in multiple myeloma compared to normal samples using microarrays [16].
SRY-box transcription factor 9 (SOX9) is a DNA-binding high mobility group (HMG) transactivation domain that plays a crucial role in the development and progression of various diseases, including cancer [17,18]. Like other proteins, SOX9 is regulated by post-transcriptional and post-translation modifications like microRNA binding, DNA methylation, acetylation, phosphorylation, and ubiquitination at different amino acid sequences [19]. Over the last few years, increasing evidence has suggested that SOX9 regulates diverse cellular processes, including cell proliferation, metastasis, migration, apoptosis, and invasion [20,21]. Interestingly, some researchers have defined SOX9 as an oncogene [22,23], while others argue that it is a tumor suppressor gene [24]. Therefore, the detailed underlying mechanisms need to be further elucidated.
Consequently, in this study, we speculate on the specific function of MIR133A in CRC, which might be helpful to identify novel therapeutic targets and strategies to manage cancer. In this study, we found that MIR133A is significantly downregulated in CRC tissues and SOX9 is a direct target of MIR133A in human CRC cells. We demonstrated that MIR133A regulates cell proliferation, colony formation and migration ability by suppressing the SOX9 pathway.
Material and methods
Patients and human samples
The tissue samples used in this study were provided by the Biobank of Wonkwang University Hospital, a member of the National Biobank of Korea. With approval from the Institutional Review Board and informed consent from the subjects (WKIRB-202006-BR-023), we obtained CRC tissues from 10 colon cancer patients: 6 samples from tumor stage 3 (5 females, 1 male) and the remaining 4 samples from tumor stage 4 (3 females, 1 male). The mean ages of colon and rectal cancer patients were 64.2 and 72.1 years, respectively. Six separate colon cancer tissue samples and matched normal colon tissue samples (T3, females) were used to analyze endogenous MIR133A levels. In parallel, the remaining samples were used to evaluate SOX9 protein expression by western blotting. Additionally, 4 separate colon cancer tissue samples and matched normal colon tissue samples, 2 samples from T3 (1 male, 1 female) and 2 samples from T4 (1 male, 1 female), were used to assess in situ SOX9 expression by immunohistochemistry.
Cell culture
Human CRC cell lines (HCT116, SW48, Caco2 and SW480) were obtained from the Korea Cell Line Bank (KCLB, Seoul, Korea) or the American Type Culture Collection (ATCC, Rockville, MD, USA). The SW48, HCT116 and SW480 cells were cultured in RPMI 1640 (HyClone, Logan, UT, USA) supplemented with 10% fetal bovine serum (FBS) in 5% CO2 at 37°C in a humidified atmosphere. The Caco2 cells were cultured in Alpha-MEM (HyClone) supplemented with 10% FBS in 5% CO2 at 37°C in a humidified atmosphere.
Stable expression of MIR133A1 and A2 in CRC cell lines
HCT116 and SW48 cells stably expressing MIR133A1 and A2 were generated using the Mir-XTM Inducible miRNA system (Takara Bio, San Jose, CA, USA). HCT116 (5×10⁵) and SW48 (1×10⁵) cells were then transfected with the pTet-on Advanced plasmid using Lipofectamine 2000 (Invitrogen, Waltham, MA, USA) in 24-well plates. Stable Tet-on advanced cell lines were generated using G418 500 μg/mL (Takara Bio), and 100 μg/mL G418 was used for maintenance concentration. Primers (Table S1) were used to amplify MIR133A1 and A2 from human genomic DNA and the products were cloned into the pmRi-mCherry vector to form pmRi-mCheery miRNA133A1 and A2 expression vectors, which were then transfected into the Tet-on Advanced cell line along with one of the linear markers. CRC cells stably expressing pmRi-mCheery miRNA133A1 (MIR133A1 knock-in, MIR133A1 KI) and A2 (MIR133A2 knock-in; MIR133A2 KI) were selected using 1 μg/mL puromycin and further maintained in 0.5 μg/mL puromycin. Lastly, doxycycline 1 μg/mL was added to induce MIR133A1 and A2 expression. Stable expression of MIR133A1 and A2 was confirmed using TaqMan microRNA assay (Applied Biosystems, Waltham, MA, USA).
RNA extraction, miRNA and mRNA expression analysis
Total RNA was extracted from the tissue samples, cell pellets of MIR133A1 KI and MIR133A2 KI cell lines or MIR133A1-overexpressed (MIR133A1 mimic-transfected) cells using TRIzol reagent (Invitrogen), and RNA integrity was quantified by using RT-PCR (qRT-PCR) as previously described [11,12,25]. TaqMan miRNA assays were used to quantify the mature levels of MIR133A. The mRNA levels were quantified with qRT-PCR using SYBR Green master mixture (Applied Biosystems). RNU48 (for TaqMan qRT-PCR) and GAPDH were used as endogenous controls of miRNA and mRNA qRT-PCR, respectively. Each sample was run in triplicate. The primers that we used are listed in Table S1.
Transfection and oligonucleotides
The HCT116 and SW48 cells were plated on 10 cm dishes and cultured as described above. The MIR133A mimic (hsa-miR-133A, pre-miR miRNA precursor AM17100, product ID: PM12946) and negative control oligonucleotides were commercially synthesized (Ambion, Austin, TX, USA) and used at 50 nmol/mL for transfections. The transfections were performed with Lipofectamine RNAiMAX (Invitrogen) or siPORT NeoFX transfection agent (Ambion) according to the manufacturers’ recommendations. The SOX9 small interfering RNA (siSOX9) and negative control siRNA transfections were performed according to the manufacturer’s protocol (Ambion). The cells were harvested for 72 h (for protein expression) after transfection for protein analysis.
RNA sequencing (RNA-Seq) analysis in MIR133A1 KI and MIR133A2 KI cells
Total RNA was isolated from MIR133A1 or MIR133A2 knock-in cell lines using Trizol reagent (Invitrogen). RNA quality was assessed by Agilent 2100 bioanalyzer (Agilent Technologies, Amstelveen, the Netherlands), and RNA quantification was performed using the ND 2000 Spectrophotometer (Thermo Inc., Wilmington, DE, USA). Library preparation and sequencing libraries were prepared from total RNA using the NEBNext Ultra II Directional RNA Seq Kit (New England BioLabs, Inc., Hitchin, UK). The isolation of mRNA was performed using the Poly (A) RNA Selection Kit (Lexogen, Inc., Vienna, Austria). The isolated mRNAs were used for cDNA synthesis and shearing following manufacturer’s instructions. Indexing was performed using the Illumina indexes 112. The enrichment step was carried out using PCR. Subsequently, libraries were checked using the Agilent 2100 bioanalyzer (DNA High Sensitivity Kit) to evaluate the mean fragment size. Quantification was performed using the library quantification kit using a StepOne Real-Time PCR System (Life Technologies, Inc., Carlsbad, CA, USA). High throughput sequencing was performed as paired end 100 sequencing using NovaSeq 6000 (Illumina, Inc., San Diego, CA, USA). A quality control of raw sequencing data was performed using Fast QC [26]. Adapter and low-quality reads (<Q20) were removed using FASTX Trimmer (http://hannonlab.cshl.edu/fastx_toolkit/2014) and BBMap (https://sourceforge.net/projects/bbmap/(2014)). Then the trimmed reads were mapped to the reference genome using TopHat [27]. Gene expression levels were estimated using FPKM (Fragments Per kb per Million reads) values by Cufflinks [28]. The FPKM values were normalized based on the Quantile normalization method using EdgeR within R [29]. Data mining and graphic visualization were performed using ExDEGA (ebiogen, Inc., Seoul, Korea).
Plasmid construct and luciferase reporter assay
Wild-type (WT) or mutant-type (MT) fragments of SOX9 3’ UTR containing the predicted binding site of MIR133A were amplified by PCR using the primer set shown in Table S1. The PCR product was cloned into the pmirGLO Dual-Luciferase miRNA Target Expression Vector (Promega, Madison, WI, USA). The luciferase assay results were analyzed as previously described [11,12,30].
MTT cell viability and migration assay
To determine the effect of MIR133A on the cell viability of colon cancer cell lines, HCT116 (1×10⁴ cells/well) and SW48 (2×10⁴ cells/well) were transfected with MIR133A mimic (50 nM), siSOX9, or control in 96-well plates and incubated in humidified air containing 5% CO2 at 37°C for the indicated time. Likewise, stable HCT116 and SW48 cells overexpressing MIR133A1, A2, and normal control cells were seeded in 96-well plates as above, and after a 24 h incubation doxycycline (1 μg/mL) was added to all groups and incubated in an incubator. Further steps were carried out according to previous methods [31,32].
Colony-forming assay
HCT116 (500 cells/well) and SW48 (1000 cells/well) were transfected with MIR133A mimic (50 nM) or control in 12-well plates and incubated in humidified air containing 5% CO2 at 37°C for 2 or 3 weeks to allow colony formation. The media was changed every 2 or 3 days, and cells were washed with 1× PBS. Colony fixation-staining was done by adding 0.5-1 ml mixture of 0.5% crystal violet and 6% glutaraldehyde, leaving the plate for at least 30 min at room temperature (RT). After that, the glutaraldehyde crystal-violet mixture was removed and washed by dipping the plates in tap water. The plate was dried at RT and the number of colonies was counted and normalized to the control cell results.
Xenograft model
Male BALB/c nude mice (6 weeks old, 20-21 g) were purchased from Charles River Technology (Boston, MA, USA) through Orient Bio Inc. (Sungnam, Gyeonggi, South Korea). The mock, MIR133A mimic, and siSOX9 oligonucleotides were prepared and mixed with HCT116 (1×10⁷) cells and the cells were injected subcutaneously in nude mice as described previously [11,12]. Two independent experiments were performed using five mice per each group. The animal studies were approved (WKU17-53) by the Animal Care Committee of the Wonkwang University.
Immunohistochemical analysis
Human colon segments were formalin fixed and paraffin embedded and 5 μm sections were cut for immunohistochemical analysis. The expression of SOX9 was evaluated according to our previously described methods [11,33].
Western blot analysis
CRC tissues and cells were harvested and lysed in RIPA buffer with protease and phosphatase inhibitor, and protein concentration was measured by BCA protein assay kit (Thermo Scientific). About 30 to 50 μg of protein was loaded and separated through 10-12% Bis-Tris Polyacrylamide gel electrophoresis (PAGE) electrophoretic gel and blotted onto PVDF membranes (Millipore, Burlington, MA, USA). Blots were incubated with primary antibody overnight at 4°C with shaking, then washed with 0.1% T-PBS and incubated with secondary antibody at room temperature for 1 hour. Protein was detected using enhanced chemiluminescence (Millipore). The primary antibodies used were SOX9 (#82630), PIK3CA (#4292), BAX (#2772), Caspase-9 (#9502), pAKT1 (#9271), MAPK1/3 (#4696), CDH1 (#3195) cell signaling. Next, MAP2K1 (sc-219), CDH2 (sc-8424), BCL2 (sc-7382), GAPDH (sc-47724) were from Santa Cruz Biotechnology (Dallas, TX, USA), CTNNB1 (610153) was from BD Biosciences (Franklin Lakes, NJ, USA), and GSK3β (NBp1-47470) was from Novus Biologicals (Englewood, CO, USA). The protein was expression was quantified using Image J software (version 1.44; https://imagej.nih.gov/ij/index.html).
Statistical analysis
The experiments were performed three times using an independent data set with identical results. The data are presented as means ± standard deviations (S.D.). All statistical analyses were performed with Excel (Microsoft, Redmond, WA, USA) and GraphPad Prism 8 (one-way analysis of variance [ANOVA]). Two-tailed student t-test or Tukey’s test was used to compare multiple data sets. P-values <0.05 were considered statistically significant.
Results
MIR133A expression level in colon cancer tissues
We determined the endogenous MIR133A level and total RNA for miRNA analysis from 6 pairs of CRC tissues and matching adjacent healthy tissues using TaqMan qRT-PCR. The level of MIR133A expression was significantly decreased in CRC tissues (Figure 1A).
Figure 1.
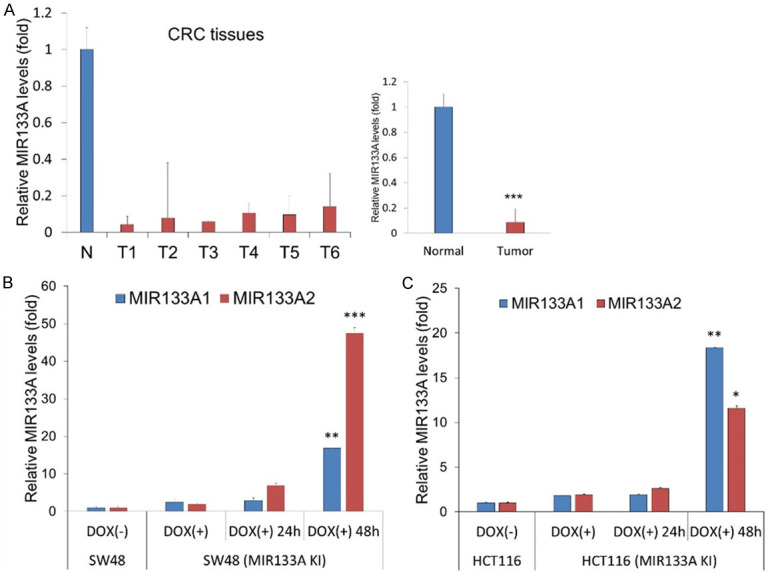
The endogenous MIR133A expression in colon cancer tissues and MIR133A-overexpressing CRC cells. A. The expression of MIR133A was validated using six colon cancer tissue samples and matching adjacent healthy colon tissue samples. The relative expression of MIR133A was normalized to colon-specific RNU48. The data are presented as the relative levels (ΔΔCT method) of MIR133A in colon cancer tissue. T1, T2, T3, T4, T5, and T6 indicate the tumor sites of patients with colon cancer. B, C. The relative endogenous MIR133A expression level in MIR133A1 and A2 overexpressed SW48 and HCT116 cell lines. Data are presented as mean ± SD. (**P<0.01, ***P<0.001).
MIR133A expression level in MIR133A1 and A2 knock-in (KI) cells
We next established the stable MIR133A1 and A2 knock-in SW48 and HCT116 cell lines. Knock-in cells were harvested and the total RNA was extracted and analyzed using TaqMan qRT-PCR. As expected, the level of MIR133A was significantly increased after 48 hours of doxycycline treatment in MIR133A1 and A2 KI SW48 and HCT116 cells (Figure 1B, 1C). Thus, the miRNA expression results show that stable MIR133A knock-in CRC cell lines were successfully created.
Identification of MIR133A target genes
Next, to identify the target genes of MIR133A, transcriptome analysis was performed using the independent eight samples (wild SW48 cells, MIR133A1 KI SW48 cells, and MIR133A2 KI SW48 cells with duplicate). We identified 713 genes whose levels were 1.25-fold downregulated with P<0.05 levels in MIR133A1 KI and MIR133A2 KI cells (Table S2). These genes were compared with the candidate MIR133A target genes predicted by the bioinformatics tools (TargetScan, miRanda, and miRWalk algorithms). Of the 713 genes, 29 and 33 putative target genes of MIR133A1 and A2, respectively, were finally identified (Tables 1, 2). Of these, we focused on the master transcription regulator gene SOX9.
Table 1.
The putative target genes of MIR133A1 identified by the transcriptome analysis from the MIR133A1 Knock-in cells and predicted by the bioinformatics tools
| Gene Symbol | transcript | Description | Fold change* | P-value | |
|---|---|---|---|---|---|
| 1 | ABHD16A | NM_001177515 | abhydrolase domain containing 16A | 0.69 | 0.0322 |
| 2 | ACAT2 | NM_005891 | acetyl-CoA acetyltransferase 2 | 0.59 | 0.008 |
| 3 | CALM1 | NM_006888 | calmodulin 1 (phosphorylase kinase, delta) | 0.79 | 0.0344 |
| 4 | CDH3 | NM_001793 | cadherin 3 | 0.77 | 0.0449 |
| 5 | EFNA3 | NM_004952 | ephrin A3 | 0.33 | 0.0007 |
| 6 | EIF4A1 | NM_001416 | eukaryotic translation initiation factor 4A1 | 0.79 | 0.0289 |
| 7 | EMP2 | NM_001424 | epithelial membrane protein 2 | 0.72 | 0.0457 |
| 8 | ENDOD1 | NM_015036 | endonuclease domain containing 1 | 0.73 | 0.0054 |
| 9 | FOXQ1 | NM_033260 | forkhead box Q1 | 0.09 | 0.001 |
| 10 | GID8 | NM_017896 | GID complex subunit 8 homolog | 0.74 | 0.0194 |
| 11 | GLS2 | NM_001280798 | glutaminase 2 | 0.66 | 0.0202 |
| 12 | HPGD | NM_000860 | hydroxyprostaglandin dehydrogenase 15-(NAD) | 0.8 | 0.0334 |
| 13 | ISOC2 | NM_024710 | isochorismatase domain containing 2 | 0.79 | 0.0391 |
| 14 | LY6E | NM_002346 | lymphocyte antigen 6 complex, locus E | 0.69 | 0.0149 |
| 15 | MRPL35 | NM_145644 | mitochondrial ribosomal protein L35 | 0.72 | 0.0109 |
| 16 | PFDN2 | NM_012394 | prefoldin subunit 2 | 0.72 | 0.0155 |
| 17 | POLR2J | NM_006234 | polymerase (RNA) II subunit J | 0.67 | 0.0361 |
| 18 | PRPS2 | NM_002765 | phosphoribosyl pyrophosphate synthetase 2 | 0.75 | 0.0001 |
| 19 | PTPRO | NM_030667 | protein tyrosine phosphatase, receptor type O | 0.42 | 0.0051 |
| 20 | REEP6 | NM_138393 | receptor accessory protein 6 | 0.74 | 0.0263 |
| 21 | SDC1 | NM_001006946 | syndecan 1 | 0.7 | 0.0438 |
| 22 | SEC61B | NM_006808 | Sec61 translocon beta subunit | 0.79 | 0.0327 |
| 23 | SNRPE | NM_003094 | small nuclear ribonucleoprotein polypeptide E | 0.72 | 0.0302 |
| 24 | SOX9 | NM_000346 | SRY-box 9 | 0.46 | 0.0035 |
| 25 | SQLE | NM_003129 | squalene epoxidase | 0.79 | 0.0094 |
| 26 | TAGLN2 | NM_003564 | transgelin 2 | 0.7 | 0.0132 |
| 27 | TCF7 | NM_003202 | transcription factor 7 | 0.58 | 0.0127 |
| 28 | TIMM17A | NM_006335 | translocase of inner mitochondrial membrane 17 homolog A (yeast) | 0.79 | 0.0242 |
| 29 | ZDHHC18 | NM_032283 | zinc finger DHHC-type containing 18 | 0.77 | 0.0215 |
1.25 fold down, P<0.05 & bioinformatics algorithms.
Table 2.
The putative target genes of MIR133A2 identified by the transcriptome analysis from the MIR133A2 Knock-in cells and predicted by the bioinformatics tools
| Gene Symbol | transcript_id | Description | Fold change* | P-value | |
|---|---|---|---|---|---|
| 1 | ABHD16A | NM_001177515 | abhydrolase domain containing 16A | 0.639 | 0.023 |
| 2 | ACAT2 | NM_005891 | acetyl-CoA acetyltransferase 2 | 0.625 | 0.008 |
| 3 | ATOX1 | NM_004045 | antioxidant 1 copper chaperone | 0.711 | 0.009 |
| 4 | CALM1 | NM_006888 | calmodulin 1 (phosphorylase kinase, delta) | 0.729 | 0.011 |
| 5 | CEBPA | NM_001287435 | CCAAT/enhancer binding protein alpha | 0.714 | 0.021 |
| 6 | CMTM6 | NM_017801 | CKLF like MARVEL transmembrane domain containing 6 | 0.782 | 0.046 |
| 7 | DOLPP1 | NM_001135917 | dolichyldiphosphatase 1 | 0.760 | 0.039 |
| 8 | DPM2 | NM_003863 | dolichyl-phosphate mannosyltransferase polypeptide 2 | 0.776 | 0.018 |
| 9 | EFNA3 | NM_004952 | ephrin A3 | 0.310 | 0.001 |
| 10 | EIF4A1 | NM_001416 | eukaryotic translation initiation factor 4A1 | 0.750 | 0.004 |
| 11 | EMP2 | NM_001424 | epithelial membrane protein 2 | 0.760 | 0.014 |
| 12 | ENDOD1 | NM_015036 | endonuclease domain containing 1 | 0.665 | 0.002 |
| 13 | FAIM | NM_001033030 | Fas apoptotic inhibitory molecule | 0.763 | 0.020 |
| 14 | FOXQ1 | NM_033260 | forkhead box Q1 | 0.090 | 0.001 |
| 15 | FTL | NM_000146 | ferritin, light polypeptide | 0.774 | 0.024 |
| 16 | GLS2 | NM_001280798 | glutaminase 2 | 0.698 | 0.016 |
| 17 | HPGD | NM_000860 | hydroxyprostaglandin dehydrogenase 15-(NAD) | 0.692 | 0.044 |
| 18 | ISOC2 | NM_024710 | isochorismatase domain containing 2 | 0.650 | 0.004 |
| 19 | LY6E | NM_002346 | lymphocyte antigen 6 complex, locus E | 0.615 | 0.014 |
| 20 | MRPL35 | NM_145644 | mitochondrial ribosomal protein L35 | 0.774 | 0.013 |
| 21 | NCEH1 | NM_020792 | neutral cholesterol ester hydrolase 1 | 0.711 | 0.016 |
| 22 | NUBP1 | NM_002484 | nucleotide binding protein 1 | 0.779 | 0.014 |
| 23 | PRPS2 | NM_002765 | phosphoribosyl pyrophosphate synthetase 2 | 0.741 | 0.003 |
| 24 | PTPRO | NM_030667 | protein tyrosine phosphatase, receptor type O | 0.396 | 0.009 |
| 25 | SDC1 | NM_001006946 | syndecan 1 | 0.650 | 0.038 |
| 26 | SERBP1 | NM_015640 | SERPINE1 mRNA binding protein 1 | 0.781 | 0.009 |
| 27 | SOX9 | NM_000346 | SRY-box 9 | 0.391 | 0.002 |
| 28 | TAGLN2 | NM_003564 | transgelin 2 | 0.626 | 0.000 |
| 29 | TCF7 | NM_003202 | transcription factor 7 | 0.621 | 0.019 |
| 30 | TIMM17A | NM_006335 | translocase of inner mitochondrial membrane 17 homolog A (yeast) | 0.721 | 0.019 |
| 31 | TPD52L1 | NM_001300994 | tumor protein D52-like 1 | 0.709 | 0.010 |
| 32 | TPM4 | NM_001145160 | tropomyosin 4 | 0.778 | 0.016 |
| 33 | ZDHHC18 | NM_032283 | zinc finger DHHC-type containing 18 | 0.778 | 0.007 |
1.25 fold down, P<0.05 & bioinformatics algorithms.
SOX9 is a direct target of MIR133A
To confirm a direct interaction between the SOX9 3’-UTR and MIR133A, we cloned wild type (WT) SOX9 3’-UTR (predicted to interact with MIR133A) into luciferase reporter vector (Figure 2A). The luciferase activity of MIR133A mimic-transfected cells was significantly decreased compared to wild type in both CRC cell lines (SW48 and Caco2) (Figure 2B, 2C). A MIR1 mimic (instead of MIR133A) was co-transfected with the WT SOX9 3’-UTR construct as a negative control. MIR1 mimic did not affect the luciferase activity of either construct (data not shown). As an additional negative control, we cloned a mutated (MT) version of SOX9 3’-UTR whose seven bases complementary to MIR133A were deleted (Figure 2A). However, the MIR133A-mediated inhibition of luciferase activity was abolished by the mutant putative binding site (Figure 2B, 2C). Furthermore, we performed qRT-PCR to measure the expression level of SOX9 mRNA in MIR133A to mimic various transfected CRC cell lines (SW48, Caco2, and SW480 cells). SOX9 mRNA level was significantly decreased compared with normal mock cells (Figure 2D). Likewise, the cellular SOX9 protein was significantly reduced in MIR133A mimic-transfected CRC cell lines (SW48, SW480, and HCT116 cells). However, the expression of SOX9 in MIR133A-overexpressed Caco2 cells was unaffected (Figure 2E).
Figure 2.
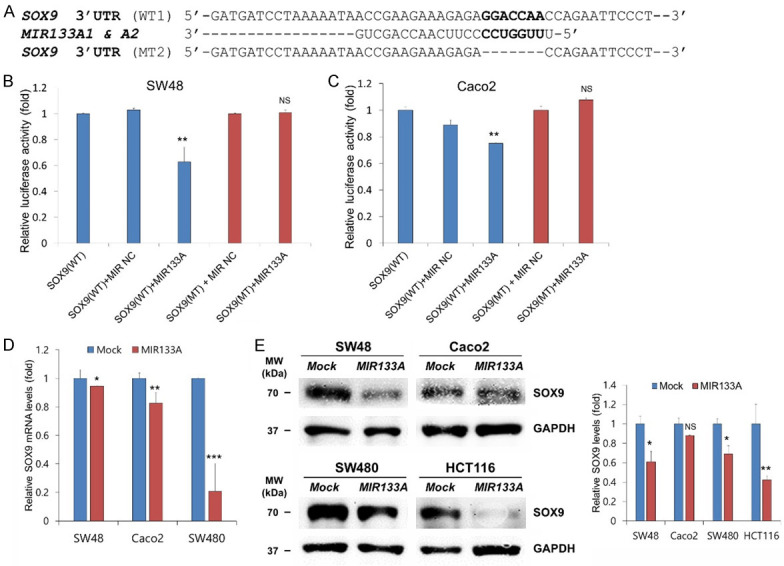
SOX9 is a direct target of MIR133A. A. Sequence alignment of wild-type (WT) and mutant (MT) MIR133A target site in the 3’-UTR of SOX9. A human SOX9 3’-UTR containing the wild-type and mutant MIR133A binding sequence was cloned downstream of the luciferase reporter gene. B, C. A luciferase reporter plasmid containing the WT or MT SOX9 3’-UTR was co-transfected into SW48 and Caco2 cells with pre-MIR1 as a negative control or pre-MIR133A. Luciferase activity was determined using the dual luciferase assay. Results are shown as relative firefly luciferase activity normalized to Renilla luciferase activity. D. qRT-PCR analysis of SOX9 expression in SW48, Caco2, and SW480 cells. E. MIR133A overexpression decreased SOX9 protein expression in HCT116, SW48, SW480, and Caco2 cell lines. The protein levels of SOX9 were determined by western blotting and densitometry by using Image J, where GAPDH was used as a loading control. Representative data from at least three independent experiments are shown. Each bar represents mean fold alternation above or below control (± SD). Differences were considered as statistically significant *P<0.05, **P<0.01 compared with control (ns = not significant).
We also performed qRT-PCR to measure the expression level of SOX9 mRNA in MIR133A1 and A2 KI SW48 cells. SOX9 mRNA level was significantly decreased compared with normal mock cells (Figure S1A). Likewise, the cellular SOX9 protein was significantly reduced in MIR133A1 and A2 KI SW48 and HCT116 cells (Figure S1B).
Collectively, these results suggest that SOX9 is a direct target of MIR133A. For further study, we selected only two cell lines (SW48 and HCT116) because we could create two stable MIR133A1 and A2 KI CRC cell lines in our laboratory. Also, they exhibited consistent mRNA and protein expression when transfected with MIR133A.
SOX9 expression in human CRC tissues
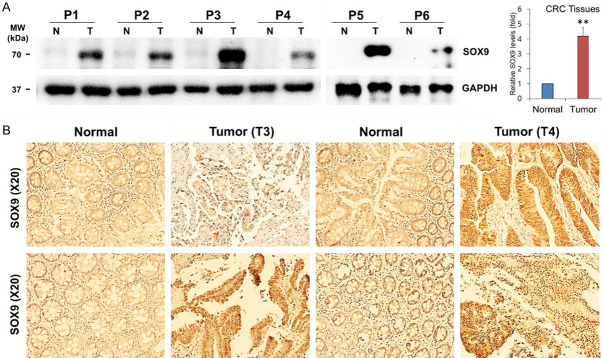
In line with the above finding, we next evaluated SOX9 expression in six human CRC tissues and the matching healthy colon tissue by western blot and an additional four human CRC tissue pairs by immunohistochemistry. As anticipated, the expression of SOX9 protein was significantly increased in all colon cancer tissues compared to the healthy colon tissues (Figure 3A, 3B).
Figure 3.
Endogenous SOX9 levels in human CRC tissues. A. The expression levels of SOX9 were validated using 6 pairs of human CRC and adjacent healthy colorectal samples by western blotting and densitometry using Image J, where GAPDH was used as a loading control. Each bar represents mean fold alternation above or below control (± SD). Differences were considered statistically significant **P<0.01 compared with control. B. Immunostaining of SOX9 in human CRC tissues and adjacent healthy colorectal samples. Experiments were independently performed three times in duplicate.
MIR133A regulates SOX9 and its downstream PIK3CA pathway molecules in CRC cell lines
More recently, it was reported that SOX9 activates the MAPK/ERK pathway (also known as the RAS-RAF-MEK-ERK pathway) via binding to the promoter region of MEK/ERK, while it also activates EMT, apoptosis, and the PIK3CA/AKT pathway and vice versa [18,34,35]. Additionally, SOX9 regulates the Wnt/CTNNB1 pathway by increasing GSK-3β phosphorylation or interacting with catenin beta 1 (CTNNB1) [18]. Therefore, we speculated on the molecular and functional cross-talks between MIR133A, SOX9, and their downstream molecules in this study. Our western blot results revealed that overexpression of MIR133A reduced the direct downstream molecules of SOX9: phosphatidylinositol-4, 5-bisphosphate 3-kinase catalytic subunit alpha (PIK3CA, also known as PI3K), mitogen-activated protein kinase 1 (MAP2K1, also known as MEK1 and MAPKK1), and cadherin 2 (CDH2; also known as N-cadherin); however, this change was not statistically significant for PIK3CA in HCT116 cells (Figure 4A). On the other hand, the expression level of BCL2 associated X, apoptosis regulator (BAX, also known as BCL2L4) was upregulated by MIR133A overexpression (Figure 4A).
Figure 4.
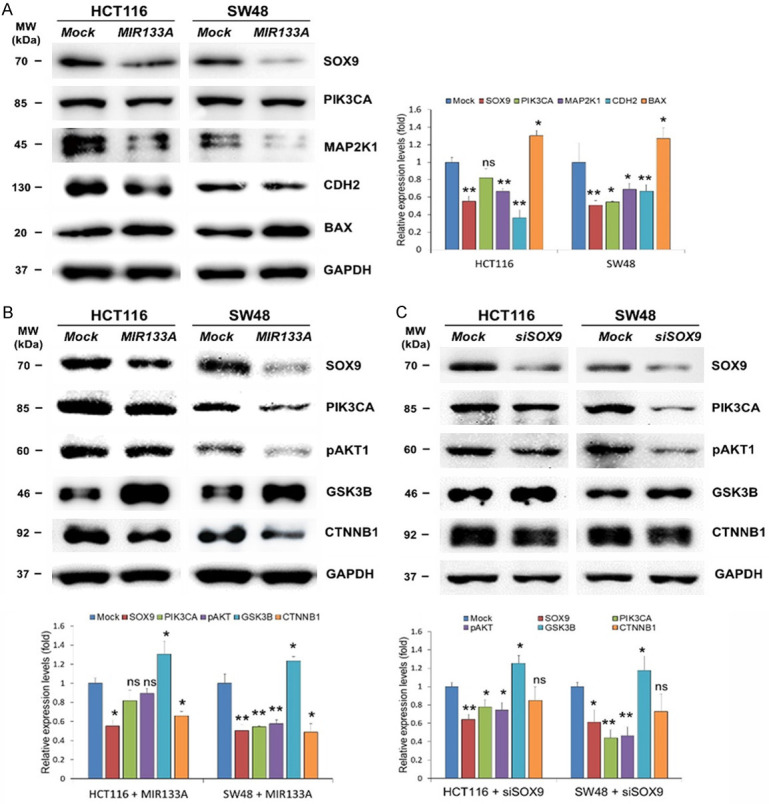
MIR133A regulates SOX9 and its downstream PIK3CA pathway molecules in CRC cell lines. A. Western blot analysis of SOX9 and downstream PIK3CA, MAP2K1, CDH2, and BAX in HCT116 and SW48 cells transfected with MIR133A mimic. B. Western blot analysis of SOX9 and its downstream PIK3CA-pAKT1-GSK3B-CTNNB1 in HCT116 and SW48 cells transfected with MIR133A mimic. C. SOX-9 and its downstream PIK3CA-pAKT1-GSK3B-CTNNB1 in HCT116 and SW48 cells transfected with siSOX9. The protein levels of respective genes were determined by western blotting and densitometry using Image J, where GAPDH was used as a loading control. The representative data from at least three independent experiments are shown. Each bar represents mean fold alternation above or below control (± SD). Differences were considered statistically significant *P<0.05, **P<0.01 compared with control (ns = not significant).
Since we found that the direct downstream molecules of SOX9 were markedly downregulated in MIR133A-overexpressed CRC cell lines, we next investigated their particular downstream pathways. We first examined PIK3CA, AKT serine/threonine kinase 1 (AKT1), glycogen synthase kinase 3 beta (GSK3B, also known as GSK-3β), and CTNNB1. Our western blot results show that MIR133A overexpression reduced PIK3CA and pAKT1 protein expression, but this change was not statistically significant in the HCT116 cell line. However, CTNNB1 was statistically reduced (Figure 4B). Meanwhile, these proteins were more significantly reduced in the SW48 cell line (Figure 4B). Furthermore, in MIR133A-overexpressed HCT116 and SW48 cell lines, the expression level of GSK3B was reversed (Figure 4B). We then transfected siSOX9 into HCT116 and SW48 cell lines to see if SOX9 regulates its downstream PIK3CA/AKT1 and GSK3B/CTNNB1 pathways in CRC cells. Western blot results revealed that SOX9 and its downstream components PIK3CA, pAKT1, and CTNNB1 were considerably downregulated by SOX9 gene silencing, however siSOX9 had the opposite effect on GSK3B (Figure 4C).
MIR133A regulates SOX9 and its downstream MAPK pathways in CRC cell lines
The KRAS (KRAS proto-oncogene, GTPase; also known as K-RAS and RASK2)-BRAF (B-Raf proto-oncogene, serine/threonine kinase, also known as B-RAF and RAFB1)-mitogen-activated protein kinase 1 (MAP2K1; also known as MEK1)-MAPK1 (mitogen-activated protein kinase 1; also known as ERK2, p38, and p40) signaling cascade is a key signaling pathway in cancer development and progression [36,37]. To explore the expression levels of KRAS downstream molecules by MIR133A, we transfected MIR133A mimic in HCT116 and SW48 cells. Western blot analysis was performed using cells isolated 72 hours after transfection. The expression levels of SOX9 and KRAS downstream molecules were significantly reduced by MIR133A overexpression (Figure 5A). Additionally, we transfected the SOX9 siRNA and the negative control into HCT116 and SW48 CRC cell lines, and our western blot results suggest that SOX9 and KRAS downstream proteins were significantly reduced in siSOX9-transfected cells (Figure 5B).
Figure 5.
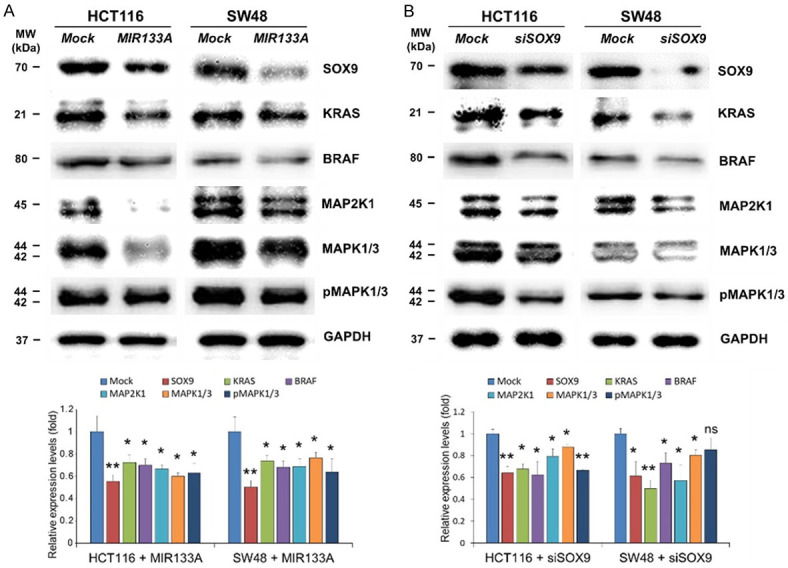
MIR133A regulates SOX9-mediated downstream MAPK pathways in CRC cell lines. A. Western blot analysis of SOX9 and its downstream KRAS-BRAF-MAP2K1-MAP2K1/3-pMAP2K1/3 in HCT116 and SW48 cells transfected with MIR133A mimic. B. SOX9 and its downstream KRAS-BRAF-MAP2K1-MAP2K1/3-pMAP2K1/3 in HCT116 and SW48 cells transfected with siSOX9. The protein levels of respective genes were determined by western blotting and densitometry using Image J, where GAPDH was used as a loading control. Representative data from at least three independent experiments are shown. Each bar represents mean fold alternation above or below control (± SD). Differences were considered statistically significant *P<0.05, **P<0.01 compared with control (ns = not significant).
MIR133A regulates SOX9 and its downstream EMT pathways in CRC cell lines
To further rule out the clinical roles of SOX9 in invasion and cancer metastasis, we monitored the expression of EMT markers cadherin 1 (CDH1; also known as E-cadherin) and CDH2. Down-regulation of epithelial marker CDH1 and up-regulation of mesenchymal marker CDH2 is the hallmark of EMT progress [38]. Likewise, our western blot results showed that the expression of CDH1 was not changed in MIR133A-overexpressed or siSOX9-transfected groups compared to their corresponding control groups (Figure 6A, 6B). In contrast, the expression level of CDH2 was significantly downregulated in CRC cells transfected with MIR133A or siSOX9 (Figure 6A, 6B). Therefore, these findings suggest that ectopic expression of MIR133A can suppress EMT via SOX9-mediated pathways and inhibit cellular metastasis.
Figure 6.
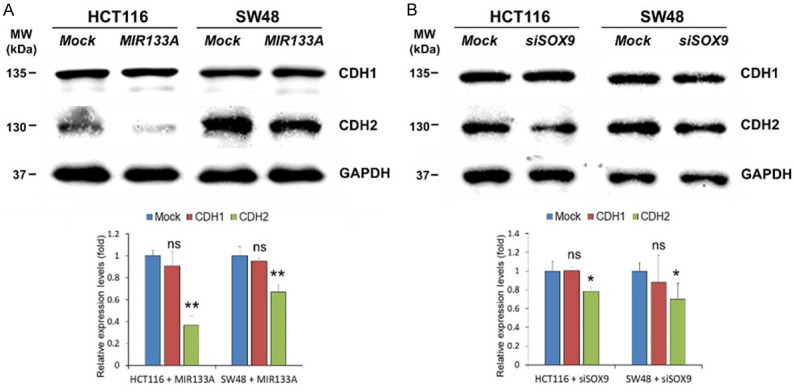
MIR133A regulates SOX9 and CDH1-CDH2 expression in CRC cell lines. A. Western blot analysis of SOX9 and CDH1-CDH2 in HCT116 and SW48 cells transfected with MIR133A mimic. B. SOX9 and its downstream CDH1-CDH2 in HCT116 and SW48 cells transfected with siSOX9. The protein levels of respective genes were determined by western blotting and densitometry using Image J, where GAPDH was used as a loading control. Representative data from at least three independent experiments are shown. Each bar represents mean fold alternation above or below control (± SD). Differences were considered statistically significant *P<0.05, **P<0.01 compared with control (ns = not significant).
Effect of MIR133A or SOX9 siRNA transfection on apoptosis in colorectal cancer cells
To elucidate the potential molecular signaling pathway underlying the effect of MIR133A on apoptosis of CRC cell lines, we examined the expression of BCL2 apoptosis regulator (BCL2), BAX, and caspase 9 (CASP9) by western blot. As shown in Figure 7A, MIR133A overexpression in both HCT116 and SW48 cell lines decreased the expression levels of BCL2 but led to a marked increase in the expression level of BAX and the cleaved form of CASP9. To further clarify the MIR133A- or SOX9-mediated apoptosis pathway in CRC cell lines, we conduct SOX9 gene silencing in HCT116 and SW48 cell lines. Immunoblotting results indicated that the SOX9 pathway regulates only BCL2 while the expression of BAX and cleaved CASP9 was not affected by siSOX9 transfection (Figure 7B).
Figure 7.
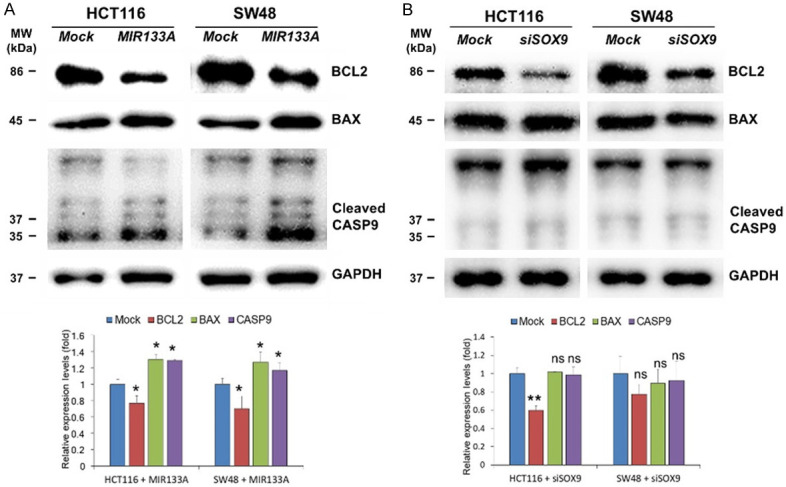
MIR133A regulates SOX9 and apoptosis pathways in CRC cell lines. A. Western blot analysis of BCL2, BAX, and cleaved CASP9 in HCT116 and SW48 cells transfected with MIR133A mimic. B. BCL2, BAX, and cleaved CASP9 in HCT116 and SW48 cells transfected with siSOX9. The protein levels of respective genes were determined by western blotting and densitometry using Image J, where GAPDH was used as a loading control. Representative data from at least three independent experiments are shown. Each bar represents mean fold alternation above or below control (± SD). Differences were considered statistically significant *P<0.05, **P<0.01 compared with control (ns = not significant).
MIR133A inhibits cell proliferation and colony formation in CRC cell lines
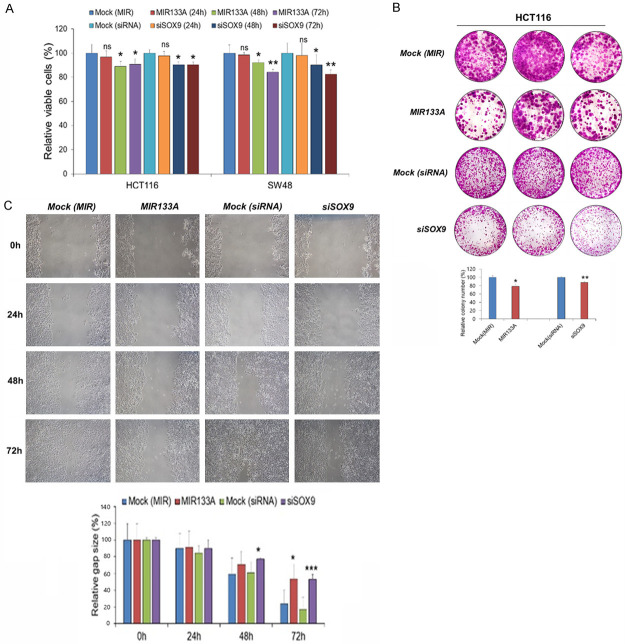
To investigate the effect of MIR133A on cell proliferation, an MTT assay was performed. Our results demonstrated that transfection of MIR133A mimic or SOX9 siRNA in HCT116 and SW48 cell lines significantly inhibits cell proliferation compared to the control group. Cell viability was not changed in 24 hours, but there was significant inhibition of cell viability after 48 hours and 72 hours in both MIR133A- and siSOX9-transfected CRC cell lines (Figure 8A). Also, there was significant inhibition (48 hours) of cell proliferation in MIR133A1 and A2 KI stable HCT116 and SW48 cells compared to the control group (Figure S2). Furthermore, the colony formation assay demonstrated that the colony number of CRC cell lines transfected with MIR133A and siSOX9 was significantly reduced compared with negatively controlled transfected groups (Figure 8B). These results suggest that MIR133A inhibits cell proliferation and colony formation ability in CRC cell lines by targeting SOX9.
Figure 8.
MIR133A inhibits cell proliferation, colony formation, and migration by targeting SOX9 in CRC cell lines. A. MTT assays of MIR133A mimic- and siSOX9-transfected in HCT116 and SW48 cell lines. B. Colony formation assay of HCT116 cells transfected with MIR133A mimic and siSOX9. C. The scratch wound assay was conducted in MIR133A mimic-transfected and siSOX9 in HCT116 cells. Migration distance was measured at 0, 24, 48, and 72 hours after the cells were scratched. Representative data from at least three independent experiments are shown. Each bar represents mean fold alternation above or below control (± SD). Differences were considered statistically significant *P<0.05, **P<0.01 compared with control (ns = not significant).
MIR133A inhibits migration ability of HCT116 by regulating SOX9
Next, to study the potential anti-tumor activity of MIR133A, HCT116 cells were transfected with MIR133A mimic and siSOX9. As shown in the scratch wound assay, the migratory cell ability was significantly inhibited in MIR133A-transfected groups compared to the control group. The migratory ability of MIR133A-transfected HCT116 cells was significantly inhibited 72 hours after the transfection (Figure 8C). Likewise, the cells transfected with SOX9 siRNA also showed similar results as the migration ability was significantly inhibited after 72 hours of siSOX9 transfection (Figure 8C). These data suggested that MIR133A inhibits migration by regulating SOX9.
MIR133A inhibits tumor growth in xenografts
As shown above, transfection with MIR133A and siSOX9 decreased cell proliferation, colony formation, and migratory ability in CRC cell lines. We next investigated the role of MIR133A in vivo. We subcutaneously implanted HCT116 (1×10⁷) cells with the overexpression of MIR133A in nude mice and monitored tumor cell xenograft formation and growth in every 5 days’ interval. Mice were sacrificed on day 20 of transfection, and tumors were harvested. Our results showed that overexpression of MIR133A significantly suppressed the growth of CRC cancer xenografts and decreased tumor volume and tumor weight in nude mice (Figure 9A). The tumors were analyzed histologically using Ki67 antibody for cellular proliferation, and we found that MIR133A-transfected tumors contained a significantly decreased number of Ki67-positive cells compared with mock control tumors for HCT116 cells (Figure 9B). MIR133A mimic-transfected tumors contained significantly decreased SOX9 expression than mock control tumors (Figure 9B). These results indicate that proliferative ability was reduced by MIR133A overexpression.
Figure 9.
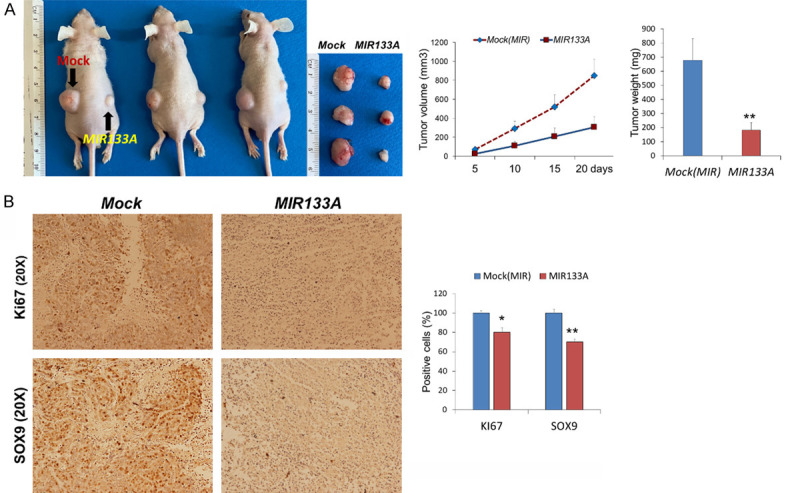
MIR133A inhibits xenograft tumor formation of colon cancer cells in mice. MIR133A inhibits colon cancer cell growth in vivo. A. Tumor volume, tumor weight and xenograft image of mock or MIR133A-transfected HCT116 cells in nude mice. B. Expression of SOX9 and proliferation marker Ki-67 in tumors after subcutaneous transplantation of mock or MIR133A in HCT116 cell lines. (n=10, Mean ± SD). Differences were considered statistically significant *P<0.05, **P<0.01 compared with control.
Discussion
Over the last two decades, several studies on miRNAs have shed light on their potential role in the development and progression of cancers. It is well accepted that miRNAs participate in various biological functions such as cell cycle, cellular proliferation, migration, invasion, apoptosis, and differentiation, and they are anticipated to be a novel diagnostic tool and stable biomarker for cancer detection [11,39]. Therefore, in this study, we verified the association between MIR133A and SOX9 in CRC cells and tissues and identified novel molecular networks regulated by MIR133A, which could add potential therapeutic avenues.
MIR133A expression has been reported to be downregulated in a variety of cancers, including colon cancer [40]. Our findings are consistent with earlier findings that MIR133A expression in human colon cancer tissue is significantly lower than in healthy colon tissue (Figure 1A). Furthermore, we established two stable MIR133A1 and A2 KI SW48 and HCT116 cell lines to study gene function and elucidate the molecular mechanism. After 48 hours of doxycycline treatment, endogenous MIR133A was significantly increased in MIR133A1 and A2 KI SW48 and HCT116 cell lines, proving that stable MIR133A KI CRC cell lines were successfully created (Figure 1B, 1C). The downregulated genes found by transcriptome analysis using MIR133A1 and A2 KI SW48 cell lines were compared with the candidate MIR133A target genes predicted by bioinformatics tools, and we identified 29 and 33 putative MIR133A and A2 direct target genes, respectively (Tables 1, 2). We confirmed that SOX9 was a direct target of MIR133A using a dual-luciferase reporter assay (Figure 2B, 2C) as well as western blot analysis (Figure 2E).
SOX9 is a critical transcription factor that regulates the progression of various diseases, including cancers. It has been reported that aberrant expression of SOX9 promotes carcinogenesis after acquiring genetic mutations, and believed that around 10% of CRC cases arise from SOX9 gene mutations [18]. Similarly, SOX9 acts as an oncogene and has been found to be up-regulated in different types of cancers [41,42]. As expected, our results also showed similar patterns. The expression of SOX9 was markedly increased in all colon cancer tissue compared to healthy matching colon tissue (Figure 3A, 3B). This provides further evidence that SOX9 expression levels are elevated in CRC and exhibit a proto-oncogenic function.
The relationship between MIR133A and SOX9 in CRC has never been explored. Therefore, in this study, we attempted to analyze the association between MIR133A, its target gene SOX9, and their downstream signaling pathways in human CRC cells and tissues (Figures 4, 5, 6 and 7). Analogous studies have reported that SOX9 has a positive role in activating the PIK3CA-AKT signaling pathway and that its inhibition reduces cell proliferation, invasion, and apoptosis [43,44]. Likewise, our study showed that SOX9 and its downstream PIK3CA-AKT expression levels were downregulated by MIR133A overexpression in CRC cells (Figure 4B). These results are consistent with siSOX9 treatment in CRC cells (Figure 4C), indicating that SOX9 levels are inversely correlated with MIR133A levels in CRC cells and tissues.
GSK3B-CTNNB1 pathways are considered a PIK3CA-AKT pathway component. The upstream protein kinase AKT, known to phosphorylate and inactivate GSK3, is frequently dysregulated in tumors [45]. It has been observed that phosphorylation of a serine (S9) of GSK3β results in GSK3β inactivation, which then phosphorylates the proto-oncogenic molecule CTNNB1, causing it to be targeted for destruction or inactivation. As a result, transcription of these genes involved in cell growth is inhibited [46]. Based on the preceding information, we further wanted to see if MIR133A affects the expression of the GSK3B-CTNNB1 pathway. Our results from MIR133A overexpression and SOX9 gene silencing revealed that MIR133A down-regulated CTNNB1 via the SOX9-mediated pathway. On the other hand, the GSK3B level increased in CRC cell lines when MIR133A was overexpressed (Figure 4B, 4C). Similar outcomes were seen when miRNA-302a was overexpressed in prostate cancer, notably the downregulation of pAKT and upregulation of GSK3β [47]. In contrast, upregulation of miRNA-29a decreases PIK3CA, p-AKT, and GSK3β in HCT116 cell lines [48]. Indeed, the molecular interactions between multiple signaling pathways and the varying roles of GSK3B in these pathways make it extremely difficult to elucidate the exact signaling pathway.
Recent works have demonstrated that MIR133A represses cell proliferation, migration, and invasion by targeting the MEK-ERK signaling pathway in bladder and colorectal cancer [49,50]. In contrast, there are limited studies about MIR133A and its regulatory effects on KRAS-KRAF upstream of MAP2K1-MAPK1/3 signaling. Hence, we investigated the regulatory relationship between MIR133A and the MAP2K1-MAPK1/3 signaling cascade in this study. Our result demonstrated that MIR133A overexpression downregulated the MAP2K1-MAPK1/3 signaling cascade in HCT116 and SW48 CRC cell lines (Figure 5A). We obtained similar results by silencing the SOX9 gene in HCT116 and SW48 CRC cell lines (Figure 5B). These results suggested that MIR133A regulated the SOX9-mediated KRAS-BRAF-MAP2K1-MAPK1/3 signaling pathway.
In vivo and in vitro data indicates that SOX9 binds to the metastasis-regulator genes or the promoter region of several EMT genes and regulates cancer cell invasion and metastasis [51,52]. Together with our results, down-regulation of CDH2 was observed by MIR133A overexpression or SOX9 gene silencing in HCT116 and SW48 cell lines (Figure 6A, 6B). It was reported that CASP3 activity, BAX, and cleaved CASP9 expression levels were significantly higher in miR-133a mimic-overexpressed breast cancer cells, although BCL2 expression was reversed [53]. In MIR133A-overexpressed CRC cell lines, we found that BAX and cleaved CASP9 expression were significantly increased, while BCL2 expression was decreased (Figure 7A). However, siSOX9 had no effect on BAX or CASP9 (Figure 7B). These results indicate that SOX9 may not regulate BAX and CASP9, and there might be other molecules regulated by MIR133A. As a result, more research is needed to fully understand the relationship between SOX9, BAX, and CASP9 in colorectal cancer.
After identifying SOX9 as a direct target of MIR133A and demonstrating its underlying molecular mechanism, we performed in vitro and in vivo functional studies. As anticipated, overexpression of MIR133A and SOX9 gene silencing in CRC cell lines inhibited cell proliferation, as revealed by MTT cell viability (Figure 8A), colony formation (Figure 8B), and Ki67 immunohistochemistry assay (Figure 9B). Next, in vitro evidence suggested that MIR133A may inhibit CRC cell motility and migration by targeting SOX9 (Figure 8C). To confirm the above finding, we carry out an in vivo xenograft experiment in nude mice. We found that colon cancer cells overexpressing MIR133A suppress tumor growth compared to control cells (Figure 9A). The tumor volume and weight were significantly decreased by MIR133A overexpression (Figure 9A). It is worthy to point out that MIR133A is a direct target of SOX9 and functions as a tumor repressor in colorectal cancer.
Conclusions
Conclusively, we demonstrated that MIR133A is downregulated in human CRC tissue. We identified SOX9 as a putative target gene of MIR133A and showed that SOX9 is a direct target of MIR133A in human CRC cells. Our results indicate that MIR133A regulates two SOX9-mediated signaling pathways (PIK3CA-AKT1-GSK3B-CTNNB1 and KRAS-BRAF-MAP2K1-MAPK1/3) and SOX9-mediated BCL2 and CDH2 expression, and as a result, MIR133A regulates cell proliferation, cell migration, and colony formation via targeting SOX9 in CRC cells. Although we did not investigate the mechanism of MIR133A downregulation in CRC cells, our results overall suggest that the diminished MIR133A levels during CRC progression upregulate SOX9 expression. The upregulated intracellular SOX9 levels might, in turn, affect downstream signal pathways. Consequently, they might upregulate cell proliferation, cell migration, and colony formation in CRC (Figure 10). Therefore, MIR133A might be a promising therapeutic target for cancer diagnosis, prognosis, and treatment.
Figure 10.
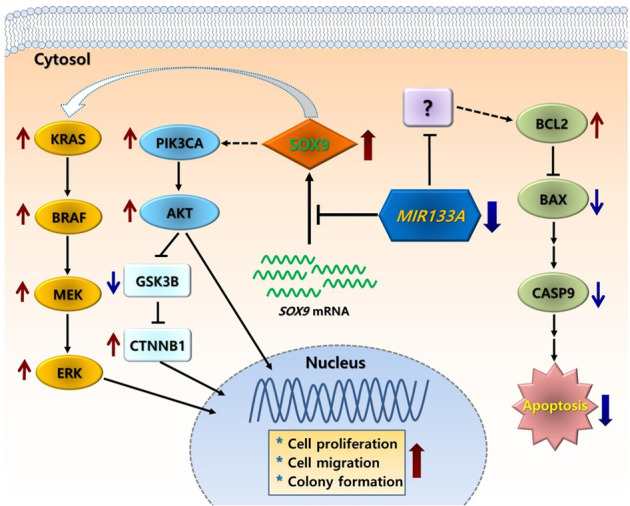
A simple putative mechanism of MIR133A regulation of SOX9-mediated cell proliferation, cell migration, and colony formation in human CRC. Decreased MIR133A expression in CRC cells or tissues leads to upregulation of cellular SOX9 levels. The increased SOX9 level causes activation of downstream pathways, such as PIK3CA-pAKT-GSK3B-CTNNB1, KRAS-BRAF-MAP2K1 (MEK)-MAP2K1/3 (ERK), and apoptosis pathways, resulting in increased colony formation, cell proliferation, and cell migration.
Acknowledgements
The biospecimens for this study were provided by the Biobank of Wonkwang University Hospital, a member of the National Biobank of Korea, which is supported by the Ministry of Health and Welfare. This work was supported by the National Research Foundation of Korea (NRF) grant funded by the Korea government (MSIT); 2017R1A2B4004801 and 2020R1A2C2003882.
Disclosure of conflict of interest
None.
Table S1 and Figures S1, S2
Table S2
References
- 1.Hofseth LJ, Hebert JR, Chanda A, Chen H, Love BL, Pena MM, Murphy EA, Sajish M, Sheth A, Buckhaults PJ, Berger FG. Early-onset colorectal cancer: initial clues and current views. Nat Rev Gastroenterol Hepatol. 2020;17:352–364. doi: 10.1038/s41575-019-0253-4. [DOI] [PMC free article] [PubMed] [Google Scholar]
- 2.Bray F, Ferlay J, Soerjomataram I, Siegel RL, Torre LA, Jemal A. Global cancer statistics 2018: GLOBOCAN estimates of incidence and mortality worldwide for 36 cancers in 185 countries. CA Cancer J Clin. 2018;68:394–424. doi: 10.3322/caac.21492. [DOI] [PubMed] [Google Scholar]
- 3.Xi Y, Xu PF. Global colorectal cancer burden in 2020 and projections to 2040. Transl Oncol. 2021;14:101174. doi: 10.1016/j.tranon.2021.101174. [DOI] [PMC free article] [PubMed] [Google Scholar]
- 4.Jung G, Hernandez-illan E, Moreire L, Balaguer F, Goel A. Epigenetics of colorectal cancer: biomarker and therapeutic potential. Nat Rev Gastroenterol Hepatol. 2020;17:111–130. doi: 10.1038/s41575-019-0230-y. [DOI] [PMC free article] [PubMed] [Google Scholar]
- 5.Sandler RS. Epidemiology and risk factors for colorectal cancer. Gastroenterol Clin North Am. 1996;25:717–735. doi: 10.1016/s0889-8553(05)70271-5. [DOI] [PubMed] [Google Scholar]
- 6.Skarkova V, Kralova V, Vitovcova B, Rudolf E. Selected aspects of chemoresistance mechanisms in colorectal carcinoma-a focus on epithelial-to-mesenchymal transition, autophagy, and apoptosis. Cells. 2019;8:234. doi: 10.3390/cells8030234. [DOI] [PMC free article] [PubMed] [Google Scholar]
- 7.Ji WD, Sun B, Su CQ. Targeting microRNAs in cancer gene therapy. Genes (Basel) 2017;8:21. doi: 10.3390/genes8010021. [DOI] [PMC free article] [PubMed] [Google Scholar]
- 8.Abd-Aziz N, Kamaruzman NI, Poh CL. Development of microRNAs as potential therapeutics against cancer. J Oncol. 2020;2020:8029721. doi: 10.1155/2020/8029721. [DOI] [PMC free article] [PubMed] [Google Scholar]
- 9.Burt R. Inheritance of colorectal cancer. Drug Discov Today Dis Mech. 2007;4:293–300. doi: 10.1016/j.ddmec.2008.05.004. [DOI] [PMC free article] [PubMed] [Google Scholar]
- 10.Lu J, Getz G, Miska EA, Alvarez-Saavedra E, Lamb J, Peck D, Sweet-Cordero A, Ebert BL, Mak RH, Ferrando AA, Downing JR, Jacks T, Horvitz HR, Golub TR. MicroRNA expression profiles classify human cancers. Nature. 2005;435:834–838. doi: 10.1038/nature03702. [DOI] [PubMed] [Google Scholar]
- 11.Alam KJ, Mo JS, Han SH, Park WC, Kim HS, Yun KJ, Chae SC. MicroRNA 375 regulates proliferation and migration of colon cancer cells by suppressing the CTGF-EGFR signaling pathway. Int J Cancer. 2017;141:1614–1629. doi: 10.1002/ijc.30861. [DOI] [PubMed] [Google Scholar]
- 12.Mo JS, Park WC, Choi SC, Yun KJ, Chae SC. MicroRNA 452 regulates cell proliferation, cell migration, and angiogenesis in colorectal cancer by suppressing VEGFA expression. Cancers. 2019;11:1613. doi: 10.3390/cancers11101613. [DOI] [PMC free article] [PubMed] [Google Scholar]
- 13.Dong YJ, Zhao JH, Wu CW, Zhang LJ, Liu XD, Kang W, Leung WW, Zhang N, Chan FK, Sung JJ, Ng SS, YU J. Tumor suppressor functions of miR-133a in colorectal cancer. Mol Cancer Res. 2013;11:1051–1060. doi: 10.1158/1541-7786.MCR-13-0061. [DOI] [PubMed] [Google Scholar]
- 14.Gong Y, Ren J, Liu K, Tang LM. Tumor suppressor role of miR-133a in gastric cancer by repressing IGF1R. World J Gastroenterol. 2015;21:2949–2958. doi: 10.3748/wjg.v21.i10.2949. [DOI] [PMC free article] [PubMed] [Google Scholar]
- 15.Chen LJ, He XB, Xie YP, Huang Y, Wolff DW, Abel PW, Tu YP. Up-regulated miR-133a orchestrates epithelial-mesenchymal transition of airway epithelial cells. Sci Rep. 2018;8:15543. doi: 10.1038/s41598-018-33913-x. [DOI] [PMC free article] [PubMed] [Google Scholar]
- 16.Gutiérrez NC, Sarasquete ME, Misiewicz-Krzeminska I, Delgado M, De Las Rivas J, Ticona FV, Ferminan E, Martin-Jimenez P, Chillon C, Risueno A, Hernandez JM, Garcia-Sanz R, Gonzalez M, San Miguel JF. Deregulation of microRNA expression in the different genetic subtypes of multiple myeloma and correlation with gene expression profiling. Leukemia. 2010;24:629–637. doi: 10.1038/leu.2009.274. [DOI] [PubMed] [Google Scholar]
- 17.Jana S, Madhu Krishna B, Singhal J, Horne D, Awasthi S, Salgia R, Singhal SS. SOX9: the master regulator of cell fate in breast cancer. Biochem Pharmacol. 2020;174:113789. doi: 10.1016/j.bcp.2019.113789. [DOI] [PMC free article] [PubMed] [Google Scholar]
- 18.Panda M, Tripathi SK, Biswal BK. SOX9: an emerging driving factor from cancer progression to drug resistance. Biochim Biophys Acta Rev Cancer. 2021;1875:188517. doi: 10.1016/j.bbcan.2021.188517. [DOI] [PubMed] [Google Scholar]
- 19.Jo A, Denduluri S, Zhang BS, Wang ZL, Yin LJ, Yan ZJ, Kang R, Shi LL, Mok J, Lee MJ, Haydon RC. The versatile functions of Sox9 in development, stem cells, and human diseases. Genes Dis. 2014;1:149–161. doi: 10.1016/j.gendis.2014.09.004. [DOI] [PMC free article] [PubMed] [Google Scholar]
- 20.Wang HY, Leav I, Ibaragi S, Wegner M, Hu GF, Lu ML, Balk SP, Yuan X. SOX9 is expressed in human fetal prostate epithelium and enhances prostate cancer invasion. Cancer Res. 2008;68:1625–1630. doi: 10.1158/0008-5472.CAN-07-5915. [DOI] [PubMed] [Google Scholar]
- 21.Lin RX, Zhan GF, Wu JC, Fang H, Yang SL. LncRNA snhg14 sponges mir-206 to affect proliferation, apoptosis, and metastasis of hepatocellular carcinoma cells by regulating sox9. Dig Dis Sci. 2022;67:936–946. doi: 10.1007/s10620-021-06920-8. [DOI] [PubMed] [Google Scholar]
- 22.Huang J, Guo L. Knockdown of SOX9 inhibits the proliferation, invasion, and EMT in thyroid cancer cells. Oncol Res. 2017;25:167–176. doi: 10.3727/096504016X14732772150307. [DOI] [PMC free article] [PubMed] [Google Scholar]
- 23.Santos JC, Carrasco-Garcia E, Garcia-Pug M, Aldaz P, Monte M, Fernandez-Reyes M, de Oliveira CC, Lawrie CH, Araúzo-Bravo MJ, Ribeiro ML, Matheu A. SOX9 elevation acts with canonical WNT signaling to drive gastric cancer progression. Cancer Res. 2016;76:6735–6746. doi: 10.1158/0008-5472.CAN-16-1120. [DOI] [PubMed] [Google Scholar]
- 24.Wang HY, Lian P, Zheng PS. SOX9, a potential tumor suppressor in cervical cancer, transactivates p21WAF1/CIP1 and suppresses cervical tumor growth. Oncotarget. 2015;6:20711–20722. doi: 10.18632/oncotarget.4133. [DOI] [PMC free article] [PubMed] [Google Scholar]
- 25.Mo JS, Alam KJ, Kim HS, Lee YM, Yun KJ, Chae SC. MicroRNA 429 regulates mucin gene expression and secretion in murine model of colitis. J Crohns Colitis. 2016;10:837–849. doi: 10.1093/ecco-jcc/jjw033. [DOI] [PubMed] [Google Scholar]
- 26.De Sena Brandine G, Smith AD. Falco: high-speed FastQC emulation for quality control of sequencing data. F1000Res. 2019;8:1874. doi: 10.12688/f1000research.21142.1. [DOI] [PMC free article] [PubMed] [Google Scholar]
- 27.Trapnell C, Pachter L, Salzberg SL. TopHat: discovering splice junctions with RNA-Seq. Bioinformatics. 2009;25:1105–1111. doi: 10.1093/bioinformatics/btp120. [DOI] [PMC free article] [PubMed] [Google Scholar]
- 28.Roberts A, Trapnell C, Donaghey J, Rinn JL, Pachter L. Improving RNA-Seq expression estimates by correcting for fragment bias. Genome Biol. 2011;12:R22. doi: 10.1186/gb-2011-12-3-r22. [DOI] [PMC free article] [PubMed] [Google Scholar]
- 29.R Development Core Team. R Foundation for Statistical Computing. Vienna: 2016. R: A Language and Environment for Statistical Computing. [Google Scholar]
- 30.Han SH, Mo JS, Park WC, Chae SC. Reduced microRNA 375 in colorectal cancer upregulates metadherin-mediated signaling. World J Gastroenterol. 2019;25:6495–6507. doi: 10.3748/wjg.v25.i44.6495. [DOI] [PMC free article] [PubMed] [Google Scholar]
- 31.Lamichhane S, Bastola T, Pariyar R, Lee ES, Lee HS, Lee DH, Seo J. ROS production and ERK activity are involved in the effects of d-β-hydroxybutyrate and metformin in a glucose deficient condition. Int J Mol Sci. 2017;18:674. doi: 10.3390/ijms18030674. [DOI] [PMC free article] [PubMed] [Google Scholar]
- 32.Mo JS, Alam KJ, Kang IH, Park WC, Seo GS, Choi SC, Kim HS, Moon HB, Yun KJ, Chae SC. MicroRNA 196B regulates FAS-mediated apoptosis in colorectal cancer cells. Oncotarget. 2015;6:2843–2855. doi: 10.18632/oncotarget.3066. [DOI] [PMC free article] [PubMed] [Google Scholar]
- 33.Mo JS, Han SH, Yun KJ, Chae SC. MicroRNA 429 regulates the expression of CHMP5 in the inflammatory colitis and colorectal cancer cells. Inflamm Res. 2018;67:985–996. doi: 10.1007/s00011-018-1194-z. [DOI] [PubMed] [Google Scholar]
- 34.Huang JQ, Wei FK, Xu XL, Ye SX, Song JW, Ding PK, Zhu J, Li HF, Luo XP, Gong H, Su L, Yang L, Gong LY. SOX9 drives the epithelial-mesenchymal transition in non-small-cell lung cancer through the Wnt/β-catenin pathway. J Transl Med. 2019;17:143. doi: 10.1186/s12967-019-1895-2. [DOI] [PMC free article] [PubMed] [Google Scholar]
- 35.Stockl S, Bauer BJ, Bosserhoff AK, Gottl C, Grifka J, Grassel S. Sox9 modulates cell survival and adipogenic differentiation of multipotent adult rat mesenchymal stem cells. J Cell Sci. 2013;126:2890–2902. doi: 10.1242/jcs.124305. [DOI] [PubMed] [Google Scholar]
- 36.Degirmenci U, Wang M, Hu JC. Targeting aberrant RAS/RAF/MEK/ERK signaling for cancer therapy. Cells. 2020;9:198. doi: 10.3390/cells9010198. [DOI] [PMC free article] [PubMed] [Google Scholar]
- 37.Guo YJ, Pan WW, Liu SB, Shen ZF, Xu Y, Hu LL. ERK/MAPK signalling pathway and tumorigenesis. Exp Ther Med. 2020;19:1997–2007. doi: 10.3892/etm.2020.8454. [DOI] [PMC free article] [PubMed] [Google Scholar]
- 38.Huang LX, Hu CY, Jing L, Wang MC, Xu M, Wang J, Wang Y, Nan KJ, Wang SH. Micro RNA-219-5p inhibits epithelial-mesenchymal transition and metastasis of colorectal cancer by targeting lymphoid enhancer-binding factor 1. Cancer Sci. 2017;108:1985–1995. doi: 10.1111/cas.13338. [DOI] [PMC free article] [PubMed] [Google Scholar]
- 39.Kong B, Zhao SP, Kang XW, Wang B. MicroRNA-133a-3p inhibits cell proliferation, migration and invasion in colorectal cancer by targeting AQP1. Oncol Lett. 2021;22:649. doi: 10.3892/ol.2021.12910. [DOI] [PMC free article] [PubMed] [Google Scholar] [Retracted]
- 40.Li W, Chen A, Xiong L, Chen T, Tao F, Lu Y, He Q, Zhao L, Ou R, Xu Y. miR-133a acts as a tumor suppressor in colorectal cancer by targeting eIF4A1. Tumour Biol. 2017;39:1010428317698389. doi: 10.1177/1010428317698389. [DOI] [PubMed] [Google Scholar]
- 41.Zhong WD, Qin GQ, Dai QS, Han ZD, Chen SM, Ling XH, Fu X, Cai C, Chen JH, Chen XB, Lin ZY, Deng YH, Wu SL, He HC, Wu CL. SOXs in human prostate cancer: implication as progression and prognosis factors. BMC Cancer. 2012;12:248. doi: 10.1186/1471-2407-12-248. [DOI] [PMC free article] [PubMed] [Google Scholar]
- 42.Lu BJ, Fang YH, Xu J, Wang LP, Xu FY, Xu EP, Huang Q, Lai MD. Analysis of SOX9 expression in colorectal cancer. Am J Clin Pathol. 2008;130:897–904. doi: 10.1309/AJCPW1W8GJBQGCNI. [DOI] [PubMed] [Google Scholar]
- 43.Swartling FJ, Ferletta M, Kastemar M, Weiss WA, Westermark B. Cyclic GMP-dependent protein kinase II inhibits cell proliferation, Sox9 expression and Akt phosphorylation in human glioma cell lines. Oncogene. 2009;28:3121–3131. doi: 10.1038/onc.2009.168. [DOI] [PMC free article] [PubMed] [Google Scholar]
- 44.Liu HW, Liu ZX, Jiang B, Peng RJ, Ma ZM, Lu JC. SOX9 overexpression promotes glioma metastasis via Wnt/β-catenin signaling. Cell Biochem Biophys. 2015;73:205–212. doi: 10.1007/s12013-015-0647-z. [DOI] [PubMed] [Google Scholar]
- 45.Robinson JP, Vanbrocklin MW, McKinney AJ, Gach HM, Holmen SL. Akt signaling is required for glioblastoma maintenance in vivo. Am J Cancer Res. 2011;1:155–167. [PMC free article] [PubMed] [Google Scholar]
- 46.Mills CN, Nowsheen S, Bonner JA, Yang ES. Emerging roles of glycogen synthase kinase 3 in the treatment of brain tumors. Front Mol Neurosci. 2011;4:47. doi: 10.3389/fnmol.2011.00047. [DOI] [PMC free article] [PubMed] [Google Scholar]
- 47.Zhang GM, Bao CY, Wan FN, Cao DL, Qin XJ, Zhang HL, Zhu Y, Dai B, Shi GH, Ye DW. MicroRNA-302a suppresses tumor cell proliferation by inhibiting AKT in prostate cancer. PLoS One. 2015;10:e0124410. doi: 10.1371/journal.pone.0124410. [DOI] [PMC free article] [PubMed] [Google Scholar]
- 48.Han XF, Zhang JW, Wang YL, Gao ZG. miRNA-29a inhibits colon cancer growth by regulation of the PTEN/Akt/GSK3β and Wnt/β-catenin signaling pathways. Oncol Lett. 2018;16:2638–2644. doi: 10.3892/ol.2018.8905. [DOI] [PMC free article] [PubMed] [Google Scholar]
- 49.Cui WJ, Zhang S, Shan CL, Zhou L, Zhou ZM. micro RNA-133a regulates the cell cycle and proliferation of breast cancer cells by targeting epidermal growth factor receptor through the EGFR/A kt signaling pathway. FEBS J. 2013;280:3962–3974. doi: 10.1111/febs.12398. [DOI] [PubMed] [Google Scholar]
- 50.Wang H, An HY, Wang B, Liao Q, Li WD, Jin XJ, Cui SZ, Zhang YJ, Ding YQ, Zhao L. miR-133a represses tumour growth and metastasis in colorectal cancer by targeting LIM and SH3 protein 1 and inhibiting the MAPK pathway. Eur J Cancer. 2013;49:3924–3935. doi: 10.1016/j.ejca.2013.07.149. [DOI] [PubMed] [Google Scholar]
- 51.Ma YX, Shepherd J, Zhao DK, Bollu LR, Tahaney WM, Hill J, Zhang Y, Mazumdar A, Brown PH. SOX9 is essential for triple-negative breast cancer cell survival and metastasis. Mol Cancer Res. 2020;18:1825–1838. doi: 10.1158/1541-7786.MCR-19-0311. [DOI] [PMC free article] [PubMed] [Google Scholar]
- 52.Aguilar-Medina M, Avendaño-Félix M, Lizárraga-Verdugo E, Bermúdez M, Romero-Quintana JG, Ramos-Payan R, Ruíz-García E, López-Camarillo C. SOX9 stem-cell factor: clinical and functional relevance in cancer. J Oncol. 2019;2019:6754040. doi: 10.1155/2019/6754040. [DOI] [PMC free article] [PubMed] [Google Scholar]
- 53.Li ZF, Xu WW, Ren XY, Xu JH, Chen JX. Puerarin promotes DUSP1 expression by regulating miR-133a-3p in breast cancer. Mol Med Rep. 2019;19:205–212. doi: 10.3892/mmr.2018.9682. [DOI] [PMC free article] [PubMed] [Google Scholar]
Associated Data
This section collects any data citations, data availability statements, or supplementary materials included in this article.


