Abstract
The novel coronavirus disease 2019 (COVID-19) caused by severe acute respiratory syndrome coronavirus 2 (SARS-CoV-2) has infected more than 505 million confirmed cases, including over 6 million deaths. Reference materials (RMs) of SARS-CoV-2 RNA played a crucial role in performance evaluation and quality control of testing laboratories. As the potential primary characterization method of RMs, reverse transcription digital PCR (RT-dPCR) measures the copy number of RNA, but the accuracy of reverse transcription (RT) efficiency has yet to be confirmed. This study established a method of enzymatic digestion followed by isotope dilution mass spectrometry (IDMS), which does not require an RT reaction, to quantify in vitro–transcribed SARS-CoV-2 RNA. RNA was digested to nucleotide monophosphate (NMP) within 15 min and analyzed by IDMS within 5 min. The consistency among the results of four different NMPs demonstrated the reliability of the proposed method. Compared to IDMS, the quantitative result of RT-dPCR turned out to be about 10% lower, possibly attributed to the incompleteness of the reverse transcription process. Therefore, the proposed approach could be valuable and reliable for quantifying RNA molecules and evaluating the RT efficiency of RT-based methods.
Graphical abstract
Supplementary Information
The online version contains supplementary material available at 10.1007/s00216-022-04238-6.
Keywords: SARS-CoV-2, IDMS, Reverse transcription, Digital PCR
Introduction
Since late 2019, an epidemic disease (named novel coronavirus disease 2019, COVID-19) caused by severe acute respiratory syndrome coronavirus 2 (SARS-CoV-2) has attacked the world and lasted for more than 2 years up to now [1–3]. Globally, there have been more than 505 million confirmed cases of COVID-19, including more than 6 million deaths, reported by WHO [4].
Among hundreds of COVID-19 diagnostic tests of different classes, nucleic acid testing (NAT) such as reverse transcription quantitative real-time PCR (RT-qPCR) remains the gold standard for COVID-19 diagnosis [5]. In order to ensure the quality and reproducibility of testing laboratories and evaluate the performance of molecular diagnostic products, reference materials of SARS-CoV-2 RNA were developed by WHO as well as different institutions around the world [6–9]. The most widely used method to characterize RNA RMs were reverse transcription digital PCR (RT-dPCR). RT-dPCR can provide the copy number of the target template instead of Ct values generated by RT-qPCR, without the need of an external standard curve [10, 11].
Nevertheless, compared with DNA quantification by dPCR, big variations always occurred for RNA quantification [12–14]. The involvement of the reverse transcription (RT) process is the major difference between DNA and RNA quantification. As the essential step prior to PCR, RT of RNA to cDNA may induce biases to the results when different reverse transcriptases and priming strategies (oligo (dT), random hexamer, or gene-specific primer) are chosen [15–19]. Thus, a method independent of the RT process is necessary to evaluate the accuracy of RT-dPCR and other RT-based methods.
Isotope dilution mass spectrometry (IDMS) has been reported to be an accurate and reliable method in the field of chemical analysis [20, 21]. When combined with enzymatic digestion, IDMS could also be used in quantification of nucleic acid molecules, including oligonucleotide [22, 23] and lambda genomic DNA [24]. The purpose of this study is to establish a method of enzymatic digestion followed by IDMS for quantification of SARS-CoV-2 RNA and evaluate the RT efficiency of the RT-dPCR method.
Materials and methods
In vitro transcription of SARS-CoV-2 RNA
An in vitro–transcribed RNA containing E, ORF1ab, and N genes of SARS-CoV-2 was prepared as the study material in this study.
E gene, partial ORF1ab gene (NC_045512.2, position 13,201–15,600), and N gene of SARS-CoV-2 were synthesized by BGI (Beijing, China). The three genes were cloned together into the same pBluescript II SK( +) vector to generate an in vitro–transcribed RNA molecule.
The SARS-CoV-2-E-N-ORF1ab plasmid was linearized with Not I at the 3′-end and purified with the Universal DNA Purification Kit (Tiangen, China) as the template DNA. To generate positive sense strand RNA, in vitro transcription (IVT) was performed using the MEGAscript T7 kit (Thermo Fisher, USA). The reaction contained 7.5 mM of each of ATP, CTP, GTP, and UTP, 1 × reaction buffer, 2 µL T7 enzyme mix, and 8 µL of template DNA. After incubation at 37 °C for 4 h, TURBO DNase treatment was performed to remove the remaining template DNA. The resulting RNA was purified using the MEGAclear Kit (Thermo Fisher, USA). Successful in vitro transcription was confirmed by analyzing RNA molecule with the RNA 6000 nano kit on the 2100 Bioanalyzer (Agilent, USA). The concentration of RNA was estimated using Nanodrop. A diluted RNA sample was prepared at approximately 1 ng/μL in RNA Storage Solution (Thermo Fisher, USA), aliquoted to 100 μL/tube, and stored at – 70 °C.
Standards and reagents
Four certified reference materials (CRMs) of pure nucleotide monophosphate (NMP) were obtained from the National Institute of Metrology, China (NIMC). The nominal purity of adenosine 5′-monophosphate (AMP, GBW(E)100,054), guanosine 5′-monophosphate disodium salt (GMP, GBW(E)100,068), cytidine 5′-monophosphate (CMP, GBW(E)100,067), and uridine 5′-monophosphate disodium salt (UMP, GBW(E)100,069) was 98.9%, 98.8%, 99.3%, and 99.4%, respectively. Uncertainties (k = 2) of 0.7%, 0.6%, 0.6%, and 0.4% were assigned to the corresponding values for AMP, GMP, CMP, and UMP. The standards were dried at 80 ℃ for 4 h and gravimetrically dissolved in water to form a stock solution with concentration of about 1 mg/g. Stable isotope–labeled (13C, 15 N) NMPs (LNMPs) were purchased from Silantes (Germany) and used as the internal standards. The LNMPs were in solution with a stated concentration of 0.1 mol/L. The chemical purity of the LNMPs was greater than 95%, and the isotopic enrichment was greater than 98 atom% as stated by the manufacturer. Snake venom phosphodiesterase I (SVP) from Crotalus adamanteus was purchased from Sigma-Aldrich.
Preparation of sample and calibration blends
The LNMP mix solution of the four internal standards was prepared by diluting with SVP buffer (100 mM Tris–HCl pH 8.8, 10 mM ammonium acetate, and 100 mM magnesium acetate). The concentration of the four LNMPs in the mix solution was determined by the estimated concentration of the natural NMPs in the in vitro RNA sample, ensuring the molar ratio of NMP and LNMP in the sample was approximately 1:1. Two calibration blends were prepared containing the same concentration of LNMP with the RNA sample. The mass ratio of NMP/LNMP in the high and low calibration blend was approximately 1.1 and 0.9, respectively.
Digestion of RNA samples
The digestion mixture was gravimetrically prepared by adding 50 μL of RNA (approximately 1 ng/μL), 5 μL of LNMP mix solution (approximately 7 × 10⁻⁹ mol/L for LCMP and LGMP, 1 × 10⁻⁸ mol/L for LUMP and LAMP), and 1 μL of SVP (0.00023 U/μL). The mixture was incubated at 37 ℃ for 15 min and centrifuged at 13,000 rpm for 2 min for subsequent IDMS analysis.
IDMS analysis
For the chromatographic separation of NMPs, high-performance liquid chromatography (HPLC) system of Agilent 1200 series was used with an SB-AQ C18, 3.5-μm particles, and a 2.1-mm × 100-mm analytical column (Agilent). The mobile phase was 0.1% formic acid (v/v) in a flow rate of 200 μL/min maintained at 30 ℃. The four NMPs were eluted after isocratic elution of 5.5 min. Sample aliquots of 3 μL were injected. Each sample was injected and analyzed for three replicates.
For quantification, signal detection was performed using a SCIEX API 5500 QTrap MS/MS system in positive ion and multiple reaction monitoring (MRM) modes. The ionspray voltage was 5500 V and the source gas temperature was 600 ℃. Other instrumental parameters and mass spectrometer data acquisition parameters are listed in Table 1.
Table 1.
Instrumental parameters and mass spectrometer data acquisition parameters
| ID | Q1 mass (Da) | Q3 mass (Da) | Time (ms) | DP (V) | EP (V) | CE (V) | CXP (V) |
|---|---|---|---|---|---|---|---|
| CMP | 324 | 112 | 200 | 80 | 9 | 18 | 17 |
| UMP | 325 | 97 | 200 | 50 | 10 | 14 | 15 |
| AMP | 348 | 136 | 200 | 120 | 10 | 46 | 17 |
| GMP | 364 | 152 | 200 | 80 | 12 | 17 | 17 |
| rCMP | 336 | 119.071 | 200 | 120 | 10 | 46 | 17 |
| rUMP | 336 | 102.071 | 200 | 120 | 10 | 46 | 17 |
| rAMP | 363 | 145.917 | 200 | 120 | 10 | 46 | 17 |
| rGMP | 379 | 162.042 | 200 | 120 | 10 | 46 | 17 |
Calculation of NMPs and RNA concentration
The final mass fraction of each NMP in the digested RNA sample was calculated using the bracketing IDMS method [24]. The final mass fraction of RNA concentration was calculated using Eq. 1:
| 1 |
where WRNA is the mass fraction of the RNA sample in micrograms per gram, Wx is the mass fraction of the selected NMP in the RNA sample, MRNA is the molecular mass of the RNA molecule (1,264,317.80 was used), MNMP is the molecular mass of the selected NMP, and N is the number of the selected NMP in the RNA sample (812 for CMP, 1136 for UMP, 816 for GMP, 1175 for AMP).
The copy number of RNA (n, in copies per microgram) was converted from the mass fraction of RNA (WRNA, in micrograms per gram) using Eq. 2:
| 2 |
where NA is Avogadro’s constant and D is the density of the sample. A density of 1.00 g/mL was taken into account in the calculation.
Reverse transcription digital PCR (RT-dPCR)
The reverse transcription digital PCR of ORF1ab, E, and N genes of the SARS-CoV-2 RNA sample was performed on a QX200 digital PCR system (Bio-Rad) as in a previous published study [25]. One-Step RT-ddPCR Advanced Kit for Probes (Bio-Rad, USA) was used. The reaction mixture included 5 μL of supermix, 2 μL of reverse transcriptase, 1 μL of 300 mM DTT, 1 μL of mixture of primers and probe, 7 μL of RNase-free water, and 4 μL of template. The RNA template was gravimetrically diluted before it was added to the reaction. The thermal cycling conditions were as follows: 45℃ for 60 min (reverse transcription); 95 ℃ for 10 min; 40 cycles of 95 ℃ for 30 s and 58 ℃ for 60 s; and 98 ℃ for 10 min.
Results and discussion
The optimization of separation of the four NMPs
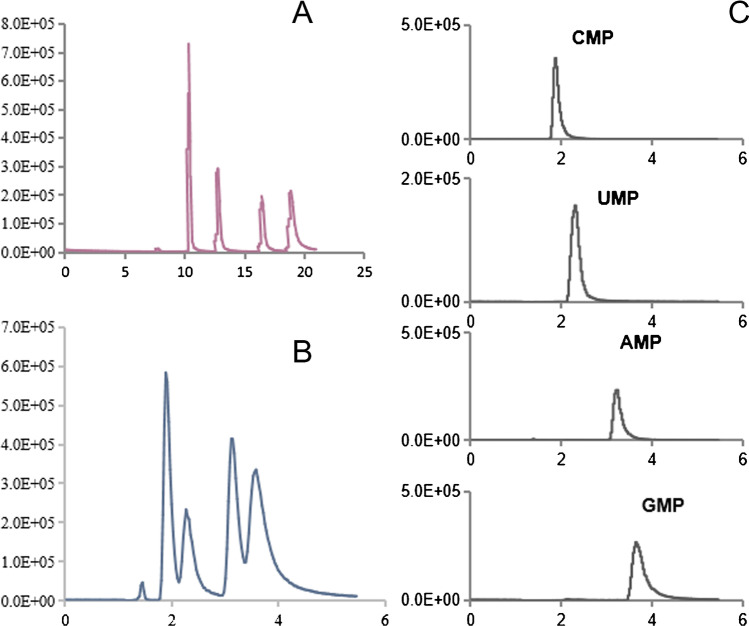
Our previous study showed that the in vitro transcribed RNA could be digested into NMPs within 15 min using SVP, and the four NMPs could be separated completely using an SB-AQ C18 column of 150 mm on the HPLC system [26]. For this study, an SB-AQ C18 column of 100 mm was used because the flow rate was reduced from 1 to 0.2 mL/min and the separation time would be extended from 5 to 25 min if the same column was used. The peaks of NMPs on the TIC of MS were slightly overlapped when using the 100-mm column compared to 150-mm column, but the XIC of each NMP was sharp enough for further integration (Fig. 1). To verify if this would affect the accuracy of the quantification results, an optimization experiment was performed by analyzing the same digested sample on the 100- and 150-mm columns. No significant difference was observed from the quantitative result of the four NMPs (Fig. 2, raw data are listed in Table S1). Therefore, the 100-mm column was used to quantify SARS-CoV-2 RNA in this study.
Fig. 1.
MRM total ion chromatograms (TICs) for nucleoside monophosphates (NMPs) using A C18 column of 150 mm, B a C18 column of 100 mm, and C extracted ion chromatograms (XICs) for NMPs using a C18 column of 100 mm
Fig. 2.
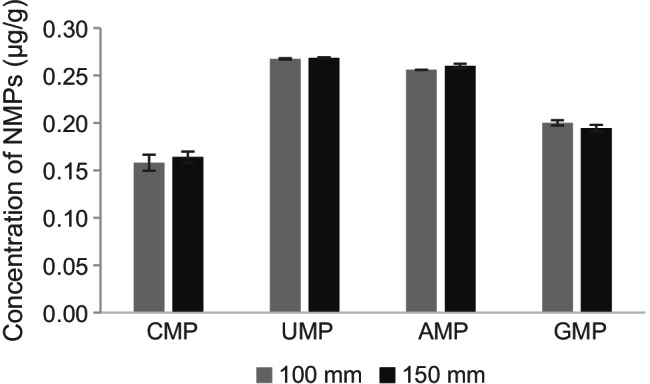
Comparison of the quantitative results of four NMPs using a C18 column of 100 mm and 150 mm
A mobile phase of formic acid (0.1% of v/v) was used in the separation system, and this was beneficial for the electrospray source due to the absence of contamination, such as ammonium acetate or ammonium hydrogen carbonate which was used earlier for separation of deoxynucleotides [22, 23].
Quantification of in vitro–transcribed SARS-CoV-2 RNA by IDMS
An in vitro–transcribed RNA with a length of 3939 nt including E, partial ORF1ab, and N genes of SARS-CoV-2 was used in this study. The purity of the RNA molecule was verified by an Agilent 2100 bioanalyzer. The RNA was digested by SVP into NMPs and analyzed by IDMS. The experiment was performed three times on different days. Two samples were analyzed each day with two digestion replicates of each sample (one sample with two digestion replicates was analyzed on day 3 on the third day, and each digestion was analyzed twice through C18 columns of 100 mm and 150 mm). Three injection replicates of each digested sample and calibration blend were performed, and the average was used to calculate the concentration of NMP. Four CRMs of NMPs from NIMC were used as calibrators, and stable isotope–labeled (13C, 15 N) NMPs (LNMPs) were used as internal standards.
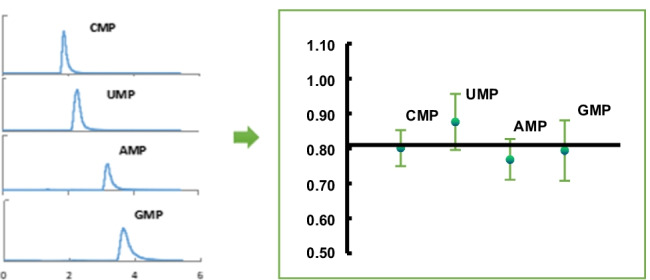
The quantitative result of in vitro–transcribed RNA by IDMS is listed in Table 2. The calculated mass fraction of the RNA derived from the measured concentration of CMP, UMP, AMP, and GMP was 0.80 μg/g, 0.88 μg/g, 0.77 μg/g, and 0.79 μg/g, respectively. The calculation of selected NMP concentration in the digestion mixture is listed in Table S2. The linear regression analysis of five independent calibrations is showed in Fig. S1. Limitation of detection of each NMP was assessed to be 0.01 μg/g for CMP, 0.04 μg/g for UMP, 0.02 μg/g for AMP, and 0.03 μg/g for GMP. The expanded uncertainty (U, k = 2) of the RNA mass fraction was 0.05, 0.08, 0.06, and 0.09 μg/g, respectively, where uncertainties associated with the reproducibility of the method, weighing of the samples and calibrators, and purity of the reference materials were considered. The sources of uncertainty are illustrated in Table S3. The average mass fraction of the in vitro–transcribed SARS-CoV-2 RNA calculated from the four NMPs was 0.81 μg/g, with % CV of 4.60%. The good agreement of RNA mass fractions determined based on each NMP indicates the proposed IDMS method provides an accuracy measurement for the in vitro–transcribed RNA (Fig. 3).
Table 2.
Calculated mass fraction of in vitro–transcribed SARS-CoV-2 RNA derived from the measured concentration of the four NMPs by IDMS
| Digestion | CMP (μg/g) | UMP (μg/g) | AMP (μg/g) | GMP (μg/g) | |
|---|---|---|---|---|---|
| Day 1 | 1 | 0.84 | 0.91 | 0.80 | 0.83 |
| 2 | 0.87 | 0.89 | 0.80 | 0.84 | |
| 3 | 0.76 | 0.79 | 0.70 | 0.71 | |
| 4 | 0.74 | 0.81 | 0.70 | 0.73 | |
| Mean | 0.80 | 0.85 | 0.75 | 0.78 | |
| CV (%) | 7.8 | 6.9 | 7.7 | 8.6 | |
| Day 2 | 1 | 0.83 | 0.88 | 0.78 | 0.78 |
| 2 | 0.80 | 0.85 | 0.76 | 0.78 | |
| 3 | 0.80 | 0.85 | 0.76 | 0.76 | |
| 4 | 0.86 | 0.83 | 0.72 | 0.73 | |
| Mean | 0.82 | 0.85 | 0.76 | 0.76 | |
| CV (%) | 3.5 | 2.4 | 3.3 | 3.1 | |
| Day 3 | 1–1 | 0.79 | 0.92 | 0.79 | 0.84 |
| 1–2 | 0.79 | 0.92 | 0.81 | 0.84 | |
| 2–1 | 0.73 | 0.92 | 0.79 | 0.86 | |
| 2–2 | 0.79 | 0.92 | 0.81 | 0.82 | |
| Mean | 0.78 | 0.92 | 0.80 | 0.84 | |
| CV (%) | 3.8 | 0.0 | 1.4 | 1.9 | |
| Mean (3 days) | 0.80 | 0.88 | 0.77 | 0.79 | |
| U (k = 2) | 0.05 | 0.08 | 0.06 | 0.09 | |
Fig. 3.
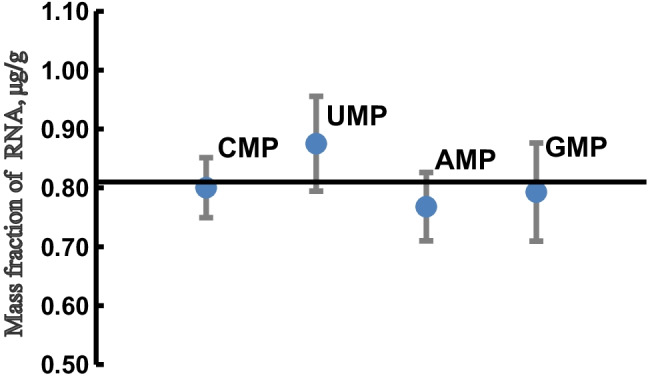
Comparison of the mass fraction of the in vitro–transcribed SARS-CoV-2 RNA derived from four NMPs. The error bar represents expanded uncertainty (k = 2), and the horizontal axis represents mean of the results
Quantification of in vitro–transcribed SARS-CoV-2 RNA by RT-dPCR
An RT-dPCR method of SARS-CoV-2 RNA was established previously by NIMC [25]. ORF1ab, E, and N genes were the common target genes of SARS-CoV-2 and could be detected and quantified by the method. The in vitro–transcribed E-N-ORF1ab RNA was quantified by the RT-dPCR method on QX200 (Bio-Rad).
Three tubes of samples were measured with three replicates for each sample. As the RNA concentration was higher than the upper limit of RT-dPCR, the samples were gravimetrically diluted about 105 times before performing the RT-dPCR. The information about gravimetric dilution process is listed in Table S4 and S5. To avoid RNA degradation during sample dilution, an RNA carrier of total yeast RNA was added to RNA storage solution (Thermo Fisher) as the dilution buffer.
The quantitative results of the three genes of RNA are shown in Fig. 4. The average copy number of ORF1ab, E, and N gene was 3.46E + 08, 3.44E + 08, and 3.50E + 08 copies/μL, respectively, with %CV of 2.59%, 2.81%, and 3.25%. Close agreement among the copy numbers of the three targets indicates the RT-dPCR assays were well optimized.
Fig. 4.
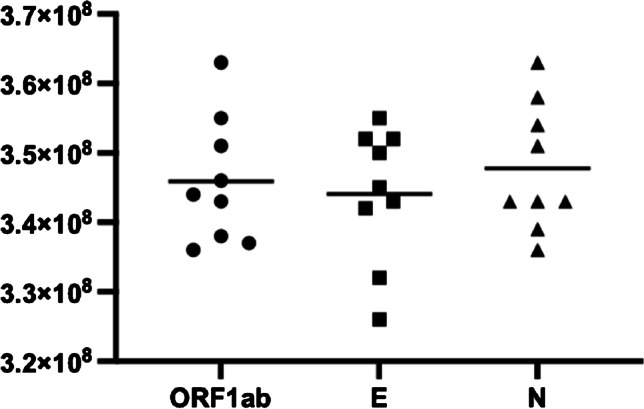
Quantitative results (copies/μL) of ORF1ab, E, and N genes of in vitro–transcribed SARS-CoV-2 RNA by RT-dPCR
Comparison of the quantitative results of RNA by IDMS and RT-dPCR
The mass fraction of the in vitro RNA measured by IDMS could be converted into copy number according to the molecular weight of the RNA and Avogadro’s constant. Consequently, the 0.81 μg/g was converted to a copy number of 3.86E + 08 copies/μL. The quantitative results of RT-dPCR turned out to be about 10% lower than that of IDMS, possibly because the RT efficiency could not be 100%. Thus, orthogonal methods which do not rely on RT such as single molecule flow cytometric counting, HPLC, and IDMS are needed to evaluate the accuracy of the RT-dPCR. In this study an accurate quantification method of RNA through enzymatic digestion followed by IDMS was developed and used to evaluate the RT efficiency of RT-dPCR. As shown in Table 3, the RT efficiency of ORF1ab, E, and N was assessed to be 89.6%, 89.1%, and 90.7%, respectively.
Table 3.
Copy number of RNA measured by IDMS and RT-dPCR
| Method | ORF1ab | E | N |
|---|---|---|---|
| RT-dPCR (copies/μL) | 3.46E + 08 | 3.44E + 08 | 3.50E + 08 |
| IDMS (copies/μL) | 3.86E + 08 | 3.86E + 08 | 3.86E + 08 |
| Ratio of RT-dPCR to IDMS | 89.6% | 89.1% | 90.7% |
Conclusion
SARS-CoV-2 is the pathogen of the ongoing global pandemic disease COVID-19. Accurate analytical methods of SARS-CoV-2 RNA play a critical role in the diagnosis of COVID-19. It has been reported that IDMS can be used as an accurate, primary method of oligonucleotide quantification in the DNA research area. In this study, enzymatic digestion followed by IDMS has been firstly used to our knowledge for RNA quantification. The mass fraction of SARS-CoV-2 RNA has been obtained by measuring the four constituents (NMPs) of RNA. Consistency of the results derived from four different NMPs provides confidence on the accuracy of the proposed method. This approach has several further advantages. Firstly, it is time efficient. It has been shown that RNA digestion to NMP is more efficient compared with DNA. The 3939-nt RNA used in our research could be digested within 15 min, and then the digested products could be analyzed by IDMS measurement within 5 min for one injection. Secondly, it is free of RNA sequence specificity. Certified reference material calibrators and stable isotope–labeled internal controls of the four NMPs could be used for any RNA sequence. Thirdly, it is independent of the reverse transcription process of RNA.
But the proposed method does not have an advantage for the detection of SARS-CoV-2 RNAs over RT-dPCR, due to its inherent limitations. For example, the sequence of the RNA should be known and isotopically labeled NMPs are needed to calculate the copy number of the RNA, and since all the NMPs in the solution could be detected, the RNA needs to be purified to exclude free NMPs. Nevertheless, this method is applicable for confirmation of RT-dPCR and evaluation of RT efficiency. It is suitable for accurate quantification of RNA in the development of a higher order of reference materials and RT reagents.
Supplementary Information
Below is the link to the electronic supplementary material.
Funding
This study was supported by the Science and Technology Program of the State Administration for Market Regulation (2020MK147) and Special Program for Technical Support of the State Administration for Market Regulation (2020YJ039).
Declarations
Conflict of interest
The authors declare no competing interests.
Footnotes
Publisher's note
Springer Nature remains neutral with regard to jurisdictional claims in published maps and institutional affiliations.
References
- 1.Dhama K, Khan S, Tiwari R, Sircar S, Bhat S, Malik YS, et al. Coronavirus disease 2019-COVID-19. Clin Microbiol Rev. 2020;33(4). 10.1128/CMR.00028-20 [DOI] [PMC free article] [PubMed]
- 2.Sohrabi C, Alsafi Z, O'Neill N, Khan M, Kerwan A, Al-Jabir A, et al. World Health Organization declares global emergency: a review of the 2019 novel coronavirus (COVID-19) Int J Surg. 2020;76:71–76. doi: 10.1016/j.ijsu.2020.02.034. [DOI] [PMC free article] [PubMed] [Google Scholar]
- 3.Cucinotta D, Vanelli M. WHO declares COVID-19 a pandemic. Acta Biomed. 2020;91(1):157–160. doi: 10.23750/abm.v91i1.9397. [DOI] [PMC free article] [PubMed] [Google Scholar]
- 4.Organization WH. WHO coronavirus (COVID-19) dashboard. https://covid19.who.int/. Accessed 24 April 2022
- 5.Gao J, Quan L. Current status of diagnostic testing for SARS-CoV-2 infection and future developments: a review. Med Sci Monit. 2020;26:e928552. doi: 10.12659/MSM.928552. [DOI] [PMC free article] [PubMed] [Google Scholar]
- 6.Lee SS, Kim S, Yoo HM, Lee DH, Bae YK. Development of SARS-CoV-2 packaged RNA reference material for nucleic acid testing. Anal Bioanal Chem. 2022;414(5):1773–1785. doi: 10.1007/s00216-021-03846-y. [DOI] [PMC free article] [PubMed] [Google Scholar]
- 7.Vierbaum L, Wojtalewicz N, Grunert HP, Lindig V, Duehring U, Drosten C, et al. RNA reference materials with defined viral RNA loads of SARS-CoV-2-A useful tool towards a better PCR assay harmonization. PLoS ONE. 2022;17(1):e0262656. doi: 10.1371/journal.pone.0262656. [DOI] [PMC free article] [PubMed] [Google Scholar]
- 8.Zhou H, Liu D, Ma L, Ma T, Xu T, Ren L, et al. A SARS-CoV-2 reference standard quantified by multiple digital PCR platforms for quality assessment of molecular tests. Anal Chem. 2021;93(2):715–721. doi: 10.1021/acs.analchem.0c03996. [DOI] [PubMed] [Google Scholar]
- 9.Emma Bentley ETM, Stephanie Routley, Ryan Mate, Martin Fritzsche, Matthew Hurley, Yann Le Duff, Rob Anderson, Jason Hockley, Peter Rigsby, Mark Page, Nicola Rose, Giada Mattiuzzo and the Collaborative Study Group. Collaborative study for the establishment of a WHO international standard for SARS-CoV-2 RNA. WHO Expert Committee on Biological Standardization. https://www.who.int/publications/m/item/WHO-BS-2020.2402. Accessed 18 November 2020
- 10.Hindson BJ, Ness KD, Masquelier DA, Belgrader P, Heredia NJ, Makarewicz AJ, et al. High-throughput droplet digital PCR system for absolute quantitation of DNA copy number. Anal Chem. 2011;83(22):8604–8610. doi: 10.1021/ac202028g. [DOI] [PMC free article] [PubMed] [Google Scholar]
- 11.Hindson CM, Chevillet JR, Briggs HA, Gallichotte EN, Ruf IK, Hindson BJ, et al. Absolute quantification by droplet digital PCR versus analog real-time PCR. Nat Methods. 2013;10(10):1003–1005. doi: 10.1038/nmeth.2633. [DOI] [PMC free article] [PubMed] [Google Scholar]
- 12.Dong L, Wang X, Wang S, Du M, Niu C, Yang J, et al. Interlaboratory assessment of droplet digital PCR for quantification of BRAF V600E mutation using a novel DNA reference material. Talanta. 2020;207:120293. doi: 10.1016/j.talanta.2019.120293. [DOI] [PubMed] [Google Scholar]
- 13.Niu C, Wang X, Zhang Y, Lu L, Wang D, Gao Y, et al. Interlaboratory assessment of quantification of SARS-CoV-2 RNA by reverse transcription digital PCR. Anal Bioanal Chem. 2021;413(29):7195–7204. doi: 10.1007/s00216-021-03680-2. [DOI] [PMC free article] [PubMed] [Google Scholar]
- 14.Wang X, Zhang Y, Niu C, Wang S, Li L, Guo Y, et al. Establishment of primary reference measurement procedures and reference materials for EGFR variant detection in non-small cell lung cancer. Anal Methods. 2021;13(18):2114–2123. doi: 10.1039/d1ay00328c. [DOI] [PubMed] [Google Scholar]
- 15.Schwaber J, Andersen S, Nielsen L. Shedding light: the importance of reverse transcription efficiency standards in data interpretation. Biomol Detect Quantif. 2019;17:100077. doi: 10.1016/j.bdq.2018.12.002. [DOI] [PMC free article] [PubMed] [Google Scholar]
- 16.Bustin S, Dhillon HS, Kirvell S, Greenwood C, Parker M, Shipley GL, et al. Variability of the reverse transcription step: practical implications. Clin Chem. 2015;61(1):202–212. doi: 10.1373/clinchem.2014.230615. [DOI] [PubMed] [Google Scholar]
- 17.Stahlberg A, Kubista M, Pfaffl M. Comparison of reverse transcriptases in gene expression analysis. Clin Chem. 2004;50(9):1678–1680. doi: 10.1373/clinchem.2004.035469. [DOI] [PubMed] [Google Scholar]
- 18.Stahlberg A, Hakansson J, Xian X, Semb H, Kubista M. Properties of the reverse transcription reaction in mRNA quantification. Clin Chem. 2004;50(3):509–515. doi: 10.1373/clinchem.2003.026161. [DOI] [PubMed] [Google Scholar]
- 19.Minshall N, Git A. Enzyme- and gene-specific biases in reverse transcription of RNA raise concerns for evaluating gene expression. Sci Rep. 2020;10(1):8151. doi: 10.1038/s41598-020-65005-0. [DOI] [PMC free article] [PubMed] [Google Scholar]
- 20.Heumann KG. Isotope dilution mass spectrometry of inorganic and organic substances. Fresenius' Zeitschrift für analytische Chemie. 1986;325:661–666. doi: 10.1007/BF00470971. [DOI] [Google Scholar]
- 21.De Leenheer AP, Lefevere MF, Lambert WE, Colinet ES. Isotope-dilution mass spectrometry in clinical chemistry. Adv Clin Chem. 1985;24:111–161. doi: 10.1016/s0065-2423(08)60272-3. [DOI] [PubMed] [Google Scholar]
- 22.O'Connor G, Dawson C, Woolford A, Webb KS, Catterick T. Quantitation of oligonucleotides by phosphodiesterase digestion followed by isotope dilution mass spectrometry: proof of concept. Anal Chem. 2002;74(15):3670–3676. doi: 10.1021/ac0255375. [DOI] [PubMed] [Google Scholar]
- 23.Donald CE, Stokes P, O'Connor G, Woolford AJ. A comparison of enzymatic digestion for the quantitation of an oligonucleotide by liquid chromatography-isotope dilution mass spectrometry. J Chromatogr B Analyt Technol Biomed Life Sci. 2005;817(2):173–182. doi: 10.1016/j.jchromb.2004.11.058. [DOI] [PubMed] [Google Scholar]
- 24.Dong L, Zang C, Wang J, Li L, Gao Y, Wu L, et al. Lambda genomic DNA quantification using ultrasonic treatment followed by liquid chromatography-isotope dilution mass spectrometry. Anal Bioanal Chem. 2012;402(6):2079–2088. doi: 10.1007/s00216-011-5644-5. [DOI] [PubMed] [Google Scholar]
- 25.Dong L, Zhou J, Niu C, Wang Q, Pan Y, Sheng S, et al. Highly accurate and sensitive diagnostic detection of SARS-CoV-2 by digital PCR. Talanta. 2021;224:121726. doi: 10.1016/j.talanta.2020.121726. [DOI] [PMC free article] [PubMed] [Google Scholar]
- 26.Niu C, Dong L, Gao Y, Zhang Y, Wang X, Wang J. Quantitative analysis of RNA by HPLC and evaluation of RT-dPCR for coronavirus RNA quantification. Talanta. 2021;228:122227. doi: 10.1016/j.talanta.2021.122227. [DOI] [PMC free article] [PubMed] [Google Scholar]
Associated Data
This section collects any data citations, data availability statements, or supplementary materials included in this article.


