

Abstract
Background: RNA N6-methyladenosine (m6A) has been found to have a critical impact on clear cell renal cell carcinoma (ccRCC) by affecting the tumor microenvironment (TME) and immune cell (IC) infiltration and is related to the treatment and survival rate of patients with ccRCC. However, the mechanism of m6A in TME and IC infiltration remained unclear. Methods: Nonnegative Matrix Factorization (NMF) clustering was performed on 650 ccRCC cases from the Cancer Genome Atlas (TCGA) and the Gene-Expression Omnibus (GEO) datasets. The immune infiltration was generated by the single-sample gene-set enrichment analysis (ssGSEA) algorithm. Survival analyses were performed using the Kaplan-Meier method, and the significance of the differences was determined using the log-rank test. The m6A score was constructed based on the expression of m6A regulators to quantify m6A modification. The package “survminer R” was employed to layer patients’ low and high scores groups and predict the immunotherapy response. Results: Three different patterns of m6A modification were established, and significant differences in TME and IC infiltration features were found in these three patterns. Survival analysis demonstrated that m6A cluster A and m6A gene cluster A experienced a longer survival time. Evaluation of m6A modification patterns in individual tumors was initiated by the m6A score. The low m6A score subtype was characterized by increased tumor mutation burden (TMB) and immune infiltration, whereas a high m6A score with a lack of immune cell infiltration showed significantly better overall survival. m6A score was also associated with the expression of programmed cell death protein 1 (PD-L1) and cytotoxic T lymphocyte antigen 4 (CTLA-4). Patients in the high m6A score group had high PD-L1 expression and low CTLA-4 expression. Significant differences in prognosis were identified among types of different TMB and m6A scores, where low TMB and high m6A score had longer survival time. Conclusions: This research indicated that m6A modification greatly affected TME and IC infiltration. Physicians can develop practical immunotherapy strategies for patients with ccRCC by evaluating m6A-associated genes.
Keywords: ccRCC, m6A, tumor microenvironment, immunotherapy, tumor mutation burden
Introduction
Renal cell carcinoma (RCC) is the most lethal cancer in the genitourinary system, with a 5-year relative survival rate of only 12%. Clear cell renal cell carcinoma (ccRCC) has been one of the most common types of RCC pathology, accounting for approximately 80% of RCC and 2%~3% of adult malignancies [1-3]. According to the latest cancer statistics report, more than 65,000 were diagnosed in the U.S., leading to almost 15,000 deaths every year [4]. However, many patients with RCC did not develop clinical symptoms for most of their natural disease course [2]. Therefore, they were often locally advanced (and unresectable) or had metastases when diagnosed and their prognosis was generally poor, with 20% to 30% of the patients developing a recurrence after primary treatment [2]. ccRCC is not sensitive to either radiation or chemotherapy, but as a highly immunogenic tumor, patients with ccRCC can benefit from immunotherapy such as immune checkpoint inhibitors like anti-PD-L1 [5]. However, cells with immunosuppressive effects in the tumor microenvironment (TME) can cause ccRCC to be resistant to immunotherapy, and the median survival time is still less than three years [6]. Therefore, typing ccRCC and evaluating the differently typed TME and immune cell infiltrates is necessary for patients’ treatment.
N6-methyladenosine (m6A) is the most abundant epigene-transcriptome modification in eukaryotic mRNA [7]. m6A RNA methylation is a dynamic and reversible modification process, and the realization of its function is primarily regulated by the m6A methyltransferase complex (writers), m6A demethylase (erasers), and m6A read protein (readers) [7,8]. m6A modifications were identified to be involved in multiple processes such as anterior mRNA splicing, processing, and translation regulation, whose dynamic reversible changes control and determine cell growth and differentiation. This suggests that abnormalities in m6A and modified proteins may have corresponding pathologic effects in tumorigenesis and progression [9,10]. m6A modifications have been reported to be associated with the patterning of diversity and complexity of TME in a series of cancers [11-13]. m6A is related to epigenetic transcriptomics to tumorigenesis and development, affecting various processes of tumor cell biological characteristics. As a result, the essential proteins involved in m6A alteration are thought to represent prospective molecular targets for cancer diagnosis and treatment, as well as drug development [7,14].
Furthermore, previous studies have indicated that m6A is closely linked to TME changes and immune cell (IC) infiltration [13,15-17]. However, these studies were only focused on several m6A regulators or ICs. The m6A effect on the tumor in ccRCC is characterized by a coordinated interaction of diversified m6A-associated genes. Therefore, a comprehensive understanding of TME alterations by multiple m6A regulators and a relevant classification for ccRCC patients will help with individualized immunotherapy regimens.
Our study integrated relevant data from the Cancer Genome Atlas (TCGA) and the Gene-Expression Omnibus (GEO) datasets to comprehensively assess m6A modification patterns in ccRCC. Patients were then typed into different patterns to evaluate their characteristics of TME and IC infiltration. By constructing a scoring system based on m6A modification patterns, the prognosis of patients of different types and different m6A scores could be assessed.
Methods
Construction of m6A clusters based on m6A-associated genes
Patient data were acquired from the TCGA dataset and GEO datasets (GSE29609). These 23 m6A regulators were extracted, including eight writers, two erasers, and thirteen readers. The specific names of m6A-associated genes are displayed in the supplementary data. Different m6A clusters were constructed based on the expression of m6A-associated genes, and unsupervised clustering analyses were applied to classify patients into distinct groups. The quantity and stability in the process of clustering were guaranteed by employing the consensus clustering algorithm, and the stability of classification was determined by using the “ConsensuClusterPlus” package [18].
Gene set variation analysis (GSVA) and functional annotation
The biologic process differences of m6A modification patterns were investigated using GSVA enrichment analysis. GSVA is an unsupervised, nonparametric method for estimating the gene set enrichment results of a microarray and transcriptome [19]. We downloaded from MSigDB datasets “c2.cp.kegg.v7.2.symbols.gmt” datasets for enrichment analysis.
Estimation of TME cell infiltration
The single-sample gene-set enrichment analysis (ssGSEA) approach was employed to quantify the relative abundance of IC infiltration in the TME of ccRCC. The dataset for the type of ICs which contained activated CD4+ T cells, myeloid-derived suppressor cells (MDSC), regulatory T cells, and many others in the nTME were identified from the research of Charoentong [20].
Screening of differentially expressed genes (DEGs) between different m6A clusters
Patients were classified into distinct m6A clusters according to the expression of m6A-associated genes to screen m6A-related DEGs. DEGs between different m6A clusters were extracted by employing the empirical Bayesian algorithm in the “limma” R package [21], and an adjusted P-value <0.001 was set as the significant criterion.
Identification of m6A score
We constructed the m6A score to quantify the m6A modification pattern in ccRCC. The steps for establishing an m6A score were: Initially, we distinguished the DEGs from distinct m6A clusters from all ccRCC samples and extracted and normalized the overlap genes. The unsupervised clustering method was then applied to classify patients into distinct groups for analyzing DEGs. Then, analysis for the prognosis of each gene was performed employing a multi-Cox regression model to extract significant genes for further analysis. Principal component analysis (PCA) was then conducted to structure the scoring system. Principal components 1 and 2 were derived from contributions that did not track other genes as signature scores. The m6A score was defined as the summarization of the expression of m6A-associated genes in both principal components [22,23].
Immunophenoscore (IPS) is a superior predictor developed by Charoenton for evaluating the antibody responses to CTLA-4 and PD-L1 [20]. We then validated the correlation between different IPS subgroups and m6A score subgroups.
Statistical analysis
Spearman and distance correlation analysis calculated the correlation coefficient between ICs in the TME and m6A regulatory factor expression. Identification of the differences among distinct groups was performed by One-way ANOVA and Kruskal-Wallis test. The cut-off point of subgroups was determined using the package “survminer” based on the association between m6Ascore and patients’ survival [24]. m6A score dichotomizing was performed by the “surv-cutpoint” function iteratively testing all possible existing cut points to identify the optimal parameters. Then, according to the maximum selected log-rank statistics, the patients were classified into different m6A score groups to control the batch effect. The Kaplan-Meier approach was utilized to generate survival curves in prognostic analysis, and log-rank tests were employed to verify the significance of differences. The results of prognostic analysis for patients with ccRCC were visualized by employing the package “forestplot” and the mutation landscape for patients in different groups was displayed using the waterfall function of package “maftools”. The copy number variation (CNV) diagram for m6A regulators was plotted through the package “Rcircos”. All statistical P values were two sided, and statistical significance was set as P<0.05. All data were processed by R 4.1.1 software.
Results
Landscape of genetic variation of m6A regulators in ccRCC
There were altogether 23 m6A regulators finally selected in this research. We initially explored the CNV and incidence of somatic mutations in 23 m6A-associated genes in ccRCC. There were 24 (7.14%) in 336 samples exhibiting mutations of m6A regulators, and we found a mutation frequency in YTHDC2, ZC3H13, YTHDC1, WTAP, and LRPPRC, while other regulators did not show any mutations in ccRCC samples (Figure 1A). The relative location area of CNV alteration for each m6A-associated gene on chromosomes is depicted in Figure 1B. We then studied the transcriptional expression of regulatory factors in normal and ccRCC samples to confirm the effect of genetic variations and CNV alterations that might be ascertained to be critical factors leading to perturbations in m6A regulators’ expression. The investigation demonstrated a broad alteration in regulators and YTHDC2, whose expression was significantly increased in tumor (P<0.001), was focused on the significant amplification in copy number. RBM15B was also found a significant deletion in copy number. IGFBP2, WTAP, YTHDF2, METTL14, and ZC3H13 showed a higher frequency of CNV deletion (Figure 1C, 1D). The above results displayed an overview of expressional alteration in m6A regulators, which are implied to be intimately associated with occurrence and progression in ccRCC.
Figure 1.

Landscape of genetic variation of m6A regulators in ccRCC. A. The modification frequency of 23 m6A regulators in 336 ccRCC patients from the TCGA-KIRC dataset. Each column represents a patient. The upper bar diagram represents TMB. The bar diagram on the right shows the proportion of the individual variation types. The number on the right represents the mutation frequency of each regulator. The following stacked bar diagram indicates the proportion of transformation of each sample. B. The location of CNV alteration of m6A regulators on 23 chromosomes from TCGA-KIRC dataset. C. The expression of 23 m6A regulators between normal tissues and ccRCC tissues. Red represents tumor and blue represents normal. The top and bottom of the boxes represent maximum to minimum values. Black dots represent outliers. Lines in the boxes show the median value. The asterisks represent the statistical P value (*P<0.05; **P<0.01; ***P<0.001). D. The frequency of CNV alteration in m6A regulators from TCGA-KIRC dataset. The length of each column shows the alteration frequency. The green dots represent deletion and the red dots represent amplification.
Construction of m6A clusters
We first evaluated 23 m6A regulators to analyze the prognosis of ccRCC, and a total of 20 genes, including ALKBH5, FMR1, and FTO were found to influence the prognosis of ccRCC significantly (Figure S1A-T). The landscape of interactions and connection between 23 regulators in ccRCC and significant correlations was found between 23 regulators (Figure 2A). These results suggested that crosstalk between regulators of the writers, readers, and erasers might differ between individual tumors. We found a positive correlation between most regulators, but interestingly, a negative correlation was found between IGFBP1 and METTL3, METTL6, ZC3H13, and YTHDC1 (Figure 2A). Unsupervised clustering algorism was then employed to type patients into distinct m6A modification patterns according to the m6A regulators’ expression, and eventually, three modification patterns were determined as m6A cluster A-C, respectively (Figure S2). There were 257 patients in cluster A, 209 patients in cluster B, and 103 patients in cluster C. Figure 2B revealed that m6A cluster A showed a significant survival advantage among the three clusters in survival analysis.
Figure 2.

Biological characteristics of distinct m6A modification. A. The correlation between m6A regulators in ccRCC. The lines linking regulators showed their interactions and red represent positive correlation while blue represents negative correlation. The erasers, readers and writers are colored red, orange, and grey, respectively. Green and purple dots in the circle represent protective and risk factors respectively the size of each circle represented the statistical P-value with P<0.0001, P<0.001, P<0.01, and P<0.05, respectively. B. Survival analyses of the three m6A clusters including 257 cases in pattern A, 209 cases in pattern B and 103 cases in pattern C (P<0.001). Blue for m6A cluster A, yellow for m6A cluster B and red for m6A cluster C. The number of alive patients along with time in three clusters is at the bottom of the picture. Kaplan-Meier curves show significant survival differences among the three m6A modification patterns, while m6A cluster A exhibited a significant survival advantage among the three clusters. C, D. Activation of biologic pathways analysis in three m6A clusters with GSVA. The heatmap is a visualization of these biological processes. Red, activated pathways; blue, inhibited pathways. C. m6A cluster A vs. m6A cluster B. D. m6A cluster A vs. m6A cluster C. E. Visualization of patients’ characteristics and m6A regulators in distinct m6A clusters. In the heatmap, red represents increased expression of m6A regulator; and blue represents decreased expression of m6A regulator.
GSVA was conducted to explore the behaviors among three m6A clusters. As shown in Figure 2C, 2D, m6A cluster A was markedly enriched in the ErbB signaling pathway, ubiquitin-mediated proteolysis, and adherens junction. M6A cluster B presented enrichment pathways associated with the metabolism of xenobiotics by cytochrome p450, drug metabolism cytochrome p450, linoleic acid metabolism, and arachidonic acid metabolism, while m6A cluster C was prominently related to biological processes associated with immune activation, such as complement and coagulation cascades and cytokine-cytokine receptor interaction.
Detailed analyses of three m6A clusters and the clinical features of patients were then performed by drawing a heatmap, and PCA and three m6A clusters were found to have a significant difference in transcriptional profile (Figures 2E, 3B). m6A cluster A was characterized by increased expression of METTL16, WTAP, VIRMA, ZC3H13, and YTHDF2. IGFBP1 also presented a remarkable increase in m6A cluster C. However, m6A-associated genes decreased in m6A cluster B to varying degrees (Figure 2E). Analysis for infiltration of ICs in TME demonstrated that m6A cluster C was rich in innate IC infiltration such as activated B cells, activated CD4+ T cells, and regulatory T cells (Figure 3A). However, m6A cluster C showed the worst overall survival among the three m6A clusters (Figure 2B), which indicated that enrichment of ICs in ccRCC was possibly linked to shortening survival time.
Figure 3.

TME cell infiltration characteristics and transcriptome traits in three m6A clusters. A. Immune cells of TME infiltration of distinct m6A clusters. The top and bottom of the boxes represent maximum to minimum values. Black dots represent outliers. Lines in the boxes show the median value. The asterisks represent the statistical P-value (*P<0.05; **P<0.01; ***P<0.001). B. Transcriptome analysis of distinct m6A clusters with PCA. Blue for m6A cluster A, yellow for m6A cluster B and red for m6A cluster C. C. Venn diagram of DEGs. There were 1152 DEGs between the three m6A gene patterns in ccRCC. D. GO enrichment analysis of m6A-related genes. The color depth of the bar plots represents the number of genes enriched. The length of the frame bar represents the count of enriched genes in the pathway and the color represents the q value. E. KEGG pathway analysis of DEGs. The size of the circles represents the count of enriched genes in each pathway and the color represents the q value.
Characteristics of TME-infiltrated ICs and pathway enrichment analyses
To explore the functions of intersection genes, we performed GO (Gene Ontology) and KEGG (Kyoto Encyclopedia of Genes and Genomes) analyses on the intersection genes in this study. The “limma” package was initially employed to extract DEGs from 3 m6A clusters, and 1152 DEGs were finally identified (Figure 3C). GO revealed that DEGs of ccRCC were found enriched mainly in molecular functions, including protein serine/threonine kinase activity and ubiquitin-like protein ligase binding. Meanwhile, the enrichment of DEGs for cellular components contained focal adhesion, organelle subcompartments, Golgi subcompartments, molecular functions. Biological processes contained proteasomal proteolytic processes, the establishment of organelle localization, and Golgi vesicle transport (Figure 2D). KEGG analysis suggested that intersection genes were significantly enriched in pathways in cancer, protein processing in the endoplasmic reticulum, and focal adhesion and ubiquitin mediated proteolysis (Figure 2E).
Construction of m6A phenotype-related genes signatures
The R package of “ConsensusClusterPlus” was employed to perform clustering analyses. Patients were classified into different genomic subtypes based on the obtained 1152 DEGs to verify the mechanism. Three m6A modification genomic phenotypes were then generated by the k-means algorithm, and these phenotypes were termed as m6A gene cluster A-C, respectively (Figures 3C, S3A-I). It was found that patients in m6A gene cluster A (307 patients) patterns expressed better clinical endpoint while patients in gene cluster C (142 patients) exhibited shorter survival time (Figure 4A). The expression of m6A-associated genes was then found to have prominent differences among three gene clusters, consistent with m6A clusters (Figure 4B).
Figure 4.
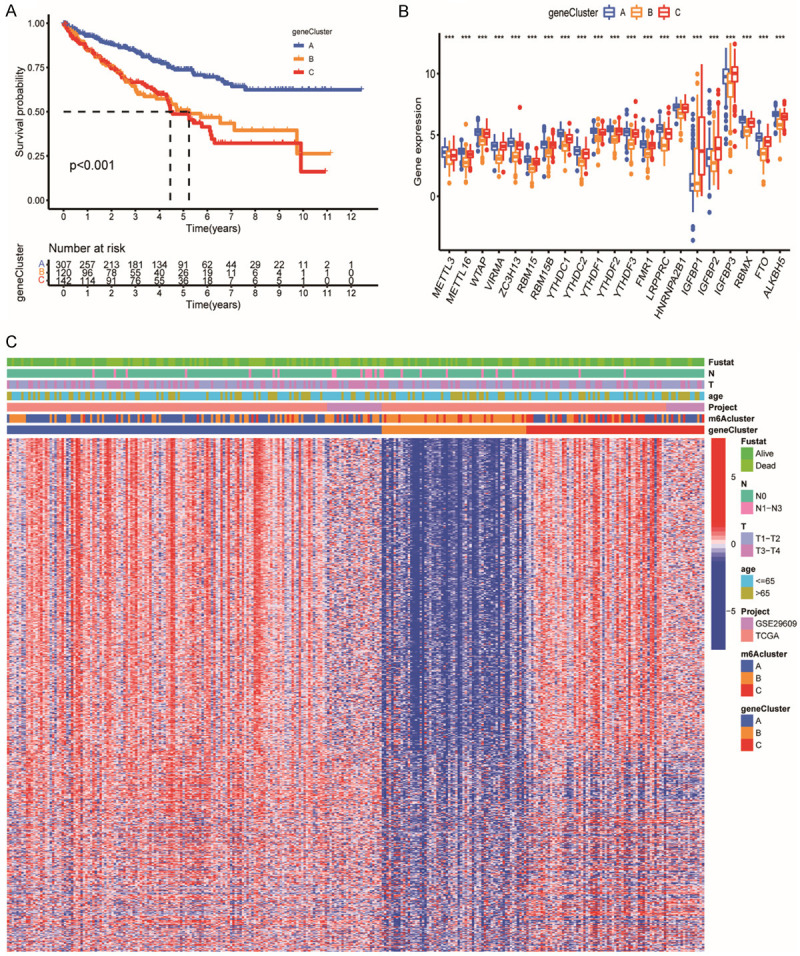
Construction of m6A phenotype-related genes clusters. A. Survival analyses of the three m6A clusters including 307 cases in gene cluster A, 120 cases in gene cluster B and 142 cases in gene cluster C (P<0.001). Blue for m6A gene cluster A, yellow for m6A gene cluster B and red for m6A gene cluster C. The number of alive patients and time in three clusters is at the bottom of the picture. B. Immune cells of TME infiltrating of distinct m6A gene clusters. The top and bottom of the boxes represent maximum to minimum values. Black dots represented outliers. Lines in the boxes show the median value. The asterisks represent the statistical P value (*P<0.05; **P<0.01; ***P<0.001). C. Visualization of patients’ characteristics and m6A-related genes in distinct m6A gene clusters. The gene clusters, m6A clusters, project types, age, tumor stage, histology and survival status were used as patient annotations. In the heatmap, red represent increased expression of m6A-related genes; blue represent decreased expression of m6A-related genes.
Biological features of m6A score
In order to quantify the m6A modification patterns based on DEGs, we constructed a system of evaluation which was termed as the m6A score (Figure 5B). Figure 5A shows that patients with higher m6A score exhibited significantly better survival time than lower groups. The m6A score may be positively correlated with activated CD8+ T cells, monocytes, and type 17 T helper cells, and negatively correlated with immune cells such as regulatory T cells, type 2 T helper cells, and T follicular helper cells (Figure 5B). A significant correlation was found between m6A scores and m6A clusters, and between m6A scores and m6A gene clusters (Figure 5C, 5D). In Figure 5C, the median score for gene cluster C was notably lower than for gene clusters A and B. Previous analysis indicated that gene cluster C expressed the worst prognosis than other gene clusters (Figure 4A). The attributed connections visualization was realized by an alluvial diagram (Figure 5E). It appeared in Figure 5E that m6A cluster A and gene cluster A mostly corresponded to high m6A scores, which perhaps explained why they presented with the best prognosis in previous studies (Figures 2B, 4A).
Figure 5.

Biological features of m6A score. A. Survival analyses of distinct m6A score groups. Blue for low m6A score and red for high m6A score. Patients with higher m6A score exhibited significantly better survival times than the lower group (P<0.001). B. Correlations between m6A score and immune cells. A square with “*” represents a significant correlation and its color represents the coefficient. Negative correlation is marked with blue and positive correlation with red. C. Differences in m6A score among different m6A gene clusters. The top and bottom of the boxes represent maximum to minimum values. Black dots represent outliers. Lines in the boxes show the median value. There were significant differences among the different m6A gene clusters (P<0.0001). D. Differences in m6Ascore between different m6A clusters. Significant differences were found between m6A clusters A and C and m6A cluster A and B (P<0.0001, Kruskal-Wallis test). E. Alluvial diagram showing the changes in m6A cluster, gene cluster, m6A score and survival status.
Characteristics of m6A score and tumor mutation burden in ccRCC
We first performed the significance tests between the m6A score and TMB to illustrate the relationship between TMB and m6A score in ccRCC. We found a significant TMB difference between both m6A scores groups (Figure 6A). Subsequently, Figure 6B, 6C further showed a negative correlation between m6A score and TMB. Patients with low TMB presented with a better prognosis, corresponded to our previous conclusions that patients with high m6A score experienced better clinical endpoints (Figure 5A). Figure 6D further illustrated the connection between m6A score and TMB in the prognosis of ccRCC. A high m6A score and low TMB corresponded to the highest survival probability, while a low m6A score and high TMB linked to the lowest survival probability. This also further demonstrated that a high m6A score and low TMB might promote the prognosis of patients in ccRCC.
Figure 6.

Characteristics of m6 A score and tumor mutation burden in ccRCC. A. Differences in TMB between two m6A score groups. The top and bottom of the boxes represent maximum to minimum values. Black dots represent outliers. Lines in the boxes show the median value. Blue, low m6A score; red, high m6A score. B. Quantitative relationship between m6A score and TMB. Abscissa represents m6A score and ordinate represents TMB. There was a negative correlation between m6A score and TMB (R=-0.17, P=0.0018). C. Survival analyses for distinct TMB groups using Kaplan-Meier curves. H, high; L, Low; (P<0.001, Log-rank test). D. Survival analyses for different TMB and different m6A scores using Kaplan-Meier curves. H, high; L, Low; (P<0.001, Log-rank test).
m6A score in the role of immunotherapy in ccRCC
ccRCC was insensitive to both radiation therapy and chemotherapy, but it was highly immunogenic, and therefore immunotherapy was extremely significant for ccRCC. We found that increased PD-L1 expression and decreased CTLA-4 expression appeared with a high m6A score (Figure 7A, 7B). The IPS was used to evaluate the individual response to the CTLA-4 and PD-1 antibodies. We investigated the effect of m6A scores on IPS and the response of patients to immune checkpoint blockade therapy, and Figure 7C-F indicated a correlation between IPS and m6A score in four groups with negative or positive PDL1 and CTLA-4. Among the four groups, the median of IPS was significantly higher in high m6A score groups, suggesting that no matter the status of PD-L1 and CTLA-4, patients with higher m6A score would have better response to antibody treatment.
Figure 7.
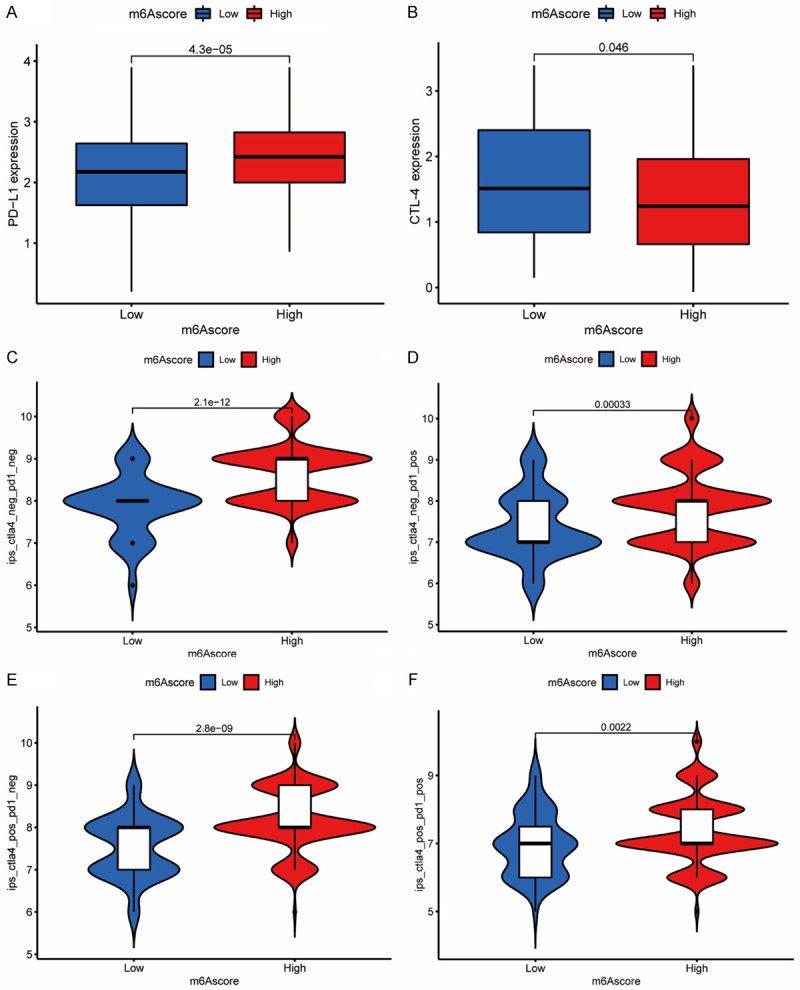
m6A score in the role of immunotherapy in ccRCC. A. Differences in PD-L1 expression between low and high m6A score groups (P<0.0001, Wilcoxon test). B. Differences in CTLA-4 expression between low and high m6A score groups (P<0.0001, Wilcoxon test). C-F. Differences in immunophenoscore between different m6A score groups (P<0.0001, Wilcoxon test). C. Differences in negative CTLA-4 and negative PD-1 group between different m6A score groups. D. Differences in negative CTLA-4 and positive PD-1 group between different m6A score groups. E. Differences in positive CTLA-4 and negative PD-1 group between different m6A score groups. F. Differences in positive CTLA-4 and positive PD-1 group between different m6A score groups.
Discussion
Researchers have gradually realized that m6A modification patterns are of essential value in tumorigenesis [14,25-27]. However, most of the current research concentrated on m6A-related genes, but the TME mediated by m6A regulator synthesis and IC infiltration features remains unclear [28,29]. Furthermore, clarifying the regulatory role of different patterns of m6A modification in ccRCC may deepen awareness of tumor immunotherapy and guide therapeutic targets, which is particularly important for ccRCC [30,31]. In our study, the analysis was performed by combining the GEO and TCGA datasets. The incidence of copy number variants was first investigated, and somatic mutations among the 23 m6A regulators in the ccRCC. Mutations in ccRCC were more frequent than in other diseases like acute myelogenous leukemia [32]. Of the 336 samples, 24 had m6A regulatory gene mutations at a frequency of 7.14%, and protein structural changes or dysregulation of m6A regulators due to mutations may be one of the causes of tumorigenesis. Thus, m6A regulators are crucial in carcinogenesis and development. Subsequently, we identified three different patterns of m6A methylation modification using an unsupervised clustering algorithm. All three patterns had distinct prognostic features and features of IC infiltration. This was similar to the pattern seen in other cancer studies, such as gastric cancer, liver cancer, and glioma [13,33,34]. Among them, the m6A cluster A modification pattern had a particularly significant survival advantage, while m6A cluster C was closely associated with biological processes related to immune activation.
At the molecular level, we found that the mutant copy number of YTHDC2 (YTH domain containing 2) was significantly upregulated, and its expression varied in both normal and ccRCC samples. The marked increase of expression of YTHDC2 in m6A cluster A suggested that YTHDC2 may be related to tumorigenesis. The role of YTHDC2 in some tumors has been partially verified. Jin Wang’s research [35] found that the overexpression of YTHDC2 inhibited the proliferation and migration of lung cancer cells through in vivo and in vitro studies. However, the relationship between YTHDC2 and ccRCC remains poorly studied. Thus, we hope for more experiments to be performed to confirm the conjecture later. In addition, m6A was closely connected to different carcinomas’ growth, invasion, and metastasis. In hepatocellular carcinoma, the increase in METTL3 can facilitate invasiveness [36]; YTHDF2 is highly expressed in pancreatic cancer tissues and promotes tumor progression [36]. Subsequent analysis of TME cell infiltration indicated that m6A cluster C was enriched in natural IC infiltration, including activated B cells, activated dendritic cells, macrophages, MDSC, and regulatory T cells. In addition, there were significant differences in the transcriptome between different m6A clusters in this study. DEGs were also found enriched in immune-related pathways. Similar to the clustering results of the m6A, based on DEGs screened among three m6A clusters, we identified three immune-related gene clusters. This proves once again the importance of the m6A changes for shaping different TME landscapes. Many relevant studies also suggested that m6A modification may affect tumor prognosis through TME cells. For example, the m6A modification may help tumor cells escape by hindering dendritic cells’ (DCs) activation [37]. Meanwhile, the absence of YTHDF1 in DCs can enhance antitumor immunity and inhibit tumor growth [38]. In regulatory T cells, m6A can control the differentiation of naive T cells and maintain the inhibitory function of regulatory T cells [39]. In addition, the deletion of METTL14 can severely impair B cells’ development and lead to abnormal gene expression that is essential for B cells’ growth [40]. As the mechanism between m6A and TME cells is still unknown, exploring the modification patterns can help us determine the infiltration properties of ICs in the TME.
Since m6A modification varies among individuals, it needs to be further quantified. Our research suggested that m6A score could reliably predict the prognosis of ccRCC. Furthermore, m6A score may be positively associated with activated CD8+ T cells and negatively associated with regulatory T cells. The study by Yu Qi [41] showed that the enrichment of CD8+ T cells in ccRCC predicted poor survival. In addition, the presence of NK cells in RCC has been reported in several studies [42-45], and the association of NK cell infiltration with patient survival suggested that they may represent a vital component of the antitumor response [46,47], which is consistent with our findings [48]. Significant negative correlations were discovered in our study between m6A score and TMB. Several studies also came to the same conclusion about the correlation between ccRCC and TMB [49-52]. Although TMB is regarded as a better antitumor effect and prognosis in cancers [53], this phenomenon was not apparent in ccRCC. It might be attributed to the distinctive immunophenotype and TME infiltration of ccRCC. Further validation and exploration are also required to clarify the mechanism between TMB and ccRCC. The role of immune checkpoints such as PD-1 and CTLA-4 in tumor treatment has received widespread attention, for example, cancer immunotherapy targeting the PD-1/PD-L1 has great efficacy in many diseases [54,55], especially ccRCC [56]. We finally explored the correlation of PD-L1 and CTLA-4 with m6A score and confirmed a significant expression difference between the two checkpoints among distinct m6A score groups.
There are some limitations in this research. First, TCGA and GEO datasets originated from European and American populations and lacked clinical data from ccRCC patients in other regions. Therefore, further validation of the expanded population was needed. Furthermore, our study did not perform functional experiments in vitro or in vivo, and relevant studies were required to clarify their precise mechanism of action in the future. Therefore, our research showed that m6A modification might be a critical factor in mediating the clinical response to immunotherapy. In addition, we also proved that m6A score could predict the patient’s response to immunotherapy.
In conclusion, the m6A score can be applied to evaluate m6A patterns and further determine the immunophenotype of tumors to guide more effective immunotherapy. Similarly, m6A score is a reliable marker to predict the prognosis. This research can contribute to developing new immunotherapeutic agents by m6A score.
Conclusions
Our work confirmed the broad regulatory mechanism of the ccRCC TME by m6A methylation modification. The difference in the pattern of m6A modification was a non-negligible factor leading to the heterogeneity of a single tumor microenvironment. Exploring m6A modification modes will help recognize the leading role of the tumor microenvironment and immune infiltration and help develop individualized treatment methods for patients.
Acknowledgements
This study was supported by the Natural Science Foundation of Fujian Province [Grant number 2020J011220 and 2020J011236], the Key Medical and Health Projects in Xiamen (Grant number 3502Z20209002) and the National Natural Science Foundation of China [Grant number 81772893]. The authors declare no conflicts of interests.
Disclosure of conflict of interest
None.
Abbreviations
- m6A
RNA N6-methyladenosine
- ccRCC
clear cell renal cell carcinoma
- TME
tumor microenvironment
- IC
immune cell
- NMF
Nonnegative Matrix Factorization
- TCGA
the Cancer Genome Atlas
- GEO
Gene-Expression Omnibus
- ssGSEA
single-sample gene-set enrichment analysis
- TMB
tumor mutation burden
- PD-L1
programmed cell death protein 1
- CTLA-4
cytotoxic T lymphocyte antigen 4
- GSVA
Gene set variation analysis
- DEG
differentially expressed gene
- PCA
Principal component analysis
- IPS
Immunophenoscore
- CNV
copy number variation
- GO
Gene Ontology
- KEGG
Kyoto Encyclopedia of Genes and Genomes
- YTHDC2
YTH domain containing 2
- DC
dendritic cell
Supporting Information
References
- 1.Jonasch E, Walker CL, Rathmell WK. Clear cell renal cell carcinoma ontogeny and mechanisms of lethality. Nat Rev Nephrol. 2021;17:245–261. doi: 10.1038/s41581-020-00359-2. [DOI] [PMC free article] [PubMed] [Google Scholar]
- 2.Williamson SR. Clear cell papillary renal cell carcinoma: an update after 15 years. Pathology. 2021;53:109–119. doi: 10.1016/j.pathol.2020.10.002. [DOI] [PubMed] [Google Scholar]
- 3.Wettersten HI, Aboud OA, Lara PN Jr, Weiss RH. Metabolic reprogramming in clear cell renal cell carcinoma. Nat Rev Nephrol. 2017;13:410–419. doi: 10.1038/nrneph.2017.59. [DOI] [PubMed] [Google Scholar]
- 4.Siegel RL, Miller KD, Jemal A. Cancer statistics, 2020. CA Cancer J Clin. 2020;70:7–30. doi: 10.3322/caac.21590. [DOI] [PubMed] [Google Scholar]
- 5.Jonasch E, Gao J, Rathmell WK. Renal cell carcinoma. BMJ. 2014;349:g4797. doi: 10.1136/bmj.g4797. [DOI] [PMC free article] [PubMed] [Google Scholar]
- 6.Chevrier S, Levine JH, Zanotelli VRT, Silina K, Schulz D, Bacac M, Ries CH, Ailles L, Jewett MAS, Moch H, van den Broek M, Beisel C, Stadler MB, Gedye C, Reis B, Pe’er D, Bodenmiller B. An Immune atlas of clear cell renal cell carcinoma. Cell. 2017;169:736–749. e18. doi: 10.1016/j.cell.2017.04.016. [DOI] [PMC free article] [PubMed] [Google Scholar]
- 7.He LE, Li HY, Wu AQ, Peng YL, Shu G, Yin G. Functions of N6-methyladenosine and its role in cancer. Mol Cancer. 2019;18:176. doi: 10.1186/s12943-019-1109-9. [DOI] [PMC free article] [PubMed] [Google Scholar]
- 8.Bokar JA, Rath-Shambaugh ME, Ludwiczak R, Narayan P, Rottman F. Characterization and partial purification of mRNA N6-adenosine methyltransferase from HeLa cell nuclei. Internal mRNA methylation requires a multisubunit complex. J Biol Chem. 1994;269:17697–17704. [PubMed] [Google Scholar]
- 9.Liu Q, Gregory RI. RNAmod: an integrated system for the annotation of mRNA modifications. Nucleic Acids Res. 2019;47:W548–W555. doi: 10.1093/nar/gkz479. [DOI] [PMC free article] [PubMed] [Google Scholar]
- 10.Liu N, Zhou KI, Parisien M, Dai Q, Diatchenko L, Pan T. N6-methyladenosine alters RNA structure to regulate binding of a low-complexity protein. Nucleic Acids Res. 2017;45:6051–6063. doi: 10.1093/nar/gkx141. [DOI] [PMC free article] [PubMed] [Google Scholar]
- 11.Chong W, Shang L, Liu J, Fang Z, Du FY, Wu H, Liu Y, Wang Z, Chen Y, Jia ST, Chen LM, Li LP, Chen H. m(6)A regulator-based methylation modification patterns characterized by distinct tumor microenvironment immune profiles in colon cancer. Theranostics. 2021;11:2201–2217. doi: 10.7150/thno.52717. [DOI] [PMC free article] [PubMed] [Google Scholar]
- 12.Sun MY, Xie M, Zhang TY, Wang YJ, Huang WJ, Xia LM. m(6)A methylation modification patterns and tumor microenvironment infiltration characterization in pancreatic cancer. Front Immunol. 2021;12:739768. doi: 10.3389/fimmu.2021.739768. [DOI] [PMC free article] [PubMed] [Google Scholar]
- 13.Zhang B, Wu Q, Li B, Wang DF, Wang L, Zhou YL. m(6)A regulator-mediated methylation modification patterns and tumor microenvironment infiltration characterization in gastric cancer. Mol Cancer. 2020;19:53. doi: 10.1186/s12943-020-01170-0. [DOI] [PMC free article] [PubMed] [Google Scholar]
- 14.Wang TY, Kong S, Tao M, Ju SQ. The potential role of RNA N6-methyladenosine in Cancer progression. Mol Cancer. 2020;19:88. doi: 10.1186/s12943-020-01204-7. [DOI] [PMC free article] [PubMed] [Google Scholar]
- 15.Xu SC, Tang L, Dai G, Luo CK, Liu ZX. Expression of m6A regulators correlated with immune microenvironment predicts therapeutic efficacy and prognosis in gliomas. Front Cell Dev Biol. 2020;8:594112. doi: 10.3389/fcell.2020.594112. [DOI] [PMC free article] [PubMed] [Google Scholar]
- 16.Wang LL, Hui H, Agrawal K, Kang YQ, Li N, Tang R, Yuan JJ, Rana TM. m(6)A RNA methyltransferases METTL3/14 regulate immune responses to anti-PD-1 therapy. EMBO J. 2020;39:e104514. doi: 10.15252/embj.2020104514. [DOI] [PMC free article] [PubMed] [Google Scholar]
- 17.Chang GQ, Shi L, Ye YQ, Shi HL, Zeng LX, Tiwary S, Huse JT, Huo L, Ma L, Ma YJ, Zhang SC, Zhu JW, Xie V, Li P, Han L, He C, Huang SY. YTHDF3 induces the translation of m(6)A-enriched gene transcripts to promote breast cancer brain metastasis. Cancer Cell. 2020;38:857–871. e7. doi: 10.1016/j.ccell.2020.10.004. [DOI] [PMC free article] [PubMed] [Google Scholar]
- 18.Wilkerson MD, Hayes DN. ConsensusClusterPlus: a class discovery tool with confidence assessments and item tracking. Bioinformatics. 2010;26:1572–1573. doi: 10.1093/bioinformatics/btq170. [DOI] [PMC free article] [PubMed] [Google Scholar]
- 19.Hänzelmann S, Castelo R, Guinney J. GSVA: gene set variation analysis for microarray and RNA-seq data. BMC Bioinformatics. 2013;14:7. doi: 10.1186/1471-2105-14-7. [DOI] [PMC free article] [PubMed] [Google Scholar]
- 20.Charoentong P, Finotello F, Angelova M, Mayer C, Efremova M, Rieder D, Hackl H, Trajanoski Z. Pan-cancer immunogenomic analyses reveal genotype-immunophenotype relationships and predictors of response to checkpoint blockade. Cell Rep. 2017;18:248–262. doi: 10.1016/j.celrep.2016.12.019. [DOI] [PubMed] [Google Scholar]
- 21.Ritchie ME, Phipson B, Wu D, Hu YF, Law CW, Shi W, Smyth GK. limma powers differential expression analyses for RNA-sequencing and microarray studies. Nucleic Acids Res. 2015;43:e47. doi: 10.1093/nar/gkv007. [DOI] [PMC free article] [PubMed] [Google Scholar]
- 22.Sotiriou C, Wirapati P, Loi S, Harris A, Fox S, Smeds J, Nordgren H, Farmer P, Praz V, Haibe-Kains B, Desmedt C, Larsimont D, Cardoso F, Peterse H, Nuyten D, Buyse M, Van de Vijver MJ, Bergh J, Piccart M, Delorenzi M. Gene expression profiling in breast cancer: understanding the molecular basis of histologic grade to improve prognosis. J Natl Cancer Inst. 2006;98:262–272. doi: 10.1093/jnci/djj052. [DOI] [PubMed] [Google Scholar]
- 23.Zeng DQ, Li MY, Zhou R, Zhang JW, Sun HY, Shi M, Bin JP, Liao YL, Rao JJ, Liao WJ. Tumor microenvironment characterization in gastric cancer identifies prognostic and immunotherapeutically relevant gene signatures. Cancer Immunol Res. 2019;7:737–750. doi: 10.1158/2326-6066.CIR-18-0436. [DOI] [PubMed] [Google Scholar]
- 24.Hazra A, Gogtay N. Biostatistics series module 3: comparing groups: numerical variables. Indian J Dermatol. 2016;61:251–260. doi: 10.4103/0019-5154.182416. [DOI] [PMC free article] [PubMed] [Google Scholar]
- 25.Yi LL, Wu GW, Guo LH, Zou XF, Huang P. Comprehensive analysis of the PD-L1 and immune infiltrates of m(6)A RNA methylation regulators in head and neck squamous cell carcinoma. Mol Ther Nucleic Acids. 2020;21:299–314. doi: 10.1016/j.omtn.2020.06.001. [DOI] [PMC free article] [PubMed] [Google Scholar]
- 26.Gao YM, Vasic R, Song YB, Teng R, Liu CY, Gbyli R, Biancon G, Nelakanti R, Lobben K, Kudo E, Liu W, Ardasheva A, Fu XY, Wang XM, Joshi P, Lee V, Dura B, Viero G, Iwasaki A, Fan R, Xiao A, Flavell RA, Li HB, Tebaldi T, Halene S. m(6)A modification prevents formation of endogenous double-stranded RNAs and deleterious innate immune responses during hematopoietic development. Immunity. 2020;52:1007–1021. e8. doi: 10.1016/j.immuni.2020.05.003. [DOI] [PMC free article] [PubMed] [Google Scholar]
- 27.Chen Y, Lin Y, Shu YQ, He J, Gao W. Interaction between N(6)-methyladenosine (m(6)A) modification and noncoding RNAs in cancer. Mol Cancer. 2020;19:94. doi: 10.1186/s12943-020-01207-4. [DOI] [PMC free article] [PubMed] [Google Scholar]
- 28.Zhang CZ, Huang SZ, Zhuang HK, Ruan SY, Zhou ZX, Huang KJ, Ji F, Ma ZY, Hou BH, He XS. YTHDF2 promotes the liver cancer stem cell phenotype and cancer metastasis by regulating OCT4 expression via m6A RNA methylation. Oncogene. 2020;39:4507–4518. doi: 10.1038/s41388-020-1303-7. [DOI] [PubMed] [Google Scholar]
- 29.Müller S, Glaß M, Singh AK, Haase J, Bley N, Fuchs T, Lederer M, Dahl A, Huang HL, Chen JJ, Posern G, Hüttelmaier S. IGF2BP1 promotes SRF-dependent transcription in cancer in a m6A- and miRNA-dependent manner. Nucleic Acids Res. 2019;47:375–390. doi: 10.1093/nar/gky1012. [DOI] [PMC free article] [PubMed] [Google Scholar]
- 30.von Hagen F, Gundert L, Strick A, Klümper N, Schmidt D, Kristiansen G, Tolkach Y, Toma M, Ritter M, Ellinger J. N(6)-methyladenosine (m(6)A) readers are dysregulated in renal cell carcinoma. Mol Carcinog. 2021;60:354–362. doi: 10.1002/mc.23297. [DOI] [PubMed] [Google Scholar]
- 31.Xiao YR, Thakkar KN, Zhao HJ, Broughton J, Li Y, Seoane JA, Diep AN, Metzner TJ, von Eyben R, Dill DL, Brooks JD, Curtis C, Leppert JT, Ye JB, Peehl DM, Giaccia AJ, Sinha S, Rankin EB. The m(6)A RNA demethylase FTO is a HIF-independent synthetic lethal partner with the VHL tumor suppressor. Proc Natl Acad Sci U S A. 2020;117:21441–21449. doi: 10.1073/pnas.2000516117. [DOI] [PMC free article] [PubMed] [Google Scholar]
- 32.Kwok CT, Marshall AD, Rasko JE, Wong JJ. Genetic alterations of m(6)A regulators predict poorer survival in acute myeloid leukemia. J Hematol Oncol. 2017;10:39. doi: 10.1186/s13045-017-0410-6. [DOI] [PMC free article] [PubMed] [Google Scholar]
- 33.Li K, Luo HQ, Luo H, Zhu X. Clinical and prognostic pan-cancer analysis of m6A RNA methylation regulators in four types of endocrine system tumors. Aging (Albany NY) 2020;12:23931–23944. doi: 10.18632/aging.104064. [DOI] [PMC free article] [PubMed] [Google Scholar]
- 34.Li YS, Xiao J, Bai J, Tian Y, Qu YW, Chen X, Wang Q, Li XH, Zhang YP, Xu J. Molecular characterization and clinical relevance of m(6)A regulators across 33 cancer types. Mol Cancer. 2019;18:137. doi: 10.1186/s12943-019-1066-3. [DOI] [PMC free article] [PubMed] [Google Scholar]
- 35.Wang J, Tan LR, Jia BB, Yu XF, Yao RX, OUYang N, Yu XT, Cao XY, Tong J, Chen T, Chen R, Li JX. Downregulation of m(6)A reader YTHDC2 promotes the proliferation and migration of malignant lung cells via CYLD/NF-κB pathway. Int J Biol Sci. 2021;17:2633–2651. doi: 10.7150/ijbs.58514. [DOI] [PMC free article] [PubMed] [Google Scholar]
- 36.Chen MN, Wei L, Law CT, Tsang FH, Shen JL, Cheng CL, Tsang LH, Ho DW, Chiu DK, Lee JM, Wong CC, Ng IO, Wong CM. RNA N6-methyladenosine methyltransferase-like 3 promotes liver cancer progression through YTHDF2-dependent posttranscriptional silencing of SOCS2. Hepatology. 2018;67:2254–2270. doi: 10.1002/hep.29683. [DOI] [PubMed] [Google Scholar]
- 37.Karikó K, Buckstein M, Ni HP, Weissman D. Suppression of RNA recognition by toll-like receptors: the impact of nucleoside modification and the evolutionary origin of RNA. Immunity. 2005;23:165–175. doi: 10.1016/j.immuni.2005.06.008. [DOI] [PubMed] [Google Scholar]
- 38.Han DL, Liu J, Chen CY, Dong LH, Liu Y, Chang RB, Huang XN, Liu YY, Wang JY, Dougherty U, Bissonnette MB, Shen B, Weichselbaum RR, Xu MM, He C. Anti-tumour immunity controlled through mRNA m(6)A methylation and YTHDF1 in dendritic cells. Nature. 2019;566:270–274. doi: 10.1038/s41586-019-0916-x. [DOI] [PMC free article] [PubMed] [Google Scholar]
- 39.Tong JY, Cao GC, Zhang T, Sefik E, Amezcua Vesely MC, Broughton JP, Zhu S, Li HB, Li B, Chen L, Chang HY, Su B, Flavell RA, Li HB. m(6)A mRNA methylation sustains Treg suppressive functions. Cell Res. 2018;28:253–256. doi: 10.1038/cr.2018.7. [DOI] [PMC free article] [PubMed] [Google Scholar]
- 40.Zheng Z, Zhang LD, Cui XL, Yu XB, Hsu PJ, Lyu R, Tan HY, Mandal M, Zhang M, Sun HL, Sanchez Castillo A, Peng JM, Clark MR, He C, Huang HC. Control of early B cell development by the RNA N(6)-methyladenosine methylation. Cell Rep. 2020;31:107819. doi: 10.1016/j.celrep.2020.107819. [DOI] [PMC free article] [PubMed] [Google Scholar]
- 41.Qi Y, Xia Y, Lin ZY, Qu Y, Qi YY, Chen YF, Zhou Q, Zeng H, Wang JJ, Chang Y, Bai Q, Wang YW, Zhu Y, Xu L, Chen LL, Kong YY, Zhang WJ, Dai B, Liu L, Guo JM, Xu JJ. Tumor-infiltrating CD39(+)CD8(+) T cells determine poor prognosis and immune evasion in clear cell renal cell carcinoma patients. Cancer Immunol Immunother. 2020;69:1565–1576. doi: 10.1007/s00262-020-02563-2. [DOI] [PMC free article] [PubMed] [Google Scholar]
- 42.Schleypen JS, Von Geldern M, Weiss EH, Kotzias N, Rohrmann K, Schendel DJ, Falk CS, Pohla H. Renal cell carcinoma-infiltrating natural killer cells express differential repertoires of activating and inhibitory receptors and are inhibited by specific HLA class I allotypes. Int J Cancer. 2003;106:905–912. doi: 10.1002/ijc.11321. [DOI] [PubMed] [Google Scholar]
- 43.Schleypen JS, Baur N, Kammerer R, Nelson PJ, Rohrmann K, Gröne EF, Hohenfellner M, Haferkamp A, Pohla H, Schendel DJ, Falk CS, Noessner E. Cytotoxic markers and frequency predict functional capacity of natural killer cells infiltrating renal cell carcinoma. Clin Cancer Res. 2006;12:718–725. doi: 10.1158/1078-0432.CCR-05-0857. [DOI] [PubMed] [Google Scholar]
- 44.Prinz PU, Mendler AN, Brech D, Masouris I, Oberneder R, Noessner E. NK-cell dysfunction in human renal carcinoma reveals diacylglycerol kinase as key regulator and target for therapeutic intervention. Int J Cancer. 2014;135:1832–1841. doi: 10.1002/ijc.28837. [DOI] [PubMed] [Google Scholar]
- 45.Murphy KA, James BR, Guan Y, Torry DS, Wilber A, Griffith TS. Exploiting natural anti-tumor immunity for metastatic renal cell carcinoma. Hum Vaccin Immunother. 2015;11:1612–1620. doi: 10.1080/21645515.2015.1035849. [DOI] [PMC free article] [PubMed] [Google Scholar]
- 46.Cózar JM, Canton J, Tallada M, Concha A, Cabrera T, Garrido F, Ruiz-Cabello Osuna F. Analysis of NK cells and chemokine receptors in tumor infiltrating CD4 T lymphocytes in human renal carcinomas. Cancer Immunol Immunother. 2005;54:858–866. doi: 10.1007/s00262-004-0646-1. [DOI] [PMC free article] [PubMed] [Google Scholar]
- 47.Donskov F, von der Maase H. Impact of immune parameters on long-term survival in metastatic renal cell carcinoma. J. Clin. Oncol. 2006;24:1997–2005. doi: 10.1200/JCO.2005.03.9594. [DOI] [PubMed] [Google Scholar]
- 48.Eckl J, Buchner A, Prinz PU, Riesenberg R, Siegert SI, Kammerer R, Nelson PJ, Noessner E. Transcript signature predicts tissue NK cell content and defines renal cell carcinoma subgroups independent of TNM staging. J Mol Med (Berl) 2012;90:55–66. doi: 10.1007/s00109-011-0806-7. [DOI] [PubMed] [Google Scholar]
- 49.Borcherding N, Vishwakarma A, Voigt AP, Bellizzi A, Kaplan J, Nepple K, Salem AK, Jenkins RW, Zakharia Y, Zhang W. Mapping the immune environment in clear cell renal carcinoma by single-cell genomics. Commun Biol. 2021;4:122. doi: 10.1038/s42003-020-01625-6. [DOI] [PMC free article] [PubMed] [Google Scholar]
- 50.Zhang CJ, He HC, Hu X, Liu A, Huang D, Xu Y, Chen L, Xu DF. Development and validation of a metastasis-associated prognostic signature based on single-cell RNA-seq in clear cell renal cell carcinoma. Aging (Albany NY) 2019;11:10183–10202. doi: 10.18632/aging.102434. [DOI] [PMC free article] [PubMed] [Google Scholar]
- 51.Zhang CJ, Li ZT, Qi F, Hu X, Luo J. Exploration of the relationships between tumor mutation burden with immune infiltrates in clear cell renal cell carcinoma. Ann Transl Med. 2019;7:648. doi: 10.21037/atm.2019.10.84. [DOI] [PMC free article] [PubMed] [Google Scholar]
- 52.Zhang L, Zhang MZ, Wang L, Li JL, Yang T, Shao QY, Liang X, Ma MH, Zhang N, Jing MX, Song RD, Fan JH. Identification of CCL4 as an immune-related prognostic biomarker associated with tumor proliferation and the tumor microenvironment in clear cell renal cell carcinoma. Front Oncol. 2021;11:694664. doi: 10.3389/fonc.2021.694664. [DOI] [PMC free article] [PubMed] [Google Scholar]
- 53.Ai LY, Xu AT, Xu J. Roles of PD-1/PD-L1 pathway: signaling, cancer, and beyond. Adv Exp Med Biol. 2020;1248:33–59. doi: 10.1007/978-981-15-3266-5_3. [DOI] [PubMed] [Google Scholar]
- 54.Brahmer J, Reckamp KL, Baas P, Crinò L, Eberhardt WE, Poddubskaya E, Antonia S, Pluzanski A, Vokes EE, Holgado E, Waterhouse D, Ready N, Gainor J, Arén Frontera O, Havel L, Steins M, Garassino MC, Aerts JG, Domine M, Paz-Ares L, Reck M, Baudelet C, Harbison CT, Lestini B, Spigel DR. Nivolumab versus docetaxel in advanced squamous-cell non-small-cell lung cancer. N Engl J Med. 2015;373:123–135. doi: 10.1056/NEJMoa1504627. [DOI] [PMC free article] [PubMed] [Google Scholar]
- 55.Ferris RL, Blumenschein G Jr, Fayette J, Guigay J, Colevas AD, Licitra L, Harrington K, Kasper S, Vokes EE, Even C, Worden F, Saba NF, Iglesias Docampo LC, Haddad R, Rordorf T, Kiyota N, Tahara M, Monga M, Lynch M, Geese WJ, Kopit J, Shaw JW, Gillison ML. Nivolumab for recurrent squamous-cell carcinoma of the head and neck. N Engl J Med. 2016;375:1856–1867. doi: 10.1056/NEJMoa1602252. [DOI] [PMC free article] [PubMed] [Google Scholar]
- 56.Motzer RJ, Escudier B, McDermott DF, George S, Hammers HJ, Srinivas S, Tykodi SS, Sosman JA, Procopio G, Plimack ER, Castellano D, Choueiri TK, Gurney H, Donskov F, Bono P, Wagstaff J, Gauler TC, Ueda T, Tomita Y, Schutz FA, Kollmannsberger C, Larkin J, Ravaud A, Simon JS, Xu LA, Waxman IM, Sharma P CheckMate 025 Investigators. Nivolumab versus everolimus in advanced renal-cell carcinoma. N Engl J Med. 2015;373:1803–1813. doi: 10.1056/NEJMoa1510665. [DOI] [PMC free article] [PubMed] [Google Scholar]
Associated Data
This section collects any data citations, data availability statements, or supplementary materials included in this article.