Abstract
Purpose
To evaluate glioblastoma (GBM) metabolism by using hyperpolarized carbon 13 (13C) MRI to monitor the exchange of the hyperpolarized 13C label between injected [1-13C]pyruvate and tumor lactate and bicarbonate.
Materials and Methods
In this prospective study, seven treatment-naive patients (age [mean ± SD], 60 years ± 11; five men) with GBM were imaged at 3 T by using a dual-tuned 13C–hydrogen 1 head coil. Hyperpolarized [1-13C]pyruvate was injected, and signal was acquired by using a dynamic MRI spiral sequence. Metabolism was assessed within the tumor, in the normal-appearing brain parenchyma (NABP), and in healthy volunteers by using paired or unpaired t tests and a Wilcoxon signed rank test. The Spearman ρ correlation coefficient was used to correlate metabolite labeling with lactate dehydrogenase A (LDH-A) expression and some immunohistochemical markers. The Benjamini-Hochberg procedure was used to correct for multiple comparisons.
Results
The bicarbonate-to-pyruvate (BP) ratio was lower in the tumor than in the contralateral NABP (P < .01). The tumor lactate-to-pyruvate (LP) ratio was not different from that in the NABP (P = .38). The LP and BP ratios in the NABP were higher than those observed previously in healthy volunteers (P < .05). Tumor lactate and bicarbonate signal intensities were strongly correlated with the pyruvate signal intensity (ρ = 0.92, P < .001, and ρ = 0.66, P < .001, respectively), and the LP ratio was weakly correlated with LDH-A expression in biopsy samples (ρ = 0.43, P = .04).
Conclusion
Hyperpolarized 13C MRI demonstrated variation in lactate labeling in GBM, both within and between tumors. In contrast, bicarbonate labeling was consistently lower in tumors than in the surrounding NABP.
Keywords: Hyperpolarized 13C MRI, Glioblastoma, Metabolism, Cancer, MRI, Neuro-oncology
Supplemental material is available for this article.
Published under a CC BY 4.0 license.
Keywords: Hyperpolarized 13C MRI, Glioblastoma, Metabolism, Cancer, MRI, Neuro-oncology
Summary
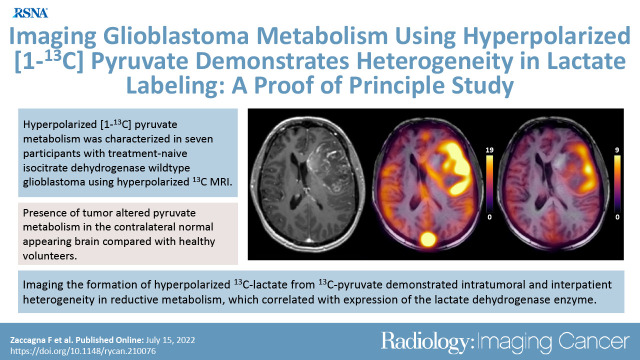
Carbon 13 (13C) MRI following injection of hyperpolarized 13C-labeled pyruvate can be used to characterize glioblastoma metabolism and changes in the surrounding brain parenchyma, and this tumor metabolism may be correlated with metabolic gene expression.
Key Points
■ Imaging the formation of hyperpolarized carbon 13 (13C)-lactate from 13C-pyruvate demonstrated intratumoral and interpatient heterogeneity in reductive metabolism, and the lactate-to-pyruvate (LP) ratio correlated with expression of the enzyme lactate dehydrogenase A (P = .04).
■ The hyperpolarized 13C-bicarbonate signal intensity was consistently reduced in glioblastoma (GBM) compared with in the contralateral brain (bicarbonate-to-pyruvate [BP] ratio, 0.06 ± 0.03 vs 0.10 ± 0.03, P = .002), consistent with a reduction in oxidative metabolism.
■ The presence of tumor altered pyruvate metabolism in the contralateral normal-appearing brain parenchyma of patients with GBM, compared with healthy volunteers (participants vs volunteers: LP ratio, 0.33 ± 0.06 vs 0.23 ± 0.07, P = .009; BP ratio, 0.10 ± 0.03 vs 0.07 ± 0.04, P = .047).
Introduction
Glioblastoma (GBM) is the most common and aggressive primary malignant brain tumor in adults, with a median survival of only 12–15 months despite aggressive therapy (1). This poor prognosis is partly due to its characteristic heterogeneity, which can be demonstrated morphologically and functionally by using conventional MRI. This heterogeneity also exists on a metabolic level, which results from a complex interplay between genomic and microenvironmental changes leading to metabolic reprogramming (2). This metabolic reprogramming may influence whether a GBM is predisposed toward infiltration or proliferation and to therapy resistance; highly proliferative cells downregulate glycolysis and upregulate the pentose phosphate pathway (3–5), and glioma stem cells are less glycolytic than differentiated cells, which may relate to radiation therapy resistance (6). Moreover, cellular and molecular heterogeneity (7) makes accurate phenotyping of patients difficult because of biopsy sampling error and is a key factor in therapeutic failure (8). Therefore, metabolic reprogramming of GBM represents an important target for novel therapeutic strategies (1,3), and noninvasive methods for imaging GBM metabolism could help to better characterize tumors and their early response to treatment (3,9).
MR spectroscopic imaging of hyperpolarized carbon 13 (13C)–labeled metabolites (hyperpolarized 13C MRI) is an emerging clinical tool for noninvasive assessment of metabolism in vivo (10). Metabolism of pyruvate, the product of glycolysis, has been widely studied by using this technique. Pyruvate lies at a metabolic crossroads, between conversion to lactate in the reaction catalyzed by cytosolic lactate dehydrogenase (LDH), and entry into the mitochondrial tricarboxylic acid cycle in the reaction catalyzed by pyruvate dehydrogenase (Fig E1 [supplement]). Pyruvate dehydrogenase transfers the pyruvate 13C label to carbon dioxide, which is in near equilibrium with bicarbonate, and the latter is detected because of its greater abundance at physiologic pH (10,11). Preclinical studies have shown increased lactate labeling in orthotopic GBM models and have demonstrated changes in lactate labeling following therapy (12–16). A study of orthotopically implanted, patient-derived xenograft models of GBM demonstrated a high degree of variability in lactate labeling between tumors, which could be explained by differences in the levels of the transcription factor c-Myc driving LDH-A expression and glycolytic activity (17). In humans, intravenous hyperpolarized [1-13C]pyruvate has been shown to result in both lactate and bicarbonate labeling in the healthy human brain, allowing assessment of both glycolytic metabolism in the cytosol and oxidative metabolism in the mitochondria (18). Previous clinical studies using 13C MRI with hyperpolarized [1-13C]pyruvate have demonstrated the feasibility of imaging GBM metabolism in patients across a spectrum of clinical presentations, all performed following some form of treatment (19–23). Moreover, a correlation between gene expression and lactate labeling has not been demonstrated previously (19–25). In this exploratory study, we have characterized hyperpolarized [1-13C]pyruvate metabolism in participants with treatment-naive isocitrate dehydrogenase wild-type GBM by using hyperpolarized 13C MRI. The metabolic images were compared with conventional contrast agent–enhanced proton MR images.
Materials and Methods
Participant Selection, Enrollment, and Clinical Monitoring
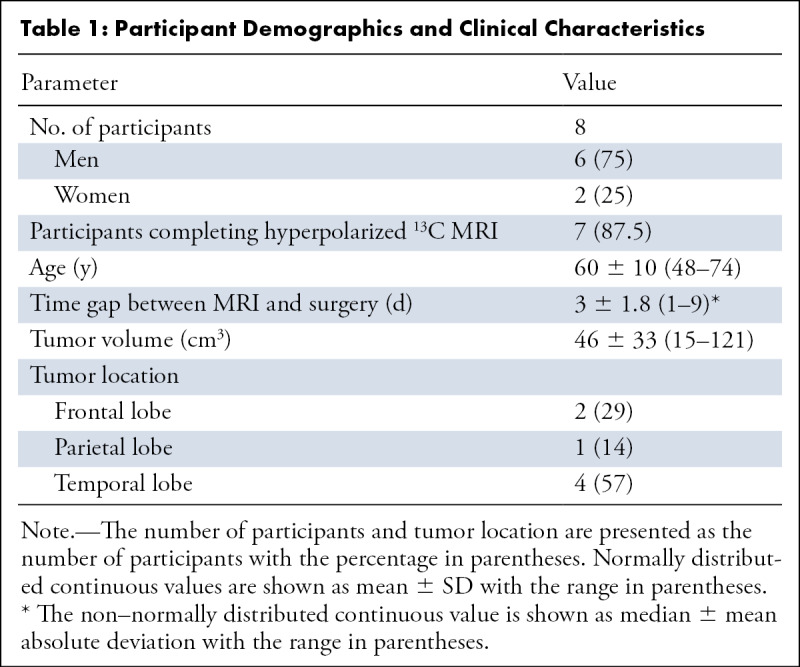
This prospective study was approved by a regional research ethics committee (reference 16/EE/0184). Between November 2016 and October 2018, eight consecutive treatment-naive participants (six men, two women; age [mean ± SD], 60 years ± 11; Table 1, Fig E2 [supplement]) with a presumed diagnosis of GBM scheduled for image-guided resection at our institution were imaged by using hyperpolarized 13C MRI after providing written informed consent. Exclusion criteria were clinical or imaging features that would suggest a secondary lesion, general contraindications for MRI, and age younger than 18 years. Seven participants were imaged successfully and included in this study. Imaging of one participant was abandoned because of failure of the acquisition protocol. Participant data were compared with previously published data from four healthy volunteers (18), the details of which are provided in Appendix E1 (supplement).
Table 1:
Participant Demographics and Clinical Characteristics
Pyruvate Preparation and Hyperpolarization
Hyperpolarized [1-13C]pyruvic acid was prepared, and quality control checks were performed, as described in Appendix E1 (supplement). A volume of 0.4 mL/kg of approximately 250 mM hyperpolarized [1-13C]pyruvate was injected at 5 mL/sec by using an automatic MRI injection system (Spectris Solaris; MEDRAD), followed by 25 mL of a saline flush.
Hydrogen 1 MRI and Hyperpolarized 13C MRI Acquisitions
MRI examinations were performed with a 3-T clinical imager (Discovery MR750; GE Healthcare) by using a dual-tuned 13C–hydrogen 1 (1H) quadrature transmit-receive head coil (Rapid Biomedical) and a 12-channel 1H head coil (GE Healthcare). The homogeneous coil sensitivity profile across the field of view allowed accurate quantification of brain metabolism and comparison between participants (18).
The hyperpolarized 13C MRI acquisition was obtained by using a dynamic, iterative decomposition with echo asymmetry and least-squares estimation spiral chemical shift imaging sequence: field of view, 240 × 240 mm; repetition time, 500 msec; echo time, 1.4 msec; flip angle, 15°; acquisition matrix, 40 × 40; reconstruction matrix, 128 × 128 (Fig E3 [supplement]); section thickness, 30 mm (26). Images were acquired every 4 seconds for a total of 60 seconds. Details of the 1H MRI acquisition are provided in Appendix E1 (supplement).
Image Processing and Analysis
Image processing was performed in MATLAB (MATLAB 2017a, MathWorks) to provide the sum of the metabolite signals over the time course, to estimate the noise-corrected signal ratio maps (lactate-to-pyruvate [LP], bicarbonate-to-pyruvate [BP], and bicarbonate-to-lactate ratios), and to determine the apparent rate constant describing the exchange of label between pyruvate and lactate (k PL) and the apparent first-order rate constant describing conversion of pyruvate to bicarbonate (k PB), as described previously (18,27); further details are provided in Appendix E1 (supplement). Mean values for the summed metabolites in each region of interest (ROI) were referenced to the peak pyruvate signal intensity in each participant to allow group comparisons. For the histogram analysis, the tumor pyruvate, lactate, and bicarbonate signal intensities were normalized to the mean of the contralateral normal-appearing brain parenchyma (NABP) on the same axial imaging section to allow a direct comparison of heterogeneity within and between lesions.
A neuroradiologist (F.Z., with 9 years of experience in neuroimaging) outlined the ROIs on the non–contrast-enhanced 1H three-dimensional T1-weighted fast spoiled gradient-echo acquisition images by using OsiriX (version.8.5.2, Pixmeo SARL). The images were acquired with the dual-tuned 13C-1H coil to ensure accurate co-registration with the metabolite maps. Fluid-attenuated inversion recovery images and postcontrast 1H three-dimensional T1-weighted fast spoiled gradient-echo acquisition images were also used to reference these ROIs. Further details are provided in Appendix E1 (supplement). ROIs were positioned to exclude major vessels, where possible, to reduce bias in the analysis. Metabolism in the NABP was assessed in two ways: in the entire hemispheres (excluding the tumor on the ipsilateral side, with a margin to avoid the peritumoral fluid-attenuated inversion recovery hyperintensity) and in an ROI in the contralateral hemisphere that was the mirror image of the tumor ROI in the ipsilateral hemisphere.
Histopathologic, Immunohistochemical, and Western Blot Analyses
Imaging was compared with immunohistochemical (IHC) and Western blot data obtained from multiregional biopsy samples. Multiple biopsy samples obtained from each patient were targeted to regions of high and low metabolism on the hyperpolarized 13C MR images (average of 5.7 ± 1.9 per patient; range, 2–8). Regions with high or low lactate labeling were labeled with 1-cm2 circular ROIs on the three-dimensional T1-weighted images and were targeted for biopsy. The sampling plan was discussed with the operating neurosurgeon prior to surgery, and a member of the research team was present during surgery to assist with targeted sampling, collection, handling, and freezing of the samples. Details of IHC and Western blot analysis are provided in Appendix E1 (supplement). The LP ratio from each ROI was compared with LDH-A expression in the targeted biopsy sample from that site. The expression of carbonic anhydrase IX (CAIX) as a marker of hypoxia (28); monocarboxylate transporter 1 (MCT1), the membrane transporter responsible for pyruvate uptake; and MCT4, the membrane transporter largely responsible for lactate and ketone body export (29), were determined by using IHC analysis and were compared with the 13C imaging data.
Statistical Analysis
Statistical analysis was performed by using MATLAB (MATLAB and Machine Learning Toolbox, MATLAB 2017a; MathWorks), SPSS (version 18.0, SPSS), and RStudio (version 1.1.463 for Macintosh, RStudio), which is based on R version 3.5.1 (R Foundation for Statistical Computing platform [30]). The Shapiro-Wilk test was used to test for normality. Subsequently, a log10 transformation was applied to the data that were originally considered to be normally distributed, and the normality of data distribution was confirmed by using the Shapiro-Wilk test and the Jarque-Bera normality test. Continuous data were expressed as mean ± SD (minimum − maximum) for normally distributed data and as median ± median absolute deviation (minimum − maximum) for non–normally distributed data.
The two-tailed paired t test, unpaired t test, and Wilcoxon signed rank test were used to compare the metabolites, ratios, and exchange rate constants derived from the tumors and NABP as appropriate, depending on the distribution of the data. Paired and unpaired t tests were performed, and the t values, df, and P values are presented as follows: t[df], P. For unpaired t tests, we assumed unequal variance and applied the Welsh df modification. Correlations among metabolites, LDH-A expression, and IHC markers were determined by using the Spearman ρ correlation coefficient. For tissue samples, P values were derived by assuming independence between samples (8). Correlations between volumes and LP and BP ratios were determined by using regression analysis.
To determine the statistical significance of all the test results, a base set P value of .05 was chosen. Subsequently, significance was corrected for multiple comparisons by using the Benjamini-Hochberg procedure and computing the false discovery rate at 5%. Raw P values are shown, and significance is stated according to the Benjamini-Hochberg procedure.
Results
Quality Control Measurements
The average [1-13C]pyruvate polarization was 22% ± 4 (range, 16.3%–28.0%); the pyruvate concentration was 256 mM ±12 (232 –268 mM), and the pH was 7.7 ± 0.2 (range, 7.3–8.0). The time delay between dissolution and pyruvate injection was 59 seconds ± 4 (range, 54–65 seconds) (Table E1 [supplement]).
Tumor Metabolism Measured with Hyperpolarized 13C MRI
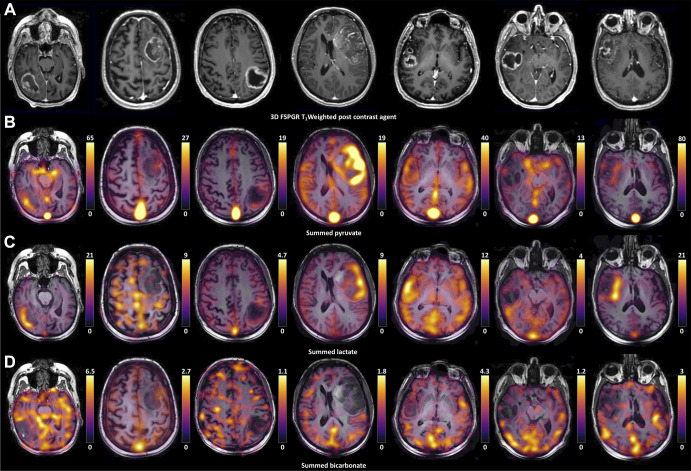
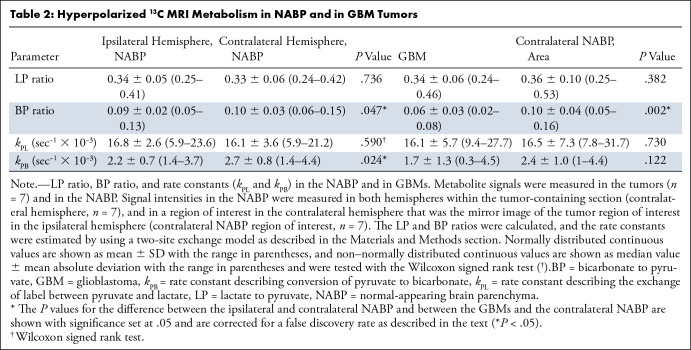
Hyperpolarized [1-13C]pyruvate, [1-13C]lactate, and [13C]bicarbonate signals were observed in all seven isocitrate dehydrogenase wild-type tumors, as well as in normal-appearing brain, following injection of hyperpolarized [1-13C]pyruvate (Fig 1). Figure 2 shows the LP and BP ratios calculated from these summed signals. The metrics derived from these data are summarized in Table 2, and data for each individual patient are shown in Table E2 (supplement).
Figure 1:
Hyperpolarized 13C MR images from all seven patients. (A) Grayscale axial contrast-enhanced 1H three-dimensional (3D) T1-weighted fast spoiled gradient-echo (FSPGR) images through the center of the lesion for each patient and the corresponding unenhanced images overlaid with the (B) pyruvate, (C) lactate, and (D) bicarbonate color maps summed over the time course.
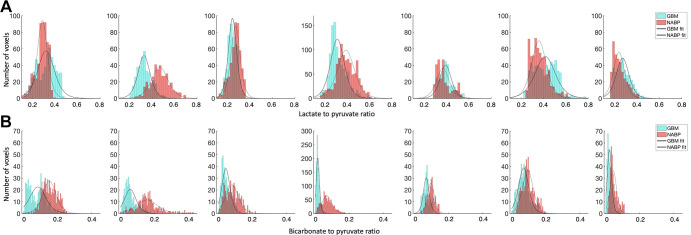
Figure 2:
Histograms of the (A) lactate-to-pyruvate and (B) bicarbonate-to-pyruvate ratios in each voxel from the section through the center of the lesion for each patient (n = 7) with an overlying polynomial fit; glioblastoma (GBM) data are shown in blue, and the normal-appearing brain parenchyma (NABP) data are shown in red.
Table 2:
Hyperpolarized 13C MRI Metabolism in NABP and in GBM Tumors
The summed pyruvate and lactate signal intensities were significantly higher in tumors than in the contralateral NABP (n = 7, t[6] = 3.6, P = .01, and t[6] = 3.3, P = .02, respectively). However, we found no evidence of differences in the median k PL (n = 7, t[6] = −0.36, P = .73) or the LP ratio (n = 7, t[6] = −0.94, P = .38) between the tumor ROIs and the contralateral NABP. The LP showed a high degree of intralesional and interpatient heterogeneity (Fig 2) and a wide variation in the LP ratio between participants with GBM. Specifically, some tumors demonstrated an LP ratio higher than that in the NABP (participants 1 and 6), whereas others showed a lower ratio. However, there was a consistent reduction in the tumor bicarbonate and BP ratio compared with those in the NABP (bicarbonate: n = 7, t[6] = −5.27, P = .002; BP ratio: n = 7, t[6] = −5.14, P = .002; Figs 2, 3).
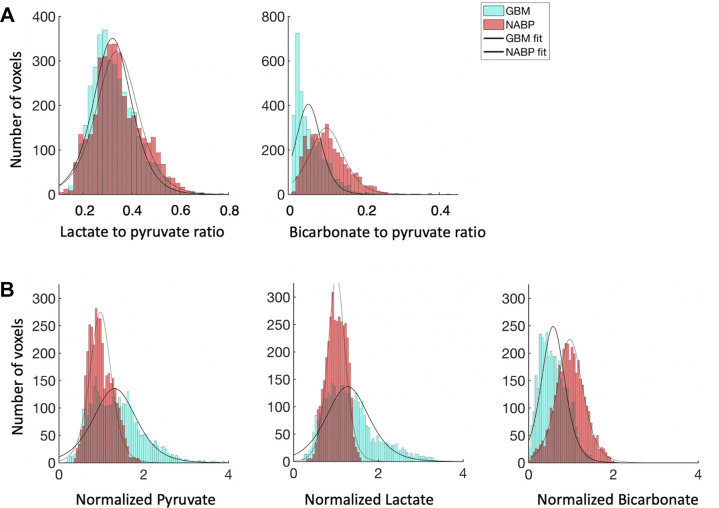
Figure 3:
Average labeled metabolite distribution for the entire patient cohort (n = 7). Histograms show the (A) average lactate-to-pyruvate and bicarbonate-to-pyruvate ratios and (B) normalized signal intensities for pyruvate, lactate, and bicarbonate with an overlying polynomial fit. Normalization was performed relative to the normal-appearing brain parenchyma (NABP). Ratios for glioblastoma (GBM) are shown in blue, and ratios for NABP are shown in red.
Analysis of the summed lactate and pyruvate signal intensities in the individual participant tumors showed a strong positive correlation (ρ = 0.92, P < .001; Fig E4 [supplement]). The same was true for bicarbonate labeling, with a positive correlation between the summed pyruvate and bicarbonate signal intensities being shown (ρ = 0.66, P < .001; Fig E4 [supplement]).
Metabolism of the NABP
The pyruvate and lactate signal intensities were higher in the ipsilateral NABP than in the NABP in the contralateral non–tumor-bearing hemisphere, although this did not reach statistical significance (n = 7, P = .26 and P = .24). There was no evidence of differences in the LP ratio (n = 7, t[6] = 0.35, P = .74) or the k PL (n = 7, P = .59) between the ipsilateral and contralateral NABP. The summed bicarbonate signal intensity (n = 7, t[6] = −2.95, P = .03), BP ratio (n = 7, t[6] = −2.49, P = .047), and k PB (n = 7, t[6] = −3.1, P = .02) were all significantly lower in the NABP in the ipsilateral hemisphere than in the NABP in the contralateral hemisphere.
In the healthy volunteers, the whole-brain average LP ratio determined from data acquired contemporaneously with the data shown here was 0.23 ± 0.07 (18), which is lower than in the GBM cohort (healthy volunteers: n = 4, participants with GBM: n = 7; P = .009). Similarly, the whole-brain average BP ratio was lower in healthy volunteers (0.07 ± 0.04) than in participants with GBM (healthy volunteers: n = 4, participants with GBM: n = 7; P = .047) (18).
1H MRI Measurements of Tumor Volume
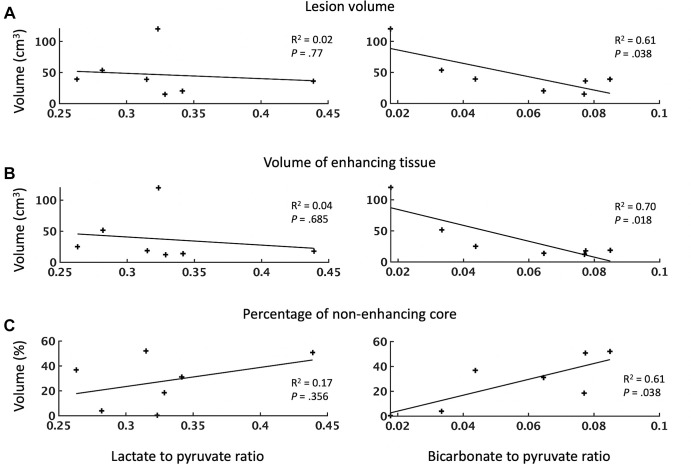
The relationship between tumor volume, as measured by contrast-enhanced 1H three-dimensional T1-weighted imaging, and the LP and BP ratios is shown in Figure 4. The average volume of the lesions was 46 cm3 ± 33 (range, 15–121 cm3) with a 28% ± 19 (range, 0.4%–52%) nonenhancing core. Regression analysis demonstrated no significant correlation between the LP ratio and the total tumor volume, enhancing volume, or percentage of nonenhancing core (n = 7; P = .77, .68, and .36, respectively). In contrast, the BP ratio showed a significant decrease with increasing lesion volume (n = 7, R2 = 0.61, P = .04) and enhancing volume (n = 7, R2 = 0.70, P = .02) and conversely increased with an increasing percentage of nonenhancing core (n = 7, R2 = 0.61, P = .04). Pyruvate and lactate demonstrated a weak negative correlation with the nonenhancing core that did not reach statistical significance (n = 7; P = .17 and P = .43, respectively).
Figure 4:
Dependence of metabolite signal ratios (lactate-to-pyruvate and bicarbonate-to-pyruvate ratios) on (A) tumor volume, (B) volume of enhancing tissue, and (C) percentage of nonenhancing tumor core. Each point represents an individual participant. The lesion volume and the volume of enhancing tissue are expressed in centimeters cubed; the nonenhancing core is expressed as a percentage of the entire lesion volume. The R2 values, representing the goodness of each fit, and the corresponding P values for each regression are given. The level of significance was set at .05.
Correlations among Tumor Lactate Labeling, LDH-A Expression, and IHC Markers
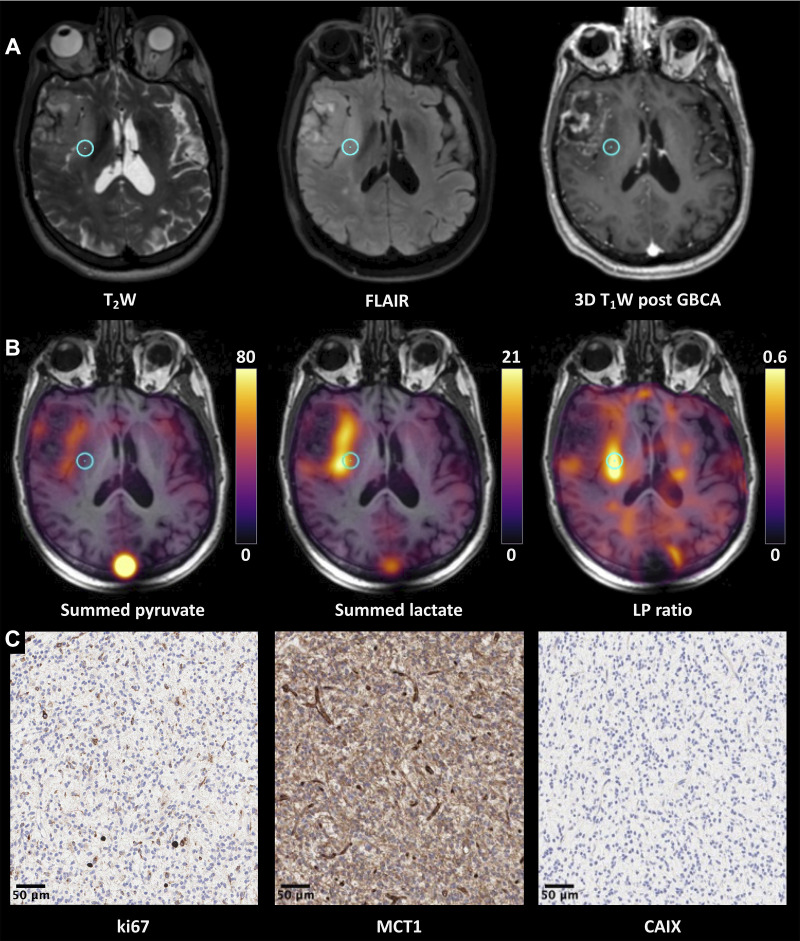
The concentration of LDH-A in tumor biopsy samples, quantified by using Western blotting, exhibited a moderate positive correlation with the local LP ratio (n = 24, ρ = 0.43, P = .04; Fig 5, Table E3 [supplement]). CAIX showed a moderate negative correlation with summed pyruvate (n = 29, ρ = −0.59, P < .001) and summed lactate (n = 29, ρ = −0.54, P < .001). We found no evidence of a correlation between MCT1 and any of the measured 13C metrics, including the sum of pyruvate, lactate, and bicarbonate signal intensities (n = 29, all P values > .11). MCT4 was positively correlated only with the BP and bicarbonate-to-lactate ratios (n = 29, ρ = 0.4, P = .03, and ρ= 0.4, P = .03, respectively). Figure 6 shows a representative example demonstrating the correlation among proton images, metabolite maps, and IHC for Ki67, MCT1, and CAIX obtained from the region highlighted in the images.
Figure 5:
Relationship between lactate dehydrogenase A (LDH-A) expression and labeling of lactate and pyruvate following injection of hyperpolarized [1-13C]pyruvate. Scatterplots show the relationship between LDH-A expression and the lactate-to-pyruvate and bicarbonate-to-pyruvate ratios. Each point represents a tissue sample. The R2 values, representing the goodness of fit, and P values for each regression are shown.
Figure 6:
(A–C) Proton images, hyperpolarized 13C MR images, and immunohistochemical (IHC) data from participant 7 (74-year-old man with glioblastoma). (A) Grayscale axial three-dimensional (3D) T2-weighted (T2W), fluid-attenuated inversion recovery (FLAIR), and gadolinium-based contrast agent (GBCA)–enhanced 3D T1-weighted (T1W) fast spoiled gradient-echo images through the center of the lesion. There is a lesion within the right anterior temporal lobe demonstrating T2-weighted and FLAIR hyperintensity involving the right insula and external capsule and reaching the lentiform nucleus. (B) The corresponding pyruvate and lactate maps summed over the entire time course and the lactate-to-pyruvate (LP) ratio map are shown in color superimposed on the T1-weighted images before contrast enhancement. The metabolic maps reveal heterogeneity, with higher pyruvate and lactate being shown in the medial aspect of the lesion; the LP ratio was particularly higher in the posterior part of insula. (C) Representative IHC imaging, shown with a 20× magnification, from the target region of interest highlighted on the 1H and 13C MR images (blue circle) stained for ki-67, monocarboxylate transporter 1 (MCT1), and carbonic anhydrase IX (CAIX). Details on IHC analysis are provided in Appendix E1 (supplement); in brief, the antibodies used for staining were: M7240 for ki-67, HPA003324 for MCT1, and NCL-L-CAIX for CAIX. Histopathologic findings demonstrated a homogeneous high-grade tumor with MIB-1 staining of approximately 8%, high MCT-1 staining, and no significant staining for CAIX.
Discussion
In this prospective study, we evaluated the hyperpolarized 13C MRI technique in participants with treatment-naive primary GBM and have correlated lactate labeling with tissue obtained at surgery. To our knowledge, large studies have not yet been performed that investigate the use of hyperpolarized 13C MRI within a similar cohort, and this small cohort therefore provides important data on changes in metabolism in GBM and the surrounding normal brain in treatment-naive patients. We found that the LP and BP signal ratios demonstrated significant intralesional and interpatient heterogeneity, although there was no evidence of a difference in the average LP ratio or k PL between tumors and the contralateral NABP. The higher pyruvate and lactate labeling in tumors compared with the contralateral NABP may reflect increased pyruvate delivery, given the strong correlation between pyruvate and lactate signal intensities, implying that lactate labeling is partly determined by pyruvate delivery. The negative correlation between pyruvate and CAIX suggests poor delivery of pyruvate in hypoxic regions of the tumor, which is also supported by the weak inverse relationship between the percentages of tumor necrosis and both pyruvate and lactate. This heterogeneity in lactate signal has also been observed in patient-derived xenograft models of GBM (17) and in the few clinical cases published to date (19,23). In contrast, the BP ratio was consistently lower in tumors than in the NABP, implying that mitochondrial metabolism is impaired.
A previous 1H MRI study of patients with GBM and healthy volunteers using chemical exchange saturation transfer measurements showed metabolic changes in the NABP contralateral to the tumor (31). Comparing the LP ratios in the NABP measured here with those reported previously by using identical methods in healthy volunteers (18), we found significantly higher LP and BP ratios in the NABP of the tumor-bearing brains. Although partial volume effects could influence the measured LP ratios of the NABP in the contralateral hemisphere, taken together with the previously published chemical exchange saturation transfer results, these data imply that the presence of GBM alters both oxidative and reductive metabolism of the whole brain. Partial volume effects cannot explain the increase in the BP ratio in the NABP compared with the healthy brain area, as inadvertent inclusion of tumor would decrease and not increase the measured ratio compared with its true value. However, these results need to be validated in larger cohorts in the future.
The exchange of hyperpolarized 13C label between the injected pyruvate and endogenous lactate pools depends on a number of factors: pyruvate delivery, expression of the pyruvate transporters (MCTs), and LDH activity, which catalyzes the exchange of 13C label between pyruvate and lactate (10). In the GBM tumors studied here, there was no correlation between the total tumor volume, enhancing volume, or nonenhancing core and the LP ratio. This is in contrast to a previous study in patients with breast cancer, in which the LP ratio was increased in larger tumors (27). In the GBM tumors studied here, there was a correlation between the LP ratio and tumor LDH-A expression but no correlation between the LP ratio and MCT1 expression. This suggests that in GBM, increased lactate labeling is driven primarily by increased pyruvate delivery and LDH-A expression. A previous study in GBM patient–derived xenograft models implanted orthotopically in the rat observed a correlation between lactate labeling and expression of c-Myc, LDH-A, hexokinase II, MCT1, and MCT4 (17).
Detecting metabolic heterogeneity has implications for treatment of patients with GBM, including tailoring therapy or the radiation therapy dose. Intratumoral variations in lactate labeling could be used to derive metabolic habitats (32) or to guide biopsies. Metabolic maps may also be useful for detecting early response to chemotherapy and radiation therapy (16). For instance, hyperpolarized 13C MRI could be used to assess changes in metabolism with isocitrate dehydrogenase inhibition, which has shown promising results in vitro and in animal models (33).
This study had several limitations. First, although our sample size is larger than has been investigated in previous studies, it remains small and warrants further work to investigate the origin of intertumoral metabolic heterogeneity. A technical limitation of this study was the relatively low spatial resolution, which prevented assessment of the peritumoral environment and comparison with conventional 1H sequences. The ability to distinguish tumor infiltration and peritumoral edema depends on the relative volume of tumor cells in each voxel compared with normal tissue, as well as the relative difference in metabolism between the two. Improvements in spatial resolution will enable evaluation of the peritumoral region in future studies. Additionally, although there was a statistically significant difference in the BP ratio between the GBMs and NABP, a further technical limitation of the study was low bicarbonate signal compared with that of pyruvate and lactate. A final limitation was the inability to compare imaging, IHC, and Western blot data in healthy tissue samples; these correlations may be explored in animal models to corroborate the findings from human imaging in the future.
In conclusion, this study showed variation in the levels of lactate labeling in GBM, both within and between tumors, whereas bicarbonate labeling was consistently lower in tumors when compared with the surrounding NABP. The differences in lactate labeling may be explained by differences in pyruvate delivery to the tumor and LDH-A expression. The LP and BP ratios in the hemisphere contralateral to the tumor were higher than in the brains of healthy volunteers, suggesting that the presence of a GBM in the brain increases both glycolytic and oxidative activity in the NABP. We have revealed insights into the effect of the tumor on normal-appearing brain metabolism. These results will have important implications for how this technique can be applied in future larger studies and has provided a biological explanation for why lactate labeling varies between and within these tumors.
Supported in part by Cancer Research UK (CRUK; C19212/A16628, C19212/A911376, C8742/A18097, C197/A16465, A25040, A29580); the Wellcome Trust; the CRUK Cambridge Centre (C9685/A25177); the Lundbeck Foundation; the CRUK and Engineering and Physical Science Research Council Cancer Imaging Centre in Cambridge and Manchester, England; the Mark Foundation for Cancer Research; Addenbrooke’s Charitable Trust; the National Institute for Health Research Cambridge Biomedical Research Centre (BRC-1215-20014); the Evelyn Trust; the Cambridge Experimental Cancer Medicine Centre; the CRUK National Cancer Imaging Translational Accelerator; the Austrian Science Fund (J4025B26); and the Cambridge University Hospitals National Health Service Foundation Trust. The views expressed are those of the author(s) and not necessarily those of the NIHR or the Department of Health and Social Care.
Disclosures of conflicts of interest: F.Z. No relevant relationships. M.A.M. No relevant relationships. J.T.G. No relevant relationships. J.K. Institution received grant from NIHR Cambridge Biomedical Research Centre; institution received grants from GlaxoSmithKline and EU Horizon 2020. R.M. No relevant relationships. F.R. No relevant relationships. R.W. Grants from CRUK Cambridge Centre (CCCIT10) and Austrian Science Fund (J-4025). A.B.G. No relevant relationships. S.D. Trainee editorial board member for Radiology: Imaging Cancer. C.J.D. No relevant relationships. S.U. Cambridge Trust, Cambridge International Scholarship (PhD funding, payments made to the researcher); trainee editorial board member for Radiology: Artificial Intelligence. R.F.S. Employed by GE Healthcare. K.A. No relevant relationships. A.C. No relevant relationships. M.C.L. Wellcome Trust grant. M.L. No relevant relationships. A.F. No relevant relationships. S.H. No relevant relationships. I.P. No relevant relationships. B.D.C. No relevant relationships. R.S. No relevant relationships. I.W. No relevant relationships. B.B. Advisory boards of GenMad, Eisai, and Roche (author has undertaken advisory board work through the consultancy arm of the University of Cambridge [Cambridge Enterprise], with the pharmaceutical company contracting Cambridge Enterprise for services, and all fees donated to a University of Cambridge Discretionary account); speakers bureau for Eisai Europe; support from Roche to register for virtual conference; work on data monitoring committees for GenMab, through the consultancy arm of the University of Cambridge (Cambridge Enterprise), with the pharmaceutical company contracting Cambridge Enterprise for services, and all fees donated to a University of Cambridge Discretionary account. J.W. No relevant relationships. J.H.G. No relevant relationships. T.M. No relevant relationships. C.W. No relevant relationships. S.J.P. No relevant relationships. T.S. No relevant relationships. M.J.G. No relevant relationships. S.J. Consulting fees for private practice, sees patients for treatment of CNS tumors and thyroid cancer in the following private hospitals: Nuffield Hospital Cambridge, Genesis Cancer Centre Newmarket, England; expert witness; member of a data monitoring committee for an international trial for the treatment of medulloblastoma (SIOP-HRMB), unpaid; chair of NICE Guideline committee evaluating maternal weight gain during pregnancy; lead of training committee for the Tessa Jowell Brain Cancer Mission; stock shares in Genesis Cancer Care Newmarket as part of Saunders and Jefferies Ltd (Robert D. Saunders, spouse). K.M.B. Cancer Research UK grant to institution; consultancies with NVision Imaging Technologies and New Path Molecular Research; patent application. “Uric acid as adjuvant”. Inventors: Kevin Michael Brindle, Alistair Mcfarlane Moore, Lindy Louise Thomsen. Applicants: Kevin Michael Brindle, Cambridge University Technical Services Limited, Glaxo Group Limited, Alistair Mcfarlane Moore, Lindy Louise Thomsen Glaxo Group Ltd. (Publication number WO2005102394 A1; publication date, 3rd November 2005; filing date 23rd March 2005; priority date, 25th March 2004); patent application. “Imaging medium comprising lactate and hyperpolarised 13C-pyruvate”. Inventors: Kevin M. Brindle, Samuel Evan Day. Applicants: Kevin M. Brindle, Samuel Evan Day, GE Healthcare AS. (Publication number WO2008020765 A2; publication date, 21st February 2008; filing date, 17th August 2007; priority date, 18th August 2006); patent application. “13C-MR imaging or spectroscopy of cell death”. Inventors: Kevin M. Brindle, Samuel Evan Day, Mikko Iivari Kettunen. Applicants: Kevin M. Brindle, Samuel Evan Day, Mikko Iivari Kettunen and GE Healthcare AS. (Publication number WO2008020764 A1; publication date 21st February 2008; filing date, 17th August 2007; priority date, 18th August 2006; patent application. “Agents for detecting and imaging cell death. Inventors: Kevin Brindle, Andre Neves, Maaike De Backer, Israt Alam Applicants: Cambridge Technical Services Ltd. (Publication no. WO2009133362 A3; publication date 25th March 2010; filing date 29th April 2009, priority date 29th April 2008); patent application. “Hyperpolarized lactate contrast agent for determination of LDH activity”. Inventors: Kevin M. Brindle, Mikko Ivari Kettunen, Brett W. C. Kennedy. Applicants: GE Healthcare (Publication no. WO2011138269 A1; publication date 10th November 2011; filing date 2nd May 2011; priority date 3rd May 2010); patent application. “Imaging of ethanol metabolism”. Inventors: Kevin M. Brindle, Piotr Dzien, Mikko Ivari Kettunen. Applicants: Cambridge Enterprise Ltd (EP14150267.4). Filing date 7th January 2014; NCITA Prostate Cancer GlobalTrial Steering Committee (Chair). F.A.G. Research support from GE Healthcare, grant from GlaxoSmithKline; consulting for AstraZeneca (consulting for the University); scientific advisory board of European Institute for Biomedical Imaging; board of trustees for World Molecular Imaging Society.
Abbreviations:
- BP
- bicarbonate to pyruvate
- CAIX
- carbonic anhydrase IX
- GBM
- glioblastoma
- IHC
- immunohistochemical
- kPB
- rate constant describing conversion of pyruvate to bicarbonate
- kPL
- rate constant describing exchange of label between pyruvate and lactate
- LDH
- lactate dehydrogenase
- LP
- lactate to pyruvate
- MCT
- monocarboxylate transporter
- NABP
- normal-appearing brain parenchyma
- ROI
- region of interest
References
- 1. Wen PY , Weller M , Lee EQ , et al . Glioblastoma in adults: a Society for Neuro-Oncology (SNO) and European Society of Neuro-Oncology (EANO) consensus review on current management and future directions . Neuro Oncol 2020. ; 22 ( 8 ): 1073 – 1113 . [DOI] [PMC free article] [PubMed] [Google Scholar]
- 2. Bi J , Chowdhry S , Wu S , Zhang W , Masui K , Mischel PS . Altered cellular metabolism in gliomas—an emerging landscape of actionable co-dependency targets . Nat Rev Cancer 2020. ; 20 ( 1 ): 57 – 70 . [DOI] [PubMed] [Google Scholar]
- 3. Corbin Z , Spielman D , Recht L . A metabolic therapy for malignant glioma requires a clinical measure . Curr Oncol Rep 2017. ; 19 ( 12 ): 84 . [DOI] [PubMed] [Google Scholar]
- 4. Kathagen A , Schulte A , Balcke G , et al . Hypoxia and oxygenation induce a metabolic switch between pentose phosphate pathway and glycolysis in glioma stem-like cells . Acta Neuropathol (Berl) 2013. ; 126 ( 5 ): 763 – 780 . [DOI] [PubMed] [Google Scholar]
- 5. Kathagen-Buhmann A , Schulte A , Weller J , et al . Glycolysis and the pentose phosphate pathway are differentially associated with the dichotomous regulation of glioblastoma cell migration versus proliferation . Neuro Oncol 2016. ; 18 ( 9 ): 1219 – 1229 . [DOI] [PMC free article] [PubMed] [Google Scholar]
- 6. Vlashi E , Lagadec C , Vergnes L , et al . Metabolic state of glioma stem cells and nontumorigenic cells . Proc Natl Acad Sci U S A 2011. ; 108 ( 38 ): 16062 – 16067 . [DOI] [PMC free article] [PubMed] [Google Scholar]
- 7. Patel AP , Tirosh I , Trombetta JJ , et al . Single-cell RNA-seq highlights intratumoral heterogeneity in primary glioblastoma . Science 2014. ; 344 ( 6190 ): 1396 – 1401 . [DOI] [PMC free article] [PubMed] [Google Scholar]
- 8. Sottoriva A , Spiteri I , Piccirillo SGM , et al . Intratumor heterogeneity in human glioblastoma reflects cancer evolutionary dynamics . Proc Natl Acad Sci U S A 2013. ; 110 ( 10 ): 4009 – 4014 . [DOI] [PMC free article] [PubMed] [Google Scholar]
- 9. Grande S , Palma A , Ricci-Vitiani L , et al . Metabolic heterogeneity evidenced by MRS among patient-derived glioblastoma multiforme stem-like cells accounts for cell clustering and different responses to drugs . Stem Cells Int 2018. ; 2018 : 3292704 . [DOI] [PMC free article] [PubMed] [Google Scholar]
- 10. Zaccagna F , Grist JT , Deen SS , et al . Hyperpolarized carbon-13 magnetic resonance spectroscopic imaging: a clinical tool for studying tumour metabolism . Br J Radiol 2018. ; 91 ( 1085 ): 20170688 . [DOI] [PMC free article] [PubMed] [Google Scholar]
- 11. Kurhanewicz J , Vigneron DB , Ardenkjaer-Larsen JH , et al . Hyperpolarized 13C MRI: path to clinical translation in oncology . Neoplasia 2019. ; 21 ( 1 ): 1 – 16 . [DOI] [PMC free article] [PubMed] [Google Scholar]
- 12. Radoul M , Chaumeil MM , Eriksson P , Wang AS , Phillips JJ , Ronen SM . MR studies of glioblastoma models treated with dual PI3K/mTOR inhibitor and temozolomide: metabolic changes are associated with enhanced survival . Mol Cancer Ther 2016. ; 15 ( 5 ): 1113 – 1122 . [DOI] [PMC free article] [PubMed] [Google Scholar]
- 13. Chaumeil MM , Ozawa T , Park I , et al . Hyperpolarized 13C MR spectroscopic imaging can be used to monitor Everolimus treatment in vivo in an orthotopic rodent model of glioblastoma . Neuroimage 2012. ; 59 ( 1 ): 193 – 201 . [DOI] [PMC free article] [PubMed] [Google Scholar]
- 14. Park JM , Recht LD , Josan S , et al . Metabolic response of glioma to dichloroacetate measured in vivo by hyperpolarized 13C magnetic resonance spectroscopic imaging . Neuro Oncol 2013. ; 15 ( 4 ): 433 – 441 . [DOI] [PMC free article] [PubMed] [Google Scholar]
- 15. Park JM , Spielman DM , Josan S , et al . Hyperpolarized 13C-lactate to(13C-bicarbonate ratio as a biomarker for monitoring the acute response of anti-vascular endothelial growth factor (anti-VEGF) treatment . NMR Biomed 2016. ; 29 ( 5 ): 650 – 659 . [DOI] [PMC free article] [PubMed] [Google Scholar]
- 16. Day SE , Kettunen MI , Cherukuri MK , et al . Detecting response of rat C6 glioma tumors to radiotherapy using hyperpolarized [1-13C]pyruvate and 13C magnetic resonance spectroscopic imaging . Magn Reson Med 2011. ; 65 ( 2 ): 557 – 563 . [DOI] [PMC free article] [PubMed] [Google Scholar]
- 17. Mair R , Wright AJ , Ros S , et al . Metabolic imaging detects low levels of glycolytic activity that vary with levels of c-Myc expression in patient-derived xenograft models of glioblastoma . Cancer Res 2018. ; 78 ( 18 ): 5408 – 5418 . [DOI] [PubMed] [Google Scholar]
- 18. Grist JT , McLean MA , Riemer F , et al . Quantifying normal human brain metabolism using hyperpolarized [1-13C]pyruvate and magnetic resonance imaging . Neuroimage 2019. ; 189 : 171 – 179 . [DOI] [PMC free article] [PubMed] [Google Scholar]
- 19. Park I , Larson PEZ , Gordon JW , et al . Development of methods and feasibility of using hyperpolarized carbon-13 imaging data for evaluating brain metabolism in patient studies . Magn Reson Med 2018. ; 80 ( 3 ): 864 – 873 . [DOI] [PMC free article] [PubMed] [Google Scholar]
- 20. Mammoli D , Gordon J , Autry A , et al . Kinetic modeling of hyperpolarized carbon-13 pyruvate metabolism in the human brain . IEEE Trans Med Imaging 2020. ; 39 ( 2 ): 320 – 327 . [DOI] [PMC free article] [PubMed] [Google Scholar]
- 21. Crane JC , Gordon JW , Chen HY , et al . Hyperpolarized 13 C MRI data acquisition and analysis in prostate and brain at University of California, San Francisco . NMR Biomed 2021. ; 34 ( 5 ): e4280 . [DOI] [PMC free article] [PubMed] [Google Scholar]
- 22. Autry AW , Gordon JW , Chen H , et al . Characterization of serial hyperpolarized 13C metabolic imaging in patients with glioma . Neuroimage Clin 2020. ; 27 : 102323 . [DOI] [PMC free article] [PubMed] [Google Scholar]
- 23. Miloushev VZ , Granlund KL , Boltyanskiy R , et al . Metabolic imaging of the human brain with hyperpolarized 13C Pyruvate demonstrates 13C lactate production in brain tumor patients . Cancer Res 2018. ; 78 ( 14 ): 3755 – 3760 . [DOI] [PMC free article] [PubMed] [Google Scholar]
- 24. Lee CY , Soliman H , Geraghty BJ , et al . Lactate topography of the human brain using hyperpolarized 13C-MRI . Neuroimage 2020. ; 204 : 116202 . [DOI] [PubMed] [Google Scholar]
- 25. Chen J , Patel TR , Pinho MC , et al . Preoperative imaging of glioblastoma patients using hyperpolarized 13C pyruvate: potential role in clinical decision making . Neurooncol Adv 2021. ; 3 ( 1 ): vdab092 . [DOI] [PMC free article] [PubMed] [Google Scholar]
- 26. Wiesinger F , Weidl E , Menzel MI , et al . IDEAL spiral CSI for dynamic metabolic MR imaging of hyperpolarized [1-13C]pyruvate . Magn Reson Med 2012. ; 68 ( 1 ): 8 – 16 . [DOI] [PubMed] [Google Scholar]
- 27. Gallagher FA , Woitek R , McLean MA , et al . Imaging breast cancer using hyperpolarized carbon-13 MRI . Proc Natl Acad Sci U S A 2020. ; 117 ( 4 ): 2092 – 2098 . [DOI] [PMC free article] [PubMed] [Google Scholar]
- 28. Proescholdt MA , Merrill MJ , Stoerr EM , Lohmeier A , Pohl F , Brawanski A . Function of carbonic anhydrase IX in glioblastoma multiforme . Neuro Oncol 2012. ; 14 ( 11 ): 1357 – 1366 . [DOI] [PMC free article] [PubMed] [Google Scholar]
- 29. Pérez-Escuredo J , Van Hée VF , Sboarina M , et al . Monocarboxylate transporters in the brain and in cancer . Biochim Biophys Acta 2016. ; 1863 ( 10 ): 2481 – 2497 . [DOI] [PMC free article] [PubMed] [Google Scholar]
- 30. R Core Team . R: a language and environment for statistical computing . Vienna, Austria: : R Foundation for Statistical Computing; , 2018. . Accessed April 12, 2018. https://www.r-project.org . [Google Scholar]
- 31. Mehrabian H , Lam WW , Myrehaug S , Sahgal A , Stanisz GJ . Glioblastoma (GBM) effects on quantitative MRI of contralateral normal appearing white matter . J Neurooncol 2018. ; 139 ( 1 ): 97 – 106 . [DOI] [PubMed] [Google Scholar]
- 32. Dextraze K , Saha A , Kim D , et al . Spatial habitats from multiparametric MR imaging are associated with signaling pathway activities and survival in glioblastoma . Oncotarget 2017. ; 8 ( 68 ): 112992 – 113001 . [DOI] [PMC free article] [PubMed] [Google Scholar]
- 33. Turkalp Z , Karamchandani J , Das S . IDH mutation in glioma: new insights and promises for the future . JAMA Neurol 2014. ; 71 ( 10 ): 1319 – 1325 . [DOI] [PubMed] [Google Scholar]


![Relationship between lactate dehydrogenase A (LDH-A) expression and labeling of lactate and pyruvate following injection of hyperpolarized [1-13C]pyruvate. Scatterplots show the relationship between LDH-A expression and the lactate-to-pyruvate and bicarbonate-to-pyruvate ratios. Each point represents a tissue sample. The R2 values, representing the goodness of fit, and P values for each regression are shown.](https://cdn.ncbi.nlm.nih.gov/pmc/blobs/d92b/9360994/d219213ca25b/rycan.210076.fig5.jpg)
