Abstract
The thermal behavior of alkylated diarylethene molecules (2,3-bis(2,4,5-trimethyl-3-thienyl)-N-alkylmaleimides; DAE-Cn) was investigated. DAE-C1 and DAE-C2 exhibited cold crystallization, which is a heat-storage phenomenon. In addition, DAE-Cn showed photoisomerization; the open-ring isomer O-DAE-Cn was formed by visible light irradiation and transformed to the closed-ring isomer C-DAE-Cn by UV light irradiation. X-ray diffraction and optical microscopy analyses revealed that O-DAE-Cn exhibited cold crystallization and C-DAE-Cn showed poor crystallinity. UV irradiation (365 nm) inhibited cold crystallization, and visible light irradiation (525 nm) triggered cold crystallization, suggesting that heat storage by the cold crystallization of DAE-Cn can be photo-controlled.
The alkylated diarylethene molecules exhibited cold crystallization, and their thermal behavior can be photo-controlled.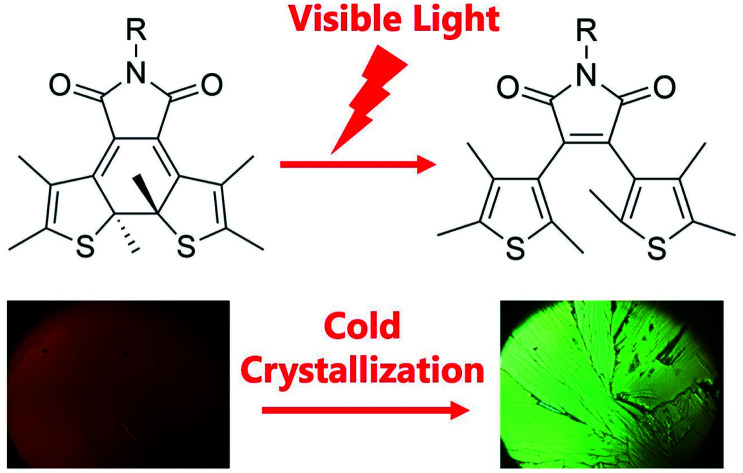
Introduction
Heat-storage materials have contributed to the development of a sustainable society. Cold crystallization is a heat storage phenomenon that uses supercooling.1 Generally, liquid molecules transform to the solid state during the cooling process. However, supercooling occurs when there are some factors that inhibit solidification, and the supercooled molecules store heat corresponding to the phase transition energy.2 The supercooled molecules sometimes crystallize when they are reheated, and crystallization during the heating process is called cold crystallization. Macromolecules often exhibit supercooling, glass transitions, and cold crystallization.3–7 They have a large molecular chain and are difficult to crystallize into a uniform molecular assembly, leading to a glass state in the cooling process. In recent years, the cold crystallization of small molecules has been reported.8–16 Small molecules often adopt a low crystallization temperature; therefore, they are suitable for the storage of low-temperature waste heat in society.17,18
In addition to heat storage, photochemical energy storage has attracted attention. Photochromic molecules are often used in energy storage.19–24 They absorb ultraviolet (UV) and/or visible light, and molecular photoisomerization occurs. The isomerization is sometimes accompanied by a solid–liquid transition,25,26 and the transition energy can be stored by light irradiation.27–30 The combination of cold crystallization and photoisomerization is a promising method for finding new functional energy storage systems.
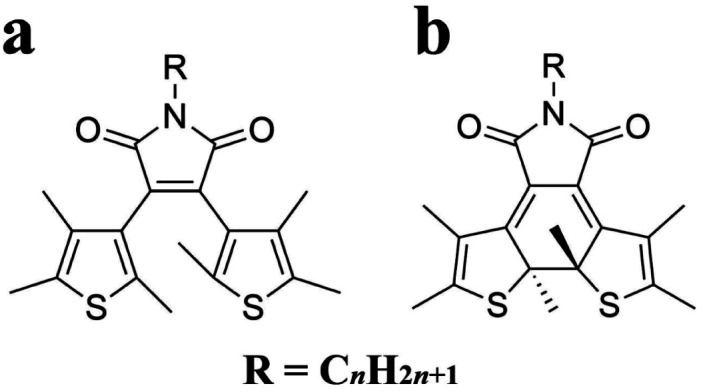
Diarylethene (DAE) molecules are photochromic and photoisomerizing.31–37 The diarylethene moiety is photo-switched to the open-ring isomer by visible light and to the closed-ring isomer by UV light. To control the crystallinity, an alkyl chain was introduced into the diarylethene molecule 2,3-bis(2,4,5-trimethyl-3-thienyl)maleimide in this study to give DAE-Cn (Fig. 1). As a result of alkylation, the molecules exhibited various thermal behaviors, including cold crystallization. In addition, a photoinduced cold crystallization was observed. The thermal and optical properties of alkyl-derivatized diarylethene molecules were therefore analyzed.
Fig. 1. Chemical structures of (a) the open-ring isomer, O-DAE-Cn, and (b) the closed-ring isomer, C-DAE-Cn.
Experimental
Synthesis and identification of 2,3-bis(2,4,5-trimethyl-3-thienyl)-N-alkyl-maleimide (DAE-Cn)
All reagents were purchased from Tokyo Chemical Industry (TCI) or Sigma-Aldrich, and were used without further purification. The powder of 2,3-bis(2,4,5-trimethyl-3-thienyl)maleimide (100 mg, 0.29 mmol), tetrabutylammonium bromide (TBAB, 20 mg, 0.06 mmol), and potassium carbonate (K2CO3, 10 g, 72 mmol) were added in 60 mL of tetrahydrofuran (THF). Then, 1-bromoalkane (0.30 mmol) was added to the mixture, and the mixture was stirred for 5 min at room temperature. The mixture was refluxed for 24 h under a nitrogen atmosphere. The solvent was removed by evaporation. The product was purified by solvent extraction utilizing CHCl3 and saturated NaCl aqueous solutions, and CHCl3 layer was collected. The solvent was removed by evaporation, and the product was dried for 12 h under reduced pressure. The product was further purified by silica gel column chromatography using CHCl3/hexane 1 : 1 v/v solution. The yellow powder crystals (C1–C3: C1, 90 mg, 87% yield; C2, 54 mg, 50% yield; C3, 51 mg, 45% yield) or orange oily liquid samples (C4–C18) were obtained.
The elemental analysis was performed on a PerkinElmer 2400II CHN analyzer. The nuclear magnetic resonance (1H-NMR and 13C-NMR) spectra were measured on Bruker AVANCE NEO 400 spectrometer and JEOL JNM-ECZ400S spectrometer. The infrared (IR) spectra were measured by a JASCO FT/IR-4200 spectrometer. DAE-C1: found: C, 63.38; H, 5.71; N, 3.92%. Calc. for C19H21NO2S2: C, 63.48; H, 5.89; N, 3.90%. 1H-NMR (400 MHz, CDCl3, Me4Si): δ 3.13 (s, 3H, N–CH3), 2.26 (s, 3H, C C–CH3), 2.24 (s, 3H, C C–CH3), 2.06 (s, 3H, C C–CH3), 1.90 (d, J = 3.2 Hz, 6H, C C–CH3), 1.74 (s, 3H, C C–CH3). 13C-NMR (100 MHz, CDCl3, Me4Si): δ 170.6, 170.5 (C O), 137.3, 137.1, 136.3, 136.0, 132.0, 131.6, 127.7, 127.5 (C C), 130.5 (2C, C C), 24.4 (N–CH3), 14.5, 14.2, 13.4, 13.1 (C–CH3), 13.2 (2C, C–CH3). IR (KBr, cm−1): ν 2976–2857 (C–H), 1771 (C O), 1705, 1646 (C C). DAE-C2: found: C, 64.33; H, 6.17; N, 3.58%. Calc. for C20H23NO2S2: C, 64.31; H, 6.21; N, 3.75%. 1H-NMR (400 MHz, CDCl3, Me4Si): δ 3.69 (q, J = 7.2 Hz, 2H, N–CH2–C), 2.26 (s, 3H, C C–CH3), 2.24 (s, 3H, C C–CH3), 2.06 (s, 3H, C C–CH3), 1.90 (s, 6H, C C–CH3), 1.74 (s, 3H, C C–CH3), 1.27 (t, J = 7.2 Hz, 3H, N–C–CH3). 13C-NMR (100 MHz, CDCl3, Me4Si): δ 170.4, 170.3 (C O), 137.1, 136.9, 136.2, 136.0, 132.0, 131.6, 127.7, 127.6 (C C), 130.5 (2C, C C), 33.5 (N–CH2–C), 14.5, 14.2, 13.4, 13.1 (C–CH3), 14.1 (N–C–CH3) 13.2 (2C, C–CH3). IR (KBr, cm−1): ν 2983–2860 (C–H), 1767 (C O), 1705, 1634 (C C). DAE-C3: found: C, 65.06; H, 6.36; N, 3.47%. Calc. for C21H25NO2S2: C, 65.08; H, 6.50; N, 3.61%. 1H-NMR (400 MHz, CDCl3, Me4Si): δ 3.60 (t, J = 7.2 Hz, 2H, N–CH2–C), 2.26 (s, 3H, C C–CH3), 2.24 (s, 3H, C C–CH3), 2.05 (s, 3H, C C–CH3), 1.90 (d, J = 2.1 Hz, 6H, C C–CH3), 1.74 (s, 3H, C C–CH3), 1.68 (m, 2H, C–CH2–C), 0.94 (t, J = 7.4 Hz, 3H, C–CH3). 13C-NMR (100 MHz, CDCl3, Me4Si): δ 170.6, 170.5 (C O), 137.0, 136.8, 136.2, 136.0, 132.0, 131.6, 127.7, 127.6 (C C), 130.5 (2C, C C), 40.1 (N–CH2–C), 22.0 (N–C–CH2–C) 14.5, 14.2, 13.4, 13.1 (C–CH3), 13.2 (2C, C–CH3), 11.4 (N–C–C–CH3). IR (KBr, cm−1): ν 2965–2858 (C–H), 1767 (C O), 1705, 1635 (C C).
Analysis of thermal and optical properties
Differential scanning calorimetry (DSC) was performed on a NETZSCH DSC 3500 Sirius calorimeter. The sample was enclosed into the aluminum pan, and then DSC scans were conducted under dry nitrogen gas. The heating and cooling rates were 10 °C min−1. Powder X-ray diffraction (PXRD) was measured on a Rigaku RINT 2500 diffractometer.
Optical microscopic data were captured on a Nikon ECLIPSE LV100POL microscope with a heat stage (Linkam, THMS600). UV (365 nm) and visible light (525 nm) irradiation was conducted with an ASAHI SPECTRA CL-1501 controller and LED lamp. UV-vis absorption spectra were recorded with a JASCO V-750 spectrophotometer, with sample concentration of 1.0 × 10⁻⁴ mol L−1 (CHCl3 solution).
Results and discussion
Thermal behavior of O-DAE-Cn
During the synthesis of DAE-Cn, the sample was exposed to visible light, and as a result, DAE-Cn was obtained as the open-ring isomer O-DAE-Cn. The thermal behavior of O-DAE-Cn was analyzed by differential scanning calorimetry (DSC) and the results are listed in Table 1. Solid virgin (i.e., not previously thermally treated) samples of O-DAE-C3 and the non-alkylated compound DAE-C0 melted in the first heating process, and no crystallization was observed in subsequent cooling/heating processes. Samples of O-DAE-C4–C18 were synthesized as orange oily liquid products, and no melting and crystallization behaviors were observed. However, O-DAE-C1 exhibited cold crystallization and polymorphism, and O-DAE-C2 exhibited cold crystallization.
Thermal behavior of O-DAE-Cn.
| Alkyl chain length | Thermal behavior |
|---|---|
| C0 | Glass transition |
| C1 | Cold crystallization |
| Polymorphism | |
| C2 | Cold crystallization |
| C3 | Glass transition |
| C4–C18 | Oily liquid state |
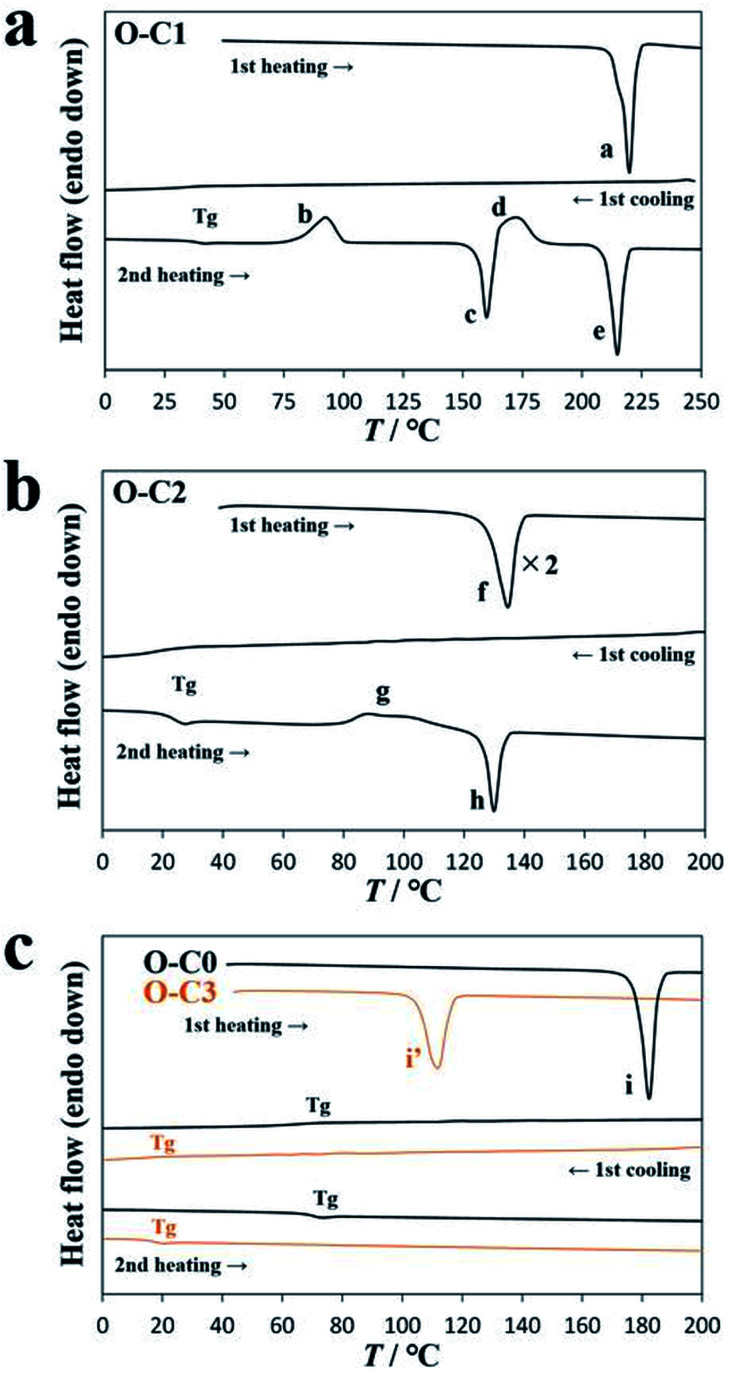
Fig. 2a shows a DSC diagram of O-DAE-C1. In the first heating process, the virgin sample melted at 215.6 °C (peak a, 40.2 kJ mol−1). In the first cooling process, a crystallization peak was not observed, but a glass transition (Tg) was observed at 35.8 °C. An enlarged view of Tg is shown in Fig. S1.† In the second heating process, a Tg at 37.5 °C and cold crystallization at 80.1 °C (peak b, 19.6 kJ mol−1) were observed. In addition, an endothermic peak c (156.8 °C, 21.0 kJ mol−1) and a second crystallization peak d (163.7 °C, 18.2 kJ mol−1) were observed, suggesting the polymorphism of DAE-C1. The compound finally melted at 209.9 °C with 33.0 kJ mol−1 of heat absorption (peak e). The melting temperatures were almost identical for the first and second heating processes. It is evident that the virgin sample obtained by solvent evaporation and the crystal formed at peak d adopt the same thermodynamically stable structure. The cold-crystallized crystal was probably a metastable structure formed kinetically.
Fig. 2. DSC diagrams of (a) O-DAE-C1 and (b) O-DAE-C2, both of which exhibit cold crystallization. Peak f was reduced to half of the original. (c) DSC diagram of O-DAE-C0 (black line) and O-DAE-C3 (orange line) which exhibit glass transitions.
The DSC diagram of O-DAE-C2 is shown in Fig. 2b. The virgin sample melted at 127.9 °C with a 23.0 kJ mol−1 endothermic peak in the first heating process (peak f). In the first cooling process, no crystallization peaks were observed, but a glass transition Tg was observed at 19.3 °C. The crystallization of O-DAE-C2 was slow, and supercooling occurred. In the second heating process, the corresponding Tg was observed at 22.6 °C, and cold crystallization (peak g, 79.4 °C, 5.8 kJ mol−1 exothermic) was observed. The cold-crystallized sample finally melted at 126.6 °C with 6.5 kJ mol−1 (peak h).
Fig. 2c shows DSC diagrams of O-DAE-C0 and O-DAE-C3. Virgin samples were obtained as crystalline powders, and only a glass transition was observed after melting in the first heating process. The melting peak, and the Tg transitions during cooling and heating, occurred at 178.3 °C (26.0 kJ mol−1), 67.5 °C, and 68.6 °C for O-DAE-C0, and at 105.4 °C (25.6 kJ mol−1), 28.3 °C, and 15.9 °C for O-DAE-C3.
Sample O-DAE-C2 exhibited clear cold crystallization without polymorphism. Therefore, the effect of photoisomerization on cold crystallization was investigated using DAE-C2.
Photochromism of DAE-C2
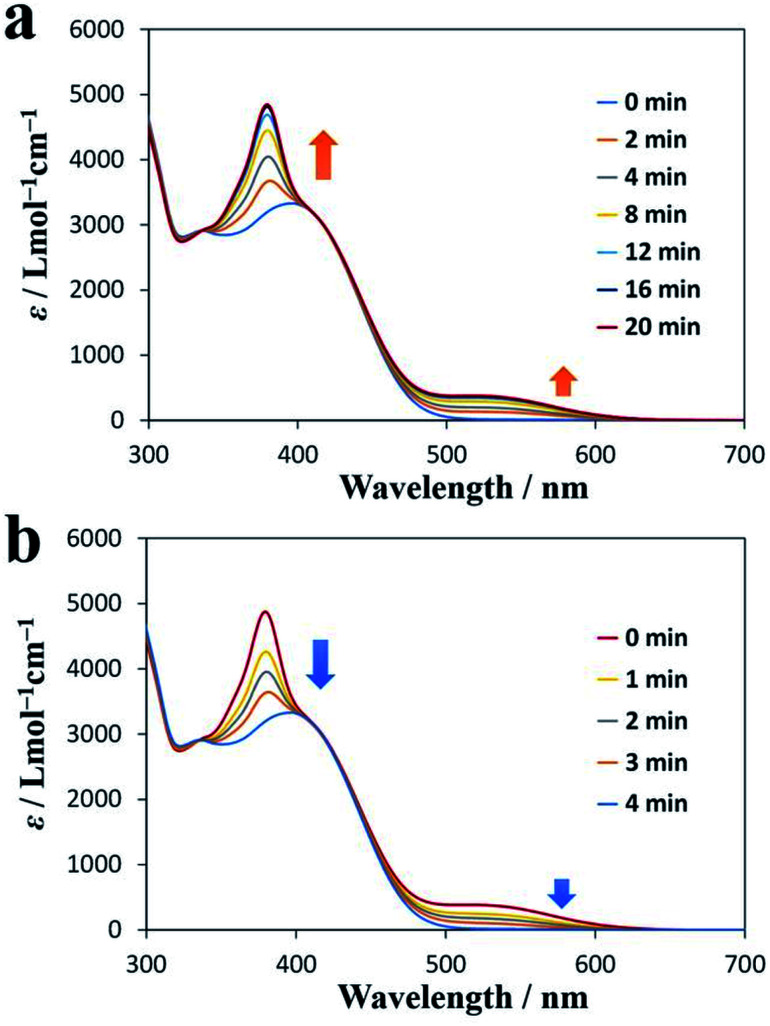
Diarylethene derivatives are known to be photochromic. Therefore, we investigated the photochromism of DAE-C2. Fig. 3a shows the UV-vis absorption spectrum of a CHCl3 solution of DAE-C2 (1.0 × 10⁻⁴ mol L−1) measured after various periods of exposure to UV light of wavelength 365 nm. As a result of the UV irradiation, the peak at 380 nm and the broad peak near 520 nm became larger as the irradiation proceeded. This change in absorption corresponds to the photochromism of the diarylethene moiety.38 Therefore, it was confirmed that DAE-C2 was synthesized mainly as the open-ring isomer O-DAE-C2 and was transformed to the closed-ring isomer C-DAE-C2 as a result of the UV irradiation. Fig. 3b shows the change in the UV-vis absorption spectrum under visible-light (525 nm) irradiation. The peaks at 380 and 520 nm became smaller, suggesting that the DAE molecule can exhibit reversible photo-switching even if it is alkylated.
Fig. 3. UV-vis absorption spectra of DAE-C2. (a) Change over time under UV irradiation (365 nm). (b) Change over time under visible-light irradiation (525 nm).
Photo-induced thermal behavior of DAE-C2
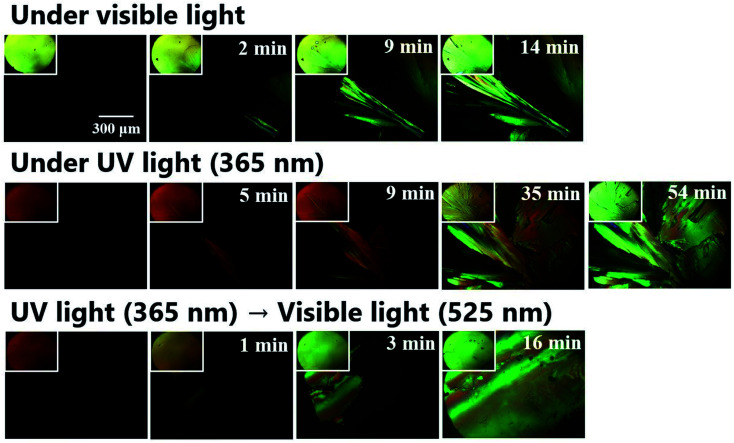
To investigate the effect of UV-vis irradiation on cold crystallization behavior, polarized optical microscopy (POM) with UV and visible light lamps was conducted. Fig. 4 shows the polarized microscopic images of the cold crystallization of DAE-C2, and the image without the polarizing plate is shown in the upper left of each image. First, cold crystallization behavior was observed under visible light. Powder crystals of O-DAE-C2 were inserted between the cover glasses and placed on a heat stage. The compounds were heated to 140 °C and melted, and the polarized microscopic images darkened. The compounds were cooled to −20 °C at a rate of 10 °C min−1. The image remained dark, suggesting that O-DAE-C2 exhibited supercooling. When the sample was reheated and maintained at 85 °C, cold crystallization was observed. The yellow crystals grew gradually, and the entire observation area was covered with crystals within 14 min.
Fig. 4. Photo-induced thermal behavior of DAE-C2 observed by polarized optical microscopy.
To investigate the crystallization behavior of closed-ring isomer C-DAE-C2, optical microscopy under UV (365 nm) irradiation was used. The yellow liquid of DAE-C2 was transformed into an orange liquid by UV irradiation. The temperature of the sample was varied while UV irradiation was continued. Supercooling was observed in C-DAE-C2, and the polarized microscopic image remained dark during cooling. When the sample was reheated and maintained at 85 °C, crystal nuclei did not appear immediately, suggesting the poor crystallinity of C-DAE-C2. In addition, the crystal growth rate was slower than that under visible-light irradiation, and it took 35 min from the first appearance of crystal nuclei for crystals to cover the entire observation area. A small amount of orange liquid remained for a considerable time, and it took approximately 1 h for the sample to consist completely of yellow crystals. From the yellow color of the crystals and the fact that crystal nuclei did not easily form under UV irradiation, it can be concluded that the crystals formed were the open-ring isomer O-DAE-C2. Although UV irradiation was conducted continuously, it was thought that the O-DAE-C2 crystals were formed because the sample was exposed to visible light during capture of the microscopic images. In the above experiments, the cold crystallization of O-DAE-C2 and poor crystallinity of C-DAE-C2 were confirmed.
The cold crystallization behavior was then investigated under combined UV and visible light irradiation. The orange supercooled liquid C-DAE-C2 was prepared under UV irradiation, then the sample was heated and maintained at 85 °C. When crystal nuclei appeared, the UV irradiation was switched to visible-light irradiation and crystal growth was observed. The color of the liquid rapidly changed from orange to yellow and the rate of crystal growth increased. The yellow crystals covered the entire observation area after 16 min. Summarizing the above experiments, it was revealed that photo-induced cold crystallization can occur in DAE-C2, and that it is inhibited by UV light irradiation and induced by visible light irradiation.
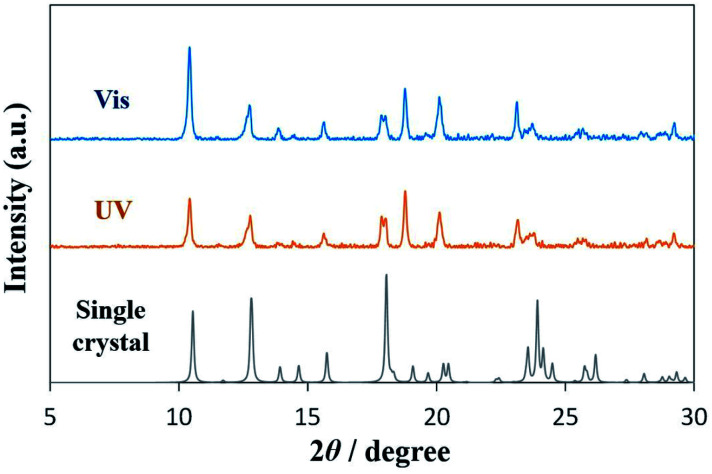
Powder X-ray diffraction (PXRD) and single-crystal X-ray structural analyses were conducted to investigate the crystal structure. Fig. 5 shows the XRD patterns of DAE-C2. The blue line shows the powder pattern of the cold-crystallized sample under visible-light (525 nm) irradiation, the orange line the pattern under UV irradiation (365 nm). The XRD patterns are identical. Additionally, a single crystal of O-DAE-C2 was obtained. Although the quality of the single crystal was poor and the crystal structure has not yet been analyzed completely, the structural insight from the single crystal is important for understanding the cold crystallization behavior. The crystallographic data are listed in Table S1,† and the molecular structure of the single crystal is shown in Fig. S2.† The molecules in the single crystal adopted the structure of the open-ring isomer O-DAE-C2. The calculated powder pattern of the single crystal, shown in Fig. 5 as a gray line, is the same as that of the cold-crystallized samples (blue and orange lines). Le Bail refinement39 of the PXRD patterns was also conducted using FullProf software.40 The refined patterns based on the single crystal data could be fitted to match the measured patterns (Fig. S3†). The results reveal that cold-crystallized DAE-C2 adopted the O-DAE-C2 structure; therefore, O-DAE-C2 showed good crystallinity and C-DAE-C2 showed poor crystallinity. The yellow crystals formed by cold crystallization in POM experiments under UV light irradiation are thus confirmed to be O-DAE-C2, formed by visible light exposure during capture of the microscopic image.
Fig. 5. Powder XRD patterns of cold-crystallized samples under irradiation with visible light (blue line) or UV light (orange line), and calculated pattern from a single crystal of DAE-C2 (gray line).
POM and XRD experiments revealed that O-DAE-C2, which is formed under visible-light exposure, exhibited good crystallinity and cold crystallization. In contrast, C-DAE-C2 formed under UV light exposure exhibited poor crystallinity. Therefore, UV irradiation leads to the inhibition of cold crystallization, and visible-light irradiation triggers cold crystallization. In summary, the cold crystallization of DAE-C2 can be photo-controlled. These results are expected to lead to the development of photoresponsive heat storage materials.
Conclusions
The thermal behavior including cold crystallization of DAE-Cn was investigated. Alkyl chain length n influenced the thermal behavior; DAE-C0 and DAE-C3 showed only glass transition, on the other hand, DAE-C1 and DAE-C2 exhibited the cold crystallization. In addition to the effect of alkyl chain length, the effect of light irradiation was observed. The open-ring isomer O-DAE-Cn and closed-ring isomer C-DAE-Cn were photoisomerized by visible light (365 nm) and UV light (525 nm) irradiation. O-DAE-Cn showed good crystallinity, and the cold-crystallized sample was composed of O-DAE-Cn. In contrast, C-DAE-Cn exhibited poor crystallinity. As a result, UV irradiation inhibited the cold crystallization, and visible light irradiation triggered the cold crystallization.
Conflicts of interest
There are no conflicts to declare.
Supplementary Material
Acknowledgments
This work was supported by JSPS KAKENHI (grant number: JP21K14725). The authors would like to thank Professor Masatomo Yashima of Tokyo Institute of Technology for technical assistance in fitting of the PXRD data.
Electronic supplementary information (ESI) available: Enlarged view of glass transitions, single crystal X-ray structural analysis, Le Bail refinement of PXRD data. See https://doi.org/10.1039/d2ra03898f
References
- Yazdani M. R. Etula J. Zimmerman J. B. Seppälä A. Green Chem. 2020;22:5447–5462. doi: 10.1039/D0GC01427C. [DOI] [Google Scholar]
- Turunen K. Yazdani M. R. Santasalo-Aarnio A. Seppälä A. Sol. Energy Mater. Sol. Cells. 2021;230:111273. doi: 10.1016/j.solmat.2021.111273. [DOI] [Google Scholar]
- Wunderlich B. J. Chem. Phys. 1958;29:1395–1404. doi: 10.1063/1.1744729. [DOI] [Google Scholar]
- Liu T. Mo Z. Wang S. Zhang H. Polym. Eng. Sci. 1997;37:568–575. doi: 10.1002/pen.11700. [DOI] [Google Scholar]
- Zhong Z. Su Z. Polymer. 2019;174:52–60. doi: 10.1016/j.polymer.2019.04.050. [DOI] [Google Scholar]
- Marathe Y. N. Ramesh C. Badiger M. V. Polym. Cryst. 2020;3:e10097. [Google Scholar]
- Tencé-Girault S. Quibel J. Cherri A. Roland S. Fayolle B. Bizet S. Iliopoulos I. ACS Appl. Polym. Mater. 2021;3:1795–1808. doi: 10.1021/acsapm.0c01380. [DOI] [Google Scholar]
- Chang R. Fu Q. Li Y. Wang M. Du W. Chang C. Zeng A. CrystEngComm. 2017;19:335–345. doi: 10.1039/C6CE01645F. [DOI] [Google Scholar]
- Szklarz G. Adrjanowicz K. Knapik-Kowalczuk J. Jurkiewicz K. Paluch M. Phys. Chem. Chem. Phys. 2017;19:9879–9888. doi: 10.1039/C7CP00823F. [DOI] [PubMed] [Google Scholar]
- Iwase K. Toyama Y. Yoshikawa I. Yamamura Y. Saito K. Houjou H. Bull. Chem. Soc. Jpn. 2018;91:669–677. doi: 10.1246/bcsj.20170386. [DOI] [Google Scholar]
- Tsujimoto Y. Sakurai T. Ono Y. Nagano S. Seki S. J. Phys. Chem. B. 2019;123:8325–8332. doi: 10.1021/acs.jpcb.9b06880. [DOI] [PubMed] [Google Scholar]
- Boopathi A. A. Sampath S. Narasimhaswamy T. New J. Chem. 2019;43:9500–9506. doi: 10.1039/C8NJ06514D. [DOI] [Google Scholar]
- Viciosa M. T. Ramos J. J. M. Diogo H. P. Int. J. Pharm. 2020;584:119410. doi: 10.1016/j.ijpharm.2020.119410. [DOI] [PubMed] [Google Scholar]
- Lapuk S. E. Mukhametzyanov T. A. Schick C. Gerasimov A. V. Int. J. Pharm. 2021;599:120427. doi: 10.1016/j.ijpharm.2021.120427. [DOI] [PubMed] [Google Scholar]
- Kolek Ł. Jasiurkowska-Delaporte M. Juszyńska-Gałązka E. Rozwadowski T. J. Mol. Liq. 2021;339:117076. doi: 10.1016/j.molliq.2021.117076. [DOI] [Google Scholar]
- Ishino K. Shingai H. Hikita Y. Yoshikawa I. Houjou H. Iwase K. ACS Omega. 2021;6:32869–32878. doi: 10.1021/acsomega.1c04866. [DOI] [PMC free article] [PubMed] [Google Scholar]
- Honda A. Takahashi Y. Tamaki Y. Miyamura K. Chem. Lett. 2016;45:211–213. doi: 10.1246/cl.151076. [DOI] [Google Scholar]
- Honda A. Kakihara S. Kawai M. Takahashi T. Miyamura K. Cryst. Growth Des. 2021;21:6223–6229. doi: 10.1021/acs.cgd.1c00666. [DOI] [Google Scholar]
- Higashimoto S. Shishido T. Ohno Y. Azuma M. Takahashi M. Anpo M. J. Electrochem. Soc. 2007;154:F48–F54. doi: 10.1149/1.2404777. [DOI] [Google Scholar]
- Xia X. Luo J. Zeng Z. Guan C. Zhang Y. Tu J. Zhang H. Fan H. J. Sci. Rep. 2012;2:981. doi: 10.1038/srep00981. [DOI] [PMC free article] [PubMed] [Google Scholar]
- Cacciarini M. Skov A. B. Jevric M. Hansen A. S. Elm J. Kjaergaard H. G. Mikkelsen K. V. Nielsen M. B. Chem.–Eur. J. 2015;21:7454–7461. doi: 10.1002/chem.201500100. [DOI] [PubMed] [Google Scholar]
- Xu X. Wu B. Zhang P. Xing Y. Shi K. Fang W. Yu H. Wang G. ACS Appl. Mater. Interfaces. 2021;13:22655–22663. doi: 10.1021/acsami.1c05163. [DOI] [PubMed] [Google Scholar]
- Siebenhofer M. Viernstein A. Morgenbesser M. Fleig J. Kubicek M. Mater. Adv. 2021;2:7583–7619. doi: 10.1039/D1MA00906K. [DOI] [PMC free article] [PubMed] [Google Scholar]
- Song T. Lei H. Cai F. Kang Y. Yu H. Zhang L. ACS Appl. Mater. Interfaces. 2022;14:1940–1949. doi: 10.1021/acsami.1c19819. [DOI] [PubMed] [Google Scholar]
- Norikane Y. Hirai Y. Yoshida M. Chem. Commun. 2011;47:1770–1772. doi: 10.1039/C0CC04052E. [DOI] [PubMed] [Google Scholar]
- Xu J. Niu B. Guo S. Zhao X. Li X. Peng J. Deng W. Wu S. Liu Y. Polymers. 2020;12:901. doi: 10.3390/polym12040901. [DOI] [PMC free article] [PubMed] [Google Scholar]
- Zhang Z.-Y. He Y. Wang Z. Xu J. Xie M. Tao P. Ji D. Moth-Poulsen K. Li T. J. Am. Chem. Soc. 2020;142:12256–12264. doi: 10.1021/jacs.0c03748. [DOI] [PubMed] [Google Scholar]
- Qiu Q. Gerkman M. A. Shi Y. Han G. G. D. Chem. Commun. 2021;57:9458–9461. doi: 10.1039/D1CC03742K. [DOI] [PubMed] [Google Scholar]
- Liu H. Tang J. Dong L. Wang H. Xu T. Gao W. Zhai F. Feng Y. Feng W. Adv. Funct. Mater. 2021;31:2008496. doi: 10.1002/adfm.202008496. [DOI] [Google Scholar]
- Griffiths K. Halcovitch N. R. Griffin J. M. New J. Chem. 2022;46:4057–4061. doi: 10.1039/D2NJ00755J. [DOI] [Google Scholar]
- Irie M. Mohri M. J. Org. Chem. 1988;53:803–808. doi: 10.1021/jo00239a022. [DOI] [Google Scholar]
- Tian H. Yang S. Chem. Soc. Rev. 2004;33:85–97. doi: 10.1039/B302356G. [DOI] [PubMed] [Google Scholar]
- Irie M. Fukaminato T. Matsuda K. Kobatake S. Chem. Rev. 2014;114:12174–12277. doi: 10.1021/cr500249p. [DOI] [PubMed] [Google Scholar]
- Tamaoki M. Kitagawa D. Kobatake S. Cryst. Growth Des. 2021;21:3093–3099. doi: 10.1021/acs.cgd.1c00270. [DOI] [Google Scholar]
- Tang S. An J. Song F. Lv M. Han K. Peng X. ACS Appl. Mater. Interfaces. 2021;13:51414–51425. doi: 10.1021/acsami.1c11841. [DOI] [PubMed] [Google Scholar]
- Sun D. Wu Y. Han X. Liu S. Chem.–Eur. J. 2021;27:16153–16160. doi: 10.1002/chem.202102731. [DOI] [PubMed] [Google Scholar]
- Jia Y. Lu M. Cui S. Pu S. J. Photochem. Photobiol., A. 2022;423:113592. doi: 10.1016/j.jphotochem.2021.113592. [DOI] [Google Scholar]
- Nanni G. Ceseracciu L. Oropesa-Nuñez R. Canale C. Salvatore P. Fragouli D. Athanassiou A. Langmuir. 2015;31:6072–6077. doi: 10.1021/acs.langmuir.5b01004. [DOI] [PubMed] [Google Scholar]
- Le Bail A. Duroy H. Fourquet J. L. Mater. Res. Bull. 1988;23:447–452. doi: 10.1016/0025-5408(88)90019-0. [DOI] [Google Scholar]
- Rodríguez-Carvajal J. Physica B. 1993;192:55–69. doi: 10.1016/0921-4526(93)90108-I. [DOI] [Google Scholar]
Associated Data
This section collects any data citations, data availability statements, or supplementary materials included in this article.


