

Abstract
Research on women in U.S. agriculture highlights how, despite real challenges, women have made and continue to make spaces for themselves in this male-dominated profession. We argue that, partly due to data accessibility limitations, this work has tended to use white women’s experiences in agriculture as universal. Analyzing micro-data from the 2017 Census of Agriculture, this paper offers descriptive statistics about women and race in U.S. agriculture. We examine numerous characteristics of U.S. farms, including their spatial distribution, the average number of acres farmed, predominant crop types, and other characteristics to describe how white, Black, Indigenous, and Pacific Islander/Asian women farmers are faring. Our findings suggest significant differences in women’s farms by race. We argue that these are related to the history of forced and voluntary migration within the U.S. Our results indicate that understanding women’s experiences in farming requires understanding the impact of race and these broader historical patterns. Finally, because of these differences across races, we suggest that supporting “women in agriculture” may require tailored responses from agricultural policy and programming that addresses unique needs in specific communities.
Keywords: Women in Agriculture, Race and Agriculture , U.S. Census of Agriculture
Introduction
Since at least the early 1980s, scholars have attempted to write women back into the history of US agriculture (Haney and Knowles 1988; Sachs 1983; Rosenfeld 1985; Whatmore 1991). These scholars’ work highlights the significance of women’s labor while explaining the structural and cultural reasons “women seldom had control over the land they have labored on” (Jensen 1984, p.1). Documenting the crucial roles that women played on farms and ranches was pivotal to disrupting the “vast majority of research focusing on farm women in developed countries [that] centered on a woman’s role as part of a heterosexual couple” (Ball 2020, p. 147). Those early scholars set the foundation for today’s work on women in agriculture. Contemporary scholars continue to build on this legacy by documenting the barriers to participation and the significant cultural and structural challenges women face in agriculture. From laws that made it nearly impossible for women to inherit a farm until 1982, to a cultural belief that farms should be handed from father to son, this research asks academics, policymakers, and society to reimagine US agriculture as a place where women have not only been present but actively contributing to agricultural work and production (Shortall 1999).
This research emphasized the barriers that negatively impact women’s ability to farm and their farms’ economic success. It also highlights the many creative strategies women use to create successful farms (Sachs et al. 2016; Shortall 1999). Most of this work has taken place in rural sociology. For example, in “economics[,] there remains very little research focusing on women farmers in developed countries” (Ball 2020, p. 147). Schmidt et al. (2021) note that the vast agricultural economics literature rarely explores gender differences in farm earnings, nor the conditions and causes that may create those inequalities. In this paper, we review the literature on women in agriculture in the US and suggest that work, like ours, that includes an analysis of race offers important contributions to understanding women’s experience in agriculture in the US.
The rural idyll and women in agriculture
Contemporary scholars owe a debt of gratitude to the research that has been done on women in agriculture. This body of work allows researchers, policymakers, extension educators, and women farmers to see how they can occupy space in this male-dominated field. Much of the scholarship is implicitly animated as a response to the rural idyll (Bell 2006), a nostalgic lens that paints life in the country as slow-paced and unbothered. This vision, of course, has been “recognized amongst academics as normative and power-infused” (Shucksmith 2018, p. 1). The hegemonic visions of race, gender, and sexuality in the rural idyll culturally center the white, married, heterosexual farming couple with their children as natural food cultivators (Pilgeram 2012). Under this vision, (white) men are the farmers, and their (white) wives are their helpmates. When the time comes, the farmer’s son inherits the land, and their daughter either disappears from the imagination or is expected to marry a (male) farmer or rancher if she wants to stay in agriculture.
Much of the historical and contemporary research on women in agriculture highlights how this vision of “the farmer” in the rural idyll affects women’s experiences in agriculture. Part of the work of rewriting women into agriculture is about dismantling this fiction and yet recognizing that it creates real and persistent barriers for anyone who exists somehow outside of the rural idyll trope.
Some of the most foundational contemporary research about women in agriculture who are working outside of the trope of the rural idyll comes from researchers in Pennsylvania. These researchers have highlighted how women are using alternative agricultural systems to be successful farmers and “do the work” (Trauger 2004; Trauger et al. 2010). Moreover, these scholars have pointed out the work that needs to be done by extension educators to better support women in the field. (Trauger et al. 2010; Sachs et al. 2016). In Michigan, Wright and Annes’ (2016; 2020) case studies have been essential in articulating women’s challenges and successes in sustainable and value-added agriculture. Jarosz’s (2011) interviews in metropolitan Washington find that women farmers involved in CSAs employ an “ethics of care” in their farming, connection to other farmers, and connection with the people who buy their food. In Kansas, Ball (2014) finds that the increasing number of women farmers in that state is due in part to increased demand for alternative agricultural foods, the prevalence of smaller farms (which women are more likely to run), and because there seems to be more acceptance of women in this career path.
The findings from research on women in conventional agriculture tend to be more mixed in how women experience gender and inequity in the field. For example, Carter’s research in Iowa (2017; 2019) explores the experiences of women farmland owners and the pressures they experience to maintain a gendered structure of land tenure in the US. Women in her studies report feeling they are expected to rent the land to male farmers and have little control over how that land is cultivated. Her work also highlights critical moments when women can exert agency when offered alternative networks for understanding their role and relationship to the land. Perhaps not surprisingly, Smyth et al’s (2018) analysis of surveys done with women farmers in 2006 in Washington found that the more hands-on a woman’s job is on a farm or ranch, the more masculine she perceives herself to be.
Overall, this work shows how factors as varied as farming methods, land tenure, gender identity formation, and broader societal acceptance of women in agriculture have impacted women’s experience on the land. This research is almost entirely qualitative and regionally focused. Thus, these projects are not designed to compare cases since they focus on specific populations and use different methods, research designs, and research questions. Of course, this is the nature of qualitative data, which provides richness and depth to our understanding of social issues. The difficulty of accessing quantitative data on women in agriculture further explains why so much research is qualitative. The most robust data on women in agriculture are only available through the USDA, which is expensive to access and technically difficult to analyze. Unfortunately, this has contributed to an implicit focus on white women’s experiences, with researchers acknowledging the necessity of expanding this lens but faced with barriers to accessing the populations and data needed to do this (Pilgeram et al. 2020).
The invisibility of whiteness
While the research on women in agriculture in the US is of fundamental importance, too often, this work tends to suffer from either an oversampling of white women, discussions of research participation that do not include the racial demographics of participants (or makes them a footnote), or discussions of research findings that ignore the centrality of race to theorizing and understanding the experience of women in agriculture. This has been complicated because representative data on women farmers is difficult to access. While the USDA Census of Agriculture (CoA) includes and publicly reports data on gender and racial categories, it does not conduct or provide easy access to more complex analyses such as the average acreage of Black women’s versus white women’s farms. This is likely due, in part, to a lack of requests for such data; reporting every possible statistic is not reasonable given the vast amount of potential information, so public reports are prioritized based on frequently requested and accessed data and analyses. Researchers wanting to dive deeper must have a solid foundation in statistical analyses, go through a USDA application and screening process, and deal with geographic, physical, and other limitations, including no internet access while working with the data (Pilgeram et al. 2020). This, combined with more general difficulties in sampling and surveying women farmers, has resulted in non-representative qualitative research, often on white women, being the best source of knowledge to date.
As Pilgeram 2019 notes, research on women farmers has focused almost entirely on the experiences of women who are “white, well-educated, heterosexual, and married” (p. 925). At the same time, there is recognition of the need to expand this paradigm, along with criticisms of the difficulty in accessing relevant data (e.g., Hoffelmeyer 2019; Horst & Marion 2016). Broadly, much of the work on women in agriculture—in failing to articulate a discussion of race—naturalizes the whiteness of US agriculture. Research examining whiteness in agriculture tends to come from work looking at urban spaces (which often does not explicitly examine gender). These critiques of unmarked whiteness in the agrifood movement offer an essential contribution to understanding the role of race, but less clarity on how gender and race are co-constructed in these spaces and the ensuing implications of such a co-construction.
Hoppe and Korb’s (2013) synthesis of the 2012 Census of Agriculture is a clear example of how researchers, even those with access to data on race, do not always include it in their analysis. This omission is significant because research that sees women as a monolith may continue to envision agriculture, and subsequently agriculture policy, that is not friendly to some farmers (Horst and Marion 2018).
The absence of women farmers’ demographic discussions is particularly problematic because access to U.S. farmland has historically and contemporarily been hyper-racialized. For example, researchers must consider the barbarism of slavery and the Jim Crow period, where Black farmers “fought for the right to participate in the food system as producers” (White 2018, 4), the dispossession of indigenous people from their historic homelands and food systems (Whyte 2018), the incarceration of Japanese Americans and the seizure of their land and crops (Tokunaga 2019), and the Braceros program and continued fight over immigrant farm labor (Toffoli 2018). As these examples indicate, it is impossible to understand farming in the U.S. without grounding it in the history of colonialism, slavery, and immigration. Horst and Marion provide an excellent overview of this history in their literature review of racial, ethnic, and gender inequality in U.S. agriculture. Horst and Marion (2019) analyze publicly available 2012 CoA data to examine how farmland ownership, tenancy, and operation are stratified by race, concluding that the “long history of structural discrimination in U.S. agriculture” continues to “impact farmers today” (p. 13). Supporting these findings, Fairchild and Petrzelka’s (2020) analysis of images on USDA websites found that “women (both white and of color) are represented significantly less than white men in federal agricultural agency imagery in terms of numbers, focus, and role. Also, they find that people of color (male and female) are significantly underrepresented, with women of color trailing behind in nearly every category” (p. 129).
Even in spaces that are often considered friendlier and more validating of women farmers’ identities, such as farmers’ markets (Sachs et al. 2016), an analysis of whiteness complicates this notion. Slocum’s (2007) work on farmers’ markets finds that they are culturally and demographically spaces of unmarked whiteness. Guthman’s survey of farmers’ market managers specifically critiques the “if we only knew where our food came from” rallying cry of sustainable agriculture, arguing that it is tempered with elements of color-blind racism as well as an inclination towards universalizing that is “often associated with whiteness” (388). She argues that the consequence of this unmarked whiteness is that people of color, and Black people especially, do not want to participate in these markets because of the discourses of whiteness that permeate them.
Moreover, the invisibility of whiteness in discussions of farm operations makes it more difficult to discuss the historical and contemporary exploitation of nonwhite farmworkers and other participants in US agricultural systems. For example, Getz et al. (2008) note it was lobbying by the organic growers in California that kept the short-handled hoe—a tool that requires intense stooping and bending and is known to create lifelong back problems among farmworkers–legal in California. Holmes (2013) argues that the suffering from manual labor experienced by Indigenous and Mexican farmworkers in the U.S. is normalized through the racialization process. His ethnographic account is extraordinary– but it does not grapple with gender differences explicitly.
White’s (2012) research on Black women in Detroit is perhaps the best example of how to understand race and gender in agriculture. Her work highlights how Black women use urban gardening as a form of resistance and agency against the race and class-based brutality they and their communities face. White’s work is a model for explicitly engaging with race and place, and it demonstrates the kinds of theory-building that propel disciplines forward. White’s influence can be seen in the work of Wypler (2019), who describes how peer-to-peer networks have helped LBTQ farmers overcome barriers in their access to agricultural resources. Wypler effectively integrates whiteness in the analysis by focusing on how the “contemporary U.S. agriculture concentrated access to resources in the hands of white men” impacts the farmers in the study (2019: 949).
However, these qualitative projects have not been supported by quantitative projects capable of assessing broader trends across regions and cropping types. Schmidt et al. (2021) find that research looking at the intersection of race and gender on “key economic measures” (like earnings) is only just now emerging, and they emphasize the need for research that explores the impact of social identity on economic outcomes (p. 10); Horst and Marion (2019) call specifically for a more fine-grained analysis of race and gender data in the USDA CoA, stating that “one example area of a research gap is that of the experiences of white women compared to women of color” (p. 14).
This paper directly responds to such calls for a more in-depth understanding of Black, Indigenous, and Asian and Pacific Islander women farmers’ experiences (BIWoC). In this paper, we investigate how the experiences of BIWoC differ from those of white women (Horst and Marion 2019), as part of broader trends emphasizing the importance of using an intersectional lens in gender research Crenshaw 1991; Risman 2004; Shields 2008; Warner 2008; Cole 2009; Parent 2013; Rouhani 2014; ). In “Women in Agriculture: Four Myths,” Doss et al. (2018) argue that too often, research on women in agriculture gets translated in a way that “treats women as a monolithic group” (p. 69). Our findings help to deconstruct this myth.
Specifically, we analyze the 2017 USDA Census of Agriculture (CoA) data to offer a heterogeneous description of women involved in agriculture in the U.S. We focus on Black, Indigenous, and Pacific Islander/Asian women, using white women as our reference group for these research questions. Our work looks at how BIWoC farmers and their farms compare to white women. Specifically, we describe the racial breakdown of women in agriculture, where (geographically) BIWoC women are farming compared to white women, production differences between women, and how women access resources such as land and government payments.
In this paper, we use quantitative analysis to query further how race—and in particular whiteness—impacts the farming experiences of women in the U.S. Using micro-data from the 2017 CoA, we explore the diversity of women farmers and suggest that their roles in U.S. agriculture are far from homogenous. For example, we find that while many farmers are white women on conventional farms, there are significant differences in demographics, farm type, and production practices across gender and race. In short, our analysis suggests that BIWoC farmers are special populations and differ from white women farmers in statistically significant ways. Moreover, our findings assert the need for deeper quantitative and broader qualitative research on women farmers that uses an intersectional analysis to understand women’s multifaceted experiences and roles in U.S. agriculture.
Methods
Identifying women primary farmers in the Census of agriculture
Permission to access microdata from the 2017 CoA was obtained from the USDA, with location access granted at the Great Lakes USDA National Agricultural Statistics Service (NASS) Regional Office in 2019 and, due to the COVID-19 pandemic, through the University of Chicago’s NORC Data Enclave in 2020. The CoA is conducted once every five years to gain information on farmland use and ownership, operator characteristics, production practices, income, and expenditures (USDA 2019). It is intended to be a complete count of U.S. farms and ranches, defined as operations on which at least $1,000 of agricultural products were raised and sold, or usually would have been sold, during the CoA year (USDA 2019).
Over the years, the way the CoA has collected data on farmer gender has changed somewhat dramatically. For a full review, see (Pilgeram et al. 2020); additional information is also available in the Limitations section of Horst and Marion (2019). The most impactful change relevant to this article has to do with the designation of a principal operator. In 2017, each farm surveyed selected between zero and four operators as a “principal operator.” This completely altered the nature of this variable, which had previously indicated one single principal operator per farm. As such, the term “principal operator” is not interchangeable across the 2017 and previous Censuses.
Independent variables
To account for the incompatibility of the “principal operator” variables in the 2017 and earlier censuses, the USDA created a variable termed “primary producer.” This variable is calculated from 2017 CoA data and is intended to be comparable to the previous years’ “principal operator” term. Specifically, “primary producer” is coded using if/then statements based on who makes the most decisions on the farm, followed by who works the fewest days off the farm, and finally, designating a primary farmer at random in cases of a tie. We adjusted this coding slightly to implement a tiebreak based on the order in which producers are listed, with the first-listed principal producer being coded as the primary. This assumes that the listed order is a semi-intentional ranking of producers, which results in a slight difference in the calculated percentage of women farmers in official CoA reports and our data, with our coding reporting fewer (Pilgeram et al. 2020). For our research, primary women farmers are of specific interest because being designated a primary farmer indicates that a person is a crucial decision-maker involved in the farm’s day-to-day operation; they are essentially the key person running the farm. Then, our first key independent variable of interest is women primary farmers. This variable accounts for all women primary farmers, on farms of any size or type, across the U.S.
The difficulty of coding for race in the CoA has been cited by other researchers (Horst and Marion 2019); we attempt to provide a detailed picture by reporting multiple possible methods. Farmers in 49 U.S. states (excluding Hawaii) reported their race by checking any combination of the choices White, Black or African American, American Indian or Alaska Native, Asian, and Native Hawaiian or Other Pacific Islander. Respondents in Hawaii had the option of checking any combination of the choices White, Black or African American, American Indian or Alaska Native, Japanese, Chinese, Korean, Filipino, Native Hawaiian, Other Pacific Islander, and Other Asian. Hawaiian respondents were automatically included in the CoA variables for White, Black or African American, and American Indian or Alaska Native; however, they were not included in the CoA variables for Asian and ‘Native Hawaiian or Other Pacific Islander.’ Therefore, we report these latter two variables in two formats, both excluding Hawaiian respondents and including Hawaiian respondents, with Japanese, Chinese, and Korean added to the general U.S. ‘Asian’ variable, and Filipino, Native Hawaiian, and Other Pacific Islander added to the general U.S. ‘Pacific Islander’ variable.
Additionally, because respondents could choose multiple racial categories, we provide frequencies and percentages for each racial category in two ways. First, we look at the number of respondents who checked the box for a given race, regardless of what other racial categories they did or did not choose (e.g. ‘Any Black’). Second, we look at the number of respondents who only checked the box for one race and did not choose any other racial categories (e.g. ‘Only Black’). This answers Horst and Marion’s (2019) call for a more detailed accounting of the CoA race variables by looking at mixed race and single-race identities. However, it is limited by the impossibility of knowing respondents’ dominant racial identity. Still, this method provides unique insights; for example, mixed-race American Indian women accounted for 4.2% of all women primary farmers, while single-race American Indian women accounted for only 1.7% of all women primary farmers.
We grouped women primary farmers into four racial categories for our comparative analyses, including ‘White Only,’ ‘Any Black,’ ‘Any Indigenous,’ and ‘Any Pacific Islander/Asian.’ This last variable included Hawaiian respondents and grouped two racial categories due to insufficient respondents in these groups – combining was deemed necessary for meaningful statistical analysis. White Only was chosen as the reference group for clarity of analysis, as it is impossible to know how mixed-race white individuals present or identify their race.
Dependent variables and analysis
Farm location was assessed using 50 binary variables and one ordinal variable. One binary variable was created for each of the 50 U.S. states, with farmers coded as 1 if most of their farmland was in a given state and 0 if it was not. Our ordinal variable was Rural-Urban Continuum Codes (RUCC): a 9-point scale, at the county level, with 1 being most urban and 9 being most rural (variable is defined by and acquired from the USDA ERS). We elected to use RUCCs to break down county-level data into finer residential groups beyond metro and non-metro, allowing for the inclusion and assessment of non-metro areas influenced by nearby metro centers.
Farm management characteristics included 14 binary agricultural product variables (i.e., field crops, cattle), with farmers coded as 1 if their farm produced a product and 0 if they did not. Farms were also assessed using binary variables indicating the presence of value-added production, whether the primary farmer’s main occupation was farming, whether the primary farmer was retired, and if the farm had any organic land. Those farms with organic land were further categorized into four specific types of organic production. These included farms that are certified organic according to USDA National Organic Standards (certified), very small farms that follow National Organic Standards but do not apply for full certification status (exempt), farms in the process of becoming certified organic (transitioning), and those using organic practices but not qualifying as exempt, transitioning, or certified (other).
We additionally analyzed several continuous variables as indicators of farm management. These included the total acres operated, the proportion of farmland owned versus rented, the years of experience the primary farmer had working on any farm, and the total value of all agricultural products sold, including all government payments the farm received. This last combined variable was chosen to measure farm income due to the un-usability of the variable ‘Gross Cash Farm Income’ (GCFI). Gross Cash Farm Income, which measures annual farm income before expenses, is the sum of cash receipts, farm-related cash income, and Government direct farm program payments. While we did analyze this variable, it was heavily skewed by a small number of very high-income farms and, therefore, could not be legally reported under USDA NASS rules. Value of products sold plus government payments achieves a similar measure—it includes the gross market value before taxes of all agricultural products sold, including the value of commodities in the Commodity Credit Corporation loan program, combined with all payments made directly to operators for participation in federal farm programs (this specific combination was developed and used by Horst and Marion 2019).
For binary and ordinal variables, cross-tabulations compared each key group of interest to a reference group; chi-square tests were employed to determine significance. This analysis was chosen to simplify interpretation and direct comparison of demographic and farm characteristics among diverse groups. For all non-white racial groups, women primary farmers who only selected the racial category ‘white’ were the reference group.
Continuous variables were analyzed using Wald tests to test the null hypothesis that the two groups did not have significantly different mean values for each variable. Wald tests were chosen for simplicity of analysis and because t-tests could not be run with the frequency weights required to analyze CoA data. The Wald test is used to test the null hypothesis that a set of parameters is equal to some value. This test can be used to test multiple parameters simultaneously. For further discussion, see Greene 2003, p. 93. As described above, mean values were compared for each racial and ethnic group.
Limitations
Although the CoA represents the best available nationally representative accounting of women farmers in the U.S., it has limitations. As referenced above, comparing the number of women across CoA years, particularly the number of women in charge of their farms, is challenging due to changes in how demographic data has been collected. Our choice to focus on women primary farmers, while capturing women who have significant decision-making and work roles on the farm, does not capture the experiences of women who may be secondary, tertiary, or quaternary operators. Furthermore, while ‘primary women farmers’ is the most comparable variable to previous CoA years’ ‘principal women farmers’ variable, it is not a perfect comparison (see Pilgeram et al. 2020 for a full description).
The collection of racial and ethnic data has also changed over time. The number and composition of specific racial identity choices have evolved, and respondents can now choose more than one racial identity. While this is a more accurate accounting, it also creates limitations in knowing how mixed-race individuals present or identify, with particular implications for mixed-race white. We chose to use women who had selected ‘white’ and no other racial identities as our comparison group. Yet, some mixed-race white women may present or identify primarily as white. Further, we elected to include any respondent who had selected Black, Native American or Alaska Native, or Asian/Pacific Islander in our analytical categories for Black, Indigenous, and Asian/Pacific Islander, respectively. This drastically simplifies the complexity of racial identity, particularly for mixed-race individuals, yet there are few alternatives given the data structure. Additionally, while the CoA methodology has improved, it has rendered older data and analyses out of date; future changes may alter the significance of the findings reported here, as well.
One important example of changes in CoA data is the counting of Native American operations, which has changed drastically with significant implications for assessing the number of Native American women operating farms (Horst and Marion 2019). In 2012, each Native American reservation was counted as a single farm with up to three operators. In 2017, individual farms within each reservation were counted with up to four operators each. This resulted in a 10% increase in the number of counted Native American and Alaska Native farmers from 2012 to 2017, drastically altering our understanding of minority women engaged in farming (USDA National Agricultural Statistics Service 2017). Indeed, our study results suggest, for the first time, that Native American and Alaska Native women farmers account for a large proportion of minority women primary farmers.
In summary, progress in USDA CoA methodology, mainly related to collecting data on women and racial and ethnic minority farmers, has resulted in an increasingly accurate accounting of these farmers. While this is undeniably positive, it has also created complications in comparing and tracking the growth of these groups across time. Thus, the demographic data remains far from perfect. Additional improvements, particularly related to mixed-race individuals and the availability and clarity of racial and ethnic data, are needed—yet these, too, will likely render current estimations and analyses out of date. Nonetheless, it is imperative to use the best metrics available to enhance our understanding of, and ability to support, underserved farming groups.
Results
Racial breakdown of women in US agriculture
Our analysis shows that in 2017 women made up approximately one-third of farmers and ranchers in the US. Specifically, in the 2017 CoA, women accounted for 36% of all farmers, 29% of self-designated principal farmers, and 19% of primary farmers, as determined by our coding scheme1. Comparing principal women farmers from the 2012 CoA to primary women farmers from the 2017 CoA, there is a significant increase from 14–19%, after a reported decrease from 2007 to 2012 (USDA NASS 2014). It is unlikely that the percent of women primary farmers actually increased by 5.3% in the period between 2012 and 2017, especially given the previous downward trend; instead, it is likely that our coding for “primary farmer” captures women who have long served as the de facto “primary farmer” while formally assigning that role to a man on the farm. This trend supports the findings from earlier research that women, even when they play critical roles on farms, are not always comfortable with the title of “farmer” or “rancher” (Sachs et al. 2016).
Table 1.
Racial Breakdown of Women Farmers in the 2017 CoA
| All Women | Women Primaries | ||||
|---|---|---|---|---|---|
| Race | Freq | Percent | Freq | Percent | |
| Anya White | 1,207,551 | 95.92 | 375,750 | 94.48 | |
| Onlyb White | 1,197,010 | 95.08 | 371,842 | 93.50 | |
| Any WOC (including White) | 61,900 | 4.92 | 25,995 | 6.54 | |
| Only WOC (excluding White) | 51,359 | 4.08 | 21,936 | 5.52 | |
| Any Black | 14,210 | 1.13 | 5,403 | 1.36 | |
| Only Black | 13,027 | 1.03 | 4,936 | 1.24 | |
| Any American Indian | 34,812 | 2.77 | 16,761 | 4.21 | |
| Only American Indian | 26,685 | 2.12 | 13,376 | 1.70 | |
| Any Pacific Islander | 1,482 | 0.12 | 476 | 0.08 | |
| Only Pacific Islander | 859 | 0.07 | 249 | 0.06 | |
| Any Pacific Islander + HIc | 2,667 | 0.21 | 786 | 0.20 | |
| Only Pacific Islander + HI | 1,249 | 0.10 | 397 | 0.10 | |
| Any Asian | 9,691 | 0.77 | 2,878 | 0.72 | |
| Only Asian | 8,603 | 0.68 | 2,506 | 0.63 | |
| Any Asian + HI | 11,804 | 0.94 | 3,558 | 0.89 | |
| Only Asian + HI | 9,834 | 0.78 | 3,016 | 0.76 | |
a ‘Any’ indicates that the respondent checked the box for that racial category; they may have also chosen other racial categories
b ‘Only’ indicates that the respondent checked the box for that racial category and no other racial categories
c ‘+ HI’ indicates that respondents from Hawaii were included in this category
Table 2.
Rural Urban Continuum Codes by Race of Women Primary Farmers
| White Women Primary Farmers | Black Women Primary Farmers | Indigenous Women Primary Farmers | Pacific Islander/Asian Women Primary Farmers | ||||||||
|---|---|---|---|---|---|---|---|---|---|---|---|
| Rural Urban Continuum Codes | Freq | Percent | Freq | Percent | Freq | Percent | Freq | Percent | |||
| 1 - Metro - Counties in metro areas of 1 million or more | 73,278 | 19.72 | 996 | 18.43 | 1,142 | 6.82* | 1,043 | 25.98* | |||
| 2 - Metro - Counties in metro areas of 250,000 to 1 million | 65,941 | 17.74 | 915 | 16.94* | 1,573 | 9.40* | 1,055 | 26.28* | |||
| 3 - Metro - Counties in metro areas of fewer than 250,000 | 46,851 | 12.61 | 692 | 12.81 | 2,869 | 17.14* | 561 | 13.97 | |||
| 4 - Nonmetro - Urban population of 20,000 or more, adjacent to a metro area | 32,722 | 8.8 | 373 | 6.90* | 2,847 | 17.01* | 192 | 4.78* | |||
| 5 - Nonmetro - Urban population of 20,000 or more, not adjacent to a metro area | 11,100 | 2.99 | 107 | 1.98* | 1,507 | 9.01* | 589 | 14.67* | |||
| 6 - Nonmetro - Urban population of 2,500 to 19,999, adjacent to a metro area | 67,585 | 18.18 | 1205 | 22.3* | 4,819 | 28.80* | 350 | 8.72* | |||
| 7 - Nonmetro - Urban population of 2,500 to 19,999, not adjacent to a metro area | 36,319 | 9.77 | 558 | 10.33 | 1,300 | 7.77* | 108 | 2.69* | |||
| 8 - Nonmetro - Completely rural or less than 2,500 urban population, adjacent to a metro area | 14,818 | 3.99 | 370 | 6.85* | 200 | 1.20* | 63 | 1.57* | |||
| 9 - Nonmetro - Completely rural or less than 2,500 urban population, not adjacent to a metro area | 23,049 | 6.2 | 187 | 3.46* | 478 | 2.86* | 54 | 1.34* | |||
| Total | 371,663 | 100 | 5,403 | 100 | 16,735 | 100 | 3,027 | 100 | |||
* Significantly different from White Women Primary Farmers at p = < 0.000
When we break down the sample of women in our analysis by examining their racial identity, we find that, overall, women farmers are predominantly but certainly not exclusively white. By limiting our count to women who have selected ‘white’ and no other race, white women account for 95% of all women farmers (including secondary, tertiary, and quaternary) and 94% of primary women farmers. BIWoC, including those who marked any non-white category and white, accounted for 4.9% of all women farmers and 6.5% of primary women farmers. Limiting the category to BIWoC, who did not mark white, these women accounted for 4.1% of all women farmers and 5.5% of primary women farmers. Thus, in our comparison of white women to BIWoC, we find that BIWoC, though underrepresented as farmers, are slightly overrepresented as primary farmers as opposed to secondary, tertiary, or quaternary. Indeed, BIWoC accounted for 27.5% of non-white primary farmers, while white women accounted for just 19% of white primary farmers (p = 0.000)—a difference of 8.5% points.
Focusing on women of color, including mixed-race white, we find that 56% of WOC chose American Indian or Alaska Native as their racial designation. In comparison, 65% of WOC coded as primary farmers selected this category. Black or African American women were the next most populous group, with 23% of all women of color farmers and 21% of primary women of color farmers in selecting this racial category. Asian women (including those from Hawaii) accounted for 19% of all women of color farmers and 14% of primary women of color farmers, while Pacific Islander women (including those from Hawaii) were the least represented, with 4% of all women of color farmers and only 3% of primary women of color farmers.
Race, gender, and place
This section examines how race interacts with women’s farm and ranch locations. Our data also shows, not surprisingly, that women are farming in every state in the U.S., with the largest proportions clustered in Texas, California, and Pennsylvania. Several states with the highest share of women primary farmers were the same as those with the highest share of men primary farmers, namely, Texas and several corn-belt states. While there are some differences, overall, women primary farmers (before considering race) are located in much the same states as their male counterparts.
While white women’s farms (Fig. 1.) were distributed in a pattern matching the overall location of farms in the U.S., non-white women demonstrated a significantly different farm distribution pattern. Black women primary farmers were clustered to a much higher degree in the South and Southeastern states, particularly Texas, Missouri, Alabama, and Florida (Fig. 2). Indigenous women primary farmers were likewise highly clustered, in this case, predominantly in the Southwest, with nearly 40% in Arizona alone (Fig. 3).
Fig. 1.
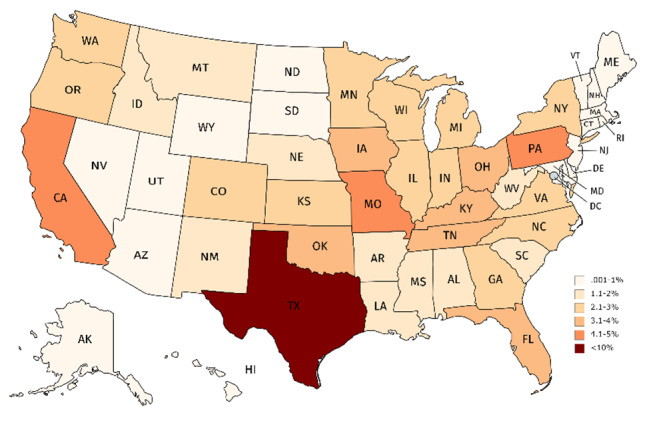
White Women Primary Farmers - % by State
Fig. 2.
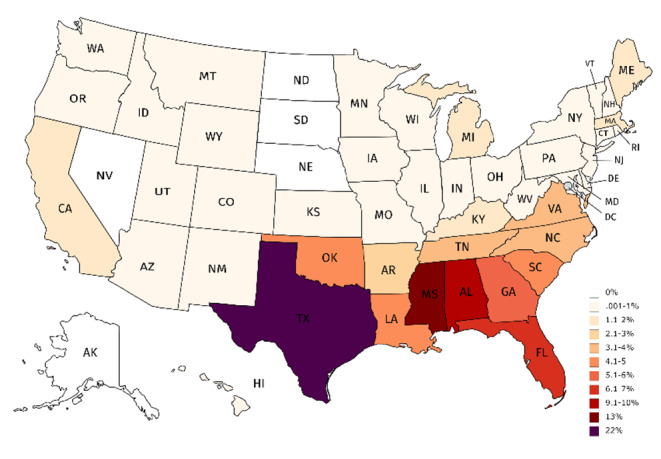
Black Women Primary Farmers - % by State
Fig. 3.
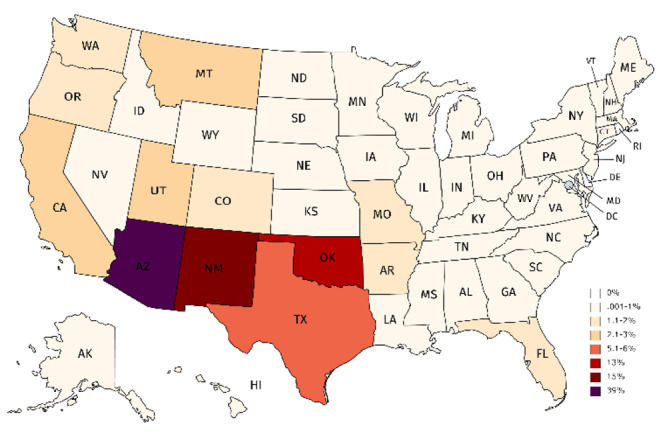
Indigenous Women Primary Farmers - % by State
Due to their insufficient numbers, Pacific Islander and Asian women primary farmers were grouped for analysis. This group showed more moderate clustering, with groupings in the West Coast states, Hawaii, Texas, Florida, and, to a lesser degree, Wisconsin and Minnesota (Fig. 4). Very few women primary farmers from any of these racial groups farmed in the corn belt or the Northeastern U.S., in contrast to the relatively high distribution of white women primary farmers in these areas. That is to say, BIWoC farm in very different places than white women, particularly in the Southern and Western U.S.
Fig. 4.

Pacific Islander and Asian Women Primary Farmers - % by State
This is perhaps not surprising given the broader, non-farmer racial demographics of U.S. states. The most proportionally Black and African American states in the U.S. include Mississippi, Louisiana, Georgia, Maryland, and Alabama (World Population Review 2022a). These overlap with some heavily farmed states to help explain the prevalence of Black and African American women primary farmers in the South. This is mirrored somewhat for Native Americans and Alaska Natives as well–the greatest general population proportions of Native Americans and Alaska Natives reside in Alaska, Oklahoma, New Mexico, and South Dakota (World Population Review 2022b). While several of these states are where Indigenous women primary farmers farm, it is not a perfect match, indicating that some states are rifer with opportunities for these women. It is unclear whether this is based on their agricultural characteristics, political climates, or other factors and begs future research. The same may be said of Asian and Pacific Islander women who, for example, have very low overall populations in Florida and Texas (World Population Review 2022c) yet have significant farming clusters in these states.
On a smaller geographic scale, we compared white women and women of color primary farmers using the 2013 Rural-Urban Continuum Code of the county they farmed the most land in (Table 3). Compared to white women, Black women primary farmers were more often farming in highly urban or highly rural county codes, except for the highest rural code in which white women far surpassed Black women. Indigenous women primary farmers tended to be farming in the middle codes – i.e., counties that were neither highly urban nor highly rural. On the other hand, Pacific Islander and Asian women primary farmers were highly concentrated in the most urban county codes, with some in the mid-range.
Table 3.
Women Primary Farmers’ Products, Value-Added, and Organic Status by Race
| White Women (n = 371,691) | Black Women (n = 5,403) | Indigenous Women (n = 16,762) | Pacific Islander/Asian Women (n = 4,015) | ||||||||
|---|---|---|---|---|---|---|---|---|---|---|---|
| Freq | Percent | Freq | Percent | Freq | Percent | Freq | Percent | ||||
| Products | |||||||||||
| Field | 36,873 | 10.66 | 365 | 6.76*** | 1,429 | 8.53*** | 137 | 3.41*** | |||
| Veg | 15,337 | 4.94 | 639 | 11.83*** | 938 | 5.60*** | 722 | 17.98*** | |||
| Sheep | 60,168 | 19.31 | 644 | 11.92*** | 8,229 | 49.10*** | 564 | 14.05*** | |||
| Bees | 15,728 | 5.11 | 164 | 3.04*** | 416 | 2.48*** | 174 | 4.33 | |||
| Hay | 119,544 | 34.29 | 1,178 | 21.8*** | 2,575 | 15.36*** | 456 | 11.36*** | |||
| Wood | 4,589 | 1.50 | 32 | 0.59*** | 52 | 0.31*** | 41 | 1.02 | |||
| Aquaculture | 720 | 0.25 | 15 | 0.28 | 15 | 0.09** | 21 | 0.52*** | |||
| Cattle | 130,978 | 35.24 | 2,438 | 45.12*** | 6,799 | 40.56*** | 747 | 18.61*** | |||
| Pigs | 16,965 | 5.49 | 229 | 4.24 | 619 | 3.690*** | 171 | 4.26 | |||
| Poultry | 76,886 | 24.77 | 702 | 12.99*** | 3,342 | 19.94* | 875 | 21.79 | |||
| Equines | 132,400 | 40.93 | 1,291 | 23.89*** | 8,263 | 49.3*** | 600 | 14.94*** | |||
| Other Livestock | 13,142 | 4.75 | 61 | 1.13*** | 599 | 3.57 | 102 | 2.54* | |||
| Nursery | 12,782 | 4.10 | 179 | 3.31 | 232 | 1.38*** | 516 | 12.85*** | |||
| Fruit | 26,681 | 8.59 | 350 | 6.48* | 700 | 4.18*** | 1,352 | 33.67*** | |||
| Direct-To-Consumer | 32,873 | 8.84 | 532 | 9.85* | 725 | 4.33*** | 805 | 20.05*** | |||
| Value Added | 142,973 | 41.51 | 132 | 2.89* | 278 | 1.81*** | 207 | 5.99*** | |||
| Any Organic | 6,707 | 1.98 | 125 | 2.58** | 178 | 1.20*** | 202 | 5.49*** | |||
| Certified Organic | 2,792 | 41.63 | 21 | 16.80*** | 42 | 23.60*** | 78 | 38.61 | |||
| Exempt Organic | 1,249 | 18.62 | 37 | 29.60** | 35 | 19.66 | 21 | 10.40** | |||
| Transitioning Organic | 709 | 10.57 | 12 | 9.60 | 36 | 20.22*** | 28 | 13.86 | |||
| Other Organic | 2,353 | 35.08 | 59 | 47.20** | 87 | 48.88*** | 93 | 46.04** | |||
(NOTE: All p-values use white women as reference group)
***p < 0.000, **p < 0.010, *p < 0.050
Race, gender, and production
BIWoC primary farmers varied from white women primary farmers related to what and how they farm. Differences in agricultural products, value-added production, and organic production are reported in Table 3 for WoC.
Compared to white women, Black women were more likely to have cattle and vegetables and less likely to produce hay, poultry, or equines (Table 3; p = 0.000). A majority–52%--of Indigenous women primary farmers had sheep in their operations in 2017. They also outpaced white women in vegetables, cattle, poultry, equines, and fruit production. Pacific Islander and Asian women grew specialty crops more often, including vegetables, nursery products, and fruit, with 36% producing the latter.
Looking at organic agriculture, we assessed a set of 5 variables. The first was a binary yes/no variable on whether the farm had any organic land of any type. For those who did, we additionally looked at whether that land was certified organic under the USDA, exempt from certification under the USDA, transitioning to USDA certified status, or ‘other’--that is, not associated with the USDA organic certification standards. Black and Pacific Islander or Asian women were more likely than white women to farm organically, with 2.6% and 5.5% respectively, having any organic land compared to just 1.9% of white women. Black women, however, were much less likely to be certified organic, and Pacific Islander or Asian women were more likely than white women to produce using USDA standards without being certified or exempt. Indigenous women primary farmers were less likely than white women to have any organic production; those who did were almost half as likely to be certified.
Looking at value-added production, Indigenous women were less likely to sell these products than white women, Black women were equally likely, and Pacific Islander or Asian women were almost twice as likely.
Race, gender, and resources
Looking at farmland, Black and Pacific Islander or Asian women all had much smaller farms on average than white women. Black women, in particular, operated very small farms with 80 acres on average. Indigenous women primary farmers, on the other hand, operated much larger farms than any other racial group, with an average size of 546 acres. Differences in acreage, value, farming experience, main occupation, and retired status are reported in Table 4 for WoC.
Table 4.
Women Primary Farmers’ Acreage, Value, Experience, Main Occupation, and Retirement by Race
| White Women (n = 371,691) | Black Women (n = 5,403) | Indigenous Women (n = 16,762) | Pacific Islander/Asian Women (n = 4,015) | ||||||||
|---|---|---|---|---|---|---|---|---|---|---|---|
| Mean | n | Mean | n | Mean | n | Mean | n | ||||
| Acres Operated | 222.3 | 397,686 | 80.79*** | 5,403 | 545.57*** | 16,761 | 91.25*** | 4,015 | |||
| Proportion Owned | 0.94 | 373,341 | 0.924*** | 4,885 | 0.9078*** | 8,312 | 0.96*** | 3,410 | |||
| Value Products + Gov’t Payments | $60,114 | 238,529 | $10,592*** | 2,927 | $23,813*** | 7,907 | $104,843*** | 2,484 | |||
| Years Worked on Any Farm | 20.94 | 397,686 | 18.18*** | 5,403 | 25.14*** | 16,761 | 14.41*** | 4,015 | |||
| Freq | Percent | Freq | Percent | Freq | Percent | Freq | Percent | ||||
| Any Federal Payments | 82,738 | 22.26 | 1,263 | 23.19 | 1,373 | 8.19*** | 324 | 8.07*** | |||
| Main Occupation Farming | 173,119 | 43.53 | 2,405 | 44.51* | 9,481 | 56.57*** | 1,972 | 49.12*** | |||
| Retired | 62,692 | 15.76 | 1,039 | 19.23*** | 1,818 | 10.85*** | 370 | 9.22*** | |||
(NOTE: All p-values use white women as reference group)
***p < 0.000, **p < 0.010, *p < 0.050
Income from products sold and government payments were far lower for Black and Indigenous women primary farmers than for white women primary farmers—about $50,000 and $40,000 lower on average, respectively. However, Pacific Islander or Asian women surpassed white women’s income from these sources by a substantial $43,000, possibly due to specializing in high value and more often (uncertified) organic, fruits, and vegetables.
Black and Pacific Islander/Asian women had fewer average years of farming experience (self-reported) (Table 4; p = 0.000). Pacific Islander/Asian women were more likely than white women to have farming as their main occupation (Table 4; p = 0.000). In contrast, Indigenous women farmers outpaced all other groups with an average of 25 years of farming experience and 57% with farming as their primary occupation (Table 4; p = 0.000).
Finally, Indigenous, Pacific, and Asian women had relatively lower retirement rates than white women (Table 4, p = 0.000). Black women primary farmers, in contrast, were 3% points more likely than white women primary farmers to be retired (Table 11; p = 0.000).
Discussion
Women of all races are underrepresented in farming, according to our findings. Furthermore, our results show that as categories become more exclusive, the proportion of women in that category decreases when counting women in general. Thus, women are not simply underrepresented in farming on a general level but increasingly underrepresented in greater prestige and power positions. In addition, women farmers are underrepresented (per the coding for primary farmers) as decision-makers, farmers with the most days worked on-farm and first-listed farmers on the CoA form. However, a deeper investigation of the race shows additional nuance.
While women are underrepresented as farmers (19–36% of farmers [depending on definition] versus 51% of the general population), BIPoC women farmers are even more severely underrepresented within their gender category. Indeed, non-white women account for only 4–6.5% of women farmers (depending on definition) but are approximately 24% of women in the U.S. general population (US Census Bureau 2020), a discrepancy of 17.5–20% points. Yet, when we compare white women to BIWoC, we find that BIWoC are slightly more likely than white women to be designated a primary farmer; 27.5% of non-white primary farmers were women, while just 19% of white primary farmers were women (p = 0.000). This contrasts with the general trend showing women farmers increasingly underrepresented as the prestige and power of the farming position go up; refining this analysis to include race alters our understanding. This trend may be accounted for by our finding that women of color were less likely than white women farmers to have a spouse on-farm (23% versus 34%, p = 0.000) and that men farmers are more likely than women to be designated the primary farmer (while some women did have a same-sex spouse, most were married to men—see Dentzman et al. 2021 for a complete discussion). Together, these conditions indicate that women of color are less often farming with a spouse than white women. This relationship likely contributes to the discrepancy in the proportion of white women to women of color farmers designated as the primary farmer. Further, this suggests that white, heterosexual women farmers may be more likely to rely on a male heterosexual farmer to access land and capital even when they are most responsible for the farm (Pilgeram and Amos 2015). In contrast, women of color have neither this luxury nor this barrier to farmer identity and control. This raises issues surrounding examinations of racialized gender performance, identity, and the transformation of family farm ideologies.
Perhaps the most important observation from this data is that while women, based on the general US population, are unrepresented as farmers and ranchers, Black women are severely underrepresented. In contrast, Indigenous women are slightly overrepresented in this population. These results reflect historical and contemporary demographic factors related to forced and voluntary migration within the US. Notably, while Black and Indigenous women’s levels of representation vary from underrepresented to overrepresented, both groups are making less money farming than their white, Asian, and Pacific Islander peers. This emphasizes the necessity of expanding our agrarian imaginary to include where and how Black and Indigenous women practice agriculture while simultaneously investigating how gender functions in agricultural communities that may have a less colonial understanding of the sex-gender binary (Ward 2018).
Our findings, of course, must be contextualized within the structures of race and gender. For example, as Touzeau 2019 notes, “The oppressive histories of slavery, sharecropping, and discriminatory lending practices contribute to a modern American agricultural landscape where black farmers are underrepresented,” while The Dawes Act forced Indigenous people to become farmers and ranchers and accept the individual portioning of reservation land to sell off the huge swaths of treaty land to white farmers. This, coupled with the fact that many Tribal Nations use systems that are not structured around patriarchal beliefs, means that land is more likely to stay or end up in women’s hands, but it does not mean that these women faring are better in terms of their profits (Ward 2018).
In short, understanding women’s experiences in farming requires understanding broader historical patterns to see how their gendered and racialized identities structure women’s experiences as farmers and ranchers. Our analysis suggests that emerging qualitative work on food justice and race in agriculture that explores the specificities among women farmers is essential to understand the many diverse experiences of women in agriculture (Smith 2019). For instance, our data raises questions including why women of color are overrepresented in primary farmer roles compared to white women, why Native American and Native Alaskan women are such a dominant proportion of women of color farmers, and what strategies Asian and Pacific Islander women have employed to have highly financially successful farms compared to other women.
Our research also suggests that supporting women in agriculture requires supporting women in different regions and from different racial backgrounds, which may look like programming to increase profit margins on particular crops or, as Waring (2003) and White (2012) remind us, that may require thinking about the work women in agriculture are doing that is not captured through economic modeling, but is essential to the food sovereignty of their community. For example, both Black and Indigenous women are more likely to be cattle producers, though the former have very small farms and the latter very large ones. In contrast, Pacific Islander and Asian women are much more likely than other women to produce high-value organic fruit and nursery crops, though these are less likely than white women’s to be certified. Different support strategies will be necessary for these different contexts. Federal opportunities (e.g., USDA grants and loans), state- and local-level programming (e.g., NRCS), and extension/non-profits (e.g., Annie’s Project) all need to be aware of these differences to be most effective. However, they often focus on either gender or race. For instance, the Socially Disadvantaged Farmers and Ranchers designation used to determine USDA funding allocations always includes racial and ethnic minorities and sometimes includes women, but never specifically references any intersections among these categories (USDA National Resource Conservation Service 2010).
Our findings reinforce the work of Doss et al. (2018) in asserting that women’s experience in agriculture is far from homogenous. Given that our analysis is US-focused, it underscores that women’s experiences, even when bounded within a particular nation-state, must be understood along specific axes of social identity which structure their farming opportunities and experiences. Furthermore, we see that BIPoC women, but especially Black, Pacific Islander, and Asian women, are overrepresented as farmers and ranchers using “any organic” methods yet are underrepresented in the “certified organic” category. Sachs et al. (2016) report that women farmers sometimes forgo organic certification due to a lack of resources, including money and time; it has also been argued that organic certification may be less appealing to philosophically oriented growers due to the co-option of certification (Guthman 2014). Researchers might consider further exploring this issue, including BIPoC and white women’s motivations for (non)certification and the benefits and detriments of these decisions. Policymakers might consider how to better support women—particularly nonwhite women—in becoming certified to fully realize higher earnings on their crops.
These differences in the percentage of women farming organically likely have some basis in what crops each group tends to produce. For instance, Pacific Islander and Asian women are likely more often organic because they produce more specialty crops with high consumer demand for organic options (Greene et al. 2017). These trends in organic status may also be reflected in land ownership patterns, with those owning their farmland being more willing to invest in sustainable practices that involve high up-front investments and longtime horizons for benefits (Carolan et al. 2004; Fraser 2004). For example, Black and Indigenous women primary farmers owned a slightly lower proportion of their farmland than white women, while Pacific Islander or Asian women owned more—this may explain why these women were more likely to commit to transitioning to organic land.
Conclusion and policy implications
Our research highlights some of the key demographic differences between women involved in agriculture. It suggests that qualitative and quantitative researchers studying women in agriculture need to be particularly careful about situating women within their broader social contexts and understanding the significance of race to key aspects of farming. For example, our research highlights the relationship between where farms are located and the race of the primary producer. It shows that women are taking the lead on all types of farms and ranches across the US; they are farming in rural counties and urban counties, in the Midwest and South and West, and in both politically and economically diverse counties. It also shows that programming that supports Black women’s farms, which are smaller and more urban on average, may not be appropriate for Indigenous women farming and ranching on larger, more rural farms and ranches, nor for Asian and Pacific Islander women who are largely involved in the organic fruit and vegetable sectors.
To this end, research on farmers and ranchers must be specific about the population studied; too often, research on women in agriculture fails to mention racial identity as more than a footnote. This is most often true when the population is primarily or exclusively white. When most research on women in agriculture in the US focuses on white women, but the results are written as if they apply to all women, white women’s experiences, obstacles, and triumphs in farming become the default. Our findings show the significance of race to women farmers’ experiences. This is perhaps most obviously demonstrated by looking at the spatial location of farmers. These maps reflect the racial histories of different forms of social inequality. The experience of access to land and identity around farming varies across racial groups because of US policies that target minoritized people differently.
Furthermore, our finding that women of color are less likely to farm with a farmer spouse suggests that they challenge the family farm model as they create strategies outside of this highly white heteronormative structure. Farming policies must be steeped in an understanding of these histories to ameliorate these inequalities. When we pay greater attention to racial differences between women farmers and ranchers in terms of representation, potential access to land, and what is being produced, it allows scholars and extension educators to meet the needs of those communities better.
Perhaps most importantly, our work highlights the stark underrepresentation of Black, Asian, and Pacific Islander women in farming, while underscoring the places where BIWoC have established their farming communities. This includes a high proportion of farms run by Indigenous women that are not as profitable as their white, Asian, and Pacific Islander counterparts.
Our data, which uses important updates to how the USDA Census of Agriculture counts producers, provides the most detailed description of US women farmers across racial categories to date. However, some clear limitations need to be addressed in future quantitative studies, including racial identity and salience issues. Additionally, like White’s (2018) pivotal book on Black farmers, in-depth qualitative research in these farming spaces is essential for reshaping the collective consciousness about what it means to be a farmer and adapting our support systems for farmers to be relevant to all farmers. We hope researchers can use the analysis in this paper to underscore and contextualize their general findings of agriculture and set new courses for future research. There is a significant need for more detailed explorations of farming and ranching BIWoC communities that expand on both the breadth and depth of findings reported here.
Acknowledgements
Thank you to our reviewers, but especially Reviewer 2, who shaped this paper by offering a review that was both demanding and deeply generous. Their time and ideas made a significant contribution in shaping this paper and we are very grateful to them. Thank you to Dr. Kelsey Conley for her support of our project when she was employed as a Postdoctoral Research Associate in the Department of Agricultural Economics and Rural Sociology, University of Idaho, Moscow, ID.
Abbreviations
- BIWoC
Black, Ingenious, and Women of Color
- CoA
Census of Agriculture
- USDA
United Stated Department of Agriculture
- US
United Stated
- WoC
Women of Color
Biographies
Ryanne Pilgeram
is a Professor of Sociology who studies inequality in rural and agricultural communities. She is the author of numerous publications about gender, class, race, and sexuality in agriculture. Most recently she published, Pushed Out: Contested development and rural gentrification in the US West, a book examining the structural forces of economic inequality in the rural West.
Katherine Dentzman
is an Assistant Professor of Rural Sociology and Rural Public Policy at Iowa State University. She specializes in transdisciplinary agri-food research at the intersection of environmental and social sustainability. She is renowned for her work on community-based management of pesticide resistance in agriculture and has also applied theories of good farming, place attachment, and intersectionality to study the pathways and barriers to success faced by women and LGBTQ + farmers.
Paul Lewin
is an Associate Professor and Extension Specialist in the Department of Agricultural Economics and Rural Sociology at the University of Idaho. He is also a member of the Rural Policy Research Institute and the director of the Rural Studies Program. His research and extension programs address minority entrepreneurship, including women farmer issues. He recently published in the journals Ethnicities, Applied Economic Perspectives and Policy, and Journal of Business Venturing Insights.
Funding
This work is supported by the Agriculture and Food Research Initiative grant no. 2019-68006-29325 /project accession no. 1018649 from the USDA National Institute of Food and Agriculture
Footnotes
The official USDA statistic shows women primary farmers at 24% of the population—this is due to a slight difference in the coding for the primary farmer variable. While the USDA broke ‘ties’ in decision making and days worked off-farm by choosing a random farmer as the primary, we broke ‘ties’ by designating the first-listed farmer as the primary farmer. Since men are more often listed as the first farmer, our coding resulted in a smaller percentage of women primary farmers.
Publisher’s note
Springer Nature remains neutral with regard to jurisdictional claims in published maps and institutional affiliations.
Contributor Information
Ryanne Pilgeram, Email: rpilgeram@uidaho.edu.
Katherine Dentzman, Email: dentzman@IASTATE.EDU.
Paul Lewin, Email: plewin@uidaho.ed.
References
- Ball JA. She Works Hard for the Money: Women in Kansas Agriculture. Agriculture and Human Values. 2014;31(4):593–605. [Google Scholar]
- Ball JA. Women Farmers in Developed Countries: A Literature Review. Agriculture and Human Values. 2020;37:147–160. [Google Scholar]
- Bell D. Variations on the Rural Idyll. In: Cloke P, Marsden T, Mooney P, editors. The Handbook of Rural Studies. London, UK: SAGE Publications; 2006. pp. 149–160. [Google Scholar]
- Carolan MS, Mayerfeld D, Bell MM, Exner R. Rented land: Barriers to sustainable agriculture. Journal of Soil and Water Conservation. 2004;59(4):70A–75A. [Google Scholar]
- Carter A. Placeholders and Changemakers: Women Farmland Owners Navigating Gendered Expectations. Rural Sociology. 2017;82(3):499–523. [Google Scholar]
- Carter A. We don’t equal even just one man: Gender and social control in conservation adoption. Society & Natural Resources. 2019;32(8):893–910. [Google Scholar]
- Cole ER. Intersectionality and Research in Psychology. American Psychologist. 2009;64(3):170–180. doi: 10.1037/a0014564. [DOI] [PubMed] [Google Scholar]
- Crenshaw K. Mapping the margins: Intersectionality, identity politics, and violence against women of color. Stanford Law Review. 1991;43(6):1241–1299. [Google Scholar]
- Dentzman K, Pilgeram R, Lewin P, Conley K. Queer Farmers in the 2017 US Census of Agriculture. Society & Natural Resources. 2021;34(2):227–247. [Google Scholar]
- Doss C, Meinzen-Dick R, Quisumbing A, Theis S. Women in agriculture: four myths. Global Food Security. 2018;16:69–74. doi: 10.1016/j.gfs.2017.10.001. [DOI] [PMC free article] [PubMed] [Google Scholar]
- Fraser EDG. Land tenure and agricultural management: soil conservation on rented and owned fields in southwest British Columbia. Agriculture and Human Values. 2004;21(1):73–79. [Google Scholar]
- Getz C, Brown S, Shreck A. Class Politics and Agricultural Exceptionalism in California’s Organic Agriculture Movement. Politics and Society. 2008;36:478–507. [Google Scholar]
- Greene, C., G. Ferreira, A. Carlson, B. Cooke, and C. Hitaj. 2017. Growing Organic Demand Provides High-Value Opportunities for Many Types of Producers. Economic Research Service, United States Department of Agriculture. Retrieved 10/21/20 from https://www.ers.usda.gov/amber-waves/2017/januaryfebruary/growing-organic-demand-provides-high-value-opportunities-for-many-types-of-producers/.
- Greene W. Econometric Analysis. 5. New Jersey: Prentice-Hall; 2003. [Google Scholar]
- Guthman J. If They Only Knew: Color Blindness and Universalism in California Alternative Food Institutions. Professional Geographer. 2008;60:337–396. [Google Scholar]
- Guthman J. Agrarian dreams. Berkeley, CA: University of California Press; 2014. [Google Scholar]
- Haney GW, Knowles JB. Making the ‘Invisible Farmer’ Visible. In: Haney WG, Knowles JB, editors. Women and Farming. Boulder, CO: Westview Press; 1988. pp. 1–14. [Google Scholar]
- Hoffelmeyer, M. 2019. Sexuality and Sustainable Agriculture: Examining Queer Farmers’ Quality of Life in Pennsylvania. Final Report for GNE18-174. Available at https://projects.sare.org/project-reports/gne18-174/.
- Holmes SM. Fresh fruit, broken bodies. Berkeley, CA: University of California Press; 2013. [Google Scholar]
- Hoppe, R., and P. Korb. 2013. Characteristics of Women Farm Operators and Their Farms.
- Economic Information Bulletin, USDA Economic Research Service.
- Horst M, Marion A. Racial, ethnic and gender inequities in farmland ownership and farming in the U.S. Agriculture and Human Values. 2019;36(1):1–16. [Google Scholar]
- Fairchild E, Petrzelka P. The USDA, Gender, and Race Equity: Representation on Conservation Agency Websites and Social Media. Society & Natural Resources. 2020;34(1):1–11. [Google Scholar]
- Jarosz L. Nourishing Women: Toward a Feminist Political Ecology of Community Supported Agriculture in the United States. Gender. Place & Culture. 2011;18(3):307–326. [Google Scholar]
- Jensen, J. 1984. Not Only Ours but Others: The Quaker Teaching Daughters of the Mid-Atlantic, 1790–1850. History of Education Quarterly Spring 3–19.
- Parent MC, DeBlaere C, Moradi B. Approaches to Research on Intersectionality: Perspectives on Gender, LGBT, and Racial/Ethnic Identities. Sex Roles. 2013;68:639–645. [Google Scholar]
- Pilgeram, R. 2012. Social sustainability and the white, nuclear family: Constructions of gender, race, and class at a Northwest farmers’ market. Race, Gender & Class 37–60.
- Pilgeram R. ‘How Much Does Property Cost Up There?’: Exploring the Relationship between Women, Sustainable Farming, and Rural Gentrification in the U.S. Society & Natural Resources. 2019;32(8):911–927. [Google Scholar]
- Pilgeram R, Amos B. Beyond ‘Inherit It or Marry It’: Exploring How Women Engaged in Sustainable Agriculture Access Farmland. Rural Sociology. 2015;80(1):16–38. [Google Scholar]
- Pilgeram R, Dentzman K, Lewin P, Conley K. How the USDA changed the way women farmers are counted in the census of agriculture. Choices. 2020;35(1):1–10. [Google Scholar]
- Risman BJ. Gender as social structure: Theory wrestling with activism. Gender and Society. 2004;18(4):429–450. [Google Scholar]
- Rouhani S. Intersectionality-informed quantitative research: A primer. American Journal of Public Health. 2014;103(6):1082–1089. [Google Scholar]
- Rosenfeld R. Farm Women: Work, Farm, and Family in the United States. Chapel Hill, NC: University of North Carolina Press; 1985. [Google Scholar]
- Sachs C. The invisible farmers: Women in agricultural production. Totawa, NJ: Rowman and Allanheld Press; 1983. [Google Scholar]
- Sachs C, Barbercheck M, Braiser K, Kiernan NE, Terman AR. The rise of women farmers and sustainable agriculture. Iowa City, Iowa: University of Iowa Press; 2016. [Google Scholar]
- Schmidt C, Goetz SJ, Tian Z. Female farmers in the United States: Research needs and policy questions. Memoir - American Association Of Petroleum Geologists. 2021;101:102039. [Google Scholar]
- Shields SA. Gender: An intersectionality perspective. Sex roles. 2008;59(5–6):301–311. [Google Scholar]
- Shortall, S. 1999. Women and farming: Property and power. Springer.
- Shucksmith M. Re-imagining the rural: From rural idyll to Good Countryside. Journal of Rural Studies. 2018;59:163–172. [Google Scholar]
- Slocum R. Whiteness, Space and Alternative Food Practice. Memoir - American Association Of Petroleum Geologists. 2007;38:520–533. [Google Scholar]
- Smith BJ. Food justice, intersectional agriculture, and the triple food movement. Agriculture and Human Values. 2019;36(4):825–835. [Google Scholar]
- Smyth JD, Swendener A, Kazyak E. Women’s Work? The Relationship between Farmwork and Gender Self-Perception. Rural Sociology. 2018;83(3):654–676. [Google Scholar]
- Toffoli E. Capturing capitalism’s work: Competing photo-narratives of the Bracero program. Radical History Review. 2018;132:126–143. [Google Scholar]
- Tokunaga, Y. 2019. Japanese Internment as an Agricultural Labor Crisis. Wartime Debates over Food Security versus Military Necessity. Southern California Quarterly 101(1):79 113.
- Touzeau L. ‘Being Stewards of Land is Our Legacy’: Exploring the Lived Experiences of Young Black Farmers. Journal of Agriculture Food Systems and Community Development. 2019;8(4):45–60. [Google Scholar]
- Trauger A. ‘Because they can do the work’: Women farmers in sustainable agriculture in Pennsylvania. USA Gender Place & Culture. 2004;11(2):289–307. [Google Scholar]
- Trauger A, Sachs C, Barbercheck M, Brasier K, Kiernan NE. ‘Our market is our community’: women farmers and civic agriculture in Pennsylvania, USA. Agriculture and Human Values. 2010;27(1):43–55. [Google Scholar]
- Trauger, A., C. Sachs, M. Barbercheck, N. E. Kiernan, K. Brasier, K., & A. Schwartzberg. 2010. The object of extension: Agricultural education and authentic farmers in Pennsylvania. Sociologia Ruralis 50(2): 85–103.
- US Census Bureau. 2020. 2019 Population Estimates by Age, Sex, Race and Hispanic Origin. Available at: https://www.census.gov/newsroom/press-kits/2020/population-estimates-detailed.html.
- USDA National Agricultural Statistics Service. 2014. Farm Demographics – U.S. Farmers by Gender, Age, Race, Ethnicity, and More. https://www.nass.usda.gov/Publications/Highlights/2014/Farm_Demographics/index.php.
- USDA National Agricultural Statistics Service. 2017. 2017 Census of Agriculture Highlights: American Indian/Alaska Native Producers. https://www.nass.usda.gov/Publications/Highlights/2019/2017Census_AmericanIndianAlaskaNative_Producers.pdf.
- USDA. 2019. Glossary. Washington, D. C.: U.S. Department of Agriculture, Economic Research Service. https://www.ers.usda.gov/topics/farm-economy/farm-household-well-being/glossary.aspx.
- USDA Natural Resource Conservation Service. 2010. Limited Resource Farmer and Rancher - (LRF/R) Socially Disadvantaged Farmer Definition. Available at: https://lrftool.sc.egov.usda.gov/SDFP_Definition.aspx.
- Ward KA. Before and After the White Man: Indian Women, Property, Progress, and Power. Connecticut Public Interest Law Journal. 2018;6(2):245. [Google Scholar]
- Waring M. Counting for something! Recognising women’s contribution to the global economy through alternative accounting systems. Gender & Development. 2003;11(1):35–43. [Google Scholar]
- Warner LR. A best practices guide to intersectional approaches in psychological research. Sex Roles. 2008;59:454–463. [Google Scholar]
- Whatmore S. Farming Women: Gender, Work and Family Enterprise. London, England: Macmillan; 1991. [Google Scholar]
- White M. Sisters of the Soil: Urban Gardening as Resistance in Detroit. Race/Ethnicity: Multidisciplinary Global Contexts. 2012;5(1):13–28. [Google Scholar]
- White M. Freedom farmers: agricultural resistance and the Black freedom movement. Chapel Hill, NC: Univeristy of North Carolina Press Books; 2018. [Google Scholar]
- Whyte K. Food Sovereignty, Justice, and Indigenous People: An Essay on Settler Colonialism and Collective Continuous. In: Barnhill A, Budolfson M, Doggett T, editors. The Oxford Handbook of Food Ethics. Oxford, UK: Oxford University Press; 2018. pp. 345–366. [Google Scholar]
- World Population Review. 2022a. Black Population by State. https://worldpopulationreview.com/state-rankings/black-population-by-state.
- World Population Review. 2022b. Native American Population 2022. https://worldpopulationreview.com/state-rankings/native-american-population.
- World Population Review. 2022c. Asian American Population by State 2022. https://worldpopulationreview.com/state-rankings/asian-population.
- Wright W, Annes A. Farm Women and the Empowerment Potential in Value-Added Agriculture. Rural Sociology. 2016;81(4):545–571. [Google Scholar]
- Wright W, Annes A. FASTing in the mid-west?: A theoretical assessment of ‘feminist agrifoods systems theory’. Agriculture and Human Values. 2020;37(2):371–382. [Google Scholar]
- Wypler J. Lesbian and Queer Sustainable Farmer Networks in the Midwest. Society & Natural Resources. 2019;32(8):947–964. [Google Scholar]