

Abstract
Perfluoroalkyl and polyfluoroalkyl substances (PFAS) are used in many consumer applications due to their stain repellency, surfactant properties, ability to form water-proof coatings and use in fire suppression. The production, application, transport, use and disposal of PFAS and PFAS-treated products have resulted in their wide-spread occurrence in environmental and biological systems. Concern over exposure to PFAS and their transformation products and metabolites has necessitated the development of tools to predict the transformation of PFAS in environmental systems and metabolism in biological systems. We have developed reaction libraries for predicting transformation products and metabolites in a variety of environmental and biological reaction systems. These reaction libraries are based on generalized reaction schemes that encode the process science of PFAS reported in the peer-reviewed literature. The PFAS reaction libraries will be executed through the Chemical Transformation Simulator, a web-based tool that is available to the public. These reaction libraries are intended for predicting the environmental transformation and metabolism of PFAS only.
Introduction
Strong and increasing international interest in perfluoroalkyl and polyfluoroalkyl substances (PFAS) results from and fuels the ever-growing number of reports concerning the occurrence of these chemicals in environmental and biological systems due to their widespread production, use and persistence. PFAS have been detected in soils,1,2 sediments,3 groundwaters,4 rivers,5 drinking water,6 and waste water treatment plants.7 The list of biological systems in which PFAS have been detected include humans,8–10 fish,11,12 birds,13–15 frogs,16 polar bears17 and marine organisms.18,19
The data in the peer-reviewed literature documenting the transformation and metabolic pathways of PFAS have not been captured in a systematic manner that readily supports prediction of the transformation products and metabolites of PFAS. Toward this end, we have developed reaction libraries for PFAS degradation in environmental systems and metabolism in biological systems. The reaction libraries are composed of generalized reaction schemes that are based primarily on specific examples of transformation pathways published in the peer-reviewed literature due to processes such as anaerobic and aerobic biodegradation, oxidation, metabolism, abiotic reduction, and hydrolysis. Here, we report upon the literature supporting these libraries, the logic used to organize them, and the resulting libraries of PFAS reactions. Currently these reaction libraries do not address the transformation of polymers or photolytic transformations due to the lack of supporting studies reported in the peer-reviewed literature.
The reaction libraries for the prediction of PFAS transformation products formed through these reaction schemes will be executed through the Chemical Transformation Simulator (CTS). CTS is a web-based application that provides access to physiochemical calculators for the calculation of physicochemical properties of a parent chemical and its transformation and metabolism products, which are predicted as a function of the reaction system of interest. This is accomplished through integration of cheminformatics applications for encoding of the process science that underlies transformation pathways and computational chemistry tools for the estimation of physicochemical properties. Users of the CTS should be cautioned that the physiochemical calculators have not been trained, calibrated, or validated for PFAS.
To develop CTS reaction libraries, reported transformation pathways and metabolic pathways and observed rate constants were compiled from peer-reviewed scientific literature and regulatory reports. Reaction schemes were then encoded using cheminformatics-based software tools and ranked according to the median observed transformation rate. CTS provides estimated physicochemical property values for both the parent and predicted products using a consensus approach that allows users to compare output from multiple calculators using different computational approaches to estimate physicochemical properties.20 CTS is available to the public at https://qed.epa.gov/cts/.
Our initial intent was to develop one PFAS reaction library that would predict transformation products (TPs) formed from transformation pathways occurring in environmental reaction systems and a second PFAS reaction library for predicting TPs formed from metabolism pathways in biological systems based only on specific examples of degradation pathways leading to experimentally verified TPs. However, we decided to expand this effort to include reaction pathways for the formation of proposed transformation products (PTPs) for both environmental transformations and metabolism. Typically, the formation of PTPs is used to rationalize the formation of TPs formed from subsequent transformation pathways.
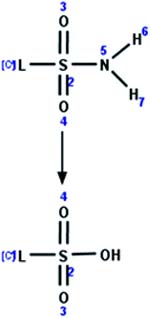
The literature is replete with examples of illustrated pathways1 showing proposed degradation products with brackets around them signifying that they are proposed intermediate products that have not been experimentally verified and/or2 using multiple arrows to signify that the specified transformation pathway is occurring through multiple intermediates, which again have not been experimentally verified. In most cases, chemical structures for these proposed intermediates are not provided. With the perspective of these observations, we concluded that the inclusion of proposed intermediates would support suspect screening during non-targeted PFAS analyses by providing investigators with prior knowledge of the chemical structures of plausible transformation products that may be present at low concentrations in environmental and biological samples. The transformation pathways leading to the formation of PTPs are identified in the generalized reaction schemes with the tag PTP. The PTPs predicted by these reaction schemes will be identified with brackets in the CTS output. Because development of the PFAS reaction libraries is an ongoing effort, we anticipate that as more of these chemical structures of the PTPs are verified over time, these pathways will be moved into reaction libraries for the experimentally verified reaction pathways. Users of the PFAS reaction libraries will have the option to suppress the prediction of proposed intermediates to simplify the complexity of the CTS output.
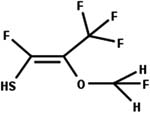
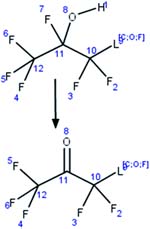
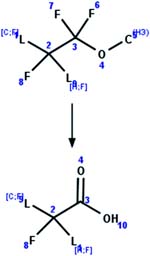
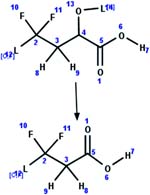
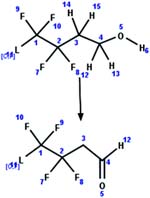
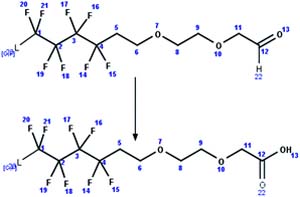
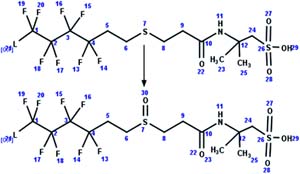
The goal of this work was to develop rules-based reaction libraries that are composed of generalized reaction schemes for generating transformation pathways for PFAS in both environmental and biological systems. Several examples of the generalized reaction schemes are illustrated in Fig. 1. These example reaction schemes are included in both the environmental transformation and metabolism reaction libraries. The label “L” is used to designate lists of acceptable elements at a particular site in the molecule. In each of the schemes in Fig. 1, no constraints are shown on the left-most atom on both the reactant and product sides; therefore, a carbon atom in this position could be bonded to up to three additional atoms of any type. This flexibility allows us to construct generalized reaction schemes for PFAS of varying carbon chain length so that reactions do not have to be constructed for individual PFAS (e.g., 4:2, 6:2 and 8:2 fluorotelomer alcohols), which saves time in the execution of the reaction libraries through the CTS. The effect of chain length on reaction pathways and reactivity will be addressed below. The generalized reaction schemes are also mapped by numbering individual atoms. This allows us to map specific parent chemical atoms to specific product atoms.
Fig. 1.

Examples of generalized reaction schemes that form the PFAS reaction libraries.
Methods
The generalized reactions schemes were generated using ChemAxon’s Reactor and MarvinSketch applications (ChemAxon LLC, Cambridge, MA, U.S.A.) based on individual transformation steps identified in reaction schemes in the peer-reviewed literature reporting on the environmental transformation of PFAS in environment systems and metabolism of PFAS in biological systems. Our goal was to identify at least 2 PFAS that were subject to a specific transformation or metabolism pathway.
The environmental and metabolism reaction libraries constructed based on these reaction libraries were tested for PFAS based on execution of the libraries using ChemAxon’s Metabolizer. Testing of the PFAS reaction libraries is limited to testing the extent to which execution of PFAS libraries can duplicate reactions schemes published in the peer-reviewed literature. The criteria for the selection of the reaction schemes for testing is based on including only papers with reaction schemes that report transformation products from three or more generalized reaction schemes illustrated in Table 3. As a result, these papers contain complex transformation trees illustrating multiple steps in the transformation of the specified PFAS. A second criterion was then applied to make certain the selection of PFAS for testing that met the first criterion were then based on obtaining results from a wide range of PFAS functional groups in several different environmental and biological reaction systems.
Table 3.
The list of generalized reaction schemes for the combined PFAS environmental and metabolism reaction libraries, examples of the parent PFAS on which the reaction schemes were based, and the associated reaction systems, assigned rankings and references. The studies conducted in environmental systems are highlighted in italics and the studies conducted in biological systems are highlighted in bold
| Reaction scheme | Generalized reaction scheme | Parent PFAS | Reaction system | Half-life/rank (ref.) |
|---|---|---|---|---|
| 1. Conjugation: reduction of alpha-keto glutathione conjugate to alpha-hydroxy glutathione conjugate |
|

|
Rabbit | 1 to 12 h/5 (ref. 47) |
| 2. Conjugation: glutathione–epoxide conjugate formation |

|

|
Rabbit | 1 to 12 h/5 (ref. 47) |
| 3. Conjugation: acetylation of S-Cys-unsaturated fluorotelomer acid conjugate to S-Cys-N-acetyl-unsaturated fluorotelomer acid_PTP |

|

|
Soybean | PTP/3 (ref. 48) |

|
Soybean | PTP, 7 to 60 days/3 (ref. 49) | ||
| 4. Conjugation: gluconerate–fluorotelomer alcohol conjugate formation |

|
|
Carp | 1 to 36 d/4 (ref. 50) |
| Rat | 1 to 10 d/4 (ref. 38) | |||
| Rat hepatocytes | 2 to 4 h/4 (ref. 51) | |||
| Trout | 1.2 h/4 (ref. 26) | |||
| 5. Conjugation: gluconerate–fluorotelomer sec-alcohol conjugate formation |

|
|
Rat liver | Not reported/4 (ref. 38) |
| 6. Conjugation: glutathione–ether conjugate formation |

|

|
Rat liver cytosol | 72 min/6 (ref. 52) |
| 7. Conjugation: glutathione-unsaturated fluorotelomer acid conjugate formation |
|
|
Rat hepatocytes | 2 to 4 h/5 (ref. 51) |
| Trout blood | 9.4 h/5 (ref. 39) | |||
| 8. Conjugation: glutathione-unsaturated fluorotelomer aldehyde conjugate formation |
|
|
Rat hepatocytes | 2 to 4 h/6 (ref. 51) |
| Rat cytosol | 0.5 to 2 h/6 (ref. 26) | |||
| 9. Conjugation: glutathione–vinyl ether conjugate formation |

|

|
Rat cytosol | 27 min/7 (ref. 53) |
| 10. Conjugation: hydrolysis of S-Cys-glycine-unsaturated fluorotelomer alcohol conjugate to S-Cys-unsaturated fluorotelomer alcohol_PTP |

|

|
Soybean | PTP/3 (ref. 48) |
| 11. Conjugation: hydrolysis of glutathione-unsaturated fluorotelomer acid conjugate to S-Cys-glycine-unsaturated acid |

|

|
Rat | Not reported/3 (ref. 38) |
| 12. Conjugation: hydrolysis of glutathione-ether conjugate to cysteine-ether conjugate |

|

|
Rat cytosol | 12 to 24 h/5 (ref. 54) |
| 13. Conjugation: hydrolysis of glutathione-unsaturated fluorotelomer alcohol conjugate to S-CysGly-unsaturated fluorotelomer alcohol_PTP |

|
|
Soybean | PTP/3 (ref. 48) |
| 14. Conjugation: hydrolysis of glutathione-vinyl ether conjugate to cysteine-vinyl ether conjugate |

|

|
Rat cytosol | 12 to 24 h/5 (ref. 54) |
| 15. Conjugation: hydrolysis of sulfide conjugate to carboxylic acid |

|

|
Rat cytosol | 10 to 24 h/5 (ref. 55) |
| 16. Conjugation: hydrolysis of vinyl sulfide conjugate to carboxylic acid |

|
|
Rat cytosol | 10 to 24 h/5 (ref. 55) |
| 17. Conjugation: reduction of glutathione-unsaturated fluorotelomer aldehyde conjugate to glutathione-unsaturated fluorotelomer alcohol conjugate |

|
|
Soybean | Not reported/3 (ref. 48) |
| 18. Conjugation: S-dealkylation of cysteine-ether conjugate to beta thio ether_PTP |

|

|
Rat cytosol | 10 h/5 (ref. 55) |
| 19. Conjugation: S-dealkylation of cysteine–vinyl ether conjugate to beta thio vinyl ether |

|

|
Rat cytosol | 16 h/5 (ref. 55) |
| 20. Conjugation: sulfate-fluorotelomer alcohol conjugate formation |

|
|
Rat | 8 h/5 (ref. 56) |
| Rat | Not reported/5 (ref. 38) | |||
| 21. Conjugation: taurine–fluorotelomer acid conjugate formation |

|
|
Rat hepatocytes | Not possible to estimate half-life/4 (ref. 26) |
| 22. Decarboxylation: alpha carboxy ether to ether |

|
|
Aprotic solvents | 1 to 5 h/1 (ref. 57) |
| 23. Decarboxylation: alpha hydroxy carboxylate to carboxylic acid |

|
|
Aerobic activated sludge | 0.4 d/5 (ref. 29) |
| 24. Decarboxylation: beta carboxy ketone to methyl ketone |

|
|
Activated sludge | PTP/3 (ref. 3) |
| Rat hepatocytes | 30 to 120 min/6 (ref. 6) | |||
| 25. Desulfonation: fluorotelomer sulfonate to fluorotelomer alcohol |

|
|
Bacterial culture | 39 h/4 (ref. 58) |
| Bacterial culture | 120 h/4 (ref. 49) | |||
| Bacterial culture | 160 h/4 (ref. 59) | |||
| 26. Epoxidation: alkene to epoxide_PTP |

|

|
Rabbit | PTP/4 (ref. 60) |
| 27. Hydrolysis: acid fluoride to carboxylic acid |

|

|
Phosphate buffer, pH 7.4 | <1 min/7 (ref. 61) |

|
Rat liver microsomes | Decomposes rapidly/7 (ref. 62) | ||
| 28. Hydrolysis: alpha difluoro alcohol to acid fluoride |

|

|
Rat liver microsomes | Decomposes rapidly/7 (ref. 62) |
| 29. Hydrolysis: alpha fluoro secondary alcohol to ketone |
|

|
Phosphate buffer, pH 7.4 | 0.1 h/7 (ref. 62) |
| Rat and liver microsomes | 0.1 h/7 (ref. 61) | |||
| 30. Hydrolysis: alpha fluoro primary alcohol to aldehyde |

|

|
Aqueous solution | 30 min/7 (ref. 63) |
| Aqueous solution | 30 min/7 (ref. 63) | |||
| 31. Hydrolysis: amide to carboxylic acid |

|

|
Aqueous solution | 0.167 d/5 (ref. 64) |
| Aqueous solution | 0.167 d/5 (ref. 64) | |||
| 32. Hydrolysis: beta hydroxy fluorotelomer iodide to diol_PTP |

|
|
Aerobic soil | PTP/3 (ref. 65) |
| 33. Hydrolysis: carboxylic acid ester to carboxylic acid |

|
|
Aerobic soil | 15 d/3 (ref. 66) |

|
Aerobic soil | 3 to 5 d/3 (ref. 66) | ||
| Trout liver | 1.1 min/7 (ref. 67) | |||

|
Aerobic soil | 10.3 d/3 (ref. 68) | ||
| Aerobic soil | 28 d/3 (ref. 69) | |||
| 34. Hydrolysis: diphosphate ester to monophosphate ester |

|
|
Soil microcosm | 60 d/2 (Lee et al. 2014) |

|
Activated sludge | 84 d/2 (ref. 70) | ||
| Rat serum | 2 to 4 d/4 (ref. 56) | |||
| 35. Hydrolysis: epoxide to diol_PTP |

|

|
Mixed bacterial culture | PTP/3 (ref. 71) |
| 36. Hydrolysis: perfluorinated epoxide to beta keto carboxylic acid |

|
|
Aqueous solution | 13.8 min/7 (ref. 72) |
| Aqueous solution | 13.8 min/7 (ref. 72) | |||
| 37. Hydrolysis: fluorotelomer aldehyde to fluorotelomer unsaturated aldehyde |

|
|
Rat hepatocytes | 30 min/6 (ref. 51) |
| 38. Hydrolysis: fluorotelomer acid to unsaturated telomer acid |

|
|
Aerobic soil | 11 h/4 (ref. 30) |

|
Rat liver microsomes | 2 to 6 h/5 (ref. 73) | ||
| Soybean | 12 to 24 h/5 (ref. 74) | |||

|
Activated sludge | 120 to 480 h/4 (ref. 65) | ||
| 39. Hydrolysis: fluorotelomer iodide to fluorotelomer alcohol |

|

|
Rat liver microsomes | 6 h/5 (ref. 73) |
| Aerobic soil | 10 d/3 (ref. 65) | |||
| 40. Hydrolysis: fluorotelomer urethane to fluorotelomer alcohol |

|

|
Aerobic soil | 3 to 5 months/7 (ref. 75) |

|
Aerobic soil | 16 to 22 months/7 (ref. 75) | ||
| 41. Hydrolysis: hydrodefluorination of PFC chain |

|
|
Activated sludge | 1 to 3 d/4 (ref. 76) |
| 42. Hydrolysis: monophosphate ester to alcohol |

|

|
WWTP microbes | 1 d/4 (ref. 77) |
|
|
WWTP microbes | 40 d/4 (ref. 41) | ||
|
|
WWTP microbes | 50 d/4 (ref. 77) | ||
| Trout | 4.4 d/4 | |||
|
|
Rat | 2.3 d/4 (ref. 78) | ||
| 43. Hydrolysis: diperfluoro-phosphinate to monoperfluoro-phosphonate |

|

|
Aqueous solution | 36 h @ 150 °C/1 (ref. 79) |

|
Trout | 5.5 d/3 (ref. 80) | ||
|
20.4 d/3 (ref. 80) | |||

|
52.7 d/3 (ref. 80) | |||
| 44. Hydrolysis: sulfonamide to sulfonate |
|
|
Earthworm | 9.5 d/3 (ref. 33) |
| Rat | < 10 min/7 (ref. 81) | |||
| 45. Hydrolysis: sulfonyl fluoride to sulfonate |

|

|
Aqueous solution | 0.1 d/3 (ref. 82) |
|
24.3 d/3 (ref. 82) | |||
| 46. Hydroxylation: N-alkyl sulfonamide to N-alkyl sulfonamide alcohol_PTP |

|
|
Marine sediment | PTP/3 (ref. 83) |
| 47. Hydroxylation: unsaturated fluorotelomer acid to alpha hydroxy fluorotelomer acid |

|
|
Rat hepatocytes | PTP/3 (ref. 51) |
| Activated sludge | 3 d/3 (ref. 29) | |||
| 48. Hydroxylation: unsaturated fluorotelomer acid to beta hydroxy fluorotelomer acid |

|
|
Aerobic soil | 63 d/2 (ref. 25) |
| Trout | PTP/3 (ref. 39) | |||
| 49. N-Deacetylation: N-acetyl, N-alkyl sulfonamide to N-alkyl sulfonamide |

|
|
Japanese Medaka | 3.9 d/4 (ref. 84) |
| Marine sediment | 30 to 60 d/3 (ref. 83) | |||
| Aerobic activated sludge | 7.5 d/3 (ref. 85) | |||
| 50. N-Deacetylation: N-acetyl sulfonamide to sulfonamide |

|
|
Earthworms | 5 d/4 (ref. 86) |
| Aerobic activated sludge | 1.9 d/4 (ref. 85) | |||
| 51. N-Dealkylation: N-alkyl sulfonamide to sulfonamide |

|
|
Japanese medaka | 2.5 d/4 (ref. 84) |
| Trout liver microsomes | 1 to 10 d/4 (ref. 87) | |||
| Activated sludge | 0.75 d/5 (ref. 85) | |||
| 52. N-Demethylation: fluorotelomer sulfonamide N-dimethyl-N-acetyl betaine to fluorotelomer sulfonamide N-methyl-N-acetyl betaine |

|

|
Blue mussel | No kinetic data/4 (ref. 88) |
| 53. N-Deacetylation: fluorotelomer sulfonamide N-methyl-N-acetyl-betaine to fluorotelomer sulfonamide N-methyl betaine |

|
|
Blue mussel | No kinetic data/4 (ref. 88) |
| 54. N-Deacetylation: fluorotelomer sulfonamide N-dimethyl-N-acetyl-betaine to fluorotelomer sulfonamide N-dimethyl betaine |

|

|
Blue mussel | No kinetic data/4 (ref. 88) |
| 55. N-Demethylation: fluorotelomer sulfonamide N-methyl betaine to fluorotelomer sulfonamide betaine |

|
|
Blue mussel | No kinetic data/4 (ref. 88) |
| 56. O-Demethylation: alpha difluoro methyl ether to carboxylic acid |
|

|
Rat liver microsomes | 1.5 d/4 (ref. 62) |
| 57. O-Demethylation: fluoromethyl ether to secondary alcohol |

|

|
Human liver microsomes | 2.8 h/6 (ref. 89) |
| 58. Oxidation: alcohol to ketone |

|
|
Aerobic soil | 10 to 30 d/3 (ref. 25) |
| Aerobic soil | 37 d/3 (ref. 30) | |||
| 59. Oxidation: alpha fluoro diol to acid fluoride and carboxylic acid with C–C bond cleavage_PTP |

|

|
Activated sludge | 3 d/3 (ref. 71) |
| Activated sludge | 3 d/3 (ref. 76) | |||
| 60. Oxidation: alpha oxidation of an alpha hydroxy fluorotelomer carboxylic acid to a carboxylic acid |
|
|
Rat hepatocytes | 1 to 2 d/6 (ref. 51) |
| Aerobic activated sludge | 240 to 720 h/3 (ref. 29) | |||
| 61. Oxidation: beta hydroxy fluorotelomer acid to beta keto fluorotelomer acid_PTP |

|
|
Rats | PTP/3 (ref. 38) |
| Aerobic soil | PTP/3 (ref. 30) | |||
| 62. Oxidation: alpha hydroxy fluorotelomer aldehyde to beta hydroxy fluorotelomer carboxylic acid_PTP |

|

|
Aerobic soil | PTP/3 (ref. 65) |
| 63. Oxidation: fluorotelomer diol to beta hydroxy fluorotelomer aldehyde_PTP |

|

|
Aerobic soil | PTP/3 (ref. 65) |
| 64. Oxidation: beta-keto aldehyde to beta-keto acid_PTP |

|
|
Trout | PTP/3 (ref. 39) |
| 65. Oxidation: beta oxidation of beta keto fluorotelomer acid |

|
|
Trout | 1 to 3 d/4 (ref. 90) |
| Aerobic soil | PTP/3 (ref. 30) | |||
| 66. Oxidation: fluorotelomer iodide to alpha beta unsaturated fluorotelomer iodide_PTP |

|

|
Aerobic soil | PTP/3 (ref. 65) |
| Rat liver microsomes | PTP/3 (ref. 73) | |||
| 67. Oxidation: fluorotelomer alcohol to fluorotelomer aldehyde |
|

|
Aerobic sediment | 1.8 d/4 (ref. 91) |
|
|
Rat hepatocytes | 1 to 2 d/5 (ref. 51) | ||
| Mixed microbial system | 1.2 d/4 (ref. 92) | |||
| Aerobic soil | 1 to 12 d/4 (ref. 25) | |||
| 68. Oxidation: fluorotelomer alcohol to carboxylic acid with loss of methyl group |

|
|
Aerobic soil | 15 d/2 (ref. 25) |

|
Soil | 370 d/2 (ref. 43) | ||
| Aerobic sediment | 97 d/2 (ref. 91) | |||
| Soybean | <1 day/5 (ref. 74) | |||
| 69. Oxidation: fluorotelomer alcohol to fluorotelomer carboxylic acid with loss of CF2 and methyl groups |

|

|
Soybean | <1 day/5 (ref. 74) |
| Aerobic sediment | 97 d/3 (ref. 91) | |||
| Soil | 22 d/3 (ref. 40) | |||

|
Landfill leachate/sediment | 80 to 90 d/3 (ref. 93) | ||
| 70. Oxidation: fluorotelomer aldehyde to fluorotelomer carboxylic acid |

|
|
Pure water, 37 °C | 60 min/6 (ref. 94) |
|
|
Rat hepatocytes | 30 min/7 (ref. 51) | ||
| Hepatocytes | 30 min/7 (ref. 26) | |||
| 71. Oxidation: fluorotelomer carboxylic acid to 2,3-unsaturated fluorotelomer carboxylic acid |

|

|
Soybean | 4 to 6 d/4 (ref. 74) |
| Aerobic soil | 151 d/2 (ref. 29) | |||
| 72. Oxidation: fluorotelomer polyethoxylate to fluorotelomer ethoxylate aldehyde (PTP) |

|

|
Effluent of waste water treatment plant | 1 d/3 (ref. 95) |
| 73. Oxidation: fluorotelomer ethoxylate aldehyde to fluorotelomer ethoxylate carboxylic acid |
|

|
Effluent of waste water treatment plant | 1 d/3 (ref. 95) |
| 74. Oxidation: fluorotelomer thioether amido sulfonate to fluorotelomer sulfoxide amido sulfonate |
|
|
Soil microcosm | 5 d/4 (ref. 96) |
| 75. Oxidation: fluorotelomer sulfoxide amido sulfonate to fluorotelomer sulfone amido sulfonate |

|
|
Soil microcosm | 35 d/3 (ref. 96) |
| 76. Oxidation: Fluorotelomer sulfonyl amido sulfonate to fluorotelomer sulfonate |

|
|
Soil microcosm | 7 d/3 (ref. 96) |
| 77. Oxidation: hydrodefluorination with alpha oxidation |

|
|
Aerobic soil | 0.35 to 3.5 days/3 (ref. 30) |
| Aerobic soil | 10 to 20 days/3 (ref. 25) | |||
| 78. Oxidation: N-alkyl sulfonamide alcohol to N-alkyl sulfonamide carboxylic acid |

|

|
Anaerobic digestor sludge | 35.8 d/1 (ref. 46) |
|
|
Japanese medaka | 2.8 d/4 (ref. 84) | ||
| Aerobic sediment | 44 d/1 (ref. 83) | |||
| Anaerobic digestor sludge | 1860 d/1 (ref. 46) | |||
| Aerobic activated sludge | 0.71 d/1 (ref. 85) | |||
| 79. Oxidation: sulfinate to sulfonate |

|
|
Activated sludge | 0.73 d/1 (ref. 85) |
| 80. Reduction: 2,3-unsaturated fluorotelomer carboxylic acid to fluorotelomer carboxylic acid |

|
|
Trout | 1 d/4 (ref. 39) |
| Soybean | 1 to 2 d/4 (ref. 49) | |||
| Aerobic soil | 16 d/3 (ref. 30) | |||

|
Soybean | 1 to 2 d/4 (ref. 74) | ||

|
Bacterial culture | Not possible to estimate half-life/3 (ref. 59) | ||
| Activated sludge | Not possible to estimate half-life/3 (ref. 29) | |||
| 81. Reduction: beta fluoro unsaturated telomer acid to beta H unsaturated telomer acid |

|
|
Aerobic soil | 11.8 d/3 (ref. 30) |
| Soybean | 1 to 2 d/4 (ref. 97) | |||
| Mammalian hepatocytes and microsomes | 0.5 d/4 (ref. 26) | |||
| 82. Reduction: hydrogenolysis of chlorinated perfluorinated ether_PTP |

|

|
Trout | PTP/3 (ref. 98) |
| Soil | PTP/3 (ref. 30) | |||
| 83. Reduction: hydrogenolysis of chlorinated perfluorinated ether sulfonate |
|
|
Trout | 1 to 5 days/4 (ref. 98) |
|
|
Trout | 24 d/4 (ref. 98) | ||
| Cyano-cobalamin | 1 min/7 (ref. 99) | |||
| 84. Reduction: ketone to alcohol |

|

|
Aerobic activated sludge | 0.5 to 2 h/3 (ref. 29) |
|
Aerobic soil | 1 to 60 days/3 (ref. 30) | ||
| Trout | 2 h/6 (ref. 26) | |||
| 85. Reduction: perfluoroalkyl sulfonyl fluoride to perfluoroalkyl sulfinic acid |

|
|
Glutathione | 1.1 d/4 (ref. 52) |
|
Glutathione | 0.4 d/4 (ref. 52) | ||
|
|
Glutathione | 1.1 d/4 (ref. 52) | ||
| 86. Reduction: sulfonamide to sulfinic acid |

|
|
Activated sludge | 40 to 80 h/3 (ref. 100) |
|
|
Digester sludge | 20 to 40 d/3 (ref. 46) | ||

|
Digester sludge | 40 to 80 d/3 (ref. 46) | ||

|
Activated sludge | 9.2 d/3 (ref. 85) | ||
| 87. Reduction: vicinal bis-defluorination of unsaturated carboxylic acid_PTP |
|
|
Aerobic soil | 16 d/3 (ref. 30) |
For each of the illustrated examples, the number of TPs and PTPs as a function of generation are summarized in Table 5. The number of generations was selected based on what was required to generate the TPs reported for each example PFAS.
Table 5.
Summary of the testing results for the PFAS illustrated in Fig. 7–12. The parent PFAS on which the test was based, associated reaction systems, and references are provided. The number of TPs and PTPs in the sited studies are provided, as well as the CTS generated TPs and PTPs as a function of the number of generations
| Parent PFAS | Reaction system (ref.) | # of TPs, and (PTPs) in cited studies | # of CTS generated TPs, and (PTPs) as a function of generation [# of generations] |
|---|---|---|---|

|
Activated sludge83,85 | 6 (3) | 2, (3), [5] |
| 3, (3), [6] | |||
| 6, (3), [9] | |||

|
Rat cytosol55 | 5 (3) | 4, (0) [2] |
| 5, (2) [4] | |||

|
Activated sludge29 | 15 (4) | 10, (2), [6] |
| 13, (2), [7] | |||
| 18, (3), [10] | |||
| 25, (5), [16] | |||
|
|
Activated sludge71,76 | 5 (2) | 5, (0), 4 |
| 5, (8), 8 | |||
| 6, (11), 11 | |||

|
Aerobic soil65 | 8 (4) | 5, (4) [5] |
| 12, (4) [8] | |||
| 17, (4) [13] | |||

|
Soybean74 | 6 (7) | 8, (0) [4] |
| 16, (1) [6] | |||
| 22, (1) [9] |
To determine if reaction libraries constructed for general classes of chemicals would have any success in predicting the transformation and metabolism of PFAS in transformation in environmental systems and metabolism for in biological systems, we choose EnviPath for environmental transformations and BioTransformer for both phase I and II metabolisms. These tools were executed through the CTS. Each generalized reaction scheme was illustrated in Table 3 was tested using the appropriate tool. For the sake of brevity, only the first example PFAS illustrated in Table 3 was tested. For each generalized reaction scheme, it was determined if the expected TP was generated and if additional TPs were generated in the first generation of products.
Transformation pathways of PFAS as a function of reaction system
The development of these PFAS reaction libraries is unique in that this effort is focused on a specific class of chemicals and not a specific transformation pathway (e.g., hydrolysis, reduction, photolysis, or aerobic biodegradation), which has been the general approach to date for tools such as the CTS,21 the EAWAG-BBD Pathway Prediction System (PPS),22 METEOR23 and BioTransformer.24 Focus on a specific class of chemicals raises a challenge that results from the fact that the reaction systems reported for the transformation of PFAS are quite diverse compared to those reported for specific transformation pathways. Whereas reaction systems for hydrolysis and photolysis are limited to aquatic systems and abiotic reduction is limited primarily to anaerobic sediments and soils, the environmental reaction systems studied for PFAS transformation include aquatic systems, aerobic activated sludge, anaerobic digester sludge, aerobic and anaerobic soil, marine sediment, landfill leachate, and bacterial cultures. The studied biological reaction systems that form the basis for the PFAS metabolism reaction library include humans, rats, fish, earthworms, soybeans, rat and human hepatocytes, rat and human microsomes and cytosol, and biochemicals such as glutathione and cytochrome-P450. For any single of these reaction systems, a paucity of data prevents us from developing reaction libraries across the full PFAS chemical structure spectrum. Consequently, we are burdened with the inverse: is there sufficient documentation across the PFAS structural spectrum in all reaction systems taken together to enable development of PFAS reaction libraries that can be robustly predictive across diverse environmental and biological reaction systems? Our challenge is to demonstrate that PFAS transformation pathways do not vary considerably from one reaction system to another, thus providing the rationale for the development of PFAS reaction libraries across multiple environmental and biological reaction systems. In addition, because the individual generalized reaction schemes composing the PFAS reaction libraries are assigned relative ranks based on reported kinetic data, we must determine the extent to which PFAS reactivity varies across the reactions systems.
Robustness of reaction pathways across reaction systems
After assembling of the peer-reviewed literature concerning the environmental transformation and metabolism of PFAS, our initial effort was to assess the effects of the reaction system on PFAS reaction pathways and reactivity. Questions to be addressed included:
How do environmental transformation pathways and reactivities vary across similar reaction systems (e.g., aerobic soils)?
How do environmental transformation pathways and reactivities vary across relatively different reaction systems (e.g., aerobic soil compared to mixed or isolated bacterial cultures)?
How do metabolism pathways and reactivities vary across different species (e.g., metabolism in fish, humans, or plants)?
To what extent do transformation pathways in environmental systems inform metabolism pathways in biological systems and vice versa?
Whereas transformation studies for most PFAS are reported in one or only a few systems, fluorotelomer alcohols (FTOHs) degradation and metabolism studies have been reported in multiple reaction systems. Fig. 2 illustrates the transformation pathways for 8–2 FTOH to the terminal PFCAs observed in various reaction systems. Panel A illustrates the results from three separate studies conducted in aerobic soils (question 1 above); panel B illustrates results from studies of three different environmental reaction systems (i.e., anaerobic digester sludge, pseudomonas bacterial strain, and activated sludge; question 2); panel C illustrates results from studies of 8:2 FTOH in four different biological reaction systems (i.e., soybean, rat, trout, and human hepatocytes; question 3). Only experimentally verified TPs are included in the complete transformation pathways of 8:2 FTOH illustrated in Fig. 2.
Fig. 2.

Reaction schemes proposed for the environmental transformation/metabolism of 8:2 FTOH in various reaction systems: panel A (▲) aerobic soil;25 (♦) aerobic soil;30 (■) aerobic soil.34 panel B: (Δ) anaerobic digester sludge;28 (◊) Pseudomonas bacterial strain;35. (□) activated sludge.36 Panel C: (◊) soybean;37 (□) rat;38 (Δ) trout;39 (∇) human hepatocytes.26 The metabolites resulting from phase I metabolism are shown inside the dashed box and those resulting from phase II metabolism are shown outside the dashed box.
Addressing question 1.
Of the twelve total TPs identified across the three experimental studies for the complete transformation of 8:2 FTOH in aerobic soils (Fig. 2: panel A), seven were identified in each of the studies, three of which are the fluorotelomer carboxylic acids (FTCAs). Additionally, four of the identified TPs were common to two of the three studies. The aldehyde was identified by only one investigator.25 Aldehydes are typically reactive intermediates that are readily oxidized to the corresponding carboxylic acid. Detection of the aldehydes requires trapping the aldehyde with 2,4-dinitrophenyl hydrazine to form the stable 2,4-dinitrophenyl hydrazone as described by Nabb et al.26 and Wang et al.25 These results document that there is significant conservation of the transformation pathways for the 8:2 FTOH to the FTCAs across the three separate studies of the aerobic soils.
Addressing question 2.
Of the ten total TPs identified in three environmental reaction systems including anaerobic digester sludge, Pseudomonas bacterial strain and activated sludge (Fig. 2: panel B), four were common to all three of the experimental studies, and five additional TPs were common to two of the studies. One critical difference observed in Fig. 2 (panel B) is that the transformation of 8:2 FTOH in anaerobic digester sludge goes no further than the formation of 7:3 FTUCA, which is a critical intermediate resulting in chain-shortened carboxylic acids such as PFOA and PFHxA. Yu et al.27 studied the degradation pathways of 8:2 FTOH in activated sludge under aerobic, anoxic, and anaerobic conditions. Except for PFOA, the formation of the PFCAs in the anoxic and anaerobic systems was much lower compared to their formation under aerobic conditions. The formation of PFOA, however, was significant in the anaerobic system, which contrasts with the findings of Zhang et al.28 reported above. Additional studies of PFAS in anaerobic systems are required to determine if there are substantial differences in PFAS degradation pathways under varying redox conditions (i.e., aerobic vs. anaerobic). Consistent with our assessment of question 1, the results of these studies support our approach to develop generalized reaction schemes representing multiple environmental reaction systems.
Addressing question 3.
Fig. 2 (panel C) illustrates the metabolism pathways of 8:2 FTOH in four separate biological reaction systems including soybean, rat, trout and human hepatocytes. Compared to the transformation of 8:2 FTOH in environmental reaction systems, the metabolism pathways are more complex with more than twice the number of TPs being formed due to the additional formation of conjugation products (phase II metabolism), which are illustrated outside of the dashed box. Illustrated inside the dashed box are metabolites formed from phase I metabolism of 8:2 FTOH. Of the sixteen phase I metabolites observed, four (i.e., 8:2 FTCA, 7:3 FTCA, 7:2 ketone, and 7:2 sFTOH) are common to the four metabolism studies, whereas eight metabolites are common to three of the metabolism studies. Furthermore, each of the four observed terminal perfluorinated acids (PFPeA, PFHpA, PFOA and PFNA) are common to three of the metabolism studies indicating common pathways across the diverse biological reaction systems, supporting our approach to develop generalized reaction schemes representing multiple metabolic systems.
Addressing question 4.
We can also make a direct comparison of the transformation of 8:2 FTOH in the environmental reaction systems (Fig. 2, panels A and B) to the metabolism of 8:2 FTOH in the biological reaction systems (Fig. 2, panel C). Common to both reaction pathways are the chain shortening reactions (i.e., α- and β-oxidation) for which 7:3 FTUCA serves as a branching point for these pathways. Hydroxylation on the alpha carbon leading to formation of the α-hydroxy FTCA (not shown in Fig. 2) and subsequent loss of one carbon through α-oxidation results in the formation of the 7:2 ketone (Fig. 2, panels A, B and C). Hydroxylation on the β carbon of FTUCA leads to the formation of the β-hydroxy FTCA and subsequent loss of two carbons through β-oxidation (not shown in Fig. 2) to give PFOA. The α-OH 5:3 acid has been identified in the study of 5:3 PFCA in activated sludge29 and the β-OH 7:3 CA has been identified in the study of 8:2 FTCA in aerobic soil,25 and are thus included in the PFAS environmental transformation reaction library. α-Oxidation may also occur through the1-OH FT ketone leading to the formation of the FTCA that has been shortened by one carbon. The intermediate α-hydroxy FT ketone has been convincingly proposed, but not yet identified,30 thus this reaction is included in the PFAS PTP environmental reaction library. These results support the concept that PFAS degradation in environmental reaction systems can be used to inform studies PFAS metabolism in biological conditions and vice versa.
While there is considerable overlap in PFAS transformation pathways in environmental and biological systems, there are also examples of transformations that occur in one reaction system, but not the other. An obvious example of transformations that occur in biological but not environmental systems are the various conjugation reactions that occur in biological organisms to aid in the elimination of xenobiotics from the body. Additionally, some groups of PFAS compounds are transformed to different products in environmental and biological systems. For example, perfluoroalkane sulfonamides (FASAs) have been shown to biodegrade to perfluoroalkylcarboxylic acids under aerobic conditions in the environment31 while their terminal products have generally been reported as perfluoroalkane sulfonic acids in fish32 and earthworms.26,33 Because there are differences in both the transformation pathways and the rates of product formation in environmental and biological systems, we have developed separate reaction libraries for environmental and metabolic transformations.
Results and discussion
Capturing reactivity by assigning relative ranks
In addition to the development of generalized reactions for PFAS, each of the PFAS reaction schemes was provided a relative rank based on reported kinetic data. Table 1 provides the range of half-lives on which the rank assignments were based.21 ChemAxon’s Metabolizer (ChemAxon LLC, Cambridge, MA, U.S.A.) application uses the rank of each scheme to calculate an approximate percentage production of each potential transformation product. First, potential transformation pathways are identified based on the presence of molecular structural fragments that are susceptible to a transformation scheme within the reaction library. For each potential transformation pathway, the “formation rate” of the products of scheme i (fi) is calculated as a function of the rank assigned to the reaction scheme:
In this calculation, the rank is analogous to a dimensionless rate constant in first-order reaction kinetics. The fractional production of the product(s) formed by scheme i is then approximated as the formation rate divided by the sum of formation rates of all Np potential transformation pathways for the molecule:
Table 1.
Rank assignments for the PFAS reaction schemes according to half-lives for environmental transformation or metabolism
| Rank | Range of environmental transformation and metabolism half-lives |
|---|---|
| 7 | <30 min |
| 6 | >30 to <200 min |
| 5 | >200 min to <24 h |
| 4 | >24 h to <7 days |
| 3 | >7 days to <60 days |
| 2 | >60 days to <1 year |
| 1 | >1 year |
Effect of PFAS chain length on transformation pathways and reactivity
An important challenge concerning modeling the environmental fate of PFAS is to determine the magnitude of effect of fluorinated-carbon chain length on environmental and metabolic transformation pathways and reactivity. This is especially the case concerning the industry’s move to using PFAS with shorter lengths to lessen biomagnification and health effects (Brendel et al.103 2018). Concerning the effect of PFAS chain length on transformation pathways, we could not find any evidence that chain length altered transformation pathways, thus supporting our approach of constructing generalized reaction schemes for PFAS of varying chain length.
Concerning reactivity, studies regarding the fate of PFAS in atmospheric settings have found little to no effect of chain-length on transformation rate.40–42 Terrestrial and metabolic transformation-rate data spanning multiple chain-lengths are limited, however several data sets summarized in Table 2 allow for qualitative evaluation. When the half-lives of these studies are plotted as a function of fluorocarbon number (Fig. 3), a few over-arching observations are evident: (i) there is not a consistent pattern for half-lives as a function of fluorocarbon number amongst the depicted PFAS families; (ii) for some PFAS, reported half-life increases with fluorocarbon number (e.g., nFTOHs); (iii) for some PFAS, half-lives can decrease with increasing fluorocarbon number (e.g., sFTOHs and sulfonamides); (iv) the perfluoroalkyl sulfonyl fluorides show no pronounced trend with fluorocarbon number; and (v) within PFAS families, half-lives tend to vary either entirely within a single transformation half-life rank (e.g., nFTOHs and perfluoroalkyl sulfonyl fluorides) or spanning two transformation half-life ranks (e.g., sFTOHs and sulfonamides) at most.
Table 2.
Selected examples of generalized reaction schemes from the PFAS environmental and metabolism reaction libraries including the measured half-lives. The parent PFAS on which the reaction scheme was based, associated reaction systems, and references are provided
| Reaction scheme | Generalized reaction scheme | Parent PFAS | Reaction system | Half-life (reference) |
|---|---|---|---|---|
| Oxidation: fluorotelomer alcohol to fluorotelomer aldehyde intermediate |

|

|
Aerobic soil/sediment | 1.6 d (ref. 43) |
|
<7 d (ref. 25) | |||
| Oxidation: fluorotelomer alcohol to carboxylic acid with loss of methyl group |

|

|
Aerobic soil/sediment | 75 d (ref. 43) |

|
40 d (ref. 44) | |||
| Reduction: perfluoroalkyl sulfonyl fluoride to perfluoroalkyl sulfinic acid |

|

|
Glutathione | 1 d (ref. 45) |

|
0.4 d (ref. 45) | |||
|
1 d (ref. 45) | |||
| Reduction: sulfonamide to sulfinic acid |

|

|
Digester sludge | 40–100 d (ref. 46) |

|
40–100 d (ref. 46) |
Fig. 3.

Environmental and metabolism half-lives (from Table 2) as a function of fluorocarbon number.
Considering these atmospheric, terrestrial/aquatic and metabolism studies, available data suggest little to no uniform systematic effect of chain length on reaction pathway or half-life. So, based on these observations, our approach of characterizing generalized reaction schemes, neglecting perfluorocarbon chain-length, is an informative exercise.
Development of generalized reaction schemes for PFAS environmental transformation and metabolism
The complete list of generalized schemes for the environmental transformations and metabolism reaction libraries, the reaction systems, observed half-life values, associated rankings, and references are provided in Table 3. The data for the combined libraries is presented to allow for easier comparison of the individual generalized reaction schemes and their assigned ranks based on reported half-lives for the various environmental and biological reaction systems. Based on the analysis of more than 150 relevant reaction schemes published in the peer-reviewed literature, we have developed generalized reaction schemes for both the PFAS environmental and metabolism reaction libraries. A total of 87 generalized reaction schemes were developed for the PFAS reaction libraries. The environmental reaction consists of 52 generalized reaction schemes of which 12 are for PTPs. The metabolism reaction library consists of 44 generalized reaction schemes, of which 11 are for PTPs. The PFAS reaction libraries have 31 generalized reaction schemes in common. Thirty reaction schemes are common to both libraries reflecting considerable commonality of the PFAS reaction schemes across the two PFAS reaction libraries. Additionally, 21 of the metabolism reaction schemes represent the formation of conjugates (phase II metabolism) and the subsequent metabolism of the conjugates.
When a user submits a molecule of interest in the CTS generate transformation products workflow, CTS compares the molecule to the reactant side of each scheme within the reaction library. If CTS finds a match between a structural fragment within the molecule and the reactant side of a scheme, it modifies the fragment according to the scheme, leaving the rest of the molecule unchanged. Because a molecule may contain multiple structural fragments that match the reactant side of different reaction schemes, multiple products can be generated from the parent molecule. If the user requests more than one generation of products, CTS will apply the same process to generate transformation products for each predicted product of the parent molecule.
For molecules that can be transformed into more than one product, the relative amounts of each product are estimated based on the ranks assigned to the schemes that generate the products. Faster schemes are assigned higher ranks, resulting in higher fractional formation amounts for the associated products. Scheme rank assignments were made based on the half-life values shown in Table 3 according to the bins defined in Table 1. These half-life values were measured in a variety of reaction systems. Table 3 includes metabolism half-lives measured in both in vivo and in vitro studies for a variety of species (rat, trout, humans, and soybean). It is worth noting that enzyme systems may not be conserved across species, and that in vitro studies may not capture the full complement of enzymatic transformations and elimination processes active in whole organisms. Similarly, the environmental transformation half-lives compiled in Table 3 were measured in a variety of experimental systems, including aqueous solutions, aerobic activated sludge, anaerobic digester sludge, aerobic and anaerobic soil, marine sediment, landfill leachate, and bacterial cultures. These reaction systems differ vastly in terms of microbial abundance and community structure, as well as redox conditions. Given the variety of reaction systems included in Table 3, it should not be surprising to find variability in the reported transformation half-life values; however, for each library, the half-life values for the example molecules transformed by a particular scheme generally result in the same rank assignment.
The types and numbers of the reaction processes included in the environmental transformation and metabolism reaction libraries are summarized in Table 4. Hydrolysis and oxidation are the most common reaction processes documented in the environmental transformation reaction library, whereas conjugation, hydrolysis and oxidation are the most common reaction processes documented in the metabolism reaction library.
Table 4.
Summary of the type and number of reaction processes documented in the PFAS reaction libraries
| Reaction process | Environmental | Metabolism |
|---|---|---|
| Conjugation | 0 | 21 |
| Decarboxylation | 3 | 1 |
| Desulfonation | 1 | 0 |
| Epoxidation | 0 | 1 |
| Hydrolysis | 16 | 14 |
| Hydroxylation | 3 | 2 |
| N-Deacetylation | 2 | 4 |
| N-Dealkylation | 1 | 1 |
| Demethylation | 0 | 4 |
| Oxidation | 21 | 11 |
| Reduction | 6 | 6 |
| Total | 53 | 65 |
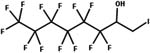
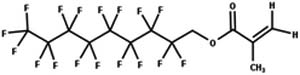
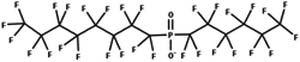
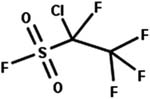
The PFAS functional groups included in the PFAS reaction libraries are illustrated in Fig. 4, which includes 21 functional groups. To determine the extent of our coverage of the PFAS functional groups we compared it to that of a chemical category-based (i.e., functional groups) prioritized list of PFAS selected for tiered toxicity and toxicokinetic testing. These PFAS were selected based on a prioritization scheme that in part considered EPA’s priorities and exposure/occurrence considerations.101 Of the 17 PFAS functional groups identified in this toxicity prioritization scheme, our PFAS reaction libraries covered all but three, i.e., fluorotelomer amines, perfluoroalkyl amino alcohols, and semi-fluorinated alkanes. Examples of these PFAS functional groups as well as several others that are not included in the PFAS reaction libraries are illustrated in Fig. 5. As far as we can ascertain, there is no information in the peer-reviewed literature concerning the environmental transformation or metabolism of PFAS with these functional groups. Considering that there are thousands of known PFAS with chemical structures, we anticipate that the number of PFAS functionals groups in both Fig. 4 and 5 will increase substantially.
Fig. 4.

The PFAS functional groups included in the PFAS reaction libraries.
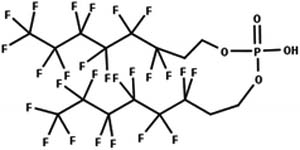
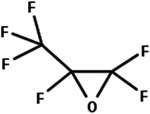
Fig. 5.

PFAS functional groups currently not included in the PFAS reaction libraries.
Several general observations can be made of the data summarized in Table 3. First, PFAS as a class of chemicals overall are more reactive than expected based on the lack of persistence of PFCAs and PFOS reported in environmental and biological reaction systems. The majority of the PFAS have half-lives ranging from days to hours in environmental and biological systems. The exceptions, which have assigned ranks of 1 (half-life of >1 year) or 2 (half-life of >60 days to < 1 year), include desulfonation of fluorotelomer sulfonates to fluorotelomer alcohols in landfill leachate, the hydrolysis of fluorotelomer urethanes to fluorotelomer alcohols, the oxidation of fluorotelomer alcohols to fluorotelomer carboxylic acids in aerobic soils with the loss of −CF2 and −CH3 groups, reduction of ketones to alcohols by glutathione, and the reduction of perfluoroalkyl sulfonyl fluorides to perfluoroalkyl sulfinic acids by glutathione. The oxidation of N-alkyl sulfonamide alcohols to N-alkyl sulfonamide carboxylic acids show the greatest range in reactivity with a half-life range suggesting a rank of 1 in anaerobic digester sludge and 5 in aerobic activated sludge.
For the most part the data are showing a relatively narrow range for the assigned ranks. To better illustrate this result, the ranges in half-lives that would be assigned based on the reported half-life for each of the generalized reactions that are based on studies of three or more reaction systems are summarized in Fig. 6. For all but one of the reaction schemes, the median half-life values fall within the range associated with ranks 3 to 5 (i.e., hours to days). The exception is the oxidation of a fluorotelomer aldehyde to a fluorotelomer carboxylic acid, which is a fast reaction with a median reported half-life of 30 minutes, giving it a rank assignment of 6. Some of the schemes show considerable spread in reported half-life values, which should not be surprising considering the ranks represent half-lives measured for numerous reaction processes for a variety a PFAS in a variety of environmental and biological reaction systems.
Fig. 6.

Generalized reaction schemes that are based on studies of three or more reaction systems as a function of assigned ranks based on measured half-lives.
To justify the need to develop PFAS specific reaction libraries used to predict environmental transformation in environmental systems and metabolism in biological systems, we thought it would be a valuable exercise to determine if reaction libraries constructed for general classes of chemicals would have any success in predicting the formation of PFAS resulting from transformation in environmental systems and metabolism for in biological systems. The tools we choose for this purpose was EnviPath, which is a prediction system for the microbial biotransformation of organic environmental contaminant and the Biotransformer software tool that predicts small molecule metabolism in mammals, their gut microbiota, as well as the soil/aquatic microbiota. Among other reaction libraries, Biotransformer consists of a the CYP450 (phase I) transformer for phase 1 metabolism and the phase II transformer for predicting metabolic conjugation reactions. These predictive tools were not developed with PFAS transformation as a focus.
In summary, of the 47 reaction schemes in (Table S1† in ESI material) for environmental transformations tested by EnviPath, 30 did not form the predicted TP based on the reaction scheme and the parent PFAS. Also, 15 did not form did not form any TPs. Of the 43 reaction schemes in Table S1† for metabolism tested by the BioTransformer Phase I Transformer, 13 of the generalized reaction schemes did not form the predicted TP based on the reaction and the parent PFAS. Additionally, 15 of the reaction schemes did not form any TPs. These reaction libraries for EnviPath and BioTransformer were not developed with PFAS in mind. These results are not surprising and should not be taken as a criticism of EnviPath and BioTransformer, which are both excellent tools for predicting the formation of TPs for the classes of chemicals on which they were trained. These data further justify the need for the development of reaction libraries for predicting the environmental transformation and metabolism of PFAS based solely on the metabolism studies of PFAS published in the peer-reviewed literature. Taken together with the testing results summarized below for the phase II metabolism of PFAS shown in Table S2,† these results further demonstrate that the PFAS are a unique class of chemicals. The rules governing the transformation and metabolism of most classes of chemical do not readily apply to PFAS.
In summary, of the 21 conjugation reaction schemes tested in Table S2,† 16 did not form the predicted TP based on the generalized reaction scheme and the parent PFAS. Also, one of the generalized reaction schemes did not form any TPs. These reaction libraries for the BioTransformer Phase II Transformer were not developed with PFAS in mind. Again, these results are not surprising and further justify the need for the development of reaction libraries for predicting the metabolism of PFAS based solely on the metabolism studies of PFAS published in the peer-reviewed literature.
Testing of the PFAS reaction libraries
Due to widespread gaps in the peer reviewed literature for PFAS environmental and metabolism pathways, we were forced to use all the data in the construction of the PFAS reaction libraries. As a result, our testing of the PFAS reaction libraries is limited to testing the extent to which execution of PFAS libraries can duplicate reactions schemes published in the peer-reviewed literature. The criteria for the selection of the reaction schemes for testing is based on including only papers with reaction schemes that report transformation products from three or more generalized reaction schemes illustrated in Table 3. As a result, these papers contain complex transformation trees illustrating multiple steps in the transformation of the specified PFAS. Additionally, selection of PFAS for testing that met this criterion were then based on obtaining results from a wide range of PFAS functional groups in several different environmental and biological reaction systems.
The user will have the option to select the number of generations of TPs and PTPs to be generated in executing the PFAS reaction libraries through the CTS. Obviously the greater the number of generations the greater the number of generated TPs and PTPs. Execution of multiple generations will allow the user to essentially extend the time of the experiment to generate additional TPs not reported in the cited papers. This is especially the case for chain-shortening transformations such as alpha and beta oxidation resulting in chain-shortened perfluorinated carboxylic acids.
In Fig. 7–12, each TP and PTP is labeled with the generation in which they were formed by execution of either the environmental or metabolism reaction library (e.g., 3.2 indicates the 2nd transformation product formed in the 3rd generation of the generated pathway). This approach gives the user some knowledge of the number of generations required to generate all the experimentally confirmed TPs and the accompanying increase in the number of TPs and PTPs required to generate the full list of experimentally confirmed TPs. For each of the illustrated examples, the number of TPs and PTPs as a function of generation are captured in Table 5. The number of generations was selected based on what was required to generate the TPs reported for each example PFAS.
Fig. 7.

Proposed transformation pathway for N-EtFOSE based on combined results of Rhoads et al.85 in activated sludge and Benskin et al.83 in marine sediment combined with the transformation pathways based on the execution of the PFAS environmental reaction library. Transformation products experimentally identified by the investigators are shown with boxes. Transformation products proposed by the investigators are shown with brackets. Associated with the PFAS names are the generation number for which the TPs and PTPs were formed by the CTS. TP designates transformation products formed by experimentally verified transformation or metabolism pathways generated by the CTS whereas PTP designates proposed transformation products based on proposed transformation or metabolism pathways generated by the CTS.
Fig. 12.
Proposed transformation pathway for 6:2 FTOH in soybean seedlings48– combined with the transformation pathways based on the execution of the PFAS metabolism reaction library. Associated with the PFAS names are the generation number for which the TPs and PTPs were formed by the CTS. TP designates transformation products formed by experimentally verified transformation or metabolism pathways generated by the CTS whereas PTP designates proposed transformation products based on proposed transformation or metabolism pathways generated by the CTS. Transformation products experimentally identified by the investigators are shown with boxes. Transformation products proposed by the investigators are shown with brackets. TPs and PTPs generated by the CTS, but not experimentally identified or proposed by Zhang et al.,48 are shown with hashed boxes.
The proposed transformation pathway for N-EtFOSE based on combined results of Rhoads et al.85 in activated sludge and Benskin et al.83 in marine sediment is illustrated in Fig. 7. Six generations were required to provide the experimentally identified TPs. Each of the proposed PFAS intermediates proposed by the investigators (shown in brackets) were correctly labeled as PTPs by the CTS. Transformation of N-EtFOSE is proposed to occur through oxidation to form the aldehyde (N-EtFOSA Aldehyde) (pathway A) and subsequently to the carboxylic acid (N-EtFOSAA) (pathway B). N-Deacetylation of N-EtFOSAA then leads to the formation of N-EtFOSA (pathway C) followed by C-hydroxylation to form FOSE. Oxidation of FOSE to FOSAA is proposed to occur through the FOSE aldehyde. N-Deacetylation of FOSAA to form FOSA (pathway G) is then observed. FOSA may also form directly from the N-dealkylation of N-EtFOSA (pathway J) as reported by Rhoads et al.85 in activated sludge, which is captured as 4.2-TP and 7.1-TP. As a result, the formation of PFOSI and PFOS that form from FOSA (pathways H and I) also appear as duplicate products. The formation of PFOS, the terminal product, occurs through deamination of FOSA to form PFOSI (pathway H). Subsequent oxidation of PFOSI leads to the formation of PFOS (pathway I).
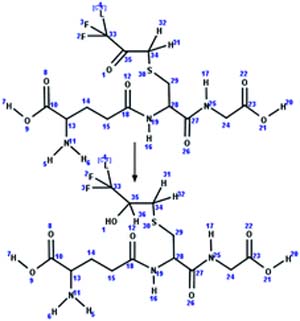
The proposed transformation pathway for the metabolism of fluoromethyl 2,2,2-trifluoro-1-[trifluoromethyl] ethyl ether (FDVE) in rat cytosol55 is illustrated in Fig. 8. Two parallel pathways (A and B) for the metabolism of FDVE are proposed that begin with the reaction of FDVE with glutathione. Pathway A illustrates the formation of the glutathione conjugates that form from the nucleophilic addition across the CC double bond to form FMPFPrpyl-GS and pathway B illustrates the nucleophilic substitution of F− at the vinyl C of the double bond to form FMPFPrpenyl-GS. Both glutathione conjugates hydrolyze to form the respective cysteine conjugates (FMPFPrpyl-CYS and FMPFPrpenyl-CYS) (pathways D and G). Subsequent hydrolysis of the cysteine conjugates leads to the formation of the respective thiols (FMPFPrpenyl-SH and FMPFPrpenyl-SH) (pathways E and H), which are proposed intermediates. Both thiols were hydrolyzed to give the proposed intermediate FMPFPrproyl-F, which was further hydrolyzed to give the terminal carboxylic acid (FMPFPrCA) (pathway I).
Fig. 8.

The proposed transformation scheme for fluoromethyl 2,2,2-trifluoro-1-[trifluoromethyl] ethyl ether (FDVE) in rat cytosol55 combined with the transformation pathways based on the execution of the PFAS metabolism reaction library. Associated with the PFAS names are the generation numbers for which the TPs and PTPs were formed by the CTS. TP designates transformation products formed by experimentally verified transformation or metabolism pathways generated by the CTS whereas PTP designates proposed transformation products based on proposed transformation or metabolism pathways generated by the CTS. Transformation products experimentally identified by the investigators are shown with boxes. Transformation products proposed by the investigators are shown with brackets.
As illustrated by Fig. 8 and summarized in Table S2,† 6 generations of products based on execution of the CTS were required to generate each of the experimentally identified transformation products. Except for FMPFPrproyl-F, all the TPs and PTS were predicted to form by the PFAS reaction library. We concluded that FMPFPrproyl-F is a very reactive intermediate that cannot be experimentally identified, and thus the pathway for its formation is not included in the PFAS metabolism reaction library.
The proposed transformation scheme for 5:3 FTCA in aerobic activated sludge29 is illustrated in Fig. 9. Pathways A and B illustrate the pathways that the investigators refer to as the “one −CF2- removal pathway” in which 5:3 FTCA gives 4:3 FTCA (pathway A) and 4:3 FTCA gives 3:3 FTCA (pathway B), respectively, through a series of intermediates that involves alpha oxidation as the key chain-shortening transformation pathways (i.e., pathways a2 and b2). Pathway C illustrates the pathway leading to the formation of the terminal products PFPeA and PFBA. In the original manuscript, the investigators illustrate this pathway using double arrows to indicate multiple transformation steps leading to the formation of PFPeA and PFBA beginning with 5:2 FTUCA. As shown below, pathway C must start with the formation of 4:3 FTUCA (pathway c1), because the vinyl F must be removed through reduction prior to β-hydroxylation.
Fig. 9.

The proposed reaction scheme for the transformation of 5:3 FTCA in aerobic activated sludge reconstructed from Wang et al.29 combined with the transformation pathways based on the execution of the PFAS environmental reaction library. Associated with the PFAS names are the generation number for which the TPs and PTPs were formed by the CTS. TP designates transformation products formed by experimentally verified transformation or metabolism pathways generated by the CTS whereas PTP designates proposed transformation products based on proposed transformation or metabolism pathways generated by the CTS. Transformation products experimentally identified by the investigators are shown with boxes. Transformation products proposed by the investigators are shown with brackets. TPs and PTPs generated by the CTS, but not identified or proposed by Wang et al.29 are shown with hashed boxes.
This is an example of CTS predictions expanding the original published pathway based on the execution of reaction schemes constructed from published studies conducted in other environmental reaction systems. In this case, β-hydroxylation of 5:2 FTUCA to form 3-OH 4:3 FTUA (pathway c2) has been observed in aerobic soil.25 Likewise, pathway D illustrates an alternative pathway generated by the CTS for the formation of PFPeA, which in this case is initiated by the β-hydroxylation of 5:3 FTUCA leading to give 3-O 5:3 FTCA (pathway d1). PFHxA is also formed through pathway D, which was not identified in the original study of 5:3 FTCA in aerobic activated sludge. The formation of PFHxA (pathway d4) and PFPeA (pathway d5) from the oxidation of 5:2 sFTOH has been observed in an aerobic river sediment system.91 Pathway E illustrates the additional formation of plausible TPs generated by the CTS that were not identified in the cited study. Further continuation of pathway E through a pathway analogous to pathways C and D would result in the formation of the chain-shorted acids PFPrA and PFBA (structures not shown).
Although Ruan et al.65 show 6:2 FTI as the key intermediate that leads to the formation of PFPeA, PFHxA, and 4:3 FTUCA, we concluded that it is actually 5:3 UFTCA is the key intermediate, which forms from 6:2 FTI through multiple steps (pathways d1–d4), that forms PFPeA through multiple intermediates (pathways e1–e8), PFHXA through multiple intermediates (pathways g1–g3), and 4:3 UFTCA through multiple intermediates (pathways f1–f5) as illustrated in Fig. 10. PFAS intermediates that are common to the formation of PFHxA and 4:3 FTUCA include 2-OH 5:3 FTCA, 5:2 FTAl, 5:2 FTCA, and 5:2 FTUCA (pathways e2–e5 and f2–f5).
Fig. 10.
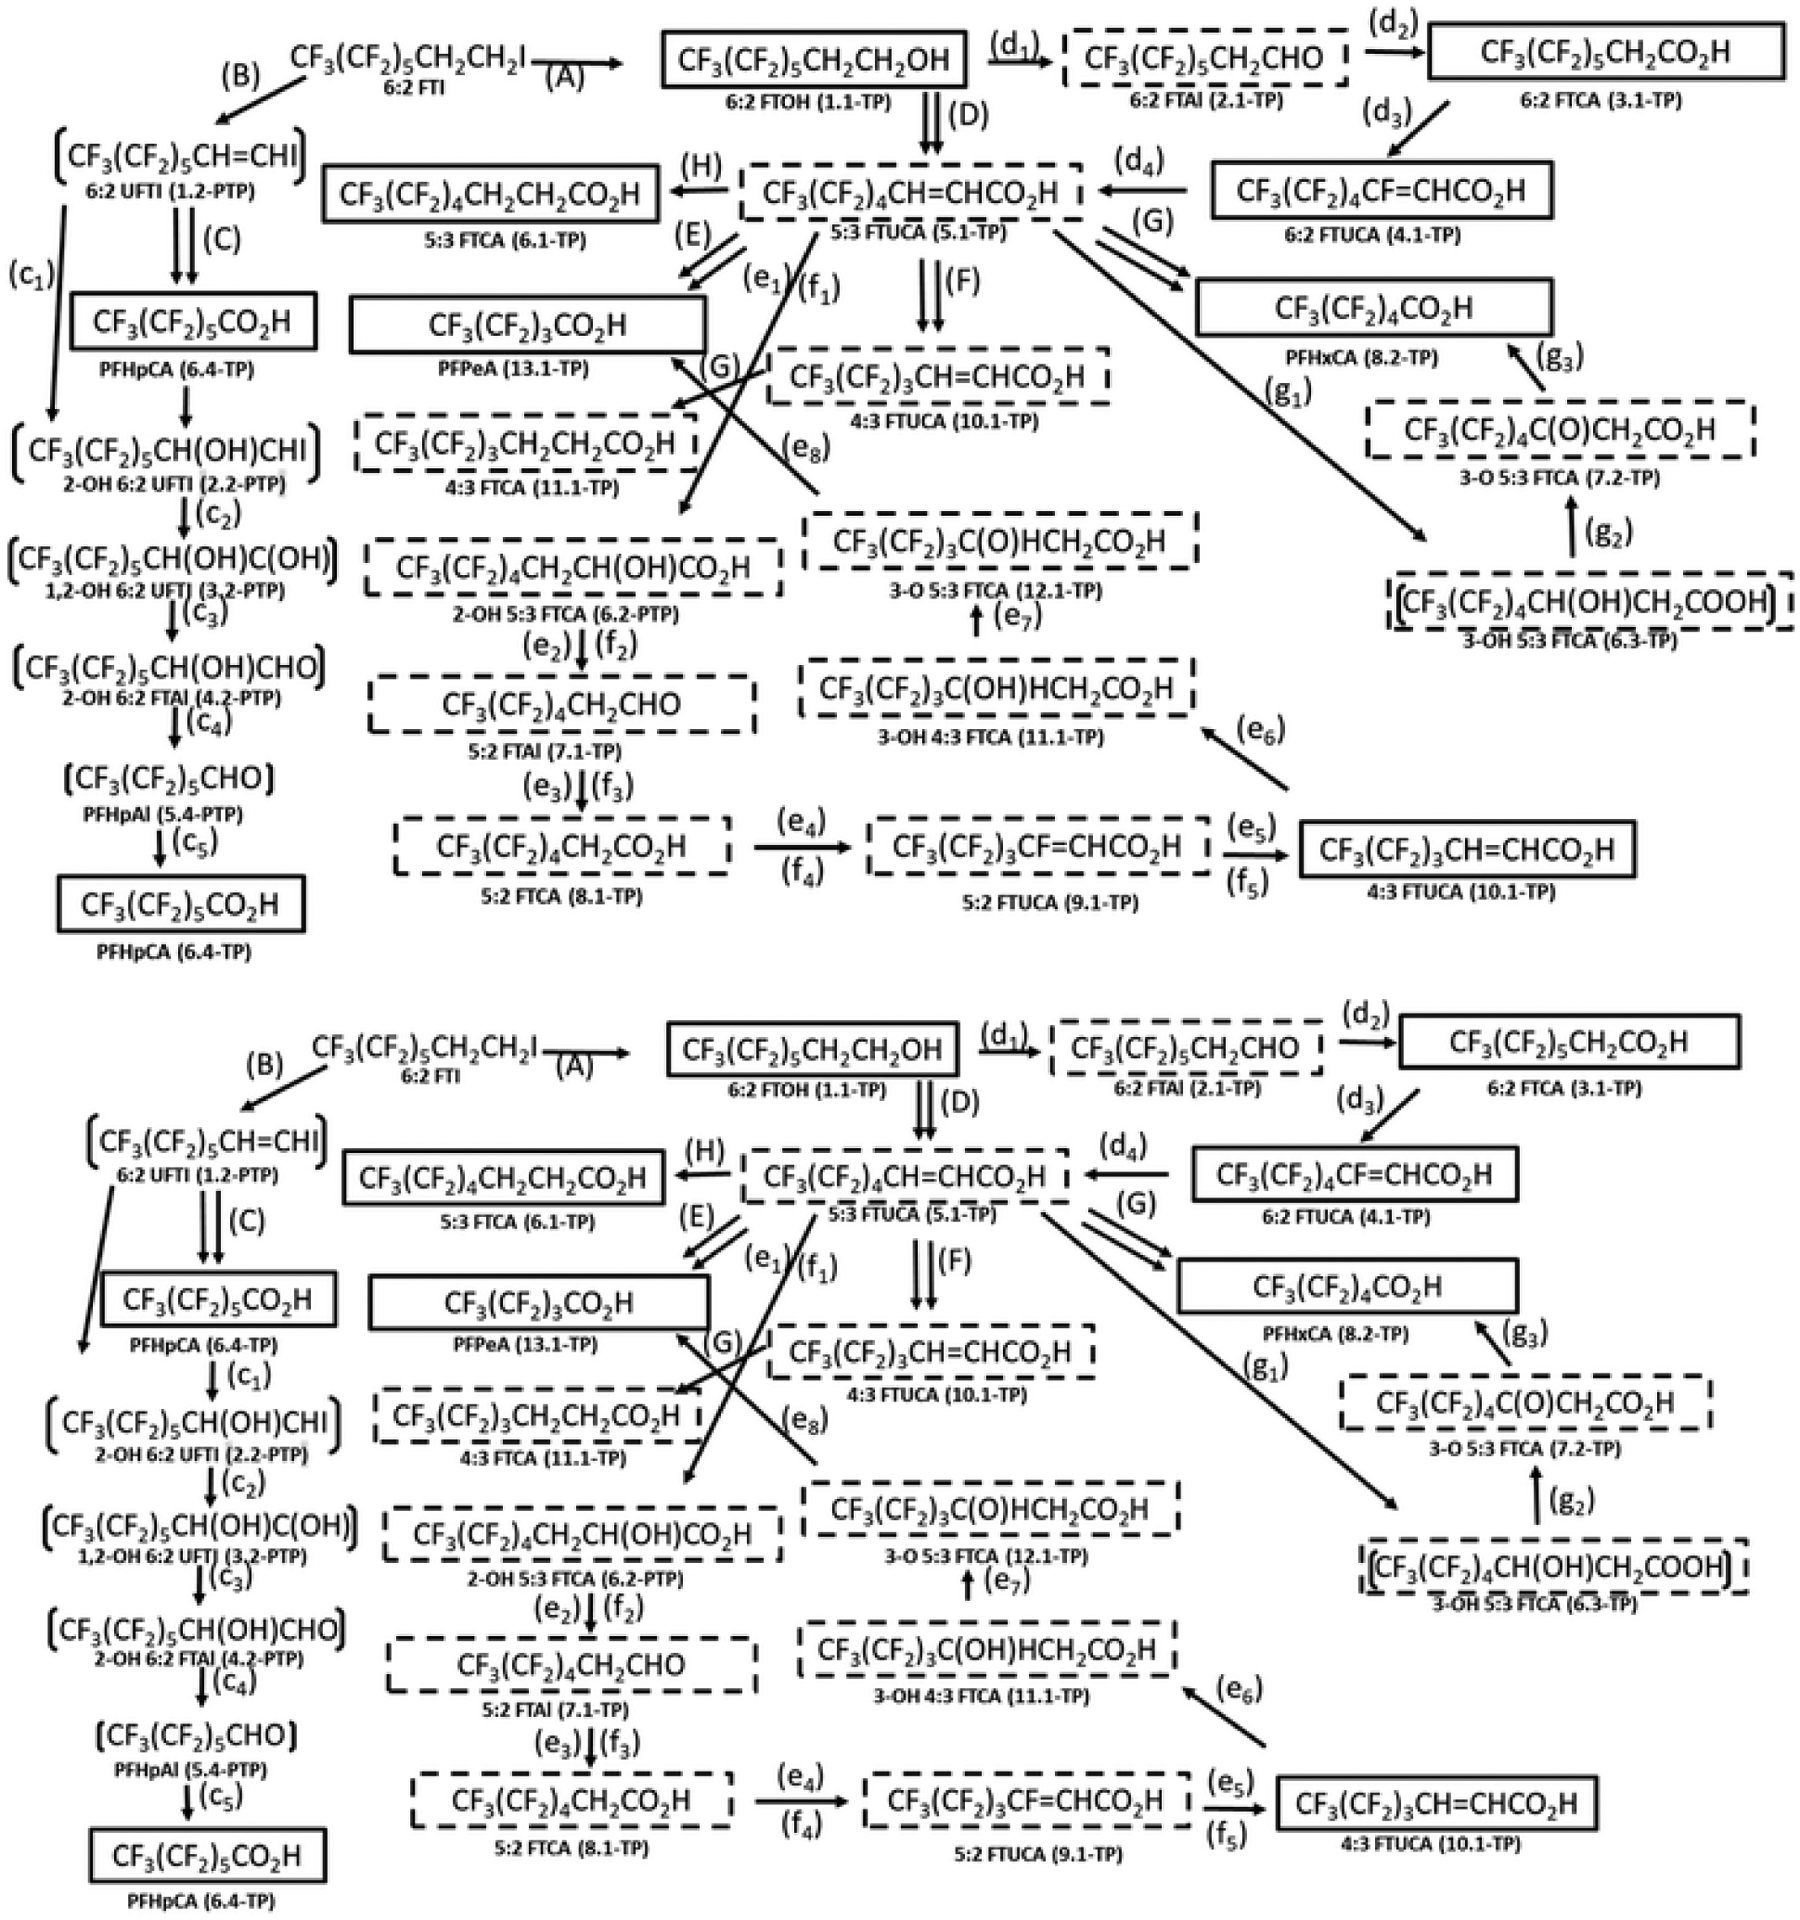
The proposed reaction scheme for the transformation of 6:2 FTI in aerobic soil65 combined with the transformation pathways based on the execution of the PFAS environmental reaction library. Associated with the PFAS names are the generation number for which the TPs and PTPs were formed by the CTS. TP designates transformation products formed by experimentally verified transformation or metabolism pathways generated by the CTS whereas PTP designates proposed transformation products based on proposed transformation or metabolism pathways generated by the CTS. Transformation products experimentally identified by the investigators are shown with boxes. Transformation products proposed by the investigators are shown with brackets. TPs and PTPs generated by the CTS, but not experimentally identified or proposed by Ruan et al.,65 are shown with hashed boxes.
The proposed transformation pathway for the transformation of 1H,1H,2H,2H,8H,8H-perfluorododecanol, which is referred to as DTFA (degradable telomer fluoro alcohol), in activated sludge71,76 is illustrated in Fig. 11. Incorporation of a methylene group (–CH2–) into the fluorinated carbon backbone is designed to make this PFAS more susceptible to chain shortening biotransformation processes resulting in the formation of carboxylic acids with carbon lengths of four and five carbons. The experimentally verified TPs initially reported by Arakaki et al. 2010 (ref. 71) and later expanded on by Arakaki et al.76 are shown with boxes in Fig. 11.
Fig. 11.
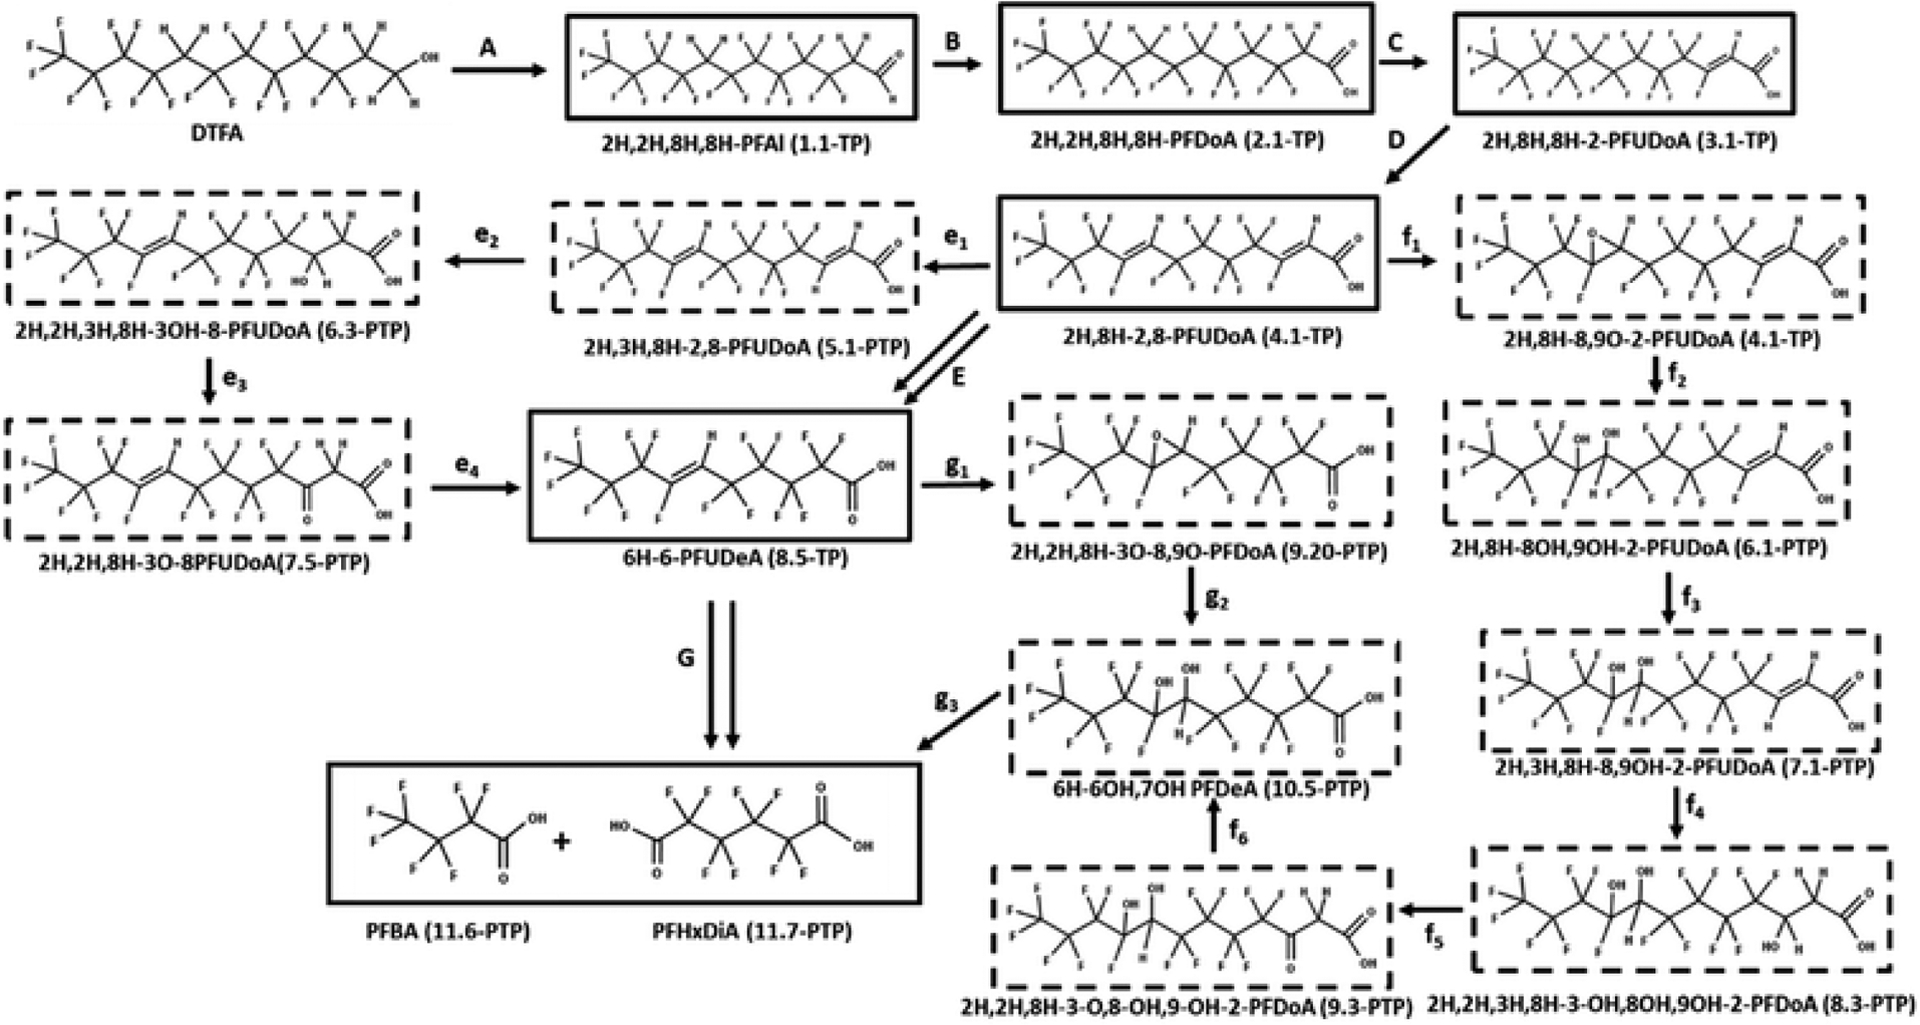
Proposed transformation pathway for DTFA in activated sludge71,76 combined with the transformation pathways based on the execution of the PFAS environmental reaction library. Associated with the PFAS names are the generation number for which the TPs and PTPs were formed by the CTS. TP designates transformation products formed by experimentally verified transformation or metabolism pathways generated by the CTS whereas PTP designates proposed transformation products based on proposed transformation or metabolism pathways generated by the CTS. Transformation products experimentally identified by the investigators are shown with boxes. TPs and PTPs generated by the CTS, but not experimentally identified or proposed by Arakaki et al.,71,76 are shown with hashed boxes.
The transformation of DTFA follows the known transformation pathway of fluorotelomer alcohols in aerobic soils. As illustrated in Fig. 11, oxidation of DTFA results initially in the formation of the aldehyde (2H,2H,8H,8H-PFAl) (pathway A) and subsequently the carboxylic acid (2H,2H,8H,8H-PFDoA) (pathway B), which is hydrolyzed to give the unsaturated carboxylic acid (2H,8H,8H-2-PFDoA) through loss of HF (pathway C). Further loss of HF from 2H,8H,8H-2-PFUDoA through hydrolysis gives 2H,8H-2,8-PFuDoA (pathway D). The formation of 2H,8H-2,8-PFUDoA represents a key branching point for which four pathways to the chain-shortened, terminal carboxylic acids are proposed by Arakaki,76 ultimately leading to the formation of the chain shortened fluorotelomer carboxylic acids. For the sake of simplicity, we follow only pathway 1 and subsequently the formation of 6-H-6-PFUOA as presented in Arakaki, et al.76 and shown as pathway E in Fig. 11. Arakaki et al.76 use double arrows to indicate multiple transformation steps leading to the formation of 6H 6 PFUDA from 2H,8H-2,8-PFUDoA. Pathways e1 through e4 are generated by execution of CTS prediction expanding the original published pathway based on the execution of reaction schemes constructed from published studies conducted in other environmental reaction systems by providing plausible chemical structures for these intermediate transformation products. The formation of 6H 6 PFUDA from 2H,8H-2,8-PFUDoA requires the loss of two carbons, which suggests transformation occurring through β-oxidation. Consistent with the transformation of 8–2 fluorotelomer alcohols (Fig. 1), the β-oxidation of 2H,8H-2,8-PFUDoA is initiated with hydrodefluorination of 2H,8H-2,8-PFUDoA to give 2H,3H,8H-2,8-PFUDoA, which is then hydroxylated in the β-position to give 2H,3H,8H-3-OH-8-PFUDoA. Subsequent oxidation of 2H,3H,8H-3OH-2,8-PFUDoA gives 2H,3H,8H-3-O-2,8 PFUDoA. β-Oxidation of 3-keto 2H,3H,8H-3-OH-8-PFUDOA results in the formation of 6H-6-PFUOA,71 which suggests that further transformation of 6H-6-PFUOA requires cleavage of the CC double bond through an oxidation process such as epoxidation as suggested by Arakaki et al.71 As generated by execution of the PFAS reaction library, formation of the epoxide across the CF=CH bond gives 6,7O-PFDeA (pathway g1), which upon hydrolysis gives the diol (6-H,6OH,7OH-PFDeA). Oxidative cleavage of the diol would result in the formation of the stable terminal products PFBA and PFHxDiA.102 It should be noted that the formation of PFHxDiA was reported in Arakaki, et al.,71 but not in Arakaki, et al.76 Each of the PFAS terminal products experimentally verified by Arakaki et al.76 were generated by the PFAS environmental reaction library.
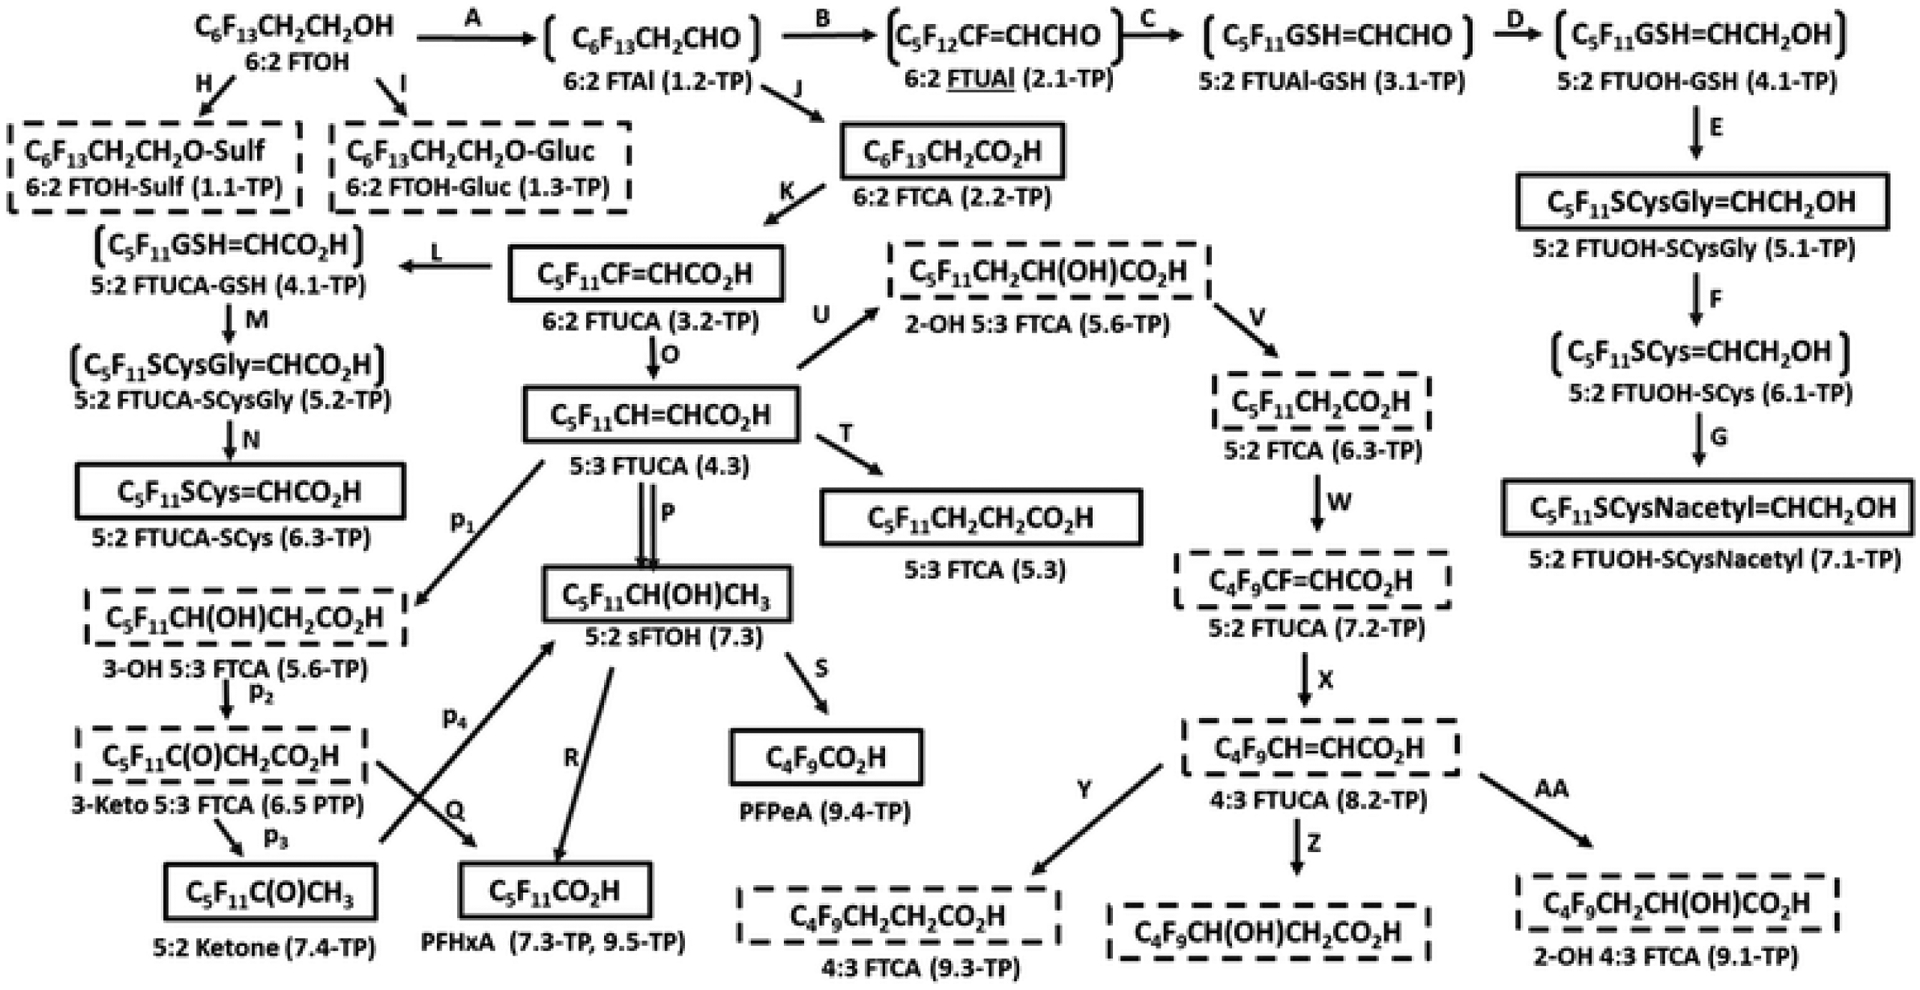
The proposed transformation pathway for 6:2 FTOH in soybean seedlings48 combined with the transformation pathways based on the execution of the PFAS metabolism reaction library is illustrated in Fig. 12. The 6:2 FTOH is initially oxidized to form 6:2 FTAl (pathway A) and subsequently to 6:2 FTUAl (pathway B). Alternatively, 6:2 FTOH can be oxidized to 6:2 FTCA (pathway J), which is then further oxidized to give 6:2 FTUCA (pathway K), which is then reduced to give a key branching point in the metabolism of 6:2 FTOH, that is, 5:3 FTUCA (pathway O). Although 6:2 FTUCA is shown to form 5:2 sFTOH in one step in the original manuscript,48 it is actually a multistep process as shown in Fig. 12 (pathway P) based on the execution of PFAS metabolism reaction library. 5:3 FTUCA is initially hydroxylated to give 3-OH 5:3 FTOH (pathway p1), which is subsequently oxidized to form 3-keto 5:3 FTCA (pathway p2). 3-Keto 5:3 FTCA is then undergoes α-decarboxylation to give 5:2 ketone (pathway p3), which then forms 5:2 sFTOH (pathway p4). 5:2 sFTOH is metabolized further to give the terminal carboxylic acids, that is, PFHxA (pathway R) and PFPeA (pathway S). PFHxA can also form from the β-oxidation of 3-keto 5:3 FTOH (pathway Q). 5:3 FTUCA can be hydroxylated to form 2-OH 5:3 FTCA (pathway U) and reduced to form 5:3 FTCA (pathway T). 2-OH 5:3 FTCA undergoes α-decarboxylation to form 5:2 FTCA (pathway W), which is subsequently reduced to form 4:3 FTUCA (pathway X). 4:3 FTUCA can then be reduced to form 4:3 FTCA (pathway Y) and hydroxylated to form 3-OH 4:3 FTCA (pathway Z) and 2-OH 4:3 FTCA (pathway AA).
The CTS predicts the formation of several conjugates based on experimentally verified reactions schemes constructed from other biological reaction systems that were not identified or proposed in the current study. These conjugates include 6:2 FTOH-Sulf (pathway H), 6:2 FTOH-Gluc (pathway J), 5:2 FTUCA-GSH (pathway L) and 5:2 FTUCA-SCysGl (pathway M). The formation of the conjugates 5:2 FTUAL-GS (pathway C), 5:2 FTUOH-GSH (pathway D), 5:2 FTUOH-SCys (pathway F) and 5:2 FTUCA-GSH (pathway L) and 5:2 FTUCA-SCysGly are proposed by the investigators based on the identification of downstream conjugates including 5:2 FTUOH-SCys (pathway E) and 5:2 FTUOH-SCysNacetyl (pathway G) and 5:2 FTUCA-SCys (pathway N).
The results summarized in Table 5 indicate that all the experimentally confirmed TPs for each of the reaction trees were generated by execution of the PFAS reaction libraries. The number of generations required to produce the experimentally confirmed TPs varied with each tested PFAS. Additionally, for three of the PFAS (i.e., 6:2 FTCA, 6:2 FTI, and 6:2 FTOH) the number of CTS generated TPs was significantly greater than the number of experimentally verified TPs based on the number of generations required to produce all the reported experimentally verified TPs. For example, 5 of the 15 experimentally confirmed TPs and 1 of the 4 proposed TPs reported by Wang et al.29 for 6:2 FTCA in aerobic soil were produced after 6 generations. These numbers increased to 15 for the experimentally confirmed TPs and 4 for the PTPs after 16 generations, which was the number of generations required to form all the experimentally confirmed TPs. This increase in the number of PTPs is attributed to the formation of the PFAS chain-shortened intermediates, which include the alpha- and beta-OH FTCAs and the saturated and unsaturated FTCAs of varying chain length.
Summary
Reaction libraries capturing the transformation pathways of PFAS in environmental systems and metabolism in biological systems have been developed. These reaction libraries for producing PFAS TPs and PTPs will be executed through the CTS. The environmental PFAS reaction consists of 51 generalized reaction schemes and the PFAS metabolism reaction library consists of 63 generalized schemes. Both reaction libraries include generalized schemes for the formation of proposed transformation products (PTPs). The inclusion of proposed intermediates serves to support suspect screening during non-targeted PFAS analyses by providing investigators with prior knowledge of the chemical structures of plausible transformation products that may be present in environmental and biological samples at low concentrations. Combined the PFAS reaction libraries cover eleven reaction processes (e.g., oxidation and hydrolysis) and 26 PFAS functional groups. Additionally, each of the generalized reaction scheme was assigned a rank ranging from one to seven based on reported half-lives. ChemAxon’s Metabolizer application uses the rank of each scheme to calculate an approximate percentage production of each potential transformation product. Looking forward, Fig. 5 presents possible target PFAS for future environmental fate and metabolism studies. We encourage authors of such PFAS studies to report clear reaction schemes and transformation rate constants and/or half-lives assuming they were measured. Too often we had to estimate these values from figures illustrating the disappearance of the parent PFAS and the formation of TPs, which adds to the uncertainty of these parameters.
Supplementary Material
Environmental significance.
The production, application, transport, and disposal of perfluoroalkyl and polyfluoroalkyl substances (PFAS) and PFAS-treated products have resulted in their wide-spread occurrence in environmental and biological systems. Concern over exposure to PFAS and their transformation products and metabolites has necessitated the development of tools to predict the transformation of PFAS in environmental systems and metabolism in biological systems. Such tools will aide in the non-targeted analyses of PFAS in environmental and biological systems.
Acknowledgements
This research was supported in part by an appointment to the Internship/Research Participation Program at the Office of Research and Development administered by the Oak Ridge Institute for Science and Education (ORISE) through Interagency Agreement No. DW-89-92525701-01 between the United States Department of Energy and the U.S. EPA.
Footnotes
Disclaimer
The views expressed in this paper are those of the authors and do not necessarily represent the views or policies of the U.S. Environmental Protection Agency (EPA). Mention of trade names or products does not convey, and should not be interpreted as conveying, official EPA approval, endorsement or recommendation.
Conflicts of interest
There are no conflicts to declare.
Electronic supplementary information (ESI) available.
References
- 1.Rankin K, Mabury SA, Jenkins TM and Washington JW, A North American and global survey of perfluoroalkyl substances in surface soils: Distribution patterns and mode of occurrence, Chemosphere, 2016, 161, 333–341 [DOI] [PubMed] [Google Scholar]
- 2.Sepulvado JG, Blaine AC, Hundal LS and Higgins CP, Occurrence and Fate of Perfluorochemicals in Soil Following the Land Application of Municipal Biosolids, Environ. Sci. Technol, 2011, 45, 8106–8112 [DOI] [PubMed] [Google Scholar]
- 3.Lasier PJ, Washington JW, Hassan SM and Jenkins TM, Perfluorinated chemicals in surface waters and sediments from northwest Georgia, USA, and their bioaccumulation in Lumbriculus variegatus, Environ. Toxicol. Chem, 2011, 30, 2194–2201 [DOI] [PubMed] [Google Scholar]
- 4.Backe WJ, Day TC and Field JA, Zwitterionic, Cationic, and Anionic Fluorinated Chemicals in Aqueous Film Forming Foam Formulations and Groundwater from U.S. Military Bases by Nonaqueous Large-Volume Injection HPLC-MS/MS, Environ. Sci. Technol, 2013, 47, 5226–5234 [DOI] [PubMed] [Google Scholar]
- 5.Strynar M, Dagnino S, McMahen R, Liang S, Lindstrom A, Andersen E, McMillan L, Thurman M, Ferrer I and Ball C, Identification of Novel Perfluoroalkyl Ether Carboxylic Acids (PFECAs) and Sulfonic Acids (PFESAs) in Natural Waters Using Accurate Mass Time-of-Flight Mass Spectrometry (TOFMS), Environ. Sci. Technol, 2015, 49, 11622–11630 [DOI] [PubMed] [Google Scholar]
- 6.Crone BC, Speth TF, Wahman DG, Smith SJ, Abulikemu G, Kleiner EJ and Pressman JG, Occurrence of per- and polyfluoroalkyl substances (PFAS) in source water and their treatment in drinking water, Crit. Rev. Environ. Sci. Technol, 2019, 49, 2359–2396 [DOI] [PMC free article] [PubMed] [Google Scholar]
- 7.Coggan TL, Moodie D, Kolobaric A, Szabo D, Shimeta J, Crosbie ND, Lee E, Fernandes M and Clarke BO, An investigation into per- and polyfluoroalkyl substances (PFAS) in nineteen Australian wastewater treatment plants (WWTPs), Heliyon, 2019, 5, e02316. [DOI] [PMC free article] [PubMed] [Google Scholar]
- 8.Glynn, Kotova N, Dahlgren E, Lindh C, Jakobsson K, Gyllenhammar I, Lignell S and Nälsén C, Determinants of serum concentrations of perfluoroalkyl acids (PFAAs) in school children and the contribution of low-level PFAA-contaminated drinking water, Environ. Sci.: Processes Impacts, 2020, 22, 930–944 [DOI] [PubMed] [Google Scholar]
- 9.Workman E, Becker AB, Azad MB, Moraes TJ, Mandhane PJ, Turvey SE, Subbarao P, Brook JR, Sears MR and Wong CS, Associations between concentrations of perfluoroalkyl substances in human plasma and maternal, infant, and home characteristics in Winnipeg, Canada, Environ. Pollut, 2019, 249, 758–766 [DOI] [PubMed] [Google Scholar]
- 10.Hurley S, Goldberg D, Wang M, Park J-S, Petreas M, Bernstein L, Anton-Culver H, Nelson DO and Reynolds P, Time Trends in Per- and Polyfluoroalkyl Substances (PFASs) in California Women: Declining Serum Levels, 2011–2015, Environ. Sci. Technol, 2018, 52, 277–287 [DOI] [PubMed] [Google Scholar]
- 11.Munoz G, Desrosiers M, Duy SV, Labadie P, Budzinski H, Liu J and Sauvé S, Environmental Occurrence of Perfluoroalkyl Acids and Novel Fluorotelomer Surfactants in the Freshwater Fish Catostomus commersonii and Sediments Following Firefighting Foam Deployment at the Lac-Mégantic Railway Accident, Environ. Sci. Technol, 2017, 51, 1231–1240 [DOI] [PubMed] [Google Scholar]
- 12.Khan EA, Bertotto LB, Dale K, Lille-Langøy R, Yadetie F, Karlsen OA, Goksøyr A, Schlenk D and Arukwe A, Modulation of Neuro-Dopamine Homeostasis in Juvenile Female Atlantic Cod (Gadus morhua) Exposed to Polycyclic Aromatic Hydrocarbons and Perfluoroalkyl Substances, Environ. Sci. Technol, 2019, 53, 7036–7044 [DOI] [PubMed] [Google Scholar]
- 13.Roscales JL, Vicente A, Ryan PG, González-Solís J and Jiménez B, Spatial and Interspecies Heterogeneity in Concentrations of Perfluoroalkyl Substances (PFASs) in Seabirds of the Southern Ocean, Environ. Sci. Technol, 2019, 53, 9855–9865 [DOI] [PubMed] [Google Scholar]
- 14.Route WT, Russell RE, Lindstrom AB, Strynar MJ and Key RL, Spatial and Temporal Patterns in Concentrations of Perfluorinated Compounds in Bald Eagle Nestlings in the Upper Midwestern United States, Environ. Sci. Technol, 2014, 48, 6653–6660 [DOI] [PubMed] [Google Scholar]
- 15.Hitchcock DJ, Andersen T, Varpe Ø, Loonen MJJE, Warner NA, Herzke D, Tombre IM, Griffin LR, Shimmings P and Borgå K, Potential Effect of Migration Strategy on Pollutant Occurrence in Eggs of Arctic Breeding Barnacle Geese (Branta leucopsis), Environ. Sci. Technol, 2019, 53, 5427–5435 [DOI] [PubMed] [Google Scholar]
- 16.Cui Q, Pan Y, Zhang H, Sheng N, Wang J, Guo Y and Dai J, Occurrence and Tissue Distribution of Novel Perfluoroether Carboxylic and Sulfonic Acids and Legacy Per/Polyfluoroalkyl Substances in Black-Spotted Frog (Pelophylax nigromaculatus), Environ. Sci. Technol, 2018, 52, 982–990 [DOI] [PubMed] [Google Scholar]
- 17.Smithwick M, Norstrom RJ, Mabury SA, Solomon K, Evans TJ, Stirling I, Taylor MK and Muir DC, Temporal trends of perfluoroalkyl contaminants in polar bears (Ursus maritimus) from two locations in the North American Arctic, 1972–2002, Environ. Sci. Technol, 2006, 40, 1139–1143 [DOI] [PubMed] [Google Scholar]
- 18.Casal P, González-Gaya B, Zhang Y, Reardon AJF, Martin JW, Jiménez B and Dachs J, Accumulation of Perfluoroalkylated Substances in Oceanic Plankton, Environ. Sci. Technol, 2017, 51, 2766–2775 [DOI] [PubMed] [Google Scholar]
- 19.Liu Y, Ruan T, Lin Y, Liu A, Yu M, Liu R, Meng M, Wang Y, Liu J and Jiang G, Chlorinated Polyfluoroalkyl Ether Sulfonic Acids in Marine Organisms from Bohai Sea, China: Occurrence, Temporal Variations, and Trophic Transfer Behavior, Environ. Sci. Technol, 2017, 51, 4407–4414 [DOI] [PubMed] [Google Scholar]
- 20.Tebes-Stevens C, Patel JM, Koopmans M, Olmstead J, Hilal SH, Pope N, Weber EJ and Wolfe K, Demonstration of a consensus approach for the calculation of physicochemical properties required for environmental fate assessments, Chemosphere, 2018, 194, 94–106 [DOI] [PMC free article] [PubMed] [Google Scholar]
- 21.Tebes-Stevens C, Patel JM, Jones WJ and Weber EJ, Prediction of Hydrolysis Products of Organic Chemicals under Environmental pH Conditions, Environ. Sci. Technol, 2017, 51, 5008–5016 [DOI] [PMC free article] [PubMed] [Google Scholar]
- 22.Ellis LBM, Gao J, Fenner K and Wackett LP, The University of Minnesota pathway prediction system: predicting metabolic logic, Nucleic Acids Res, 2008, 36, W427–W432 [DOI] [PMC free article] [PubMed] [Google Scholar]
- 23.Marchant CA, Briggs KA and Long A, In Silico Tools for Sharing Data and Knowledge on Toxicity and Metabolism: Derek for Windows, Meteor, and Vitic, Toxicol. Mech. Methods, 2008, 18, 177–187 [DOI] [PubMed] [Google Scholar]
- 24.Djoumbou-Feunang Y, Fiamoncini J, Gil-de-la-Fuente A, Greiner R, Manach C and Wishart DS, BioTransformer: a comprehensive computational tool for small molecule metabolism prediction and metabolite identification, J. Cheminf, 2019, 11, 2. [DOI] [PMC free article] [PubMed] [Google Scholar]
- 25.Wang N, Szostek B, Buck RC, Folsom PW, Sulecki LM and Gannon JT, 8–2 Fluorotelomer alcohol aerobic soil biodegradation: Pathways, metabolites, and metabolite yields, Chemosphere, 2009, 75, 1089–1096 [DOI] [PubMed] [Google Scholar]
- 26.Nabb DL, Szostek B, Himmelstein MW, Mawn MP, Gargas ML, Sweeney LM, Stadler JC, Buck RC and Fasano WJ, In Vitro Metabolism of 8–2 Fluorotelomer Alcohol: Interspecies Comparisons and Metabolic Pathway Refinement, Toxicol. Sci, 2007, 100, 333–344 [DOI] [PubMed] [Google Scholar]
- 27.Yu X, Takabe Y, Yamamoto K, Matsumura C and Nishimura F, Biodegradation Property of 8:2 Fluorotelomer Alcohol (8:2 FTOH) under Aerobic/Anoxic/Anaerobic Conditions, J. Water Environ. Nanotechnol, 2016, 14, 177–190 [Google Scholar]
- 28.Zhang S, Szostek B, McCausland PK, Wolstenholme BW, Lu X, Wang N and Buck RC, 6:2 and 8:2 Fluorotelomer Alcohol Anaerobic Biotransformation in Digester Sludge from a WWTP under Methanogenic Conditions, Environ. Sci. Technol, 2013, 47, 4227–4235 [DOI] [PubMed] [Google Scholar]
- 29.Wang N, Buck RC, Szostek B, Sulecki LM and Wolstenholme BW, 5:3 Polyfluorinated acid aerobic biotransformation in activated sludge via novel “one-carbon removal pathways”, Chemosphere, 2012, 87, 527–534 [DOI] [PubMed] [Google Scholar]
- 30.Washington JW, Jenkins TM and Weber EJ, Identification of Unsaturated and 2H Polyfluorocarboxylate Homologous Series and Their Detection in Environmental Samples and as Polymer Degradation Products, Environ. Sci. Technol, 2015, 49, 13256–13263 [DOI] [PubMed] [Google Scholar]
- 31.D’Agostino LA and Mabury SA, Aerobic biodegradation of 2 fluorotelomer sulfonamide–based aqueous film–forming foam components produces perfluoroalkyl carboxylates, Environ. Toxicol. Chem, 2017, 36, 2012–2021 [DOI] [PubMed] [Google Scholar]
- 32.Peng H, Zhang S, Sun J, Zhang Z, Giesy JP and Hu J, Isomer-specific accumulation of perfluorooctanesulfonate from (N-ethyl perfluorooctanesulfonamido)ethanol-based phosphate diester in Japanese Medaka (Oryzias latipes), Environ. Sci. Technol, 2014, 48, 1058–1066 [DOI] [PubMed] [Google Scholar]
- 33.Zhao S, Wang B, Zhu L, Liang T, Chen M, Yang L, Lv J and Liu L, Uptake, elimination and biotransformation of N-ethyl perfluorooctane sulfonamide (N-EtFOSA) by the earthworms (Eisenia fetida) after in vivo and in vitro exposure, Environ. Pollut, 2018, 241, 19–25 [DOI] [PubMed] [Google Scholar]
- 34.Liu J, Lee LS, Nies LF, Nakatsu CH and Turco RF, Biotransformation of 8:2 Fluorotelomer Alcohol in Soil and by Soil Bacteria Isolates, Environ. Sci. Technol, 2007, 41, 8024–8030 [DOI] [PubMed] [Google Scholar]
- 35.Kim MH, Wang N, McDonald T and Chu K-H, Biodefluorination and biotransformation of fluorotelomer alcohols by two alkane-degrading Pseudomonas strains, Biotechnol Bioeng., 2012, 109, 3041–3048 [DOI] [PubMed] [Google Scholar]
- 36.Wang N, Szostek B, Buck RC, Folsom PW, Sulecki LM, Capka V, Berti WR and Gannon JT, Fluorotelomer alcohol biodegradation - Direct evidence that perfluorinated carbon chains breakdown, Environ. Sci. Technol, 2005, 39, 7516–7528 [DOI] [PubMed] [Google Scholar]
- 37.Zhang H, Wen B, Hu X, Wu Y, Pan Y, Huang H, Liu L and Zhang S, Uptake, Translocation, and Metabolism of 8:2 Fluorotelomer Alcohol in Soybean (Glycine max L. Merrill), Environ. Sci. Technol, 2016, 50, 13309–13317 [DOI] [PubMed] [Google Scholar]
- 38.Fasano WJ, Sweeney LM, Mawn MP, Nabb DL, Szostek B, Buck RC and Gargas ML, Kinetics of 8–2 fluorotelomer alcohol and its metabolites, and liver glutathione status following daily oral dosing for 45 days in male and female rats, Chem.-Biol. Interact, 2009, 180, 281–295 [DOI] [PubMed] [Google Scholar]
- 39.Butt CM, Muir DCG and Mabury SA, Elucidating the Pathways of Poly- and Perfluorinated Acid Formation in Rainbow Trout, Environ. Sci. Technol, 2010, 44, 4973–4980 [DOI] [PubMed] [Google Scholar]
- 40.Hurley M, Wallington T, Andersen M, Ellis D, Martin J and Mabury SA, Atmospheric Chemistry of Fluorinated Alcohols: Reaction with Cl Atoms and OH Radicals and Atmospheric Lifetimes, J. Phys. Chem. A, 2004, 108, 1973–1979 [Google Scholar]
- 41.Hurley MD, Sulbaek Andersen MP, Wallington TJ, Ellis DA, Martin JW and Mabury SA, Atmospheric Chemistry of Perfluorinated Carboxylic Acids: Reaction with OH Radicals and Atmospheric Lifetimes, J. Phys. Chem. A, 2004, 108, 615–620 [Google Scholar]
- 42.Young CJ, Furdui VI, Franklin J, Koerner RM, Muir DCG and Mabury SA, Perfluorinated Acids in Arctic Snow: New Evidence for Atmospheric Formation, Environ. Sci. Technol, 2007, 41, 3455–3461 [DOI] [PubMed] [Google Scholar]
- 43.Liu JX, Wang N, Szostek B, Buck RC, Panciroli PK, Folsom PW, Sulecki LM and Bellin CA, 6–2 Fluorotelomer alcohol aerobic biodegradation in soil and mixed bacterial culture, Chemosphere, 2010, 78, 437–444 [DOI] [PubMed] [Google Scholar]
- 44.Washington JW, Jenkins TM, Rankin K and Naile JE, Decades-scale degradation of commercial, side-chain, fluorotelomer-based polymers in soils and water, Environ. Sci. Technol, 2015, 49, 915–923 [DOI] [PubMed] [Google Scholar]
- 45.Jin Z, He Q, Luo H, Pan Y, Sun C and Cai Z, The oxidation of cysteine-containing peptides caused by perfluoroalkane sulfonyl fluorides, J. Hazard. Mater, 2020, 385, 121564. [DOI] [PubMed] [Google Scholar]
- 46.Lange CC, Anaerobic biotransformation of N-methyl perfluorobutanesulfonamido ethanol and N-ethyl perfluorooctanesulfonamido ethanol, Environ. Toxicol. Chem, 2018, 37, 768–779 [DOI] [PubMed] [Google Scholar]
- 47.Schuster P, Bertermann R, Rusch GM and Dekant W, Biotransformation of 2,3,3,3-tetrafluoropropene (HFO-1234yf) in rabbits, Toxicol. Appl. Pharmacol, 2010, 244, 247–253 [DOI] [PubMed] [Google Scholar]
- 48.Zhang H, Wen B, Huang H, Wang S, Cai Z and Zhang S, Biotransformation of 6:2 fluorotelomer alcohol by the whole soybean (Glycine max L. Merrill) seedlings, Environ. Pollut, 2020, 257, 113513. [DOI] [PubMed] [Google Scholar]
- 49.Zhang H, Wen B, Hu X, Wu Y, Pan Y, Huang H, Liu L and Zhang S, Uptake, Translocation, and Metabolism of 8:2 Fluorotelomer Alcohol in Soybean (Glycine max L. Merrill), Environ. Sci. Technol, 2016, 50, 13309–13317 [DOI] [PubMed] [Google Scholar]
- 50.Chen M, Guo T, He K, Zhu L, Jin H, Wang Q, Liu M and Yang L, Biotransformation and bioconcentration of 6:2 and 8:2 polyfluoroalkyl phosphate diesters in common carp (Cyprinus carpio): Underestimated ecological risks, Sci. Total Environ, 2019, 656, 201–208 [DOI] [PubMed] [Google Scholar]
- 51.Martin JW, Mabury SA and O’Brien PJ, Metabolic products and pathways of fluorotelomer alcohols in isolated rat hepatocytes, Chem.-Biol. Interact, 2005, 155, 165–180 [DOI] [PubMed] [Google Scholar]
- 52.Jin Z, He Q, Luo H, Pan Y, Sun C and Cai Z, The Oxidation of Cysteine-containing Peptides Caused by Perfluoroalkane Sulfonyl Fluorides, J. Hazard. Mater, 2019, 121564. [DOI] [PubMed] [Google Scholar]
- 53.Jin L, Davis MR, Kharasch ED, Doss GA and Baillie TA, Identification in rat bile of glutathione conjugates of fluoromethyl 2,2-difluoro-1-(trifluoromethyl)vinyl ether, a nephrotoxic degradate of the anesthetic agent sevoflurane, Chem. Res. Toxicol, 1996, 9, 555–561 [DOI] [PubMed] [Google Scholar]
- 54.Jin L, Baillie TA, Davis MR and Kharasch ED, Nephrotoxicity of sevoflurane compound A [fluoromethyl-2,2-difluoro-1-(trifluoromethyl)vinyl ether] in rats: evidence for glutathione and cysteine conjugate formation and the role of renal cysteine conjugate beta-lyase, Biochem. Biophys. Res. Commun, 1995, 210, 498–506 [DOI] [PubMed] [Google Scholar]
- 55.Iyer RA and Anders MW, Cysteine Conjugate β-Lyase-dependent Biotransformation of the Cysteine S-Conjugates of the Sevoflurane Degradation Product Compound A in Human, Nonhuman Primate, and Rat Kidney Cytosol and Mitochondria, Anesthesiology, 1996, 85, 1454–1461 [DOI] [PubMed] [Google Scholar]
- 56.Dagnino S, Strynar MJ, McMahen RL, Lau CS, Ball C, Garantziotis S, Webster TF, McClean MD and Lindstrom AB, Identification of Biomarkers of Exposure to FTOHs and PAPs in Humans Using a Targeted and Nontargeted Analysis Approach, Environ. Sci. Technol, 2016, 50, 10216–10225 [DOI] [PMC free article] [PubMed] [Google Scholar]
- 57.Liberatore HK, Jackson SR, Strynar MJ and McCord JP, Solvent Suitability for HFPO-DA (“GenX” Parent Acid) in Toxicological Studies, Environ. Sci. Technol. Lett, 2020, 7, 477–481 [DOI] [PMC free article] [PubMed] [Google Scholar]
- 58.Shaw DMJ, Munoz G, Bottos EM, Duy SV, Sauvé S, Liu J and Van Hamme JD, Degradation and defluorination of 6:2 fluorotelomer sulfonamidoalkyl betaine and 6:2 fluorotelomer sulfonate by Gordonia sp. strain NB4–1Y under sulfur-limiting conditions, Sci. Total Environ, 2019, 647, 690–698 [DOI] [PubMed] [Google Scholar]
- 59.Van Hamme JD, Bottos EM, Bilbey NJ and Brewer SE, Genomic and proteomic characterization of Gordonia sp. NB4–1Y in relation to 6:2 fluorotelomer sulfonate biodegradation, Microbiology, 2013, 159, 1618–1628 [DOI] [PubMed] [Google Scholar]
- 60.Schuster P, Bertermann R, Snow TA, Han X, Rusch GM, Jepson GW and Dekant W, Biotransformation of 2,3,3,3-tetrafluoropropene (HFO-1234yf), Toxicol. Appl. Pharmacol, 2008, 233, 323–332 [DOI] [PubMed] [Google Scholar]
- 61.Bunton CA and Fendler JH, The Hydrolysis of Acetyl Fluoride, J. Org. Chem, 1966, 31, 2307–2312 [Google Scholar]
- 62.Koster U, Speerschneider P, Kerssebaum R, Wittmann H and Dekant W, Role of Cytochrome-P450 2E1 in the Metabolism of1,1,2,3,3,3-Hexafluoropropyl Methyl-Ether, Drug Metab. Dispos, 1994, 22, 667–672 [PubMed] [Google Scholar]
- 63.Andreades S and England D, Alpha-haloalcohols, J. Am. Chem. Soc, 1961, 83, 4670 [Google Scholar]
- 64.Meresaar U and Bratt L, Hydrolysis of amides. Alkaline and general acid catalyzed alkaline hydrolysis of some substituted acetamides and benzamides, Acta Chem. Scand., Ser. A, 1974, 28, 715–722 [Google Scholar]
- 65.Ruan T, Szostek B, Folsom PW, Wolstenholme BW, Liu R, Liu J, Jiang G, Wang N and Buck RC, Aerobic Soil Biotransformation of 6:2 Fluorotelomer Iodide, Environ. Sci. Technol, 2013, 47, 11504–11511 [DOI] [PubMed] [Google Scholar]
- 66.Royer LA, Lee LS, Russell MH, Nies LF and Turco RF, Microbial transformation of 8:2 fluorotelomer acrylate and methacrylate in aerobic soils, Chemosphere, 2015, 129, 54–61 [DOI] [PubMed] [Google Scholar]
- 67.Butt CM, Muir DCG and Mabury SA, Biotransformation of the 8:2 fluorotelomer acrylate in rainbow trout. 2. In vitro incubations with liver and stomach S9 fractions, Environ. Toxicol. Chem, 2010, 29, 2736–2741. [DOI] [PubMed] [Google Scholar]
- 68.Dasu K, Liu J and Lee LS, Aerobic Soil Biodegradation of 8:2 Fluorotelomer Stearate Monoester, Environ. Sci. Technol, 2012, 46, 3831–3836 [DOI] [PubMed] [Google Scholar]
- 69.Dasu K, Lee LS, Turco RF and Nies LF, Aerobic biodegradation of 8:2 fluorotelomer stearate monoester and 8:2 fluorotelomer citrate triester in forest soil, Chemosphere, 2013, 91, 399–405 [DOI] [PubMed] [Google Scholar]
- 70.Lewis M, Kim MH, Liu EJ, Wang N and Chu KH, Biotransformation of 6:2 polyfluoroalkyl phosphates (6:2 PAPs): Effects of degradative bacteria and co-substrates, J. Hazard. Mater, 2016, 320, 479–486 [DOI] [PubMed] [Google Scholar]
- 71.Arakaki, Ishii Y, Tokuhisa T, Murata S, Sato K, Sonoi T, Tatsu H and Matsunaga T, Microbial biodegradation of a novel fluorotelomer alcohol, 1H,1H,2H,2H,8H,8H-perfluorododecanol, yields short fluorinated acids, Appl. Microbiol. Biotechnol, 2010, 88, 1193–1203 [DOI] [PubMed] [Google Scholar]
- 72.Kutsuna S, Rate constants and CC bond scission ratios for hydrolysis of 2,2,3-trifluoro-3-(trifluoromethyl)oxirane determined by means of a closed-circulation reactor, J. Fluorine Chem, 2018, 211, 109–118 [Google Scholar]
- 73.Ruan T, Sulecki LM, Wolstenholme BW, Jiang GB, Wang N and Buck RC, 6:2 Fluorotelomer iodide in vitro metabolism by rat liver microsomes: Comparison with 1,2-C-14 6:2 fluorotelomer alcohol, Chemosphere, 2014, 112, 34–41 [DOI] [PubMed] [Google Scholar]
- 74.Zhang H, Wen B, Huang H, Wang S, Cai Z and Zhang S, Biotransformation of 6:2 fluorotelomer alcohol by the whole soybean (Glycine max L. Merrill) seedlings, Environ. Pollut, 2020, 113513. [DOI] [PubMed] [Google Scholar]
- 75.Dasu K and Lee LS, Aerobic biodegradation of toluene-2,4-di(8:2 fluorotelomer urethane) and hexamethylene-1,6-di(8:2 fluorotelomer urethane) monomers in soils, Chemosphere, 2016, 144, 2482–2488 [DOI] [PubMed] [Google Scholar]
- 76.Arakaki, Nakata S, Tokuhisa T, Ogawa Y, Sato K, Sonoi T, Donachie SP and Matsunaga T, Quantitative and time-course analysis of microbial degradation of 1H,1H,2H,2H,8H,8H–perfluorododecanol in activated sludge, Appl. Microbiol. Biotechnol, 2017, 101, 8259–8266 [DOI] [PubMed] [Google Scholar]
- 77.Lee H, D’eon J and Mabury SA, Biodegradation of Polyfluoroalkyl Phosphates as a Source of Perfluorinated Acids to the Environment, Environ. Sci. Technol, 2010, 44, 3305–3310 [DOI] [PubMed] [Google Scholar]
- 78.D’Eon JC and Mabury SA, Production of Perfluorinated Carboxylic Acids (PFCAs) from the Biotransformation of Polyfluoroalkyl Phosphate Surfactants (PAPS): Exploring Routes of Human Contamination, Environ. Sci. Technol, 2007, 41, 4799–4805 [DOI] [PubMed] [Google Scholar]
- 79.Mahmood T and Shreeve J. n. M., New perfluoroalkylphosphonic and bis(perfluoroalkyl)phosphinic acids and their precursors, Inorg. Chem, 1986, 25, 3128–3131 [Google Scholar]
- 80.Lee H, De Silva AO and Mabury SA, Dietary Bioaccumulation of Perfluorophosphonates and Perfluorophosphinates in Juvenile Rainbow Trout: Evidence of Metabolism of Perfluorophosphinates, Environ. Sci. Technol, 2012, 46, 3489–3497 [DOI] [PubMed] [Google Scholar]
- 81.Letcher RJ, Chu S, McKinney MA, Tomy GT, Sonne C and Dietz R, Comparative hepatic in vitro depletion and metabolite formation of major perfluorooctane sulfonate precursors in Arctic polar bear, beluga whale, and ringed seal, Chemosphere, 2014, 112, 225–231 [DOI] [PubMed] [Google Scholar]
- 82.Knunyants L and Sokolski GA, Fluorinated Beta-Sultones, Angew. Chem., Int. Ed, 1972, 11, 583–595 [Google Scholar]
- 83.Benskin JP, Ikonomou MG, Gobas FAPC, Begley TH, Woudneh MB and Cosgrove JR, Biodegradation of N-Ethyl Perfluorooctane Sulfonamido Ethanol (EtFOSE) and EtFOSE-Based Phosphate Diester (SAmPAP Diester) in Marine Sediments, Environ. Sci. Technol, 2013, 47, 1381–1389 [DOI] [PubMed] [Google Scholar]
- 84.Peng H, Zhang S, Sun J, Zhang Z, Giesy JP and Hu J, Isomer-Specific Accumulation of Perfluorooctanesulfonate from (N-Ethyl perfluorooctanesulfonamido)ethanol-based Phosphate Diester in Japanese Medaka (Oryzias latipes), Environ. Sci. Technol, 2014, 48, 1058–1066 [DOI] [PubMed] [Google Scholar]
- 85.Rhoads KR, Janssen EML, Luthy RG and Criddle CS, Aerobic Biotransformation and Fate of N-Ethyl Perfluorooctane Sulfonamidoethanol (N-EtFOSE) in Activated Sludge, Environ. Sci. Technol, 2008, 42, 2873–2878 [DOI] [PubMed] [Google Scholar]
- 86.Zhao S, Wang B, Zhu L, Liang T, Chen M, Yang L, Lv J and Liu L, Uptake, elimination and biotransformation of N-ethyl perfluorooctane sulfonamide (N-EtFOSA) by the earthworms (Eisenia fetida) after in vivo and in vitro exposure, Environ. Pollut, 2018, 241, 19–25 [DOI] [PubMed] [Google Scholar]
- 87.Tomy GT, Tittlemier SA, Palace VP, Budakowski WR, Braekevelt E, Brinkworth L and Friesen K, Biotransformation of N-Ethyl Perfluorooctanesulfonamide by Rainbow Trout (Onchorhynchus mykiss) Liver Microsomes, Environ. Sci. Technol, 2004, 38, 758–762 [DOI] [PubMed] [Google Scholar]
- 88.Moe MK, Huber S, Svenson J, Hagenaars A, Pabon M, Trümper M, Berger U, Knapen D and Herzke D, The structure of the fire fighting foam surfactant Forafac®1157 and its biological and photolytic transformation products, Chemosphere, 2012, 89, 869–875 [DOI] [PubMed] [Google Scholar]
- 89.Kharasch ED, Karol MD, Lanni C and Sawchuk R, Clinical Sevoflurane Metabolism and Disposition: I. Sevoflurane and Metabolite Pharmacokinetics, Anesthesiology, 1995, 82, 1369–1378 [DOI] [PubMed] [Google Scholar]
- 90.Butt CM, Muir DCG and Mabury SA, Biotransformation of the 8:2 fluorotelomer acrylate in rainbow trout. 1. In vivo dietary exposure, Environ. Toxicol. Chem, 2010, 29, 2726–2735 [DOI] [PubMed] [Google Scholar]
- 91.Zhaoa L, Folsom P, Wolstenholme BW, Sun H, Wang N and Buck RC, 6:2 Fluorotelomer alcohol biotransformation in an aerobic river sediment system, Chemosphere, 2013, 90, 203–209 [DOI] [PubMed] [Google Scholar]
- 92.Dinglasan MJA, Ye Y, Edwards EA and Mabury SA, Fluorotelomer Alcohol Biodegradation Yields Poly- and Perfluorinated Acids, Environ. Sci. Technol, 2004, 38, 2857–2864 [DOI] [PubMed] [Google Scholar]
- 93.Hamid H, Li LY and Grace JR, Aerobic biotransformation of fluorotelomer compounds in landfill leachate-sediment, Sci. Total Environ, 2020, 713, 136547. [DOI] [PubMed] [Google Scholar]
- 94.Martin JW, Mabury SA and O’Brien PJ, Metabolic products and pathways of fluorotelomer alcohols in isolated rat hepatocytes, Chem.-Biol. Interact, 2005, 155, 165–180 [DOI] [PubMed] [Google Scholar]
- 95.Frömel T and Knepper TP, Biodegradation of fluorinated alkyl substances, Rev. Environ. Contam. Toxicol, 2010, 208, 161–177 [DOI] [PubMed] [Google Scholar]
- 96.Harding-Marjanovic KC, Houtz EF, Yi S, Field JA, Sedlak DL and Alvarez-Cohen L, Aerobic Biotransformation of Fluorotelomer Thioether Amido Sulfonate (Lodyne) in AFFF-Amended Microcosms, Environ. Sci. Technol, 2015, 49, 7666–7674 [DOI] [PubMed] [Google Scholar]
- 97.Zhang S, Lu X, Wang N and Buck RC, Biotransformation potential of 6:2 fluorotelomer sulfonate (6:2 FTSA) in aerobic and anaerobic sediment, Chemosphere, 2016, 154, 224–230 [DOI] [PubMed] [Google Scholar]
- 98.Yi S, Zhu L and Mabury SA, First Report on In Vivo Pharmacokinetics and Biotransformation of Chlorinated Polyfluoroalkyl Ether Sulfonates in Rainbow Trout, Environ. Sci. Technol, 2020, 54, 345–354 [DOI] [PubMed] [Google Scholar]
- 99.Lin Y, Ruan T, Liu A and Jiang G, Identification of Novel Hydrogen-Substituted Polyfluoroalkyl Ether Sulfonates in Environmental Matrices near Metal-Plating Facilities, Environ. Sci. Technol, 2017, 51, 11588–11596 [DOI] [PubMed] [Google Scholar]
- 100.Boulanger B, Vargo JD, Schnoor JL and Hornbuckle KC, Evaluation of Perfluorooctane Surfactants in a Wastewater Treatment System and in a Commercial Surface Protection Product, Environ. Sci. Technol, 2005, 39, 5524–5530 [DOI] [PubMed] [Google Scholar]
- 101.Patlewicz G, Richard AM, Williams AJ, Grulke CM, Sams R, Lambert J, Noyes PD, DeVito MJ, Hines RN, Strynar M, Guiseppi-Elie A and Thomas RS, A Chemical Category-Based Prioritization Approach for Selecting 75 Per- and Polyfluoroalkyl Substances (PFAS) for Tiered Toxicity and Toxicokinetic Testing, Environ. Health Perspect, 2019, 127, 014501. [DOI] [PMC free article] [PubMed] [Google Scholar]
- 102.Peng R-H, Xiong A-S, Xue Y, Fu X-Y, Gao F, Zhao W, Tian Y-S and Yao Q-H, Microbial biodegradation of polyaromatic hydrocarbons, FEMS Microbiol. Rev, 2008, 32, 927–955 [DOI] [PubMed] [Google Scholar]
- 103.Brendel S, Fetter É, Staude C, Vierke L and Biegel-Engler A, Short-chain perfluoroalkyl acids: environmental concerns and a regulatory strategy under REACH, Environ. Sci. Eur, 2018, 30, 9. [DOI] [PMC free article] [PubMed] [Google Scholar]
Associated Data
This section collects any data citations, data availability statements, or supplementary materials included in this article.