

Abstract
Significance.
Eye tracking assessments that include pupil metrics can supplement current clinical assessments of vision and autonomic dysfunction in concussed adolescents.
Purpose.
To explore the utility of a 220 second eye tracking assessment in distinguishing eye position, saccadic movement, and pupillary dynamics among uninjured adolescents, those with acute (≤ 28 days since concussion), or persistent post-concussion symptoms (> 28 days since concussion).
Methods.
Two hundred and fifty-six eye tracking metrics across a prospective observational cohort of 180 uninjured adolescents recruited from a private suburban high school and 224 concussed adolescents, with acute or persistent symptoms, recruited from a tertiary care subspecialty concussion care program, 13–17 years old, from August 2017-June 2021. Kruskal-Wallis tests were used and Bonferroni corrections were applied to account for multiple comparisons and constructed Receiver Operating Characteristic curves. Principal components analysis and regression models were applied to determine whether eye tracking metrics can augment clinical and demographic information in differentiating uninjured controls from concussed adolescents.
Results.
Two metrics of eye position were worse in those with concussion than uninjured adolescents, and only one metric was significantly different between acute cases and persistent cases. Concussed adolescents had larger left and right mean, median, minimum, and maximum pupil size than uninjured controls. Concussed adolescents had greater differences in mean, median, and variance of left and right pupil size. Twelve metrics distinguished female concussed participants from uninjured; only four were associated with concussion status in males. A logistic regression model including clinical and demographics data and transformed eye tracking metrics performed better in predicting concussion status than clinical and demographics data alone.
Conclusions.
Objective eye tracking technology is capable of quickly identifying vision and pupillary disturbances after concussion, augmenting traditional clinical concussion assessments. These metrics may add to existing clinical practice for monitoring recovery in a heterogeneous adolescent concussion population.
Over 1.9 million children sustain a concussion in the US annually, with adolescents accounting for over 50% of these injuries.1 Sport- and recreation-related concussion is a complex injury that affects multiple neurological domains simultaneously and can negatively impact many aspects of daily adolescent life, including school and sport.2–4 Visual and autonomic deficits frequently occur in adolescents following concussion.5–7 Specifically, nearly 70% of concussed adolescents evaluated in a specialty care setting presented with visual deficits, such as convergence insufficiency, accommodative disorders, and/or saccadic dysfunction.5 While most children with concussion achieve symptom recovery within four weeks, the presence of visual deficits after injury predicts prolonged symptoms and recovery.8,9 As such, accurate detection of visual deficits soon after a concussion may allow for earlier intervention, potentially reducing overall symptom burden or the likelihood of experiencing persistent post-concussion symptoms.
Currently, visual deficits are assessed clinically via vision-specific symptom inventories and clinical examination of saccades, smooth pursuits, accommodation, and convergence.10–14 While these measures have demonstrated both utility and reliability among pediatric patients with concussion, they are not used ubiquitously among athletic trainers, who are often the first health care providers to conduct concussion assessments.15 Recent advances have enabled objective eye tracking to quantify visual deficits in acutely concussed children, adolescents, and adults.16–18 Previous reports using this eye tracking methodology have described its utility in identifying deficits in eye positioning during a smooth pursuit task, achieving 71.9% sensitivity and 84.4% specificity in identifying concussion among a cohort of pediatric patients with a moderate level of reliability among uninjured adolescent athletes.16,19 The utility of eye tracking for characterizing saccadic movement and pupillary dynamics is of particular interest as deficits in saccadic eye movements and pupillary dynamics have been described by researchers using other methods in the pediatric and adolescent concussion populations.10,20,21 An eye tracking assessment that includes pupillary dynamic metrics may also provide useful information for both visual and autonomic function. Measuring right and left eye position, saccadic movement, and pupillary dynamics simultaneously during an eye tracking task could more comprehensively and objectively characterize deficits that may contribute to acute and persistent symptoms.
The purpose of this study was to determine if there are differences in objective eye tracking metrics that characterize eye position, saccadic movement, and pupillary dynamics between uninjured adolescents, adolescents with acute (≤ 28 days since injury), or persistent concussion symptoms (>28 days since injury). We hypothesized that those with acute or persistent concussion symptoms would have disconjugacy in left and right eye position, abnormal saccadic movement and abnormal pupillary dynamics compared to the uninjured adolescent comparison group. We also hypothesized that there would be sex-specific differences between uninjured adolescents, and those with acute or persistent concussion symptoms in these objective eye tracking metrics because female adolescents demonstrate greater oculomotor and vestibular dysfunction in comparison to male adolescents after a concussion.22
METHODS
Study Design, Setting, and Participants
Participants aged 13 to 17 years were enrolled between August 2017 and June 2021 as part of a prospective observational cohort study assessing a suite of clinical and objective measures, including objective eye tracking, approved by the Children’s Hospital of Philadelphia (CHOP) Institutional Review Board.13 Participants and/or their parents/legal guardians provided written assent/informed consent. Uninjured athletes (N = 180) were recruited from a private suburban high school and completed an objective eye tracking assessment prior to their sports season. Concussed participants (N = 224) were recruited during a clinical care visit from the CHOP Minds Matter Concussion program, as well as from the high school. Thirty-two participants who enrolled in the uninjured cohort subsequently sustained a concussion and, for the purposes of this analysis, were included only in the concussed cohort. Concussion diagnosis was made by a trained sports medicine pediatrician according to the most recent Consensus Statement on Concussion in Sports.4 Concussed participants performed the objective eye tracking assessment during a clinical visit. If a participant with concussion had multiple eye tracking assessments across several visits, only the first assessment was used in this analysis. Participants with a concussion diagnosis were categorized into two groups for analysis: an acute group, who completed their first eye tracking assessment ≤ 28 days since injury, and a persistent group, who completed their first eye tracking assessment >28 days since injury. Exclusion criteria for both concussed and uninjured participants included a previous concussion within 1 month of injury or preinjury assessment, and any ocular or neurologic condition that could affect eye tracking responses.
Of the 346 participants enrolled, valid eye tracking assessments were obtained for 178 of 180 (98.8%) uninjured and 219 of 224 (97.8%) concussed participants. Among those without a valid assessment, five had insufficient data capture during the assessment of one or both eyes. Data from two additional subjects were lost due to device error.
Instrumentation
Eye movements were recorded using EyeBOX (Oculogica, Inc, New York, NY) which utilizes an Eyelink 1000 (SR Research, Ottawa, Ontario, Canada), positioned at a fixed distance of 55 cm from the participant’s eyes while they track during a 220 second stimulus video (Figure 1). The stimulus video, a 220 second child’s movie music video clip with a 4:3 aspect ratio, occupied approximately one-ninth of the display monitor area and moved in a smooth clockwise direction along the outer edges of the monitor at a rate of 10 seconds per edge of the monitor. The total visible span of the moving aperture was approximately 17° horizontally and 13° vertically from the middle of the screen. Eye position data from both eyes were obtained independently at 500 Hz. Because the position of the head was fixed, it is important to note that the eye position, the position of the eye in the orbit, and the gaze position, the position of the eye and head combined, are equivalent. The EyeBOX is not spatially calibrated as the metrics of interest are derived from changes in eye position over time, allowing for independent analysis of each pupil position with respect to the moving visual stimulus. The EyeBOX pupil mode was set to center of mass. The first and last 10 seconds of the assessment were discarded to reduce potential noise from capturing the onset and completion of the eye tracking task. The eye tracking data were then automatically processed to yield 256 eye tracking metrics that quantify a) eye position (the position of the left and right pupils independently, and comparisons of their positions over time during the task), b) saccadic movement in each eye, as well as c) pupillary dynamics for each eye, both independently and together. Eye position metrics were derived from the X and Y spatial coordinates of each pupil, and by comparing the coordinates of one eye to the other eye at any given time point throughout the entire assessment.23 There were a total of 183 metrics of eye position, 60 metrics of saccadic movement metrics, and 13 metrics of pupillary dynamics. The large number of eye position and saccadic movement metrics are due to the fact that these metrics are evaluated based on the side of the screen the video was on (i.e. the top, right, bottom, and left) for both the eyes individually as well as comparisons between the two. Although the video stimulus moves smoothly along the edges of the screen, saccadic eye movements were captured when the participant glanced between objects, such as two characters, within the video stimulus. Saccadic eye movements were automatically detected based on right and left eye position velocities.
Figure 1.

(A) Image of eye tracker with trained research staff and mock participant completing the assessment. (B) Image of screen that participant views during the assessment with the X and Y axes labelled. Some eye tracking metrics related to eye position and saccadic movement are measured in either the X and Y axis directions.
Procedures
Participants completed questionnaires to capture demographic and clinical characteristics, such as age at the time of assessment, sex, race/ethnicity, and prior history of concussion. The Post-Concussion Symptom Inventory (PCSI), a self-report of symptom severity over the past 2 days (21 items on a 7-point Likert scale (0 = none, 6 = most severe), total score range of 0–126), was completed on the day of the eye tracking assessment for participants with acute or persistent concussion symptoms, and within 7 days of the eye tracking assessment for uninjured participants.24 Trained research staff conducted the objective eye tracking assessment in an athletic training room or sports medicine office and were not blinded to concussion status. Participants sat in a chair and placed their chin on a height-adjustable chin rest to limit movement. To confirm detection of pupils, participants were instructed to focus on the computer monitor and research staff confirmed that the device detected both left and right pupils around all four edges of the computer screen. Participants then were instructed to focus on a 220 second video clip that traveled in a smooth clockwise rotation along the edges of the monitor, while eye movements were recorded as described above.
Statistical Analyses
Distributions of demographic and clinical characteristics for those with acute or persistent concussion symptoms and uninjured adolescents were compared using χ2 statistics and Fisher exact tests for categorical variables (sex, race/ethnicity, and history of prior concussion) and analysis of covariance with Tukey’s honestly significant difference (HSD) post-hoc testing for continuous variables (age and PCSI score). All 256 eye tracking metrics were compared among uninjured adolescents and those with acute or persistent concussion symptoms, with Kruskal-Wallis tests and Dunn’s post-hoc tests. In an exploratory analysis of differences in eye movement post-injury by sex, eye tracking metrics were compared between uninjured participants and those with acute or persistent concussion symptoms among female and male subjects separately, with Kruskal-Wallis tests and Dunn’s post-hoc tests. Multiple comparisons were accounted for by calculating Bonferroni corrections where a P < 0.05/256 or 0.00019 was considered significant for the Kruskal-Wallis tests and P < 0.05/768 or 0.000065 was considered significant for the Dunn’s post-hoc tests. We also calculated area under the curve (AUC) values from Receiver Operating Characteristic (ROC) curves and Cohen’s d effect sizes for metrics significantly different between groups. Finally, an analytic regression model based on the discriminatory eye tracking metrics using principal components analysis was created. All analyses were conducted using R.25
RESULTS
Study Population
Among participants with a concussion and evaluable eye tracking assessments, 130 (59.4%) had acute concussion and 89 (40.6%) had persistent concussion symptoms (Table 1). A total of 75.8% had a sport- or recreation-related concussion. The uninjured cohort differed from the persistent concussion symptoms cohort in race and ethnicity. The uninjured cohort was also slightly younger than the persistent concussion symptoms cohort. Those with acute concussion symptoms completed an eye tracking assessment a median interquartile range (IQR) of 11 (4, 19.75) days following injury while those persistent with concussion symptoms completed an eye tracking assessment a median IQR of 53 (40, 68) days following injury. Participants with acute and persistent concussion symptoms reported significantly greater overall symptom severity than uninjured participants. The persistent concussion symptoms group had a significantly higher proportion of females (69.7%) than the acute concussion symptoms group (47.7%, P = .004) and the uninjured group (53.4%, P = .02). A significantly greater proportion of the acute and persistent concussion symptoms groups reported a prior history of concussion compared to the uninjured group. Demographic and clinical characteristics associated with concussion status were not subsequently included as covariates in comparisons of eye tracking metrics across groups as these variables did not show an association with the eye tracking metrics.
Table 1.
Demographic and clinical characteristics of the study cohort, with continuous data presented as median (IQR).
| Acute Concussion Symptoms (N = 130) | Persistent Concussion Symptoms (N = 89) | Uninjured (N = 178) | P-value | Post-hoc Test P-Values | |
|---|---|---|---|---|---|
| Age (Median (IQR)) | 15.6 (14.5, 16.9) | 16.0 (14.7, 17.0) | 15.1 (14.3, 16.3) | .01 | Acute v. Persistent: .74 Acute v. Uninjured: .09 Persistent v. Uninjured: .02 |
| Days Following Injury (Median (IQR)) | 11.0 (4.0, 19.75) | 53.0 (40.0, 68.0) | |||
| PCSI Total Score * | 22.0 (9.0, 49.0) | 28.0 (6.0, 51.0) | 3.0 (0.0, 7.2) | < .001 | Acute v. Persistent: .87 Acute v. Uninjured: < .001 Persistent v. Uninjured: < .001 |
| Sex, % Female | 62 (47.7%) | 62 (69.7%) | 95 (53.4%) | .004 | Acute v. Persistent: .002 Acute v. Uninjured: .38 Persistent v. Uninjured: .02 |
| Race/ethnicity | .04 | Acute v. Persistent: .20 Acute v. Uninjured: .20 Persistent v. Uninjured: .009 |
|||
| Hispanic | 5 (3.8%) | 5 (5.6%) | 8 (4.5%) | ||
| NH Black | 9 (6.9%) | 11 (12.4%) | 16 (9.0%) | ||
| Other/Unknown | 14 (10.8%) | 4 (4.5%) | 33 (18.5%) | ||
| NH white | 102 (78.5%) | 69 (77.5%) | 121 (68.0%) | ||
| Prior History of Concussion ** | 57 (43.8%) | 37 (41.6%) | 50 (28.1%) | .008 | Acute v. Persistent: .86 Acute v. Uninjured: .006 Persistent v. Uninjured: .03 |
122 (93.8%) with acute concussions symptoms, 85 (95.5%) with persistent concussion symptoms, and 148 uninjured completed Post-Concussion Symptom Inventory (PCSI).
One with acute concussion symptoms and one with persistent concussion symptoms did not report prior history of concussion.
Bold values are significant.
Eye Tracking Metrics in Concussion
Of the 256 metrics, there were significant differences among uninjured participants, and those with acute or persistent concussion symptoms after Bonferroni correction for multiple comparisons, in thirteen metrics, eleven of which were related to pupillary dynamics. Table 2 includes definitions of these 13 metrics. All pupil size metrics represent the area of the pupil as calculated by the number of pixels the pupil occupies in the camera image. Participants with acute or persistent concussion symptoms had significantly larger left and right mean, median, minimum and maximum pupil size (acute v. uninjured, P < .001; persistent v. uninjured, P < .001). Those with acute or persistent concussion symptoms also had significantly greater pupil asymmetry, with greater mean, median, and variance differences in left and right pupil size (mean: acute v. uninjured : P < .001, persistent v. uninjured: P < .001; median: acute v. uninjured, P < .001, persistent v. uninjured, P = .003; variance: acute v. uninjured: P < .001, persistent v. uninjured: P < .001). Two eye position metrics were significantly different among groups—conj.varYbot, defined as the variance between the left and right eye in the Y direction along the bottom of the screen (acute v. uninjured: P = .003, persistent v. uninjured: P < .001, acute v. persistent: P = .04) and conj.varYtopbotRatio, defined as the total variance between left and right eye in the Y axis around forced average of zero for the ratio of the segment where the visual stimulus moves across the top of the screen to the segment where the visual stimulus moves across the bottom of the screen (acute v. uninjured: P < .001, persistent v. uninjured: P = .001). Median and interquartile range values for each metric for each group in Table 3. Violin plots of uninjured adolescents, acute cases, and persistent cases for the 13 metrics can be found in Appendix Figures A1–A13. Area under the ROC curve, sensitivity, specificity, and effect sizes for the 13 metrics can be found in Appendix Tables A1–A3.
Table 2.
Definitions of eye tracking metrics significantly different between groups.
| Metric | Definition |
|---|---|
| left.pupilsizemean | The average pupil size (area) of the left eye |
| left.pupilsizemedian | The median pupil size (area) of the left eye |
| right.pupilsizemean | The average pupil size (area) of the right eye |
| right.pupilsizemedian | The median pupil size (area) of the right eye |
| left.pupilsizemaxabs | The maximum pupil size (area) of the left eye |
| right.pupilsizemaxabs | The maximum pupil size (area) of the right eye |
| left.pupilsizeminabs | The minimum pupil size (area) of the left eye |
| right.pupilsizeminabs | The minimum pupil size (area) of the right eye |
| conj.pupilsizediffmean | The average difference in pupil size between the left and right eye, a measure of pupil asymmetry |
| conj.pupilsizediffmedian | The median difference in pupil size between the left and right eye, a measure of pupil asymmetry |
| conj.pupilsizediffvar | The variance of the differences in pupil size between the left and right eye, a measure of pupil asymmetry |
| conj.varYbot | The total variance between left and right eye in the Y direction around forced average of zero when the video moves along the bottom of the screen |
| conj.varYtopbotRatio | The total variance between left and right eye in the Y axis around forced average of zero for the ratio of the segment where the visual stimulus moves across the top of the screen to the segment where the visual stimulus moves across the bottom of the screen |
Table 3.
Eye tracking metrics (median and IQR) distinguishing uninjured adolescents from those with acute or persistent concussion symptoms.
| Acute Concussion Symptoms (N = 130) | Persistent Concussion Symptoms (N = 89) | Uninjured (N = 178) | Adjusted P-values | Post-hoc Test P-Values | |
|---|---|---|---|---|---|
| left.pupilsizemean | 2,087.13 (1,830.50, 2,449.87) | 2,247.83 (1,673.73, 2,601.17) | 1,327.01 (1,057.57, 1,660.14) | < .001 | Acute v. Persistent: .46 Acute v. Uninjured: < .001 Persistent v. Uninjured: < .001 |
| left.pupilsizemedian | 2,079.00 (1,810.00, 2,447.25) | 2,243.00 (1,667.50, 2,609.50) | 1,278.00 (1,052.00, 1,640.50) | < .001 | Acute v. Persistent: > .43 Acute v. Uninjured: < .001 Persistent v. Uninjured: < .001 |
| right.pupilsizemean | 1,949.90 (1,619.07, 2,488.29) | 2,128.56 (1,681.00, 2,579.42) | 1,264.09 (1,011.58, 1,603.89) | < .001 | Acute v. Persistent: .22 Acute v. Uninjured: < .001 Persistent v. Uninjured: < .001 |
| right.pupilsizemedian | 1,930.50 (1,596.75, 2,469.00) | 2,122.00 (1,661.50, 2,608.88) | 1,248.00 (990.50, 1,587.00) | < .001 | Acute v. Persistent: .20 Acute v. Uninjured: < .001 Persistent v. Uninjured: < .001 |
| left.pupilsizeminabs | 1,048.50 (646.25, 1,394.25) | 1,200.00 (862.00, 1,611.00) | 762.00 (532.75, 1,002.00) | < .001 | Acute v. Persistent: .08 Acute v. Uninjured: < .001 Persistent v. Uninjured: < .001 |
| left.pupilsizemaxabs | 2,865.00 (2,313.25, 3,349.50) | 2,948.00 (2,401.00, 3,555.00) | 2,156.00 (1,749.50, 2,787.50) | < .001 | Acute v. Persistent: > .99 Acute v. Uninjured: < .001 Persistent v. Uninjured: < .001 |
| right.pupilsizeminabs | 1,021.00 (673.00, 1,374.00) | 1,212.00 (948.00, 1,622.00) | 715.00 (509.25, 953.75) | < .001 | Acute v. Persistent: .04 Acute v. Uninjured: < .001 Persistent v. Uninjured: < .001 |
| right.pupilsizemaxabs | 2,652.00 (2,175.75, 3,234.75) | 2,903.00 (2,308.00, 3,539.00) | 2,052.00 (1,631.50, 2,551.75) | < .001 | Acute v. Persistent: .54 Acute v. Uninjured: < .001 Persistent v. Uninjured: < .001 |
| conj.pupilsizediffmean | 184.45 (113.63, 269.44) | 191.51 (106.27, 286.01) | 117.15 (64.28, 196.57) | .02 | Acute v. Persistent: > .99 Acute v. Uninjured: < .001 Persistent v. Uninjured: < .001 |
| conj.pupilsizediffmedian | 180.50 (100.00, 260.00) | 173.00 (95.00, 270.00) | 109.50 (58.00, 189.25) | .03 | Acute v. Persistent: > .99 Acute v. Uninjured: < .001 Persistent v. Uninjured: < .001 |
| conj.pupilsizediffvar | 6,250.63 (3,841.05, 10,860.39) | 6,594.06 (3,769.28, 13,460.44) | 2,833.55 (1,410.97, 6,255.91) | < .001 | Acute v. Persistent: > .99 Acute v. Uninjured: < .001 Persistent v. Uninjured: < .001 |
| conj.varYbot | 0.002 (0.001, 0.005) | 0.003 (0.002, 0.009) | 0.001 (0.001, 0.003) | < .001 | Acute v. Persistent: .04 Acute v. Uninjured: <.001 Persistent v. Uninjured: <.001 |
| conj.varYtopbotRatio | 1.01 (0.40, 5.79) | 0.93 (0.38, 2.57) | 2.10 (0.85, 7.50) | .004 | Acute v. Persistent: >.99 Acute v. Uninjured: <.001 Persistent v. Uninjured: .001 |
Adjusted P-values are reported by multiplying the actual p-value by the number of comparisons. IQR = interquartile range
Exploratory Analysis of Stratification by Sex
To explore changes in eye position, saccadic movement, and pupillary dynamic metric post-injury by sex, eye tracking metrics were compared between uninjured adolescents, and those with acute or persistent concussion symptoms among female and male subjects separately. Demographic and clinical characteristics of male and female participants can be found in Appendix Table A4 and A5. After Bonferroni correction, twelve of thirteen metrics found to be significantly different between uninjured participants and those with acute or persistent concussion symptoms in the overall sample were also significantly different among female subjects according to status (uninjured, acute or persistent concussion symptoms) (Table 4). In contrast, only four eye tracking metrics were significantly associated with concussion status (Table 5).
Table 4.
Eye tracking metrics median and IQR values in female subjects.
| Acute Concussions Symptoms (N = 62) | Persistent Concussion Symptoms (N = 62) | Uninjured (N = 95) | Adjusted P-values | Post-hoc Test P-Values | |
|---|---|---|---|---|---|
| left.pupilsizemean | 2,087.13 (1,830.50, 2,449.87) | 2,247.83 (1,673.73, 2,601.17) | 1,327.01 (1,057.57, 1,660.14) | < .001 | Acute v. Persistent: > .99 Acute v. Uninjured: < .001 Persistent v. Uninjured: < .001 |
| left.pupilsizemedian | 2,079.00 (1,810.00, 2,447.25) | 2,243.00 (1,667.50, 2,609.50) | 1,278.00 (1,052.00, 1,640.50) | < .001 | Acute v. Persistent: > .99 Acute v. Uninjured: < .001 Persistent v. Uninjured: < .001 |
| right.pupilsizemean | 1,949.90 (1,619.07, 2,488.29) | 2,128.56 (1,681.00, 2,579.42) | 1,264.09 (1,011.58, 1,603.89) | < .001 | Acute v. Persistent: > .99 Acute v. Uninjured: < .001 Persistent v. Uninjured: < .001 |
| right.pupilsizemedian | 1,930.50 (1,596.75, 2,469.00) | 2,122.00 (1,661.50, 2,608.88) | 1,248.00 (990.50, 1,587.00) | < .001 | Acute v. Persistent: > .99 Acute v. Uninjured: < .001 Persistent v. Uninjured: < .001 |
| left.pupilsizeminabs | 1,203.50 (766.50, 1,443.25) | 1,254.50 (897.25, 1,639.50) | 740.00 (535.00, 955.50) | < .001 | Acute v. Persistent: .58 Acute v. Uninjured: < .001 Persistent v. Uninjured: < .001 |
| left.pupilsizemaxabs | 2,929.00 (2,619.25, 3,361.25) | 2,952.50 (2,394.00, 3,523.50) | 1,993.00 (1,652.00, 2,631.00) | < .001 | Acute v. Persistent: > .99 Acute v. Uninjured: < .001 Persistent v. Uninjured: < .001 |
| right.pupilsizeminabs | 1,155.00 (728.25, 1,422.75) | 1,220.00 (1,021.00, 1,676.75) | 711.00 (514.00, 936.50) | < .001 | Acute v. Persistent: .29 Acute v. Uninjured: < .001 Persistent v. Uninjured: < .001 |
| right.pupilsizemaxabs | 2,862.00 (2,413.25, 3,341.50) | 2,878.50 (2,293.00, 3,496.75) | 1,993.00 (1,600.50, 2,423.50) | < .001 | Acute v. Persistent: > .99 Acute v. Uninjured: < .001 Persistent v. Uninjured: < .001 |
| conj.pupilsizediffmean | 198.90 (129.61, 271.89) | 195.00 (109.11, 287.83) | 109.54 (57.26, 178.06) | < .001 | Acute v. Persistent: > .99 Acute v. Uninjured: <.001 Persistent v. Uninjured: < .001 |
| conj.pupilsizediffmedian | 189.50 (125.50, 268.25) | 192.00 (102.75, 281.25) | 98.00 (51.50, 168.00) | < .001 | Acute v. Persistent: > .99 Acute v. Uninjured: < .001 Persistent v. Uninjured: < .001 |
| conj.pupilsizediffvar | 6,958.52 (4,566.90, 11,788.72) | 6,953.30 (3,730.72, 13,544.58) | 2,399.70 (1,011.98, 5,351.12) | < .001 | Acute v. Persistent: > .99 Acute v. Uninjured: < .001 Persistent v. Uninjured: < .001 |
| conj.varYbot | 0.003 (0.001, 0.005) | 0.004 (0.002, 0.009) | 0.001 (0.001, 0.003) | .008 | Acute v. Persistent: .29 Acute v. Uninjured: .02 Persistent v. Uninjured: < .001 |
| conj.varYtopbotRatio | 0.84 (0.38, 5.27) | 0.96 (0.43, 2.38) | 2.96 (0.77, 7.66) | .26 |
Adjusted P-values are reported by multiplying the actual p-value by the number of comparisons. Bold values are significant.
Table 5.
Eye tracking metrics median and IQR values in male subjects.
| Acute Concussions Symptoms (N = 68) | Persistent Concussion Symptoms (N = 27) | Uninjured (N = 83) | Adjusted P-values | Post-hoc Test P-Values | |
|---|---|---|---|---|---|
| left.pupilsizemean | 1,882.89 (1,540.90, 2,268.86) | 2,140.47 (1,789.32, 2,869.61) | 1,501.37 (1,194.04, 1,916.11) | .003 | Acute v. Persistent: > .99 Acute v. Uninjured: < .001 Persistent v. Uninjured: < .001 |
| left.pupilsizemedian | 1,883.50 (1,532.75, 2,264.25) | 2,137.00 (1,775.00, 2,866.50) | 1,450.00 (1,149.00, 1,883.00) | .003 | Acute v. Persistent: > .99 Acute v. Uninjured: < .001 Persistent v. Uninjured: < .001 |
| right.pupilsizemean | 1,760.48 (1,442.74, 2,209.21) | 1,960.56 (1,738.08, 2,722.14) | 1,393.98 (1,091.12, 1,864.82) | < .001 | Acute v. Persistent: > .99 Acute v. Uninjured: < .001 Persistent v. Uninjured: < .001 |
| right.pupilsizemedian | 1,753.00 (1,446.00, 2,145.00) | 1,952.00 (1,715.00, 2,732.00) | 1,374.00 (1,084.00, 1,873.50) | < .001 | Acute v. Persistent: > .99 Acute v. Uninjured: < .001 Persistent v. Uninjured: < .001 |
| left.pupilsizeminabs | 988.50 (621.00, 1,339.75) | 1,000.00 (815.50, 1,481.50) | 788.00 (545.50, 1,072.00) | > .99 | |
| left.pupilsizemaxabs | 2,599.00 (2,177.75, 3,308.25) | 2,874.00 (2,532.50, 3,775.00) | 2,350.00 (1,844.50, 2,943.00) | > .99 | |
| right.pupilsizeminabs | 914.50 (652.00, 1,303.75) | 1,147.00 (716.50, 1,455.00) | 772.00 (503.50, 985.50) | .13 | |
| right.pupilsizemaxabs | 2,456.50 (2,016.00, 3,182.75) | 2,983.00 (2,440.00, 3,624.50) | 2,218.00 (1,698.50, 2,730.00) | .06 | |
| conj.pupilsizediffmean | 178.12 (104.66, 257.71) | 152.12 (93.51, 230.90) | 157.70 (77.11, 247.67) | > .99 | |
| conj.pupilsizediffmedian | 166.50 (83.50, 250.50) | 130.00 (84.50, 217.00) | 122.00 (67.00, 197.00) | > .99 | |
| conj.pupilsizediffvar | 5,877.04 (3,199.47, 10,463.39) | 5,961.67 (3,961.14, 12,436.00) | 3,073.95 (1,798.52, 6,950.02) | .11 | |
| conj.varYbot | 0.002 (0.001, 0.004) | 0.003 (0.002, 0.008) | 0.001 (0.001, 0.003) | .22 | |
| conj.varYtopbotRatio | 1.15 (0.42, 6.15) | 0.72 (0.23, 2.71) | 1.93 (1.03, 5.16) | > .99 |
Adjusted P-values are reported by multiplying the actual p-value by the number of comparisons. Bold values are significant.
Regression Model
Based on the univariate findings of the eye tracking metrics, we applied logistic regression models to determine whether eye tracking metrics can augment clinical and demographic information in the differentiation of uninjured from concussed adolescents, regardless of how many days since injury the eye tracking assessment was completed. We chose to combine our two groups of cases and conduct the regression analysis on two groups as the univariate analyses did not show significant differences between acute and persistent cases. Any participants with missing demographics or clinical data such as Post-Concussion Symptom Inventory total score or self-reported prior history of concussion were excluded from this analysis, resulting in 148 uninjured and 207 concussed adolescents (122 acute and 85 persistent).
To reduce redundancy and collinearity in the model due to high correlations between some of the 13 eye tracking metrics found to be significantly different between uninjured and concussed adolescents, a principal components analysis was applied. A similarity matrix calculated with Pearson’s R can be found in Appendix Figure A14. A total of four principal components described 84.5% of the variance within the 13 eye tracking metrics for this set of participants. A scree plot depicting the proportion of variance explained for each principal component can be found in Appendix Figure A15. A table describing the contribution of each variable to principal components 1 through 4 can be found in Appendix Table A6.
A null logistic regression model only including the clinical and demographics metrics of age, Post-Concussion Symptom Inventory total score, sex, and self-reported prior history of concussion was used to predict concussion status. A second logistic regression model included the same clinical and demographics metrics as well as the first four principal components of the eye tracking metrics to predict concussion status. The second model that included eye tracking metrics displayed a significantly better fit based on DeLong’s comparison method (AUC [95% CI]: 0.889 [0.857–0.922], Sensitivity: 73.8%, Specificity: 89.3%) than the null model (AUC [95% CI]: 0.847 [0.807–0.886], Sensitivity: 68.9%, Specificity: 89.3%) (P < .001). Model results are reported in Appendix Tables A7 and A8.
DISCUSSION
Vision and autonomic dysfunction are common sequelae of concussion in adolescents and may be a driver of both acute and persistent symptoms.5,7,9 Objective eye tracking technology may quickly identify vision disturbances after concussion to allow for earlier recognition, referral, and treatment, potentially reducing long-term effects.16–18 To our knowledge, this study is the first to demonstrate the utility of objective eye tracking in distinguishing uninjured adolescents from those with acute or persistent concussion symptoms based on metrics of eye position, saccadic movement, and pupillary dynamics. Prior work performed in an emergency department and a tertiary specialty care clinic used a similar experimental protocol and found different eye tracking metrics that distinguished between concussed and uninjured participants.16,17 The findings of this study add to prior studies by including those with acute and persistent concussion symptoms. In addition, the metrics analyzed in this study expanded on those previously studied by examining not only eye position, but also saccadic movement and pupillary dynamics.
Objective Measures of Vision and Autonomic Dysfunction
The increase in pupil size during the eye tracking assessment found in both those with acute and persistent concussion symptoms in comparison to uninjured adolescents may be due to an excitatory-inhibitory autonomic imbalance post-injury, resulting in excessive sympathetic tone.26 These findings align with prior work that found amplification in multiple metrics quantifying monocular pupillary light reflex among adolescents injured within 28 days of injury.21 Of note, in our study, three pupillary dynamic metrics related to differences between left and right pupil area were larger among those with acute and persistent concussion symptoms compared to uninjured participants. Few studies have explored pupillary asymmetry post-concussion in adolescents during a dynamic eye tracking task; previous studies that have explored pupillary asymmetry post-concussion during assessments of the pupillary light reflex have not found significant asymmetry in pupillary response, but were performed with the pupil in a stationary position.27,28 In addition, the eye position metrics found to be significantly different in both those with acute, as well as persistent, concussion symptoms were also related to differences between the left and right eyes. These findings suggest that, in the adolescent population, the dynamic task of tracking a moving video places a workload strain on the autonomic nervous system, potentially enhancing the asymmetry to a greater degree than the static assessment of the pupillary light reflex.
While we identified thirteen metrics that were significantly different between uninjured adolescents and those with either acute or persistent concussion symptoms, after adjusting for multiple comparisons, most metrics analyzed were not significantly associated with concussion status, and almost none were significantly different between acute cases and persistent cases. This could be due to the heterogeneity of concussion, as it is likely that not all concussions had visual dysfunction after injury.5 It is also possible that the automatically derived metrics are not all clinically relevant in this population. While the application of Bonferroni corrections to account for multiple comparisons is a conservative method that generally controls for false positives, there is a possibility that one or more of these metrics was falsely associated with concussion. This may be of greater relevance for the two metrics of eye position as only these two, out of a total of 183 metrics of eye position, were found to be associated with concussion in comparison to eleven out of a total of thirteen metrics of pupillary dynamics. Of note, no saccadic movement metrics were found to distinguish between either those with acute or persistent concussion symptoms and uninjured participants. This may be because, while saccadic eye movements were quantified when the participant glanced between objects within the video stimulus, the primary eye tracking task of following the video stimulus that is moving smoothly along the edges of the screen, is smooth pursuit.
Prior studies have looked at the BOX score, a binary classifier derived from a best subset regression model that combines many of the eye tracking metrics obtained from this assessment and has been used for diagnostic purposes in pediatric concussion populations and has also been associated with symptom severity.16,18,29 In this study, however, BOX score was not significantly associated with concussion status (Appendix Tables A9–A12). Thus, we chose to reduce the redundancy of the eye tracking metrics found to be significantly different between groups and verify the discriminatory capability of these metrics through a principal components analysis and applied them as predictors in a logistic regression model. The model that included the transformed eye tracking metrics along with clinical and demographics information achieved a similar area underneath the ROC curve to a prior study that included concussed and uninjured participants between 4 and 21 years of age from both sexes.16 While this model performed better than the model that included clinical and demographics data alone, the generalizability of the principal components analysis outside of this set of participants is unknown. Future work should include validating the association of these thirteen metrics with concussion status in a different sample of uninjured and concussed adolescents. Future work should also explore alternative methods of distilling these 256 metrics for application to a heterogeneous concussed adolescent population and integration into existing clinical concussion protocols for monitoring recovery.
Sex-Specific Differences
This study also explored the association of injury status and eye tracking metrics among female and male subjects separately. As we found significant differences between uninjured adolescents and those with concussions among female participants for twelve of thirteen metrics, but only in four among male participants, we suspect the female participant data were driving the population differences between uninjured, acute and persistent concussions in this cohort. While the sample size, particularly of males with persistent symptoms, is fairly low, this supports recent findings that female adolescents demonstrate greater oculomotor and vestibular dysfunction in comparison to male adolescents after a concussion and female pediatric patients take longer to recover from visual and vestibular deficits than their male counterparts.22,30 The preliminary sex-specific findings from this study, combined with evidence that female adolescents present with greater symptom severity and longer recovery times, indicate that future work should prospectively investigate the evolution of these eye tracking metrics across recovery in both male and female adolescents with concussion to understand if acute measures can serve prognostic purposes.30–33
Limitations
The population was limited to adolescents aged 13 to 17 and thus, may not be generalizable to younger pediatric or older adult populations. In addition, adolescents with concussions were recruited from a specialized tertiary care center and the number of days after injury the eye tracking assessment was completed was not controlled, so it is possible that the utility of metrics found to be significantly different in these populations are not applicable to individuals completing the assessment hours after injury or more than 3 months after injury. It is likely that not all concussed participants presented with visual disturbances after concussion, and by combining participants with and without visual disturbances, the ability to detect between-group differences for visual function was reduced. However, this represents a typical clinical population and examining the utility of eye tracking in this cohort is clinically relevant. It is possible that some participants had underlying diagnosed or undiagnosed vision problems that might account for differences in objective measures of eye movements after concussion. Iris color, which may have an impact on automatic pupil detection with this eye tracker, was not collected in this study. Future work should include iris color as part of data collection to better understand any potential effect of iris color on these metrics. Only one visual stimulus, not well studied in the literature outside of the use of the EyeBOX, was used in this study. Future work should investigate other visual stimuli and paradigms to determine whether other standard assessments of oculomotor function can identify deficits in concussed children.
CONCLUSIONS
Deficits after a concussion are not specific to a single neurological domain. Eye tracking is a promising objective method that may potentially supplement current clinical assessments as a dynamic objective measure of vision and autonomic dysfunction. In this study, thirteen eye tracking metrics were found to be significantly different between uninjured adolescents, and those with either acute or persistent concussion symptoms, encompassing the domains of eye position, saccadic movement, and pupillary dynamics. Sex-specific differences were identified, where most eye tracking metrics were significantly different based on injury status in females, but only four in males. An analytic model that included transformed eye tracking metrics with clinical and demographics information was better able to discriminate uninjured adolescents from concussed adolescents than a model with clinical and demographics information alone. Future work should involve modifying and consolidating these metrics in a generalizable way and combining them with existing clinical measures to monitor recovery in a heterogeneous adolescent concussion population.
ACKNOWLEDGMENTS
The authors thank Ronni S. Kessler, MS, Fairuz Mohammed, MS, MPH, Alexis Brzuchalski, MPH, Daniele Fedonni, MS, Melissa Pfieffer, MPH, Anne Mozel, MS, Ari Fish, BS, Julia Vanni, BS, Taylor Valerio, BA, and Shelly Sharma, BA, of Children’s Hospital of Philadelphia for their contributions to this study. In addition, we thank the students and parents from the Shipley School for their participation. We appreciate the support from the Shipley School administration, faculty, and athletic department: Steve Piltch, MEd, EdD, Mark Duncan, MEd, Katelyn Taylor, BS, Dakota Carroll, MS, Kimberly Shaud, BS, Kayleigh Jenkins, BS, and Michael Turner, MEd, without whose support this research would not have been possible.
APPENDICES
Appendix Tables A1–A3, describe the AUC, specificity, sensitivity, and effect size between each pair of groups (acute v. uninjured, persistent v. uninjured, and acute v. persistent, respectively) for the 13 metrics found to be significantly different among groups.
Appendix Table A1.
Area under the curve (AUC), specificity, sensitivity, and effect size between acute cases and uninjured adolescents for each of the 13 metrics significantly different between groups.
| Acute vs. Uninjured | ||||
|---|---|---|---|---|
|
| ||||
| AUC (95% CI) | Specificity | Sensitivity | Effect Size (95% CI) | |
| left.pupilsizemean | 0.75 (0.69, 0.80) | 0.77 | 0.67 | 0.84 (0.61, 1.08) |
| left.pupilsizemedian | 0.75 (0.66, 0.86) | 0.86 | 0.58 | 0.85 (0.61, 1.08) |
| right.pupilsizemean | 0.75 (0.69, 0.81) | 0.78 | 0.65 | 0.87 (0.63, 1.11) |
| right.pupilsizemedian | 0.75 (0.70, 0.81) | 0.81 | 0.63 | 0.87 (0.63, 1.10) |
| left.pupilsizemaxabs | 0.70 (0.65, 0.76) | 0.82 | 0.54 | 0.72 (0.48, 0.95) |
| right.pupilsizemaxabs | 0.71 (0.65, 0.77) | 0.9 | 0.44 | 0.75 (0.52, 0.98) |
| left.pupilsizeminabs | 0.65 (0.59, 0.72) | 0.4 | 0.9 | 0.58 (0.34, 0.81) |
| right.pupilsizeminabs | 0.69 (0.59, 0.72) | 0.45 | 0.9 | 0.74 (0.50, 0.97) |
| conj.pupilsizediffmean | 0.66 (0.59, 0.72) | 0.6 | 0.69 | 0.49 (0.26, 0.72) |
| conj.pupilsizediffmedian | 0.65 (0.59, 0.71) | 0.6 | 0.67 | 0.49 (0.26, 0.72) |
| conj.pupilsizediffvar | 0.72 (0.66, 0.78) | 0.75 | 0.65 | 0.37 (0.15, 0.60) |
| conj.varYbot | 0.62 (0.55, 0.68) | 0.66 | 0.58 | 0.10 (−0.12, 0.33) |
| conj.varYtopbotRatio | 0.7 (0.55, 0.68) | 0.44 | 0.8 | 0.25 (0.02, 0.48) |
Appendix Table A2.
Area under the curve (AUC), specificity, sensitivity, and effect size between persistent cases and uninjured adolescents for each of the 13 metrics significantly different between groups.
| Persistent vs. Uninjured | ||||
|---|---|---|---|---|
|
| ||||
| AUC (95% CI) | Specificity | Sensitivity | Effect Size (95% CI) | |
| left.pupilsizemean | 0.78 (0.73, 0.84) | 0.8 | 0.67 | 1.06 (0.79, 1.33) |
| left.pupilsizemedian | 0.79 (0.73, 0.84) | 0.78 | 0.69 | 1.06 (0.80, 1.34) |
| right.pupilsizemean | 0.80 (0.74, 0.85) | 0.81 | 0.7 | 1.16 (0.88, 1.43) |
| right.pupilsizemedian | 0.80 (0.74, 0.85) | 0.83 | 0.68 | 1.16 (0.88, 1.43) |
| left.pupilsizemaxabs | 0.73 (0.67, 0.79) | 0.89 | 0.48 | 0.83 (0.56, 1.09) |
| right.pupilsizemaxabs | 0.75 (0.6, 0.81) | 0.88 | 0.53 | 0.93 (0.66, 1.20) |
| left.pupilsizeminabs | 0.74 (0.67, 0.80) | 0.71 | 0.7 | 0.94 (0.67, 1.20) |
| right.pupilsizeminabs | 0.78 (0.72, 0.85) | 0.72 | 0.82 | 1.14 (0.86, 1.41) |
| conj.pupilsizediffmean | 0.65 (0.58, 0.72) | 0.56 | 0.71 | 0.57 (0.32, 0.84) |
| conj.pupilsizediffmedian | 0.65 (0.58, 0.72) | 0.52 | 0.71 | 0.54 (0.28, 0.80) |
| conj.pupilsizediffvar | 0.72 (0.66, 0.78) | 0.76 | 0.63 | 0.41 (0.15, 0.67) |
| conj.varYbot | 0.71 (0.64, 0.78) | 0.78 | 0.58 | 0.02 (−0.24, 0.27) |
| conj.varYtopbotRatio | 0.65 (0.58, 0.72) | 0.73 | 0.59 | 0.29 (0.03, 0.54) |
Appendix Table A3.
Area under the curve (AUC), specificity, sensitivity, and effect size between acute and persistent cases for each of the 13 metrics significantly different between groups.
| Acute vs. Persistent | ||||
|---|---|---|---|---|
|
| ||||
| AUC (95% CI) | Specificity | Sensitivity | Effect Size (95% CI) | |
| left.pupilsizemean | 0.56 (0.48, 0.64) | 0.68 | 0.51 | 0.22 (0.05, 0.49) |
| left.pupilsizemedian | 0.56 (0.49, 0.64) | 0.72 | 0.46 | 0.23 (0.05, 0.50) |
| right.pupilsizemean | 0.58 (0.50, 0.66) | 0.79 | 0.36 | 0.27 (0.00, 0.55) |
| right.pupilsizemedian | 0.58 (0.50, 0.66) | 0.75 | 0.42 | 0.27 (0.00, 0.55) |
| left.pupilsizemaxabs | 0.54 (0.46, 0.61) | 0.82 | 0.3 | 0.10 (−0.17, 0.38) |
| right.pupilsizemaxabs | 0.55 (0.47, 0.63) | 0.75 | 0.38 | 0.17 (−0.10, 0.44) |
| left.pupilsizeminabs | 0.58 (0.50, 0.66) | 0.85 | 0.3 | 0.27 (0.00, 0.54) |
| right.pupilsizeminabs | 0.59 (0.52, 0.67) | 0.54 | 0.69 | 0.30 (0.03, 0.57) |
| conj.pupilsizediffmean | 0.51 (0.43, 0.59) | 0.72 | 0.36 | 0.11 (−0.16, 0.38) |
| conj.pupilsizediffmedian | 0.51 (0.43, 0.58) | 0.62 | 0.46 | 0.10 (−0.20, 0.34) |
| conj.pupilsizediffvar | 0.51 (0.43, 0.58) | 0.85 | 0.26 | 0.25 (−0.02, 0.52) |
| conj.varYbot | 0.61 (0.53, 0.68) | 0.76 | 0.44 | 0.38 (0.11, 0.66) |
| conj.varYtopbotRatio | 0.52 (0.44, 0.59) | 0.4 | 0.73 | 0.08 (−0.20, 0.35) |
Appendix Table A4, describes demographics and clinical characteristics of female participants only. Appendix Table A5 describes demographics and clinical characteristics of male participants only.
Appendix Table A4.
Demographics and clinical characteristics of female participants.
| Acute Concussion Symptoms (N = 62) | Persistent Concussion Symptoms (N = 62) | Uninjured (N = 95) | P-value | Post-hoc Test P-values | |
|---|---|---|---|---|---|
|
| |||||
| Age | 15.6 (14.5, 17.3) | 16.0 (14.8, 16.8) | 15.0 (14.3, 16.1) | 0.02 | Acute v. Persistent: .98 Acute v. Uninjured: .04 Persistent v. Uninjured: .07 |
| Days Following Injury | 4.5 (6.0, 20.8) | 51.0 (38.2, 67.5) | |||
| PCSI Total Score* | 40.0 (18.0, 60.5) | 34.0 (10.2, 52.0) | 4.5 (0.0, 8.0) | <.001 | Acute v. Persistent: 0.37 Acute v. Uninjured: < .001 Persistent v. Uninjured: < .001 |
| Race/ethnicity | .06 | ||||
| Hispanic | 2 (3.2%) | 4 (6.5%) | 3 (3.2%) | ||
| NH black | 4 (6.5%) | 8 (12.9%) | 11 (11.6%) | ||
| NH white | 49 (79.0%) | 48 (77.4%) | 62 (65.3%) | ||
| NH other/Unknown/Not Reported | 7 (11.3%) | 2 (3.2%) | 19 (20.0%) | ||
| Prior History of Concussion** | 24 (38.7%) | 26 (42.6%) | 25 (26.6%) | .09 | |
A total of 59 with acute concussion symptoms, 60 with persistent concussion symptoms, and 82 uninjured completed PCSI.
One with acute concussion symptoms and one with persistent concussion symptoms did not report on prior history of concussion.
Appendix Table A5.
Demographics and clinical characteristics of male participants.
| Acute Concussion Symptoms (N = 68) | Persistent Concussion Symptoms (N = 27) | Uninjured (N = 83) | P-value | Post-hoc Test P-values | |
|---|---|---|---|---|---|
|
| |||||
| Age | 15.6 (14.5, 16.6) | 16.2 (14.5, 17.3) | 15.2 (14.2, 16.4) | .24 | |
| Days Following Injury | 9.0 (3.0, 17.2) | 56.0 (46.5, 67.5) | |||
| PCSI Total Score* | 16.0 (3.5, 41.0) | 16.0 (3.5, 41.0) | 1.0 (0.0, 5.2) | <.001 | Acute v. Persistent: 0.78 Acute v. Uninjured: < .001 Persistent v. Uninjured: < .001 |
| Race/ethnicity | .77 | ||||
| Hispanic | 3 (4.4%) | 1 (3.7%) | 5 (6.0%) | ||
| NH black | 5 (7.4%) | 3 (11.1%) | 5 (6.0%) | ||
| NH white | 53 (77.9%) | 21 (77.8%) | 59 (71.1%) | ||
| NH other/Unknown/Not Reported | 7 (10.3%) | 2 (7.4%) | 14 (16.9%) | ||
| Prior History of Concussion | 33 (48.5%) | 11 (40.7%) | 25 (30.1%) | .06 | |
A total of 63 with acute concussion symptoms, 25 persistent concussion symptoms, and 66 uninjured completed Post-Concussion Symptom Inventory. Bold numbers are significant.
Appendix Table A6, describes the contribution of each variable to the first four principal components.
Appendix Table A6.
Contribution of each variable to the first four principal components.
| PC1 | PC2 | PC3 | PC4 | |
|---|---|---|---|---|
|
| ||||
| left.pupilsizemean | 13.24 | 0.26 | 0.01 | 0.01 |
| left.pupilsizemedian | 12.72 | 2.37 | 0.08 | 0.01 |
| right.pupilsizemean | 13.20 | 0.26 | 0.01 | 0.00 |
| right.pupilsizemedian | 12.67 | 2.37 | 0.07 | 0.02 |
| left.pupilsizemaxabs | 7.60 | 0.10 | 5.43 | 3.18 |
| right.pupilsizemaxabs | 7.64 | 1.60 | 2.00 | 1.16 |
| left.pupilsizeminabs | 12.31 | 0.15 | 0.20 | 0.03 |
| right.pupilsizeminabs | 11.97 | 2.45 | 0.37 | 0.02 |
| conj.pupilsizediffmean | 3.30 | 41.51 | 0.92 | 0.51 |
| conj.pupilsizediffmedian | 3.09 | 40.43 | 2.10 | 0.60 |
| conj.pupilsizediffvar | 1.58 | 7.36 | 19.78 | 0.48 |
| conj.varYbot | 0.01 | 0.71 | 46.05 | 32.17 |
| conj.varYtopbotRatio | 0.67 | 0.42 | 23.06 | 61.82 |
Appendix Table A7, reports the results from the null logistic regression model.
Appendix Table A7.
Logistic regression results for the null model, where age, sex, Post-Concussion Symptom Inventory (PCSI) total score, and self-reported prior history of concussion are predictor variables and concussion status is the outcome variable.
| Outcome measure | β coefficient | Standard error | 95% Confidence Interval | P value | Odds Ratio (95% CI) |
|---|---|---|---|---|---|
|
| |||||
| Age | 0.12 | 0.09 | 0.94, 1.35 | .21 | 1.12 (0.94, 1.35) |
| Sex | 0.53 | 0.28 | 0.98, 2.92 | .05 | 1.70 (0.99, 2.92) |
| PCSI total score | 0.09 | 0.01 | 1.07, 1.13 | < .001 | 1.10 (1.07, 1.13) |
| Prior history of concussion | 0.75 | 0.28 | 1.22, 3.70 | .007 | 2.13 (1.22, 3.70) |
Bold values are significant.
Appendix Table A8, reports the results from the logistic regression model including eye tracking metrics.
Appendix Table A8.
Logistic regression results for the model where age, sex, Post-Concussion Symptom Inventory (PCSI) total score, self-reported prior history of concussion, and the first four principal components of the eye tracking metrics are predictor variables and concussion status is the outcome variable.
| Outcome measure | β coefficient | Standard error | 95% Confidence Interval | P value | Odds Ratio (95% CI) |
|---|---|---|---|---|---|
|
| |||||
| Age | 0.20 | 0.10 | 1.00, 1.49 | .04 | 1.22 (1.00, 1.49) |
| Sex | 0.47 | 0.30 | 0.88, 2.89 | .12 | 1.60 (0.88, 2.90) |
| PCSI total score | 0.09 | 0.01 | 1.07, 1.12 | < .001 | 1.10 (1.07, 1.12) |
| Prior history of concussion | 0.59 | 0.31 | 0.99, 3.35 | .05 | 1.82 (0.99, 3.36) |
| PC1 | −0.38 | 0.07 | 0.59, 0.78 | < .001 | 0.68 (0.60, 0.78) |
| PC2 | −0.03 | 0.12 | 0.76, 1.23 | .79 | 0.97 (0.76, 1.23) |
| PC3 | −0.24 | 0.21 | 0.53, 1.18 | .24 | 0.79 (0.53, 1.18) |
| PC4 | 0.28 | 0.19 | 0.91, 1.92 | .14 | 1.32 (0.91, 1.92) |
Bold values are significant.
Appendix Table A9, reports the median and IQR of metrics found to be significantly different between concussed individuals and uninjured individuals in prior studies (BOX score, left.distLeft, right.distRight, conj.varXtopbotRatio, left.varYtop) for each group of participants.
Appendix Table A9.
Median interquartile range (IQR) values for variables found to be significantly different between concussed participants and uninjured participants for prior studies for acute, persistent, and uninjured participants.
| Acute Concussion Symptoms (N = 130) | Persistent Concussion Symptoms (N = 89) | Uninjured (N = 178) | |
|---|---|---|---|
|
| |||
| BOX Score | 3.9 (2.0, 8.0) | 5.6 (2.5, 10.7) | 3.8 (2.0, 8.6) |
| left.distLeft | 0.002 (0.002, 0.003) | 0.002 (0.002, 0.003) | 0.002 (0.002, 0.003) |
| right.distRight | 0.002 (0.002, 0.003) | 0.002 (0.002, 0.003) | 0.002 (0.002, 0.003) |
| conj.varXtopbotRatio | 1.39 (0.77, 2.36) | 1.23 (0.57, 2.48) | 1.61 (0.93, 2.85) |
| left.varYtop | 0.011 (0.006, 0.016) | 0.012 (0.007, 0.020) | 0.009 (0.006, 0.017) |
Appendix Tables A10–A12, describe the AUC, specificity, sensitivity, and effect size between each pair of groups (acute v. uninjured, persistent v. uninjured, and acute v. persistent, respectively) for the five metrics reported on in Appendix Table A9.
Appendix Table A10.
Area under the curve (AUC), specificity, sensitivity, and effect size between acute cases and uninjured adolescents for metrics found to be significantly different between concussed and uninjured participants in prior studies.
| Acute vs. Uninjured | ||||
|---|---|---|---|---|
|
| ||||
| AUC (95% CI) | Specificity | Sensitivity | Effect Size (95% CI) | |
| BOX Score | 0.49 (0.43, 0.56) | 0.87 | 0.21 | 0.06 (−0.17, 0.29) |
| left.distLeft | 0.55 (0.49, 0.62) | 0.90 | 0.21 | 0.14 (−0.09, 0.36) |
| right.distRight | 0.55 (0.48, 0.61) | 0.36 | 0.78 | 0.01 (−0.22, 0.24) |
| conj.varXtopbotRatio | 0.55 (0.48, 0.62) | 0.65 | 0.43 | 0.09 (−0.14, 0.32) |
| left.varYtop | 0.51 (0.45, 0.58) | 0.61 | 0.5 | 0.11 (−0.11, 0.34) |
Appendix Table A11.
Area under the curve (AUC), specificity, sensitivity, and effect size between persistent cases and uninjured adolescents for metrics found to be significantly different between concussed and uninjured participants in prior studies.
| Persistent vs. Uninjured | ||||
|---|---|---|---|---|
|
| ||||
| AUC (95% CI) | Specificity | Sensitivity | Effect Size (95% CI) | |
| BOX Score | 0.56 (0.50, 0.65) | 0.56 | 0.61 | 0.23 (−0.02, 0.45) |
| left.distLeft | 0.59 (0.52, 0.66) | 0.72 | 0.45 | 0.29 (0.03, 0.54) |
| right.distRight | 0.56 (0.49, 0.63) | 0.88 | 0.28 | 0.00 (−0.25, 0.25) |
| conj.varXtopbotRatio | 0.59 (0.51, 0.66) | 0.63 | 0.58 | 0.00 (−0.25, 0.26) |
| left.varYtop | 0.58 (0.51, 0.65) | 0.67 | 0.50 | 0.20 (−0.05, 0.46) |
APPENDIX TABLE A12.
Area under the curve (AUC), specificity, sensitivity, and effect size between acute and persistent cases for metrics found to be significantly different between concussed and uninjured participants in prior studies.
| Acute vs. Persistent | ||||
|---|---|---|---|---|
|
| ||||
| AUC (95% CI) | Specificity | Sensitivity | Effect Size (95% CI) | |
| BOX Score | 0.59 (0.51, 0.67) | 0.64 | 0.56 | 0.30 (0.03, 0.57) |
| left.distLeft | 0.54 (0.46, 0.61) | 0.46 | 0.66 | 0.16 (−0.11, 0.43) |
| right.distRight | 0.51 (0.44, 0.60) | 0.26 | 0.87 | 0.02 (−0.25, 0.29) |
| conj.varXtopbotRatio | 0.54 (0.46, 0.62) | 0.52 | 0.63 | 0.07 (−0.21, 0.34) |
| left.varYtop | 0.57 (0.49, 0.64) | 0.23 | 0.90 | 0.31 (0.04, 0.58) |
Appendix Figures A1–A13, depict violin plots of each group for each of the 13 significantly different eye tracking metrics, with a box plot showing median, upper quartile and lower quartile, as well as a diamond indicating the mean.
Appendix Figure A1.

Distribution of left.pupilsizemean for acute cases, persistent cases, and uninjured. Mean values for each group are indicated by the diamond point.
Appendix Figure A2.

Distribution of right.pupilsizemean for acute cases, persistent cases, and uninjured. Mean values for each group are indicated by the diamond point.
Appendix Figure A3.

Distribution of left.pupilsizemedian for acute cases, persistent cases, and uninjured. Mean values for each group are indicated by the diamond point.
Appendix Figure A4.

Distribution of right.pupilsizemedian for acute cases, persistent cases, and uninjured. Mean values for each group are indicated by the diamond point.
Appendix Figure A5.

Distribution of left.pupilsizeminabs for acute cases, persistent cases, and uninjured. Mean values for each group are indicated by the diamond point.
Appendix Figure A6.

Distribution of right.pupilsizeminabs for acute cases, persistent cases, and uninjured. Mean values for each group are indicated by the diamond point.
Appendix Figure A7.

Distribution of left.pupilsizemaxabs for acute cases, persistent cases, and uninjured. Mean values for each group are indicated by the diamond point.
Appendix Figure A8.
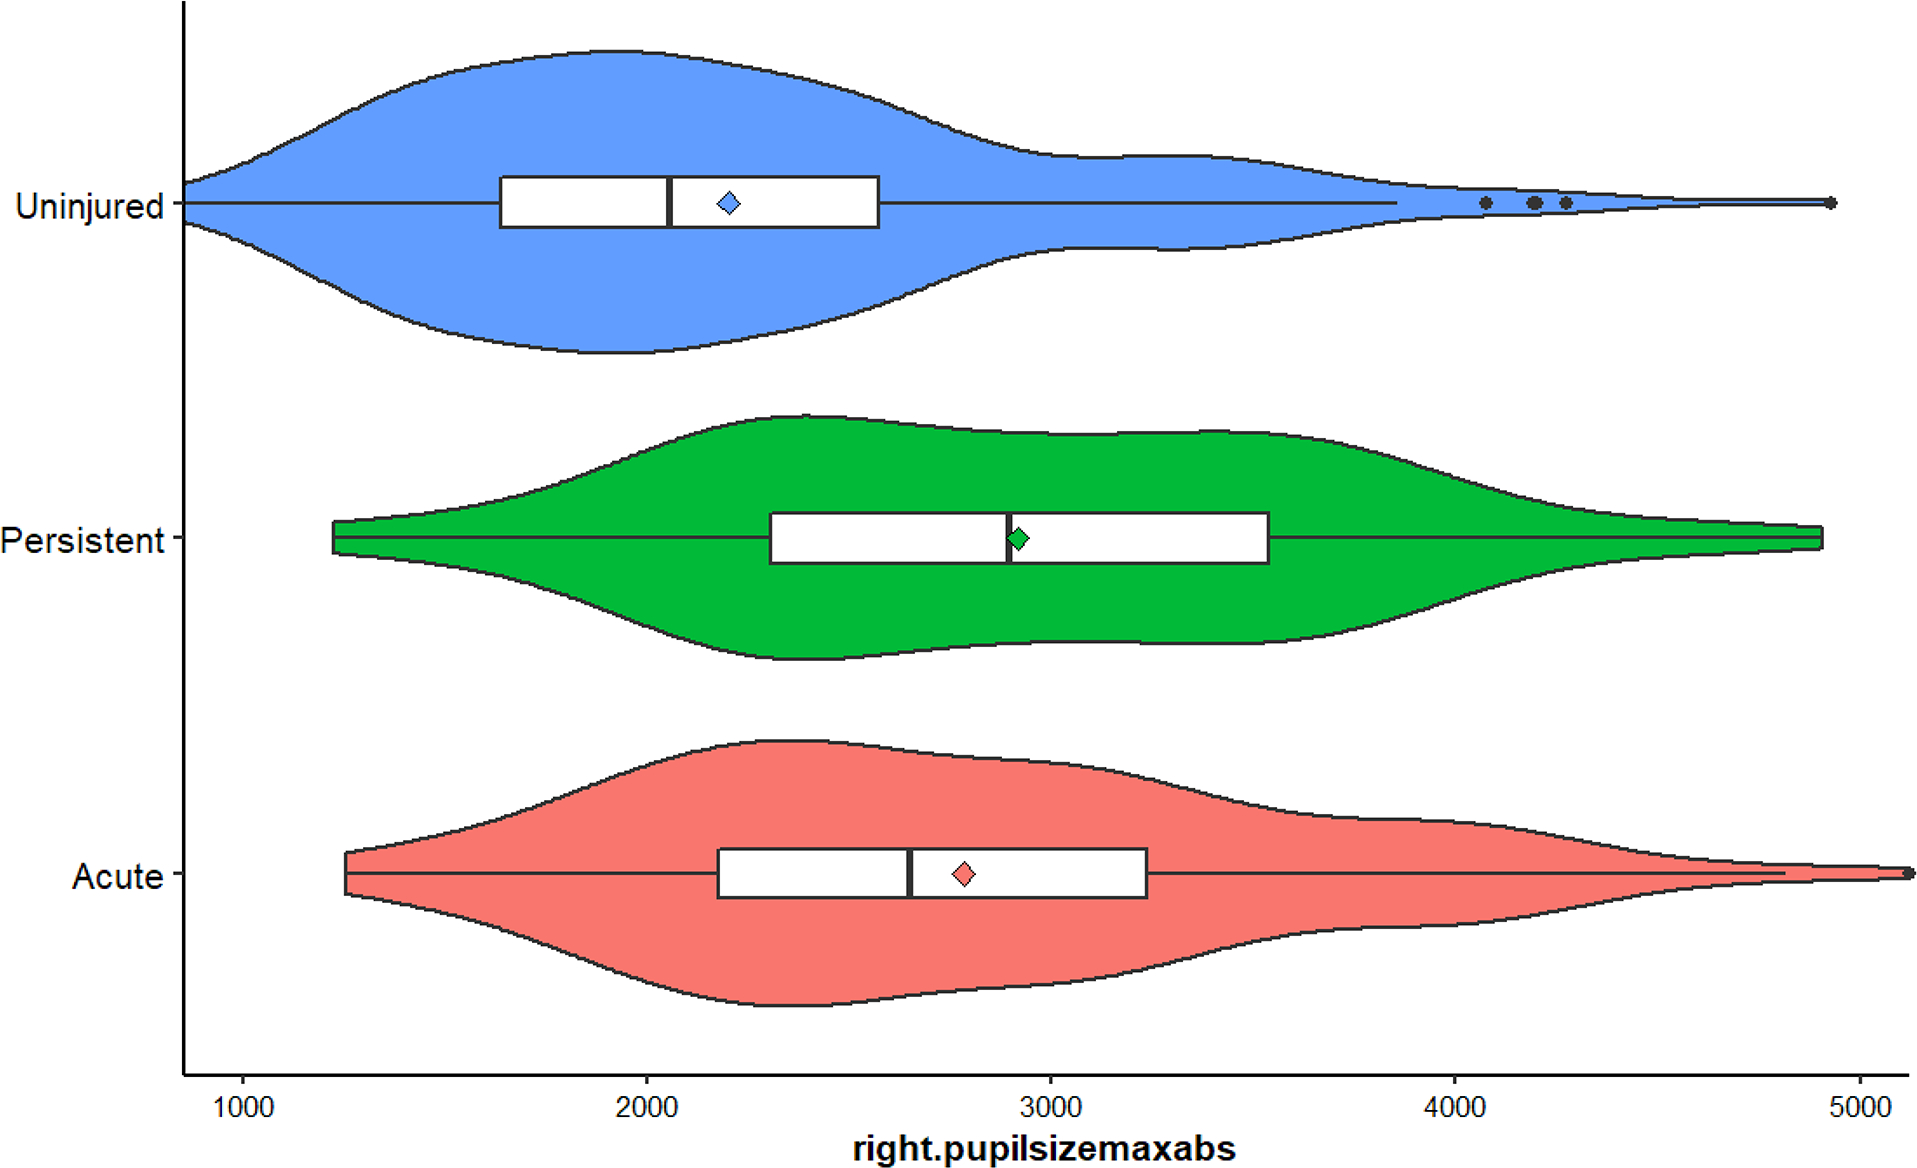
Distribution of right.pupilsizemaxabs for acute cases, persistent cases, and uninjured. Mean values for each group are indicated by the diamond point.
Appendix Figure A9.

Distribution of conj.pupilsizediffmean for acute cases, persistent cases, and uninjured. Mean values for each group are indicated by the diamond point.
Appendix Figure A10.

Distribution of conj.pupilsizediffmedian for acute cases, persistent cases, and uninjured. Mean values for each group are indicated by the diamond point.
Appendix Figure A11.

Distribution of conj.pupilsizediffvar for acute cases, persistent cases, and uninjured. Mean values for each group are indicated by the diamond point. Eight outliers were removed for this graph.
Appendix Figure A12.

Distribution of conj.varYbot for acute cases, persistent cases, and uninjured. Mean values for each group are indicated by the diamond point Twenty four outliers were removed for this graph.
Appendix Figure A13.

Distribution of conj.varYtopbotRatio for acute cases, persistent cases, and uninjured. Mean values for each group are indicated by the diamond point. Twenty nine outliers were removed for this graph.
Appendix Figure A14, illustrates the similarity matrix calculated with Pearson’s R for the 13 eye tracking metrics.
Appendix Figure A14.

Similarity matrix calculated with Pearson’s R for the 13 eye tracking metrics.
Appendix Figure A15, depicts the scree plot of the principal components analysis.
Appendix Figure A15.

Scree plot showing the proportion of variance explained for the eye tracking metrics for each principal component.
APPENDIX B: Definitions of Eye Tracking Metric Categories
Appendix Tables B1–B3, include general definitions of categories of the 256 eye tracking metrics included in this analysis.
Appendix Table B1.
Gaze Position Metrics.
| Eye Tracking Metrics | Definition |
|---|---|
|
| |
| Area | Pupil gaze area (width of screen viewed multiplied by height of screen viewed) averaged over the entire assessment—metrics include the mean and median for both the left and right eyes as well as the difference in area between the left and right eyes |
| Aspect Ratio | Pupil gaze aspect ratio (height of screen viewed divided by width of screen viewed) averaged over the entire assessment—metrics include the mean and median for both the left and right eyes as well as the difference between the left and right eyes |
| BOX Score | A binary classifier derived from a best subset regression model that combines many of the eye tracking metrics obtained from this assessment and has been used for diagnostic purposes |
| Distance | Length of the visual path recording (X and Y coordinates with respect to the moving visual target)—metrics include the mean and variance of the distance across each segment of the screen (top, right, bottom left) for both the left and right eyes as well as the difference between the left and right eyes. Skew is also calculated (how far the mean is from the median) for all of the above categories |
| Height | Visual path recording of the left and right sides of the screen (in Y coordinates)—metrics include the mean, median and variance for both the left and right eyes as well as the difference between the left and right eyes |
| Width | Visual path recording of the top and bottom sides of the screen (in Y coordinates)—metrics include the mean, median and variance for both the left and right eyes as well as the difference between the left and right eyes |
| Velocity | Velocity across each segment of the screen (top, right, bottom, left) for each eye as well as the difference between the left and right eyes |
| Blinks | Number of total blinks, blink length for each eye for the entire assessment—metrics include mean and median blink length, number of blinks for each eye, as well as differences between the left and right eyes |
Appendix Table B2.
Saccadic Movement Metrics.
| Saccade Travel | The distance traveled in gaze position for all saccades—metrics include the mean, median and variance of the distance in both the X and Y directions for each eye, as well as for each segment of the screen (top, right, bottom, left). |
| Saccade Length | The length of saccades in milliseconds during the assessment—metrics include the mean and median lengths for both the left and right eyes across each segment of the screen (top, right, bottom, left) as well as the differences between the left and right eyes |
| Saccade Speed | The speed in spatial coordinates (X and Y) per millisecond of saccades—metrics include the mean, median, and variance of the speed for both the left and right eyes across each segment of the screen (top, right, bottom, left) as well as the differences between the left and right eyes |
Appendix Table B3.
Pupillary Dynamic Metrics.
| Pupil Size | Area of the pupil—metrics include mean, median, maximum, minimum, and variance of pupil size in both the left and right eyes as well as differences between the left and right eyes over the entire assessment |
Contributor Information
Divya Jain, Department of Bioengineering, University of Pennsylvania, Philadelphia, Pennsylvania; Center for Injury Research and Prevention, Children’s Hospital of Philadelphia, Philadelphia, Pennsylvania.
Kristy B. Arbogast, Center for Injury Research and Prevention, Children’s Hospital of Philadelphia, Philadelphia, Pennsylvania.; Department of Pediatrics, Perelman School of Medicine, University of Pennsylvania, Philadelphia, Pennsylvania
Catherine C. McDonald, Center for Injury Research and Prevention, Children’s Hospital of Philadelphia, Philadelphia, Pennsylvania; Department of Pediatrics, Perelman School of Medicine, University of Pennsylvania, Philadelphia, Pennsylvania; School of Nursing, University of Pennsylvania, Philadelphia, Pennsylvania.
Olivia E. Podolak, Center for Injury Research and Prevention, Children’s Hospital of Philadelphia, Philadelphia, Pennsylvania.
Susan S. Margulies, Department of Biomedical Engineering, Georgia Institute of Technology and Emory University, Atlanta, Georgia.
Kristina B. Metzger, Center for Injury Research and Prevention, Children’s Hospital of Philadelphia, Philadelphia, Pennsylvania.
David R. Howell, Sports Medicine Center, Children’s Hospital Colorado, Aurora, Colorado; Department of Orthopedics, University of Colorado School of Medicine, Aurora, Colorado.
Mitchell M. Scheiman, Pennsylvania College of Optometry at Salus University, Philadelphia, Pennsylvania.
Christina L. Master, Center for Injury Research and Prevention, Children’s Hospital of Philadelphia, Philadelphia, Pennsylvania; Department of Pediatrics, Perelman School of Medicine, University of Pennsylvania, Philadelphia, Pennsylvania; Sports Medicine and Performance Center, Children’s Hospital of Philadelphia, Philadelphia, Pennsylvania.
REFERENCES
- 1.Bryan MA, Rowhani-Rahbar A, Comstock RD, et al. Sports-and Recreation-Related Concussions in US Youth. Pediatrics 2016;138. [DOI] [PubMed] [Google Scholar]
- 2.Centers for Disease Control and Prevention (CDC). | HEADS UP | Returning to Sports and Activities; 2015.Available at https://www.cdc.gov/headsup/basics/return_to_sports.html. Accessed July 4, 2022.
- 3.Ransom DM, Vaughan CG, Pratson L, et al. Academic Effects of Concussion in Children and Adolescents. Pediatrics 2015;135:1043–50. [DOI] [PubMed] [Google Scholar]
- 4.McCrory P, Meeuwisse W, Dvořák J, et al. Consensus Statement on Concussion in Sport—the 5th International Conference on Concussion in Sport Held in Berlin, October 2016. Br J Sports Med 2017;51:838–47. [DOI] [PubMed] [Google Scholar]
- 5.Master CL, Scheiman M, Gallaway M, et al. Vision Diagnoses Are Common after Concussion in Adolescents. Clin Pediatr (Phila) 2016;55:260–7. [DOI] [PubMed] [Google Scholar]
- 6.Heyer GL, Fischer A, Wilson J, et al. Orthostatic Intolerance and Autonomic Dysfunction in Youth with Persistent Postconcussion Symptoms: A Head-Upright Tilt Table Study. Clin J Sport Med 2016;26:40–5. [DOI] [PubMed] [Google Scholar]
- 7.Scheiman M, Grady MF, Jenewein E, et al. Frequency of Oculomotor Disorders in Adolescents 11 to 17 Years of Age with Concussion, 4 to 12 Weeks Post Injury. Vision Res 2021;183:73–80. [DOI] [PubMed] [Google Scholar]
- 8.Ledoux AA, Tang K, Yeates KO, et al. Natural Progression of Symptom Change and Recovery from Concussion in a Pediatric Population. JAMA Pediatr 2019;173: e183820. [DOI] [PMC free article] [PubMed] [Google Scholar]
- 9.Master CL, Master SR, Wiebe DJ, et al. Vision and Vestibular System Dysfunction Predicts Prolonged Concussion Recovery in Children. Clin J Sport Med 2018;28:139–45. [DOI] [PubMed] [Google Scholar]
- 10.Corwin DJ, Propert KJ, Zorc JJ, et al. Use of the Vestibular and Oculomotor Examination for Concussion in a Pediatric Emergency Department. Am J Emerg Med 2019;37:1219–23. [DOI] [PMC free article] [PubMed] [Google Scholar]
- 11.Mucha A, Collins MW, Elbin RJ, et al. A Brief Vestibular/Ocular Motor Screening (VOMS) Assessment to Evaluate Concussions: Preliminary Findings. Am J Sports Med 2014;42:2479–86. [DOI] [PMC free article] [PubMed] [Google Scholar]
- 12.Corwin DJ, Arbogast KB, Swann C, et al. Reliability of the Visio-Vestibular Examination for Concussion among Providers in a Pediatric Emergency Department. Am J Emerg Med 2020;38:1847–53. [DOI] [PMC free article] [PubMed] [Google Scholar]
- 13.Corwin DJ, McDonald CC, Arbogast KB, et al. Clinical and Device-Based Metrics of Gait and Balance in Diagnosing Youth Concussion. Med Sci Sports Exerc 2020;52:542–8. [DOI] [PMC free article] [PubMed] [Google Scholar]
- 14.Storey EP, Corwin DJ, McDonald CC, et al. Assessment of Saccades and Gaze Stability in the Diagnosis of Pediatric Concussion. Clin J Sport Med 2022;32:108–13. [DOI] [PMC free article] [PubMed] [Google Scholar]
- 15.Lempke LB, Schmidt JD, Lynall RC. Athletic Trainers’ Concussion-Assessment and Concussion-Management Practices: An Update. J Athl Train 2020;55:17–26. [DOI] [PMC free article] [PubMed] [Google Scholar]
- 16.Bin Zahid A, Hubbard ME, Lockyer J, et al. Eye Tracking as a Biomarker for Concussion in Children. Clin J Sport Med 2020;30:433–43. [DOI] [PubMed] [Google Scholar]
- 17.Howell DR, Brilliant AN, Storey EP, et al. Objective Eye Tracking Deficits following Concussion for Youth Seen in a Sports Medicine Setting. J Child Neurol 2018;33:794–800. [DOI] [PubMed] [Google Scholar]
- 18.Samadani U, Li M, Qian M, et al. Sensitivity and Specificity of an Eye Movement Tracking-Based Biomarker for Concussion. Concussion 2016;1:CNC3. [DOI] [PMC free article] [PubMed] [Google Scholar]
- 19.Howell DR, Brilliant AN, Master CL, et al. Reliability of Objective Eye-Tracking Measures Among Healthy Adolescent Athletes. Clin J Sport Med 2020;30:444–50. [DOI] [PubMed] [Google Scholar]
- 20.Hunfalvay M, Murray NP, Roberts CM, et al. Oculomotor Behavior as a Biomarker for Differentiating Pediatric Patients with Mild Traumatic Brain Injury and Age Matched Controls. Front Behav Neurosci 2020;14:581819. [DOI] [PMC free article] [PubMed] [Google Scholar]
- 21.Master CL, Podolak OE, Ciuffreda KJ, et al. Utility of Pupillary Light Reflex Metrics as a Physiologic Biomarker for Adolescent Sport-Related Concussion. JAMA Ophthalmol 2020;138:1135–41. [DOI] [PMC free article] [PubMed] [Google Scholar]
- 22.Gray M, Wilson JC, Potter M, et al. Female Adolescents Demonstrate Greater Oculomotor and Vestibular Dysfunction than Male Adolescents Following Concussion. Phys Ther Sport 2020;42:68–74. [DOI] [PMC free article] [PubMed] [Google Scholar]
- 23.Samadani U, Ritlop R, Eng M, et al. Eye Tracking Detects Disconjugate Eye Movements Associated with Structural Traumatic Brain Injury and Concussion. J Neurotrauma 2015;32:548–56. [DOI] [PMC free article] [PubMed] [Google Scholar]
- 24.Sady MD, Vaughan CG, Gioia GA. Psychometric Characteristics of the Postconcussion Symptom Inventory in Children and Adolescents. Arch Clin Neuropsychol 2014;29:348–63. [DOI] [PMC free article] [PubMed] [Google Scholar]
- 25.R Core Team. R: A Language and Environment for Statistical Computing; 2019. Available at https://www.r-project.org/. Accessed July 4, 2022.
- 26.Purkayastha S, Stokes M, Bell KR. Autonomic Nervous System Dysfunction in Mild Traumatic Brain Injury: A Review of Related Pathophysiology and Symptoms. Brain Inj 2019;33:1129–36. [DOI] [PubMed] [Google Scholar]
- 27.Truong JQ, Ciuffreda KJ. Quantifying Pupillary Asymmetry through Objective Binocular Pupillometry in the Normal and Mild Traumatic Brain Injury (MTBI) Populations. Brain Inj 2016;30:1372–7. [DOI] [PubMed] [Google Scholar]
- 28.Ciuffreda KJ, Joshi NR, Truong JQ. Understanding the Effects of Mild Traumatic Brain Injury on the Pupillary Light Reflex. Concussion 2017;2:CNC36. [DOI] [PMC free article] [PubMed] [Google Scholar]
- 29.Oldham JR, Meehan WP, Howell DR. Impaired Eye Tracking Is Associated with Symptom Severity but Not Dynamic Postural Control in Adolescents Following Concussion. J Sport Heal Sci 2021;10:138–44. [DOI] [PMC free article] [PubMed] [Google Scholar]
- 30.Desai N, Wiebe DJ, Corwin DJ, et al. Factors Affecting Recovery Trajectories in Pediatric Female Concussion. Clin J Sport Med 2019;29:361–7. [DOI] [PubMed] [Google Scholar]
- 31.Zuckerman SL, Apple RP, Odom MJ, et al. Effect of Sex on Symptoms and Return to Baseline in Sport-Related Concussion: Clinical Article. J Neurosurg Pediatr 2014;13:72–81. [DOI] [PubMed] [Google Scholar]
- 32.Howell DR, Kriz P, Mannix RC, et al. Concussion Symptom Profiles among Child, Adolescent, and Young Adult Athletes. Clin J Sport Med 2019;29:391–7. [DOI] [PubMed] [Google Scholar]
- 33.Iverson GL, Gardner AJ, Terry DP, et al. Predictors of Clinical Recovery from Concussion: A Systematic Review. Br J Sports Med 2017;51:941–8. [DOI] [PMC free article] [PubMed] [Google Scholar]