

ABSTRACT
Nodularia spumigena is a bloom-forming cyanobacterium that produces several classes of nonribosomal peptides (NRPs) that are biologically active; however, the ecological roles of specific NRPs remain largely unknown. Here, we explored the involvement of NRPs produced by N. spumigena in interspecific interactions by coculturing the cyanobacterium and its algal competitors, the diatom Phaeodactylum tricornutum and the cryptomonad Rhodomonas salina, and measuring NRP levels and growth responses in all three species. Contrary to the expected growth suppression in the algae, it was N. spumigena that was adversely affected by the diatom, while the cryptomonad had no effect. Reciprocal effects of N. spumigena on the algae were manifested as the prolonged lag phase in R. salina and growth stimulation in P. tricornutum; however, these responses were largely attributed to elevated pH and not to specific NRPs. Nevertheless, the NRP levels in the cocultures were significantly higher than in the monocultures, with an up to 5-fold upregulation of cell-bound nodularins and exudation of nodularin and anabaenopeptin. Thus, chemically mediated interspecific interactions can promote NRP production and release by cyanobacteria, resulting in increased input of these compounds into the water.
IMPORTANCE NRPs were involved in growth responses of both cyanobacteria and algae; however, the primary driver of the growth trajectories was high pH induced by N. spumigena. Thus, the pH-mediated inhibition of eukaryotic phytoplankton may be involved in the bloom formation of N. spumigena. We also report, for the first time, the reciprocal growth inhibition of N. spumigena by diatoms resistant to alkaline conditions. As all species in this study can co-occur in the Baltic Sea during summer, these findings are highly relevant for understanding ecological interactions in planktonic communities in this and other systems experiencing regular cyanobacteria blooms.
KEYWORDS: Baltic Sea, allelopathy, coculture, anabaenopeptins, spumigins, nodularins
INTRODUCTION
In the brackish Baltic Sea, the summer bloom of filamentous, diazotrophic cyanobacteria is a recurring natural phenomenon (1). These blooms consist of Nodularia spumigena, Aphanizomenon spp., and, to a lesser extent, Dolichospermum spp. (formerly Anabaena spp.) (2). Due to their ability to fix atmospheric nitrogen, these diazotrophic cyanobacteria can outcompete eukaryotic algae and dominate the phytoplankton community, especially at low nitrogen-to-phosphorus ratios (3). The ongoing climate change and eutrophication facilitate the bloom frequency and intensity (4, 5), even though the environmental preferences among the species contributing to these blooms vary.
Cyanobacteria produce many toxins and bioactive substances, many of which are peptides (6). In addition to the well-studied hepatotoxic nodularins (NODs), N. spumigena produces four other classes of nonribosomal peptides (NRPs), i.e., spumigins (SPUs), aeruginosins (AERs), pseudoaeruginosins, and anabaenopeptins (APs), and many other unknown bioactive metabolites (7, 8). It has been suggested that NRPs, including nodularins, help cyanobacteria to survive under fluctuating biotic and abiotic conditions (9–12); however, their functions remain largely unknown. Any of the metabolites produced by cyanobacteria may alter cyanobacteria bloom formation and maintenance by acting as autoinducers/inhibitors and, due to allelochemical properties, affect competitors (13, 14). It has been suggested that exudates of Baltic N. spumigena have such allelochemical properties toward heterotrophic bacteria, eukaryotic algae, and other cyanobacteria; however, both inhibiting and stimulating effects on potential competitors as well as no-effect outcomes have been reported (15–21). For instance, in cocultured N. spumigena and Rhodomonas salina, a reduction of the cryptomonad growth rate was reported (20), whereas coculturing of the cyanobacterium with P. tricornutum did not affect the diatom growth (19). Moreover, the effects appear to be strain specific because when other strains of N. spumigena and R. salina were used, no significant differences in the cryptomonad growth were observed, albeit there was a reduction in the population-carrying capacity of the cryptomonad (19, 20).
Nodularins were first suggested to be responsible for N. spumigena allelopathic activity; however, no correlation between nodularin production and allelopathic effects has been found (16, 21). Notably, the adverse effects of N. spumigena on eukaryotic algae have been suggested to be controlled by the pH increase in cyanobacteria cultures and not by the allelochemicals produced (19). Reciprocally, eukaryotic algae (e.g., the green algae Tetraselmis suecica [20]) and other cyanobacteria (Aphanizomenon spp. [22, 23]) were found to inhibit N. spumigena growth. Moreover, N. spumigena exposed to cell-free filtrate of the picocyanobacterium Synechococcus spp. decreased in abundance with no significant photosynthetic efficiency response (24). The growth inhibition in N. spumigena was exacerbated by coculturing with Synechococcus spp., accompanied by a decrease in chlorophyll a (Chla) and carotenoid content, misshapen cells, and cell lysis (25). Therefore, reciprocal allelopathic responses between the cyanobacterium and other phytoplankton species (both eukaryotic algae and picocyanobacteria) are expected, but only a few studies provided quantitative data. Knowing how NRPs regulate phytoplankton assemblages could help understand taxonomic and functional succession in plankton, bloom initiation and progression, and effects on pelagic food webs.
Here, we investigated whether NRPs produced by the Baltic Sea N. spumigena in cocultures with potential competitors are involved in chemically mediated interspecific interactions. We hypothesized that reciprocal interactions would occur in cocultures of N. spumigena with eukaryotic algae, with more substantial impacts on the competitors than on the cyanobacterium due to the NRP production (hypothesis 1 [H1]). Further, we hypothesized that NRPs involved in growth inhibition (and evidenced by a negative relationship between the competitor growth and NRP concentrations) would be detected extracellularly in the cocultures. Moreover, the total concentrations of the NRPs involved in allelopathic interactions will be higher in the cocultures than in the N. spumigena monoculture (H2). Furthermore, should the cyanobacterium-induced pH variation drive the effects as previously suggested (19), a pH increase in the cocultures would coincide with concomitant growth inhibition in the competitor (H3). Finally, as NRP production has been associated with optimal growth of the cyanobacteria (26, 27), we expected to find positive relationships between the total NRP concentrations and N. spumigena growth (H4).
To investigate chemically mediated interactions, coculture experiments designed to physically separate test species but allow diffusion of metabolites are advocated (28, 29). Here, we used a coculture system with N. spumigena and each test competitor incubated in individual chambers separated by a membrane filter (see Fig. S1 in the supplemental material). This system simulated a co-occurrence of these species in Pelagia and allowed us to study interspecific interactions caused by diffusible metabolites passing through the membrane without direct cell-to-cell contact (11). The monocultures were grown in the same manner as the cocultures but with the same species in both chambers. We studied chemically mediated interactions between N. spumigena and two potential competitors, the diatom Phaeodactylum tricornutum and the cryptomonad Rhodomonas salina. These algae co-occur with N. spumigena in the Baltic Sea and have differing susceptibilities to the cyanobacterium, as suggested by earlier studies, i.e., no effect and growth inhibition, respectively (19, 20). To our knowledge, this is the first study examining the involvement of NRPs other than nodularin in interspecific interactions with N. spumigena.
RESULTS
Growth responses to the coculture.
Positive growth was observed in all species and treatments (Fig. 1B). The growth of N. spumigena and R. salina was adversely affected in the cocultures N. spumigena/P. tricornutum and N. spumigena/R. salina, respectively, as indicated by significantly higher lag-phase duration than in the respective monocultures (H1; λ values) (Fig. 1A and see Table S3 in the supplemental material). The maximal growth rate of P. tricornutum was significantly higher in the coculture with N. spumigena (N. spumigena/P. tricornutum) than in the respective monoculture (Fig. 1B and Table S3), with a concomitant decrease in the N. spumigena area under the curve (AUC) values (Fig. 1C and Table S3).
FIG 1.

Growth responses of N. spumigena (Nod), P. tricornutum (Phae), and R. salina (Rhodo) under monoculture (mono) and coculture treatments (mean and SE; n = 3). (A) Lag phase preceding the active growth (λ, h). (B) Maximal growth rate estimated for the exponential period (μ, d−1). (C) Area under the curve (AUC) representing algal production during the exposure. Monocultures are shown with solid colors and cocultures are shown in stripe patterns. Asterisks indicate a significant difference from the monoculture; *, P < 0.05; **, P < 0.01; and ***, P < 0.001 (GLM; Table S3 in the supplemental material).
There was a significant positive relationship between the maximal growth rate and lag-phase duration in N. spumigena monoculture and N. spumigena/R. salina; no significant relationship was found in N. spumigena/P. tricornutum (H1; Fig. S4 and Table S4). The growth trajectory of N. spumigena was similar between the monoculture and N. spumigena/R. salina (Fig. S4), whereas in N. spumigena/P. tricornutum, a prolonged (>2-fold) lag phase was observed, suggesting that the N. spumigena/P. tricornutum growth curve deviated from the other two treatments. However, given the low number of replicates and a rather high variability within the N. spumigena/P. tricornutum treatment, the result is not conclusive. For R. salina and P. tricornutum, a positive relationship between the maximal growth rate and lag-phase duration was observed in the monocultures (only significant in P. tricornutum), while the relationships were not significant in the cocultures (H1; Table S4).
Cell-bound and extracellular NRPs in mono- and cocultures.
In total, 11 cell-bound NRPs were detected in N. spumigena mono- and cocultures (Fig. S5A). No extracellular NRPs were detected in the N. spumigena monoculture (Fig. S5A), whereas two extracellular NRPs were detected in the cocultures N. spumigena/P. tricornutum and N. spumigena/R. salina (H2, Fig. S5A). Some NRPs might have been present extracellularly, but their concentrations were below the limit of detection.
The ordination of the total NRP levels in the N. spumigena mono- and cocultures resulted in a single significant PC (Fig. S4) that explained about 56% of the NRP variance (Table S2). A clear separation was observed in the principal-component analysis (PCA) biplot between N. spumigena monoculture and N. spumigena/R. salina, whereas there was some overlap between N. spumigena monoculture and N. spumigena/P. tricornutum (Fig. 2). The spumigins (SPU 597 and SPU 639) had the highest positive loadings (≥0.3), while the aeruginosin (AER 615) and the nodularins (NOD 811 and NOD 825) had the highest negative loadings on the PC1 and, hence, influenced the grouping (Fig. S3). Thus, the low SPU 597 and SPU 639 concentrations coincided with the high AER 615, NOD 811, and NOD 825 concentrations (i.e., in N. spumigena/R. salina).
FIG 2.

Principal-component analysis (PCA) on covariances of the sum of cell-bound and extracellular NRPs of N. spumigena monocultures (blue) and cocultures P. tricornutum (yellow) and R. salina (orange). The growth parameters lag phase (λ, h), maximal growth rate (μ, d−1), and area under the curve (AUC) were used as supplementary variables; these parameters are shown by dashed blue, solid green, and dashed red lines, respectively. NRPs are denoted as SPU, spumigin; NOD, nodularin; AER, aeruginosin; and AP, anabaenopeptin.
Some total NRP concentrations differed significantly between the monoculture and the cocultures (H2; Fig. S5B and Table S5). Overall, N. spumigena had significantly higher total concentrations of nodularins in the cocultures than in the monoculture, with a fold change ranging from 3 to 5, depending on the coexposed species (H2; Fig. 3 and Table S5). In N. spumigena/R. salina, the total aeruginosins were significantly higher, whereas spumigins (i.e., SPU 597, SPU 639, and SPU 655) were significantly lower than in the monoculture (Fig. 3, Fig. S5B, and Table S5).
FIG 3.

Relative concentrations of total (cell-bound and extracellular) NRPs pooled by class in the N. spumigena cocultures with P. tricornutum (Nod/Phae) and R. salina (Nod/Rhodo), given as a fold change over N. spumigena monoculture. NRP classes include SPU, spumigin; NOD, nodularin; AER, aeruginosin; and AP, anabaenopeptin. Fold change of 1 represents equilibrium, i.e., concentrations equal to monoculture.
There was no significant relationship between the competitor growth and either the extracellular NRPs (NOD 825 and AP 842) or the NRPs that were upregulated in the cocultures but not detected extracellularly (SPU 599, AER 615, and NOD 811) (H2; Table S6). However, SPU 611 was significantly negatively related to P. tricornutum and positively to the growth of R. salina (Table S6). Moreover, there was a significant negative relation between AP 828 and the growth of R. salina (Table S6).
pH and its effects on growth.
In the cocultures and N. spumigena monoculture, a significantly higher pH was observed than in the algal monocultures (H3; Fig. 4 and Table S7). Furthermore, a prolonged lag phase in the N. spumigena/R. salina coculture was observed, with a significantly positive relationship between R. salina lag-phase duration and pH, indicating growth inhibition. On the contrary, a significant positive relationship at an alpha value of 0.1, between P. tricornutum maximal growth rate and pH (P = 0.051) indicated a stimulatory effect on the diatom growth in the coculture (H3; Table S8). No other significant pH effects on the growth parameters in the test species were observed.
FIG 4.

pH values in mono- and cocultures of N. spumigena (Nod), P. tricornutum (Phae), and R. salina (Rhodo). Monocultures are shown with solid colors, and cocultures are shown in stripe patterns. Asterisks indicate significant differences from the monoculture; *, P < 0.05; **, P < 0.01; and ***, P < 0.001 (GLM; see Table S3 in the supplemental material).
Relationships between total NRPs and growth in N. spumigena.
Production of spumigins SPU 599 and SPU 641 was significantly associated with a prolonged lag phase and decreased growth rate, respectively, in the cyanobacterium (Fig. 5). No significant correlations between the growth parameters and NRPs (nodularin, aeruginosin, and anabaenopeptins) were found. Significant correlations at alpha values of 0.1 between the lag phase and AP 842 (positive; P = 0.08) and between lag phase and AER 615 (negative; P = 0.06) were noted.
FIG 5.
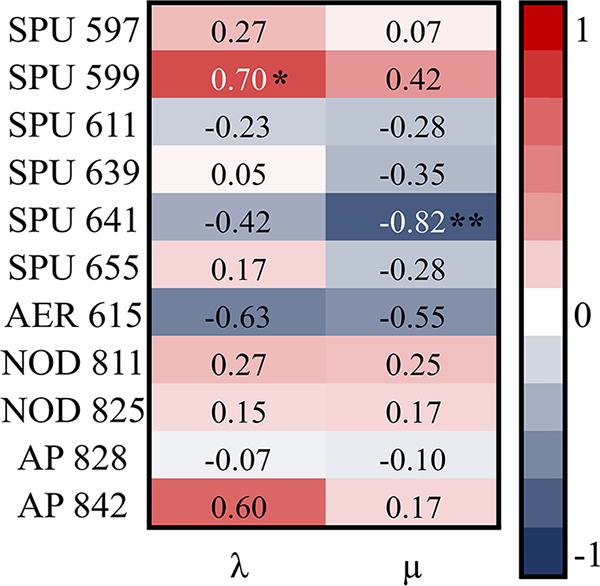
The Spearman rank correlations between the physiological parameters (λ, lag phase, and μ, maximal growth rate) and NRPs measured in the N. spumigena monoculture and cocultures with P. tricornutum and R. salina. The numbers in the cells are rho values; *, P < 0.05, and **, P < 0.01.
DISCUSSION
N. spumigena growth was inhibited by P. tricornutum but not by R. salina.
We expected to observe reciprocal interactions between the cyanobacterium and its potential competitors, with more substantial net effects on the competitors than the cyanobacterium (H1). However, contrary to our hypothesis, the most pronounced effect was the suppression of N. spumigena growth by P. tricornutum (Fig. 1A; see Table S3 in the supplemental material). The prolonged lag phase in N. spumigena observed in the N. spumigena/P. tricornutum coculture with no compensatory growth (Table S4 and Fig. S4) resulted in a significant production loss in the cyanobacterium (Fig. 1C and Table S3, AUC values). Assuming that a positive relationship between the lag phase and maximal growth rate indicates adaptation to the test conditions (30, 31), N. spumigena has demonstrated a limited capacity to adapt and compete with P. tricornutum in our experimental system.
To our knowledge, this is the first report of N. spumigena growth inhibition by diatoms. In most studies examining cyanobacteria allelopathy toward diatoms, cryptomonads, and other eukaryotic algae, the extracts/cell-free filtrates of the cyanobacterium were added to the alga monoculture, thus not allowing detection of reciprocal effects (15–18, 32, 33). However, growth inhibition in algae and bacteria (29, 34) induced by diatoms has been observed, including P. tricornutum that produces allelochemicals with negative effects on the raphidophyte Heterosigma akashiwo, the dinoflagellate Prorocentrum donghaiense, the green algae Dunaliella salina, and the coccolithophore Emiliania huxleyi, as well as some bacteria (35, 36). Moreover, a potent allelochemical belonging to glycinamides (C30H38N6O6) has been isolated from P. tricornutum (35). Further biochemical studies on the nature of the bioactive compounds released by P. tricornutum are needed to understand their involvement in the growth inhibition of phytoplankton species.
No effects on the N. spumigena growth induced by R. salina and the similarity of the growth trajectories between N. spumigena/R. salina and the cyanobacterium monoculture (H1; Fig. 1 and Table S3) agree with previous studies with mixed cultures (20). However, it is possible that our growth assessment based on in vivo Chla fluorescence measurements was not sufficiently sensitive to detect changes in cyanobacteria and algae biomass. Using cellular carbon quota and cell number could have provided a more robust biomass assessment (37, 38).
Moreover, considering that cultures were nonaxenic, the associated microbiome of the cyanobacteria and the eukaryotic algae might also contribute to these intraspecific interactions. It has been previously observed that associated bacteria influence algal abundance and performance as well as the excretion and/or metabolization of metabolites, which can, in turn, influence their chemically mediated interactions (29, 39, 40).
Growth of eukaryotic competitors was affected by high pH.
As hypothesized (H3), pH was elevated in the N. spumigena monoculture and the cocultures (Fig. 4; Table S7), which is in line with reported pH increase during cyanobacteria blooms (41, 42). In the Baltic Sea, for example, pH >9.3 has been recorded in cyanobacteria microenvironments (43). Oligohaline waters have a lower pH-buffering capacity than seawater, which explains the pH rise due to cyanobacterial photosynthetic carbon fixation (44) and promotes cyanobacteria blooms, especially when inorganic N supply from sediment (45) and phosphorus solubility (46) increase. The elevated pH was associated with growth inhibition in R. salina and its stimulation in P. tricornutum (Table S8). Thus, not the allelopathy but the pH-mediated effects and tolerance to the high pH values can be the basis of N. spumigena outcompeting eukaryotic algae in bloom conditions (19).
While N. spumigena was not affected by R. salina, the latter had a weak, yet statistically significant, growth suppression in the coculture, indicated by the prolonged lag phase (Fig. 1A and Table S3). However, no significant decrease in biomass production was found (Fig. 1C and Table S3, AUC values). Thus, although statistically significant, the effect was not biologically meaningful. Under mixed-culture conditions N. spumigena did not affect R. salina growth rate, but the stationary phase of the cryptomonad was reached earlier in the mixed culture than in the monoculture, followed by decreased cell density (19). Growth was inhibited in Rhodomonas spp. (such as R. salina) exposed to either cell-free filtrates of N. spumigena (15) or in the mixed culture with the cyanobacterium. In these studies, the inhibition degree varied, most likely due to different experimental designs (i.e., cell filtrates, mixed culture, or coculture) and the culture pH (increased, unchanged, or not measured) (15, 19, 20). Also, different strains of N. spumigena and R. salina were used in these studies with possible implications for the cyanobacterium competitiveness and the cryptomonad susceptibility (47). In the previous studies, the N. spumigena strains KAC 13, KAC 66, and AV1 and the R. salina strains KAC 30, K-0294, and TV22 were used, while in the present study, we used N. spumigena CCNP1403 and R. salina CCAP 978/24 (Table S1) (15, 19, 20). Finally, different growth endpoints were used, with growth rate and cell abundance being the most common metrics reported, whereas the lag-phase duration was not measured in any of these previous studies. Notably, this was the most sensitive endpoint in our experiment.
The prolonged lag phase in R. salina was likely to be driven by the elevated pH (H3; Fig. 4; Table S7). Additional evidence for the high pH as the primary stressor for R. salina is the significant positive relationship between the lag-phase duration and culture pH, thus supporting hypothesis H3 (Table S8). However, as there was no significant change in the R. salina AUC values in the coculture (Fig. 1 and Table S3), it is plausible that once the alga became adapted to the higher pH during the lag phase, the growth resumed at the normal rate. In R. salina, a decrease in cell density has been observed at high (>10.5) pH levels (19), and recently, a growth inhibition at pH 8.5 compared to pH 7 has been demonstrated (48). In our experiment, however, the pH values never exceeded 8.5, which might explain the adaptation and compensatory growth resulting in no significant change in the AUC values. The successful adaptation to high pH values can also explain the observed coexistence of R. salina and N. spumigena in the Baltic Sea (49). However, the adaptive capacity to pH may vary among different strains of R. salina (47), which might also explain the decrease in cryptomonads in the Gulf of Finland during late 1970 that has been suggested, at least in part, to result from the increase in cyanobacteria (50).
Contrary to the hypothesized suppression by the cyanobacterium (H1) and high pH (8.3) in the coculture (H3), the diatom growth was stimulated by N. spumigena (Fig. 1B and Table S3). Moreover, a significant positive relationship at an alpha value of 0.1 between P. tricornutum maximum growth rate and culture pH (P = 0.051; Table S8) was found. Previously, Møgelhøj et al. (19) found no significant effect of N. spumigena on P. tricornutum growth under mixed-culture conditions and suggested that P. tricornutum has a high capacity to grow well over a wide pH range (19, 51), which is supported by our results, even though we used different strains of N. spumigena and P. tricornutum. However, the combined effect of pH and NRP produced by the cyanobacterium on the diatom growth stimulation cannot be ruled out.
Interspecific chemically mediated interactions alter NRPs concentrations of N. spumigena.
We expected to find higher total NRP concentrations in the cocultures than N. spumigena monoculture (H2); however, coculturing induced both upregulation and downregulation of NRPs (Fig. 3 and Fig. 5). The NOD class, for example, was up to 5-fold higher in the cocultures than in the monoculture (H2; Fig. 3 and Fig. 5). Despite no or weak growth responses of R. salina to the cyanobacterium, total concentrations of spumigins (SPU 597, SPU 639, and SPU 655) were significantly lower, and AER 615, NOD 811, NOD 825, and AP 842 were significantly higher in the coculture than in the N. spumigena monoculture (H2; Fig. S6 and Table S5). In the coculture with P. tricornutum, where inhibition of N. spumigena (Fig. 1) and stimulation of P. tricornutum were observed, significantly higher total SPU 599, NOD 811, and AP 842 concentrations were found than in the N. spumigena monoculture, and no NRP was significantly lower than in the cyanobacterium monoculture (H3; Fig. S5 and Table S5). The upregulation of NRPs in the cocultures is in line with Microcystis responses, where the metabolite production usually increases when other cyanobacteria are introduced into the system (12, 52). For example, in Microcystis aeruginosa cocultured with Planktothrix agardhii, a 5-fold increase in intracellular metabolites, including 390 compounds and 5 targeted peptides (cyanopeptolin A, B, and C and AER A and D), was found with no concomitant growth response (12). At the same time, P. agardhii, which suffered growth inhibition, smaller trichome size, and other alterations in cell morphology due to M. aeruginosa, produced fewer intracellular metabolites than in its monoculture. Nevertheless, like M. aeruginosa, P. agardhii produced a few specific compounds exclusively in response to the interactions (12). Therefore, it can be concluded that chemically mediated interspecific interactions promote the production of interaction-specific NRPs by cyanobacteria, regardless of their effect on the producer itself or the competitor. Nevertheless, to attest to this hypothesis, a three-step experiment should be conducted, where individual populations are first simulated in separate compartments, then in a shared medium allowing each population to take up substances secreted by the other, and finally in mixed culture.
The NRPs that significantly increased in the cocultures (i.e., SPU 599, AER 615, NOD 811, NOD 825, and AP 842) may have various roles in chemical communication and would be the most likely candidates as allelochemicals. However, to function as allelochemicals, they must be actively excreted by the cyanobacterium and not remain cell bound until the cell lysis (53, 54). Therefore, only NOD 825 and AP 842, which were detected extracellularly (H3; Fig. S5), can be considered putative allelochemicals, although other NRPs with potential allelochemical proprieties might be present extracellularly at concentrations below the limit of detection of the liquid chromatography-tandem mass spectrometry (LC-MS/MS) method used. Extracellular NOD 825 and AP 842 were present in the cocultures but not in the monoculture (Fig. S5), suggesting that presence of the algae induced the exudation, thus supporting the hypothesis H2. Moreover, the total concentrations of these NRPs were significantly higher in the cocultures than in the monocultures (Fig. 3 and Table S5), indicating a higher production in the presence of potential competitors. Accordingly, Møgelhøj et al. (19) detected a higher percentage of extracellular NOD in a mixed culture of N. spumigena and R. salina than in the N. spumigena monoculture. Thus, it is likely that infochemical sensing of potential competitors led to an upregulation of NOD 825 and AP 842 production and their subsequent exudation by N. spumigena. Jonasson et al. (55) suggested that NOD is released when its intracellular concentration reaches a certain threshold. In N. spumigena blooms, NODs are mostly cell bound (56), with up to 20% found extracellularly (57). Although more extracellular NODs are commonly observed due to the cell lysis (27), Hobson and Fallowfield (58) reported NOD release by intact cells. We have also observed an increase in cell-bound AP concentration and its release in the coculture of two strains of N. spumigena, belonging to different chemotype subgroups (11), which supports the potential involvement of APs in the cell‐to‐cell communication as a signaling molecule and a bioactive metabolite.
The NRPs that increased in the cocultures, but were not detected extracellularly, i.e., SPU 599, AER 615, and NOD 811 (Fig. S5 and Table S5), might have been produced to provide a competitive advantage to the cyanobacterium. However, no significant relations were observed between the algal growth and the upregulated NRPs in the cocultures (Table S6), suggesting that these NRPs (SPU 599, AER 615, NOD 811, NOD 825, and AP 842) had no allelopathic activity in our experimental conditions. It is also possible that some NRPs were not detected in the media because they quickly break down when released, especially considering that N. spumigena cultures were nonaxenic, and the associated cyanobacteria microbiome has been shown to degrade NRPs produced by the cyanobacterium (59). Moreover, our NRP concentrations based on the dry weight normalization might be higher than estimates based on the cell number if the cell masses in the rapidly growing strains are lower due to stress conditions (60).
Nevertheless, SPU 611 was significantly negatively related to P. tricornutum growth and significantly positively to R. salina growth (Table S6). In addition, the latter was inhibited by AP 828 (Table S6). Thus, although the main effect on the competitors was exerted by elevated pH, SPU 611 and AP 828 released by the cyanobacteria might be biologically active toward the algae, which can be addressed in future experimental studies.
Synthesis of spumigins might be costly.
Considering that NRP production has been linked to optimal growth (26, 27), a positive relationship between the total NRP concentrations and N. spumigena growth was expected (H4). However, in N. spumigena mono- and cocultures, some spumigins (SPU 599 and SPU 641) were negatively related to the cyanobacteria growth (Fig. 5), suggesting that upregulation of their synthesis was suboptimal for the growth. Spumigins are potent serine protease inhibitors (61), which inhibit proteases that may be self-destructive (62). In Gram-negative and Gram-positive bacteria, serine proteases are membrane proteases required for processing newly synthesized secreted proteins, cell-cell adhesion, and surface colonization (63–65). Thus, as serine protease inhibitors, spumigins might constitute an important mechanism for regulating proteolytic activity in N. spumigena, such as the regulation of proteases involved in growth (66). Moreover, N. spumigena produces other SPUs that were unrelated to its growth (Fig. 5), including the total SPU concentration (Fig. 5 and Table S5). In cyanobacteria, SPUs might have multiple functions, but how their diversity is related to N. spumigena adaptability remains to be studied. Also, due to their common metabolic pathways and structural similarity, it can be speculated that different SPUs may have complementary functions as previously suggested (9–11). Thus, the upregulation of one SPU might compensate for downregulation of another.
Conclusions.
In the coculture of N. spumigena with algal competitors, several NRPs significantly increased compared to the monoculture, and some were detected extracellularly, which coincided with growth inhibition in the cyanobacterium exposed to P. tricornutum. Although this diatom is known to produce allelochemicals suppressing various algae, this is the first report of such effects on cyanobacteria. In turn, the coculture with N. spumigena caused a significant extension of R. salina lag phase due to pH elevation, while P. tricornutum growth was stimulated at high pH. The NRP concentrations in the cocultures were significantly different from the N. spumigena monocultures, with a 5-fold NOD upregulation and exudation of NOD 825 and AP 842 in the cocultures. Thus, chemically mediated interspecific interactions induce the release of specific NRPs by N. spumigena, which can impinge on chemical interactions in plankton communities. Taken together, our findings suggest that it is not the specific allelopathic compounds but tolerance to alkaline conditions that conveys competitive advantage during the cyanobacteria blooms, although combined effects of pH and NRP produced by the cyanobacterium cannot be ruled out.
MATERIALS AND METHODS
Algal species and culture conditions.
The cyanobacterium Nodularia spumigena Mertens ex Bornet & Flahault (CCNP 1403) was isolated from the Baltic Sea and obtained from the Culture Collection of Northern Poland, Department of Marine Biotechnology, Gdańsk University, Poland. The diatom Phaeodactylum tricornutum Bohlin (CCAP 1052/1A) and the cryptomonad Rhodomonas salina (Wislouch) Hill & Wetherbee (CCAP 978/24) were obtained from the Culture Collection of Algae and Protozoa in Oban, United Kingdom (see Table S1 in the supplemental material). Although the diatom and the cryptomonad strains were not isolated from the Baltic Sea, these species are present in different Baltic Sea subbasins, and their distributions overlap N. spumigena (49). The cultures were maintained in 500-mL Erlenmeyer flasks containing 250 mL of f/2 medium (67), supplemented with NaCl to salinity 7 at 20 ± 2°C and irradiance of 30 μmol photons m−2·s−1 with a light/dark cycle of 16:8 h. Cultures were kept in the exponential-growth phase by repeated dilution in a fresh culture medium.
Experimental setup.
(i) Cocultivation system. Monoculture and coculture exposures were conducted in the custom-made cocultivation system (Fig. S1) (11). In brief, the system consisted of two modified glass flasks, each holding 500 mL, fitted together by a holding clamp. The flasks were joined by a 0.22-μm hydrophilic polyvinylidene fluoride (PVDF) membrane filter (Durapore, Merck, Darmstadt, Germany) with free diffusion of dissolved substances, including NRPs, but not the algal cells. The NRP diffusion rate in this cocultivation system was demonstrated to be rapid, with the levels of NRPs dissolved in the media reaching equilibrium between the two coculture chambers after 10 h of the incubation (11).
(ii) Mono- and coculture experiments. Exponentially growing cultures of the test species (N. spumigena, P. tricornutum, and R. salina) were diluted with f/2 media to the identical in vivo Chla fluorescence values measured in triplicate using a 10-arbitrary unit (AU) field fluorometer (Turner Designs, Sunnyvale, CA, USA). In the monoculture treatments, both chambers were inoculated with 300 mL stock of the same species (either N. spumigena, P. tricornutum, or R. salina). In the cocultures (referred to as N. spumigena/P. tricornutum and N. spumigena/R. salina), 300 mL of N. spumigena were added to one of the chambers and 300 mL of either P. tricornutum or R. salina to the other chamber (Fig. 6). Each monoculture and coculture treatment was carried out in triplicate at the same experimental conditions as the inoculum cultures and shaken at approximately 50 rpm to prevent sedimentation and facilitate metabolite mixing in the system; the experiment lasted 72 h.
FIG 6.

Schematic representation of the experimental design align with the hypotheses, research questions, and statistical methods used in the data analysis.
(iii) Sampling and sample preparation. Samples (5 mL) were collected at time points 0, 24, 48, and 72 h from all chambers to determine the in vivo Chla fluorescence. At the end of the experiment (72 h), prior to N. spumigena, R. salina, and P. tricornutum biomass sample collection, pH was measured by introducing the pH electrode (PHM210; Radiometer Analytical, Loveland, CO, USA) on both chambers of each coculture system. pH was measured in triplicate in each monoculture/coculture. At the time point of 72 h, 100-mL samples were taken from all experimental units and vacuum filtered onto 47-mm GF/F filters (Whatman, Kent, UK). The wet filters with the retained cells were transferred to 2-mL Eppendorf tubes, dried under vacuum by rotary evaporation in an Eppendorf concentrator 5301 at room temperature (Eppendorf, Hamburg, Germany), and stored at −80°C until extraction. The supernatants of these samples were concentrated by the solid-phase extraction method using 500-mg Oasis HLB cartridges (Waters, Milford, MA, USA), according to Mazur-Marzec et al. (8). The 100% methanol eluate was evaporated to dryness following the same procedure as the filters and kept at −80°C until further workup. Additionally, 1-mL samples were collected at 72 h from all N. spumigena cultures and dried in the Eppendorf concentrator 5301 at 60°C. These samples were used to determine N. spumigena dry weight using a Sartorius BP211D analytical balance with a readability of 0.01 mg (Sartorius Lab Instruments GmbH & Co. KG, Göttingen, Germany).
Growth assessment.
The measured time-specific fluorescence values at time points 0, 24, 48, and 72 h were used to model growth (68) with DMFit software (www.combase.cc) for each species/treatment/replicate. The model fit was assessed by the coefficient of determination (R2). The estimated parameters were the lag-phase duration (λ, h) and the maximal growth during the exponential phase (μ, day−1). The lag-phase duration shows how fast the test culture acclimates to the treatment conditions, while the maximal growth rate is the rate of increase during the exponential part of the growth curve. We also calculated the area under the curve (AUC) using the time-specific fluorescence after subtracting the initial fluorescence value as an additional growth parameter to represent time-integrated production. This endpoint is commonly used in algal growth inhibition assays (69), as it integrates the change in photosynthetically active biomass during exposure (70).
Cell-bound and extracellular NRPs.
(i) Extraction. Before liquid chromatography-tandem mass spectrometry (LC-MS/MS) analysis, 1 mL 75% methanol in Milli-Q water was added to the dry filters (containing the N. spumigena, P. tricornutum, and R. salina cells, i.e., the cell-bound NRPs) and to the dried filtrate solid-phase extraction (SPE) eluates (containing extracellular NRPs). Filters were macerated with a fine glass rod. The samples (filters and filtrates) were homogenized in an ultrasonic bath (Sonorex; Bandelin, Berlin, Germany) for 5 min and vortexed for another 5 min. Subsequently, the samples were centrifuged for 10 min at 2°C and 10,000 rpm; each sample supernatant was transferred to chromatographic vials and analyzed by LC-MS/MS.
(ii) LC-MS/MS analysis and quantification. The LC-MS/MS analyses were performed according to Mazur-Marzec et al. (8) using an Agilent 1200 (Agilent Technologies, Waldbronn, Germany) coupled with a triple-quadrupole mass spectrometer (5500 QTrap; AB Sciex, Concord, ON, Canada) and a Zorbax Eclipse XDB-C18 column (4.6 mm by 150 mm; 5 μm; Agilent Technologies, Santa Clara, CA, USA) with a mobile phase composed of 5% acetonitrile in Milli-Q water (A) and acetonitrile (B), both containing 0.1% formic acid. The injection volume was 5 μL, and the flow rate was 0.6 mL min−1. The column temperature was 35°C. The gradient elution started with 15% of B, rising to 50% B over 10 min and then to 99% B in 5 min, held for 10 min, then decreased to 15% B in 2 min, and held for 10 min to equilibrate the system. Ionization was performed with electrospray (ESI) source in positive mode, with turbo ion spray (550°C) voltage of 5.5 kV and declustering potential of 80 V. MS detection was performed with the information-dependent acquisition (IDA) and enhanced ion product (EIP) modes. Detection of NRPs was performed in the m/z range of 500 to 1,000; when the signal of an ion was above a threshold of 500,000 cps, the EIP was automatically triggered, and the ions were fragmented in the collision cell (Q2) with collision energy (CE, 45 to 70 V) to optimize the achievement of the richest ion fragmentation spectrum. For NRP identification, the protonated ions’ m/z, their fragmentation spectra, and retention times were examined. The peak areas of the NRPs in the extracts were acquired from the extracted ion chromatograms of the NRPs’ protonated ions masses. Data acquisition and processing were accomplished using Analyst QS 1.5.1 software (AB Sciex, Concord, ON, Canada). The relative NRP concentrations in the extracts were based on the peak area of the ion chromatograms. Peak areas of cell-bound and extracellular NRPs were normalized to the dry mass of the N. spumigena sample taken at 72 h following the common practice and dividing the peak area by the dry mass (9, 71).
Data analysis and statistics.
Statistical analyses were carried out with JMP version 14.0 (SAS Institute Inc., Cary, NC); the significance level was set to α of 0.05, and the data are presented as mean ± standard error (SE; n = 3 in all cases). See Fig. 6 for an overview of the statistical methods used to test the hypotheses. The variables included total NRP concentrations (i.e., normalized peak areas reflecting the sum of cell-bound and extracellular NRP quantities), growth parameters (λ, μ, and AUC), and pH values measured in each chamber of each exposure unit. The total NRP concentrations were grouped by class and expressed as the relative fold change between the normalized peak area in the cocultures and the respective monoculture. The fold change was calculated as A/B; with A being a replicate of a coculture NRP peak area and B the average monoculture peak area for the same NRP.
First, to explore the overall variability in the N. spumigena growth and NRP levels across the treatments, a principal-component analysis (PCA) on covariances was performed using the normalized total NRPs as response variables and the growth parameters (λ, μ, and AUC) as supplementary variables. The explained proportion of the variance for each component and the minimum number of the components were determined by the broken stick model (Fig. S2). As only one significant PC was identified (Table S2 and Fig. S3), the regression analysis was applied to identify significant predictors.
Second, to evaluate interactions between N. spumigena and the competitors (hypothesis H1), generalized linear models (GLM) with normal error structure and identity link were used. No data transformation was needed for the variables λ, μ, AUC, and pH, whereas the NRP values were log transformed. The residual analysis and Q-Q plots were used to examine the goodness of fit and homoscedasticity of the models. For each species, the treatment (monoculture versus coculture) effect on each growth parameter (λ, μ, and AUC values) was evaluated to address hypothesis H1.
In addition to the models for the growth parameters, we evaluated the relationship between the maximal growth rate and lag-phase duration across the treatments in all species. A positive relation between these parameters has been used to indicate dynamic adaptation to the growth conditions and compensatory growth following a prolonged lag phase (30). To address hypothesis H2, a GLM was used to examine treatment effects on the NRP levels in N. spumigena. Further, to evaluate the relationship between the growth and total NRPs in each competitor (Phae and Rhodo), we used a ratio for the maximal growth rate between its cocultures and the monocultures as a dependent variable and total NRP concentrations as predictors. Although only a few NRPs were detected extracellularly, these GLMs were performed for all NRPs. We used the Spearman rank correlation to evaluate relations between NRP levels and growth parameters in N. spumigena (hypothesis H4). Finally, a set of GLMs was used to evaluate whether (i) pH was affected by the treatment (monoculture versus coculture in N. spumigena, Phae, and Rhodo), and (ii) growth parameters were affected by the pH in all species (hypothesis H3).
ACKNOWLEDGMENTS
This research was supported by Vetenskapsrådet-The Swedish Research Council (grant no. 2018-00721) and the Department of Environmental Science at Stockholm University. Open-access funding was provided by Stockholm University.
S.L. and E.G. acquired the funding and conceptualized the project; S.L. performed the experiments, sampling, sample preparation, and growth analyses; S.L. and H.M.-M. performed LC-MS/MS analyses; S.L. and E.G. analyzed the data; H.M.-M. helped with data interpretation; S.L. and E.G. wrote the manuscript with input from H.M.-M.; and all authors reviewed the manuscript.
Footnotes
Supplemental material is available online only.
Contributor Information
Sandra Lage, Email: smlage@ualg.pt.
Elena Gorokhova, Email: elena.gorokhova@aces.su.se.
Jennifer B. Glass, Georgia Institute of Technology
REFERENCES
- 1.Bianchi TS, Engelhaupt E, Westman P, Andrén T, Rolff C, Elmgren R. 2000. Cyanobacterial blooms in the Baltic Sea: natural or human-induced? Limnol Oceanogr 45:716–726. 10.4319/lo.2000.45.3.0716. [DOI] [Google Scholar]
- 2.Wacklin P, Hoffmann L, Komárek J. 2009. Nomenclatural validation of the genetically revised cyanobacterial genus Dolichospermum (RALFS ex BORNET et FLAHAULT) comb. nova. Fottea 9:59–64. 10.5507/fot.2009.005. [DOI] [Google Scholar]
- 3.Niemi Å. 1979. Blue-green algal blooms and N:P ratio in the Baltic Sea. Acta Bot Fenn 110:57–61. [Google Scholar]
- 4.Paerl HW, Paul VJ. 2012. Climate change: links to global expansion of harmful cyanobacteria. Water Res 46:1349–1363. 10.1016/j.watres.2011.08.002. [DOI] [PubMed] [Google Scholar]
- 5.Cegłowska M, Toruńska-Sitarz A, Kowalewska G, Mazur-Marzec H. 2018. Specific chemical and genetic markers revealed a thousands-year presence of toxic Nodularia spumigena in the Baltic Sea. Mar Drugs 16:116. 10.3390/md16040116. [DOI] [PMC free article] [PubMed] [Google Scholar]
- 6.Sivonen K, Börner T. 2008. Bioactive compounds produced by cyanobacteria, p 159–197. In Herrero A, Flores E (ed), The cyanobacteria: molecular biology, genomics and evolution. Caister Academic Press, Norfolk, UK. ISBN: 978-1-904455-15-8. [Google Scholar]
- 7.Mazur-Marzec H, Kaczkowska MJ, Blaszczyk A, Akcaalan R, Spoof L, Meriluoto J. 2012. Diversity of peptides produced by Nodularia spumigena from various geographical regions. Mar Drugs 11:1–19. 10.3390/md11010001. [DOI] [PMC free article] [PubMed] [Google Scholar]
- 8.Mazur-Marzec H, Bertos-Fortis M, Toruńska-Sitarz A, Fidor A, Legrand C. 2016. Chemical and genetic diversity of Nodularia spumigena from the Baltic Sea. Mar Drugs 14:209. 10.3390/md14110209. [DOI] [PMC free article] [PubMed] [Google Scholar]
- 9.Briand E, Bormans M, Gugger M, Dorrestein PC, Gerwick WH. 2016. Changes in secondary metabolic profiles of Microcystis aeruginosa strains in response to intraspecific interactions. Environ Microbiol 18:384–400. 10.1111/1462-2920.12904. [DOI] [PMC free article] [PubMed] [Google Scholar]
- 10.Toporowska M, Mazur-Marzec H, Pawlik-Skowrońska B. 2020. The effects of cyanobacterial bloom extracts on the biomass, Chl-a, MC and other oligopeptides contents in a natural Planktothrix agardhii population. Int J Environ Res Public Health 17:2881. 10.3390/ijerph17082881. [DOI] [PMC free article] [PubMed] [Google Scholar]
- 11.Lage S, Mazur-Marzec H, Gorokhova E. 2021. Competitive interactions as a mechanism for chemical diversity maintenance in Nodularia spumigena. Sci Rep 11:8970. 10.1038/s41598-021-88361-x. [DOI] [PMC free article] [PubMed] [Google Scholar]
- 12.Briand E, Reubrecht S, Mondeguer F, Sibat M, Hess P, Amzil Z, Bormans M. 2019. Chemically mediated interactions between Microcystis and Planktothrix: impact on their growth, morphology and metabolic profiles. Environ Microbiol 21:1552–1566. 10.1111/1462-2920.14490. [DOI] [PubMed] [Google Scholar]
- 13.Keating KI. 1977. Allelopathic influence on blue-green bloom sequence in a eutrophic lake. Science 196:885–887. 10.1126/science.196.4292.885. [DOI] [PubMed] [Google Scholar]
- 14.Keating KI. 1978. Blue-green algal inhibition of diatom growth: transition from mesotrophic to eutrophic community structure. Science 199:971–973. 10.1126/science.199.4332.971. [DOI] [PubMed] [Google Scholar]
- 15.Suikkanen S, Fistarol GO, Granéli E. 2004. Allelopathic effects of the Baltic cyanobacteria Nodularia spumdigena, Aphanizomenon flos-aquae and Anabaena lemmermannii on algal monocultures. J Exp Mar Biol Ecol 308:85–101. 10.1016/j.jembe.2004.02.012. [DOI] [Google Scholar]
- 16.Suikkanen S, Engström-Öst J, Jokela J, Sivonen K, Viitasalo M. 2006. Allelopathy of Baltic Sea cyanobacteria: no evidence for the role of nodularin. J Plankton Res 28:543–550. 10.1093/plankt/fbi139. [DOI] [Google Scholar]
- 17.Śliwińska S, Latała A. 2012. Allelopathic effects of cyanobacterial filtrates on Baltic diatom. Contemp Trends Geosci 1:103–107. 10.2478/ctg-2012-0016. [DOI] [Google Scholar]
- 18.Żak A, Musiewicz K, Kosakowska A. 2012. Allelopathic activity of the Baltic cyanobacteria against microalgae. Estuar Coast Shelf Sci 112:4–10. 10.1016/j.ecss.2011.10.007. [DOI] [Google Scholar]
- 19.Møgelhøj MK, Hansen PJ, Henriksen P, Lundholm N. 2006. High pH and not allelopathy may be responsible for negative effects of Nodularia spumigena on other algae. Aquat Microb Ecol 43:43–54. 10.3354/ame043043. [DOI] [Google Scholar]
- 20.Engström-Öst J, Hogfors H, El-Shehawy R, De Stasio B, Vehmaa A, Gorokhova E. 2011. Toxin-producing cyanobacterium Nodularia spumigena, potential competitors and grazers: testing mechanisms of reciprocal interactions. Aquat Microb Ecol 62:39–48. 10.3354/ame01456. [DOI] [Google Scholar]
- 21.Engström-Öst J, Koski M, Schmidt K, Viitasalo M, Jónasdóttir SH, Kokkonen M, Repka S, Sivonen K. 2002. Effects of toxic cyanobacteria on a plankton assemblage: community development during decay of Nodularia spumigena. Mar Ecol Prog Ser 232:1–14. 10.3354/meps232001. [DOI] [Google Scholar]
- 22.Suikkanen S, Fistarol GO, Granéli E. 2005. Effects of cyanobacterial allelochemicals on a natural plankton community. Mar Ecol Prog Ser 287:1–9. 10.3354/meps287001. [DOI] [Google Scholar]
- 23.Mohlin M, Roleda MY, Pattanaik B, Tenne S-J, Wulff A. 2012. Interspecific resource competition—combined effects of radiation and nutrient limitation on two diazotrophic filamentous cyanobacteria. Microb Ecol 63:736–750. 10.1007/s00248-011-9964-y. [DOI] [PubMed] [Google Scholar]
- 24.Śliwińska-Wilczewska S, Pniewski F, Latała A. 2016. Allelopathic interactions between Synechococcus sp. and Nodularia spumigena under different light conditions. Allelopathy J 37:241–252. [Google Scholar]
- 25.Barreiro Felpeto A, Śliwińska-Wilczewska S, Złoch I, Vasconcelos V. 2018. Light-dependent cytolysis in the allelopathic interaction between picoplanktic and filamentous cyanobacteria. J Plankton Res 40:165–177. 10.1093/plankt/fby004. [DOI] [Google Scholar]
- 26.Repka S, Koivula M, Harjunpa V, Rouhiainen L, Sivonen K. 2004. Effects of phosphate and light on growth of and bioactive peptide production by the Cyanobacterium anabaena strain 90 and its anabaenopeptilide mutant. Appl Environ Microbiol 70:4551–4560. 10.1128/AEM.70.8.4551-4560.2004. [DOI] [PMC free article] [PubMed] [Google Scholar]
- 27.Lehtimäki J, Moisander P, Sivonen K, Kononen K. 1997. Growth, nitrogen fixation, and nodularin production by two Baltic Sea cyanobacteria. Appl Environ Microbiol 63:1647–1656. 10.1128/aem.63.5.1647-1656.1997. [DOI] [PMC free article] [PubMed] [Google Scholar]
- 28.Sieg RD, Poulson-Ellestad KL, Kubanek J. 2011. Chemical ecology of the marine plankton. Nat Prod Rep 28:388–399. 10.1039/c0np00051e. [DOI] [PubMed] [Google Scholar]
- 29.Paul C, Mausz MA, Pohnert G. 2013. A co-culturing/metabolomics approach to investigate chemically mediated interactions of planktonic organisms reveals influence of bacteria on diatom metabolism. Metabolomics 9:349–359. 10.1007/s11306-012-0453-1. [DOI] [Google Scholar]
- 30.Andriukonis E, Gorokhova E. 2017. Kinetic 15 N-isotope effects on algal growth. Sci Rep 7:44181. 10.1038/srep44181. [DOI] [PMC free article] [PubMed] [Google Scholar]
- 31.Gorokhova E, Ek K, Reichelt S. 2020. Algal growth at environmentally relevant concentrations of suspended solids: implications for microplastic hazard assessment. Front Environ Sci 8. 10.3389/fenvs.2020.551075. [DOI] [Google Scholar]
- 32.Śliwińska-Wilczewska S, Barreiro Felpeto A, Możdżeń K, Vasconcelos V, Latała A. 2019. Physiological effects on coexisting microalgae of the allelochemicals produced by the bloom-forming cyanobacteria Synechococcus sp. and Nodularia spumigena. Toxins 11:712. 10.3390/toxins11120712. [DOI] [PMC free article] [PubMed] [Google Scholar]
- 33.Żak A, Kosakowska A. 2015. The influence of extracellular compounds produced by selected Baltic cyanobacteria, diatoms and dinoflagellates on growth of green algae Chlorella vulgaris. Estuar Coast Shelf Sci 167:113–118. 10.1016/j.ecss.2015.07.038. [DOI] [Google Scholar]
- 34.Legrand C, Rengefors K, Fistarol GO, Graneli E. 2003. Allelopathy in phytoplankton-biochemical, ecological and evolutionary aspects. Phycologia 42:406–419. 10.2216/i0031-8884-42-4-406.1. [DOI] [Google Scholar]
- 35.Wang R, Xue Q, Wang J, Tan L, Zhang Q, Zhao Y, Anderson DM. 2017. Effects of an allelochemical in Phaeodactylum tricornutum filtrate on Heterosigma akashiwo: morphological, physiological and growth effects. Chemosphere 186:527–534. 10.1016/j.chemosphere.2017.08.024. [DOI] [PMC free article] [PubMed] [Google Scholar]
- 36.Xue Q, Wang R, Xu W, Wang J, Tan L. 2018. The stresses of allelochemicals isolated from culture solution of diatom Phaeodactylum tricornutum Bohlin on growth and physiology of two marine algae. Aquat Toxicol 205:51–57. 10.1016/j.aquatox.2018.10.004. [DOI] [PubMed] [Google Scholar]
- 37.Berman-Frank I, Dubinsky Z. 1999. Balanced growth in aquatic plants: myth or reality? Phytoplankton use the imbalance between carbon assimilation and biomass production to their strategic advantage. Bioscience 49:29–37. 10.2307/1313491. [DOI] [Google Scholar]
- 38.Kruskopf M, Flynn KJ. 2006. Chlorophyll content and fluorescence responses cannot be used to gauge reliably phytoplankton biomass, nutrient status or growth rate. New Phytol 169:525–536. 10.1111/j.1469-8137.2005.01601.x. [DOI] [PubMed] [Google Scholar]
- 39.Berg C, Dupont CL, Asplund-Samuelsson J, Celepli NA, Eiler A, Allen AE, Ekman M, Bergman B, Ininbergs K. 2018. Dissection of microbial community functions during a cyanobacterial bloom in the Baltic Sea via metatranscriptomics. Front Mar Sci 5:55. 10.3389/fmars.2018.00055. [DOI] [Google Scholar]
- 40.Humbert J-F, Barbe V, Latifi A, Gugger M, Calteau A, Coursin T, Lajus A, Castelli V, Oztas S, Samson G, Longin C, Medigue C, de Marsac NT. 2013. A tribute to disorder in the genome of the bloom-forming freshwater cyanobacterium Microcystis aeruginosa. PLoS One 8:e70747. 10.1371/journal.pone.0070747. [DOI] [PMC free article] [PubMed] [Google Scholar]
- 41.Lopez-Archilla AI, Moreira D, López-García P, Guerrero C. 2004. Phytoplankton diversity and cyanobacterial dominance in a hypereutrophic shallow lake with biologically produced alkaline pH. Extremophiles 8:109–115. 10.1007/s00792-003-0369-9. [DOI] [PubMed] [Google Scholar]
- 42.Hansen PJ. 2002. Effect of high pH on the growth and survival of marine phytoplankton: implications for species succession. Aquat Microb Ecol 28:279–288. 10.3354/ame028279. [DOI] [Google Scholar]
- 43.Ploug H. 2008. Cyanobacterial surface blooms formed by Aphanizomenon sp. and Nodularia spumigena in the Baltic Sea: small-scale fluxes, pH, and oxygen microenvironments. Limnol Oceanogr 53:914–921. 10.4319/lo.2008.53.3.0914. [DOI] [Google Scholar]
- 44.Price GD, Badger MR, Woodger FJ, Long BM. 2008. Advances in understanding the cyanobacterial CO2-concentrating-mechanism (CCM): functional components, Ci transporters, diversity, genetic regulation and prospects for engineering into plants. J Exp Bot 59:1441–1461. 10.1093/jxb/erm112. [DOI] [PubMed] [Google Scholar]
- 45.Paerl H. 2008. Nutrient and other environmental controls of harmful cyanobacterial blooms along the freshwater–marine continuum. In Hudnell HK (ed) Cyanobacterial harmful algal blooms: state of the science and research needs. Advances in Experimental Medicine and Biology. Springer, New York, NY. 10.1002/iroh.19650500307. [DOI] [PubMed] [Google Scholar]
- 46.Talling JF, Talling IB. 1965. The chemical composition of African lake waters. Int Rev Hydrobiol 50:421–463. 10.1002/iroh.19650500307. [DOI] [Google Scholar]
- 47.Leflaive J, Ten‐Hage L. 2007. Algal and cyanobacterial secondary metabolites in freshwaters: a comparison of allelopathic compounds and toxins. Freshwater Biol 52:199–214. 10.1111/j.1365-2427.2006.01689.x. [DOI] [Google Scholar]
- 48.Latsos C, Wassenaar E, Moerdijk T, Coleman B, Robbens J, van Roy S, Bastiaens L, van Houcke J, Timmermans KR. 2022. Effect of pH on Rhodomonas salina growth, biochemical composition, and taste, produced in semi-large scale under sunlight conditions. J Appl Phycol 34:1215–1226. 10.1007/s10811-022-02730-1. [DOI] [Google Scholar]
- 49.Hällfors G. 2004. Checklist of Baltic Sea phytoplankton species (including some heterotrophic protistan groups). In Baltic Sea Environment Proceedings, no. 95. Helsinki Commission, Baltic Marine Environment Protection Commission, Helsinki, Finland. [Google Scholar]
- 50.Suikkanen S, Laamanen M, Huttunen M. 2007. Long-term changes in summer phytoplankton communities of the open northern Baltic Sea. Estuar Coast Shelf Sci 71:580–592. 10.1016/j.ecss.2006.09.004. [DOI] [Google Scholar]
- 51.Goldman JC, Riley CB, Dennett MR. 1982. The effect of pH in intensive microalgal cultures. II. Species competition. J Exp Mar Biol Ecol 57:15–24. 10.1016/0022-0981(82)90141-1. [DOI] [Google Scholar]
- 52.Engelke CJ, Lawton LA, Jaspars M. 2003. Elevated microcystin and nodularin levels in cyanobacteria growing in spent medium of Planktothrix agardhii. Archiv Hydrobiologie 158:541–550. 10.1127/0003-9136/2003/0158-0541. [DOI] [Google Scholar]
- 53.Tilahun S. 2020. Exclusive partitioning of intra-and extra-cellular cyanotoxins: limitation of the conventional procedure. Environ Sci Pollut Res Int 27:17427–17428. 10.1007/s11356-020-08256-8. [DOI] [PubMed] [Google Scholar]
- 54.Park H-D, Iwami C, Watanabe MF, Harada K-I, Okino T, Hayashi H. 1998. Temporal variabilities of the concentrations of intra‐and extracellular microcystin and toxic Microcystis species in a hypertrophic lake, Lake Suwa, Japan (1991–1994). Environ Toxicol Water Qual 13:61–72. . [DOI] [Google Scholar]
- 55.Jonasson S, Vintila S, Sivonen K, El-Shehawy R. 2008. Expression of the nodularin synthetase genes in the Baltic Sea bloom-former cyanobacterium Nodularia spumigena strain AV1. FEMS Microbiol Ecol 65:31–39. 10.1111/j.1574-6941.2008.00499.x. [DOI] [PubMed] [Google Scholar]
- 56.Heresztyn T, Nicholson B. 1997. Nodularin concentrations in Lakes Alexandrina and Albert, South Australia, during a bloom of the cyanobacterium (blue‐green alga) Nodularia spumigena and degradation of the toxin. Environ Toxicol Water Qual 12:273–282. . [DOI] [Google Scholar]
- 57.Mazur H, Plinski M. 2003. Nodularia spumigena blooms and the occurrence of hepatotoxin in the Gulf of Gdańsk. Oceanologia 45:305–316. [Google Scholar]
- 58.Hobson P, Fallowfield HJ. 2003. Effect of irradiance, temperature and salinity on growth and toxin production by Nodularia spumigena. Hydrobiol 493:7–15. 10.1023/A:1025447318487. [DOI] [Google Scholar]
- 59.Park HD, Sasaki Y, Maruyama T, Yanagisawa E, Hiraishi A, Kato K. 2001. Degradation of the cyanobacterial hepatotoxin microcystin by a new bacterium isolated from a hypertrophic lake. Environ Toxicol 16:337–343. 10.1002/tox.1041. [DOI] [PubMed] [Google Scholar]
- 60.Orr PT, Willis A, Burford MA. 2018. Application of first order rate kinetics to explain changes in bloom toxicity—the importance of understanding cell toxin quotas. J Ocean Limnol 36:1063–1074. 10.1007/s00343-019-7188-z. [DOI] [Google Scholar]
- 61.Ishida K, Okita Y, Matsuda H, Okino T, Murakami M. 1999. Aeruginosins, protease inhibitors from the cyanobacterium Microcystis aeruginosa. Tetrahedron 55:10971–10988. 10.1016/S0040-4020(99)00621-3. [DOI] [Google Scholar]
- 62.Barzkar N. 2020. Marine microbial alkaline protease: an efficient and essential tool for various industrial applications. Int J Biol Macromol 161:1216–1229. 10.1016/j.ijbiomac.2020.06.072. [DOI] [PubMed] [Google Scholar]
- 63.Paetzel M, Dalbey RE, Strynadka NC. 2000. The structure and mechanism of bacterial type I signal peptidases: a novel antibiotic target. Pharmacol Ther 87:27–49. 10.1016/S0163-7258(00)00064-4. [DOI] [PubMed] [Google Scholar]
- 64.Burton J, Wood SG, Lynch M, Plaut AG. 1988. Substrate analog inhibitors of the IgA1 proteinases from Neisseria gonorrhoeae. J Med Chem 31:1647–1651. 10.1021/jm00403a027. [DOI] [PubMed] [Google Scholar]
- 65.Ladhani S. 2003. Understanding the mechanism of action of the exfoliative toxins of Staphylococcus aureus. FEMS Immunol Med Microbiol 39:181–189. 10.1016/S0928-8244(03)00225-6. [DOI] [PubMed] [Google Scholar]
- 66.Sabotič J, Kos J. 2012. Microbial and fungal protease inhibitors—current and potential applications. Appl Microbiol Biotechnol 93:1351–1375. 10.1007/s00253-011-3834-x. [DOI] [PMC free article] [PubMed] [Google Scholar]
- 67.Guillard RRL. 1975. Culture of phytoplankton for feeding marine invertebrates, p 29–60. In Smith WL, Chanley MH (ed), Culture of marine invertebrate animals. Plenum Press, New York, NY. [Google Scholar]
- 68.Baranyi J, Roberts TA. 1994. A dynamic approach to predicting bacterial growth in food. Int J Food Microbiol 23:277–294. 10.1016/0168-1605(94)90157-0. [DOI] [PubMed] [Google Scholar]
- 69.OECD. 2011. Test No. 201: Freshwater alga and cyanobacteria, growth inhibition test. OECD guidelines for the testing of chemicals, section 2. OECD publishing, Paris. 10.1016/0168-1605(94)90157-0. [DOI] [Google Scholar]
- 70.Vaas LAI, Sikorski J, Michael V, Göker M, Klenk H-P. 2012. Visualization and curve-parameter estimation strategies for efficient exploration of phenotype microarray kinetics. PLoS One 7:e34846. 10.1371/journal.pone.0034846. [DOI] [PMC free article] [PubMed] [Google Scholar]
- 71.Koek MM, Muilwijk B, van der Werf MJ, Hankemeier T. 2006. Microbial metabolomics with gas chromatography/mass spectrometry. Anal Chem 78:1272–1281. 10.1021/ac051683+. [DOI] [PubMed] [Google Scholar]
Associated Data
This section collects any data citations, data availability statements, or supplementary materials included in this article.
Supplementary Materials
Fig. S1 to S5 and Tables S1 to S8. Download aem.00966-22-s0001.pdf, PDF file, 0.4 MB (418.3KB, pdf)