Abstract
The objectives of this study are to analyze the presence of environmental values in ESG indexes based on the positive value relationship between energy and the environment found in existing studies and to identify the characteristics of environmental, social, and governance (ESG) investments by examining the performance of ESG investments compared to market portfolios, as well as to consider the implications of ESG investment in clean energy policy based on the results of the empirical analysis of this study. This paper contributes threefold. First, using a supply and demand-based pricing model, we propose a new model of the expected return, risk, and performance ratio of the ESG premiums defined by the log price differences between ESG indexes and a market portfolio to analyze how ESG investments perform. Second, based on the empirical findings of this study that the correlation between ESG indexes and energy prices is a decreasing function of the latter in contrast to other environmental assets, this paper suggests that ESG indexes cannot adequately demonstrate environmental values but reflect social and governance values, i.e., (E)SG, in the complementary perspective. Third, using the empirical findings of this study that the information ratio of the ESG premium tends to be positive but declines and approaches zero over time, this paper indicates that although ESG investments can be significant compared to market index investments, the significance is limited because ESG investment performance converges with market portfolio performance. In conclusion, two points should be noted about ESG investing in clean energy policy: given the dilution of environmental values in ESG investing, a clear distinction should be made between ESG investing and renewable energy investing; even if investments in renewable energy projects are treated as ESG investments, reflecting current market trends, we should be prepared for the fact that the superior investment performance due to social and governance values, rather than environmental values, will not last long.
Keywords: ESG index, Energy-environment linkage, ESG premium, Information ratio, Clean energy policy
Introduction
Environment, social, and governance (ESG) investing in new projects including clean energy is rapidly taking an important place in financial markets. Under the sustainable development goals (SDGs) of the United Nations, the financial industry is accelerating investments in ESG-friendly companies. According to the website of principles for responsible investment (PRI), which defines responsible investment as a strategy and practice to incorporate ESG factors in investment decisions and active ownership, the total assets under management more than quadrupled from US$ 18 trillion in 2009 to US$ 86.3 trillion in 2019 (PRI, 2019). As ESG investments grow, the effective use of ESG investments to promote renewable energy projects is important for clean energy policy decision-makers. Within this context, among the elements of ESG investments, a question arises as to what is the key element among ESG factors and, in particular, which environmental or social/governance factors occupy a major position in ESG investments. With further attention from investor perspectives, it is important for the continued development of ESG investing to examine whether ESG investing performs better than benchmark investment in a market portfolio. The purpose of this research is to deliver answers to these two research questions to discuss the implications of ESG investments in clean energy policy.
In measuring environmental value, the environment is inseparable from energy. Therefore, in examining whether the environmental value exists in assets, we focus on the link between energy and environmental value. As a basic reference to investigate whether the environmental value exists in ESG investments, positive impacts of energy prices on energy-environmental value relationships have been found in environmental assets such as green bonds (Kanamura, 2020), clean energy indexes (Gupta, 2017; Kanamura, 2022), and carbon assets (Kanamura, 2016).1 Henriques and Sadorsky (2010) show that increases in a company’s environmental sustainability lower its energy price risk. Taking into account leverage effects observed in crude oil markets, i.e., negative relations between crude oil prices and the volatilities, crude oil price risk decreases in line with crude oil prices. This is also shown in the empirical studies in this study. In conclusion, the environmental value measured by the company’s environmental sustainability may increase in line with the energy value measured by crude oil prices. Conjecturing that this positive relationship between energy and environmental value holds, by examining the relationship between ESG indexes and energy prices, we can ascertain which of the E (environment) or S (social) and G (governance) parts within the ESG indexes drive their characteristics. More importantly, under the recent ESG investment boom, does ESG investing perform well in terms of risk and return? In particular, ESG investors are always concerned about whether ESG investing performs better than the market portfolio. If a new model could be created to present the value of the ESG indexes, it would be possible to use the model to adequately evaluate ESG investing performance.
In recent years, empirical research on ESG investment and its performance and risk has been actively conducted. Many studies are showing the positive effects of ESG factors on investment performance (e.g., Derwall et al., 2005; Kempf & Osthoff, 2007; Sudha, 2015; Weber & Wei Rong, 2016; Ashwin Kumar et al., 2016; Kappou & Oikonomou, 2016; Park & Lee, 2018; Sherwood & Pollard, 2018; Broadstock et al., 2021; Ur Rehman et al., 2016).2 These studies are highly significant in that they discuss ESG investing performance empirically from risk and return. However, given that these studies comprehensively examine investment performance across all ESG factors, they do not demonstrate which E, S, or G factor drives ESG investment performance. Thus, recent studies in the last decade focus on the driver of ESG investment performance from the point of E, S, or G (e.g., Mǎnescu, 2011; Auer, 2016; Auer & Schuhmacher, 2016; Pedersen et al., 2021; Giese et al., 2021). These studies are important to empirically examine which E, S, or G factor drives ESG investment performance. However, they did not theoretically and empirically evaluate the chronological performance of ESG indexes based on existing energy-environment value alignment.
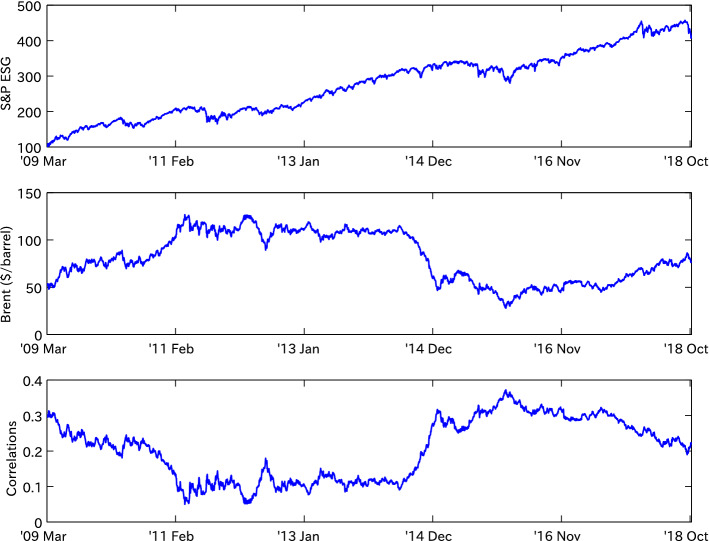
This research sheds light on the correlations between ESG indexes and crude oil prices for the ESG investing performance evaluation. As the first contribution of this study, by applying the model of Kanamura (2022) concerning the relationship between clean energy indexes and energy prices to a price correlation model between ESG indexes and energy prices based on the supply and demand of both assets, we propose a new model for ESG investing performance evaluation of the expected return, the risk, and the performance ratio of ESG premiums, referred to as ‘the ESG premium model,’ which is a completely different approach from existing studies including a recent study of Giese et al. (2021). Using the price correlation model, we empirically analyze the correlations between the two asset prices of ESG and crude oil and deepen our understanding of the structure of the relationship between environmental value and fossil fuel value. As the second contribution of this study, empirical studies using the model show that regardless of the kinds of ESG indexes in question, their correlations with energy prices are a decreasing function of energy prices. This is completely different from the results of environmental assets such as green bonds (Kanamura, 2020), clean energy indexes (Gupta, 2017; Kanamura, 2022), and carbon assets (Kanamura, 2016). This may imply that ESG indexes cannot adequately demonstrate environmental values, but reflect social and governance values, i.e., (E)SG, from the complementary point of view as the first practical significance of this study. More importantly, as the third contribution of this study, we demonstrate that the expected returns of ESG premiums converge to almost zero, and the risks of ESG premiums have been decreasing and converging on certain values over time in recent years, resulting in decreasing information ratios. This may suggest stable returns of ESG investments and embody the importance of ESG investing compared to market index investing. However, the importance is limited because the positive but close-to-zero information ratios mean that ESG investing performance will converge to market portfolio investing performance over time as the second practical significance of this study. Based on the results, we take two notes about ESG investments in clean energy policy: environmental components of ESG investing in renewable energies are not necessarily and immediately valued in the market, resulting in the need for an explicit distinction between ESG investing and renewable energy investing, and the value of ESG investments due to social and governance aspects, not environment aspects, exists but declines over time in a current context where renewable energy investment is equated with ESG investing.
This paper is organized as follows. Section 2 proposes a new ESG premium model by using a correlation model between ESG indexes and crude oil prices based on the supply and demand relationship of Kanamura (2022). Section 3 conducts empirical studies using ESG indexes and crude oil prices. Section 4 discusses the findings from the empirical studies in Sect. 3. Section 5 conducts the robustness check as a replicability study by employing the existing DCC model and Sect. 6 concludes.
Theoretical background
To examine the effect of E on ESG indexes, it is necessary to incorporate the underlying economic phenomenon into the model. A model incorporating such an economic background is generally referred to as a structural model. As a structural-type model, we apply the model of Kanamura (2022) to a price correlation model of ESG indexes and energy prices (CR model) based on the supply and demand for environmental assets.
We apply the concept of Kanamura (2022), which models clean energy index-energy price correlations, to the ESG-energy price correlation model due to the analogy between ESG and clean energy indexes in the portfolio of securities for the first time to the best of our knowledge. We suppose that crude oil prices are given by the inverse Box-Cox supply curve function in Eq. (1) and the corresponding volume process in Eq. (3). We also suppose that an ESG index is given by the inverse Box-Cox demand curve in Eq. (2) (see, e.g., Park and Lee (2018) for a downward sloping demand curve) and the corresponding volume process in Eq. (4) (see, e.g., Kanamura (2013), Kanamura (2015)). Kanamura (2015) suggests that is in the same direction with trading volume. Here, we assume that crude oil prices affect the volume processes of the ESG index to consider the impacts of crude oil prices on ESG indexes. We have the equilibrium prices of crude oil Pt and ESG indexes Sti, respectively, as follows. Note that crude oil demand inelasticity to prices and ESG index supply inelasticity to prices for simplicity are considered in this paper.
| 1 |
| 2 |
| 3 |
| 4 |
Note that and and 500 represent ESG index and S&P 500, respectively. By using Ito’s Lemma, we have
| 5 |
| 6 |
| 7 |
| 8 |
| 9 |
| 10 |
| 11 |
| 12 |
| 13 |
This is referred to as a correlation model between ESG indexes and energy prices (CR model).
Note that
| 14 |
If holds, is an increasing function of crude oil prices.
Judging from Eqs. (6) and (9), the volatilities in crude oil prices and ESG index are driven by crude oil prices and ESG index, respectively. If the inverse Box-Cox function parameter ‘’ () is positive, the volatilities in crude oil prices or ESG indexes decrease in line with crude oil prices or ESG indexes, respectively, whose phenomenon is referred to as ‘leverage effect’ often observed in financial markets. In opposite, if the inverse Box-Cox function parameter ‘’ () is negative, the volatilities in crude oil prices or ESG indexes increase in line with crude oil prices or ESG indexes, respectively, whose phenomenon is referred to as ‘inverse leverage effect’ often observed in energy markets.
By using the CR model, we evaluate the chronological performance of ESG investing. First, we define ESG premium by the log price difference between an ESG index and the S&P 500:
| 15 |
where and represent an ESG index and the S&P 500, respectively.
Then, we propose the models of the expected return and volatility of ESG premiums.
Proposition 1
| 16 |
| 17 |
Note that is the correlation of price returns between an ESG index and the S&P 500.
Proof
By using Ito’s lemma to Eq. (15), we derive the proposition.
We also propose the model of the information ratio of ESG premiums as follows:
| 18 |
where and . We call the new model of the expected return, volatility, and information ratio of ESG premiums as ‘the ESG premium model.’
Empirical studies
Data
We use the ESG indexes of the MSCI, S&P, STOXX, and OMX, S&P 500, and the crude oil prices of WTI and Brent.3 The data cover the period from 20 March 2009 to 26 October 2018.4 We obtain all the data from Bloomberg, except for the S&P ESG from the S&P website, due to availability. Table 1 shows the basic statistics. The skewnesses of the ESG indexes of the MSCI, S&P, and STOXX, and S&P 500 are positive, i.e., the distributions are right-skewed. By contrast, the skewnesses of the ESG index of the OMX and the crude oil prices of WTI and Brent are negative, i.e., the distributions are left-skewed.
Table 1.
Basic Statistics of ESG indexes, S&P 500, and Crude Oil Prices: Note the skewnesses of the ESG indexes of S&P, MSCI, STOXX, and S&P 500 are positive, i.e., the distributions are right-skewed, while the skewnesses of the ESG index of OMX and crude oil prices of WTI and Brent are negative, i.e., the distributions are left-skewed
| MSCI ESG | S&P ESG | STOXX ESG | OMX ESG | S&P 500 | WTI | Brent | |
|---|---|---|---|---|---|---|---|
| Mean | 93.883 | 276.201 | 143.416 | 1397.920 | 1770.684 | 74.022 | 80.974 |
| Std. Dev. | 19.472 | 90.884 | 20.691 | 197.825 | 545.419 | 21.736 | 25.929 |
| Skewness | 0.047 | 0.143 | 0.055 | − 0.476 | 0.247 | − 0.132 | − 0.004 |
| Kurtosis | 2.062 | 1.914 | 1.950 | 2.188 | 2.005 | 1.711 | 1.610 |
| Observations | 2506 | 2506 | 2506 | 1781 | 2506 | 2506 | 2506 |
The model parameter estimation
We obtain the parameters of the CR model employed in this paper by using maximum likelihood estimation. For the estimation, we need to specify the function in advance. We assume that is a linear function of crude oil price () for simplicity:
| 19 |
Here, and 500 represent the ESG index and the S&P 500, respectively. To estimate the model parameters, we discretize the model:
| 20 |
| 21 |
| 22 |
| 23 |
| 24 |
| 25 |
| 26 |
Here we take and assume for simplicity. Note that and .
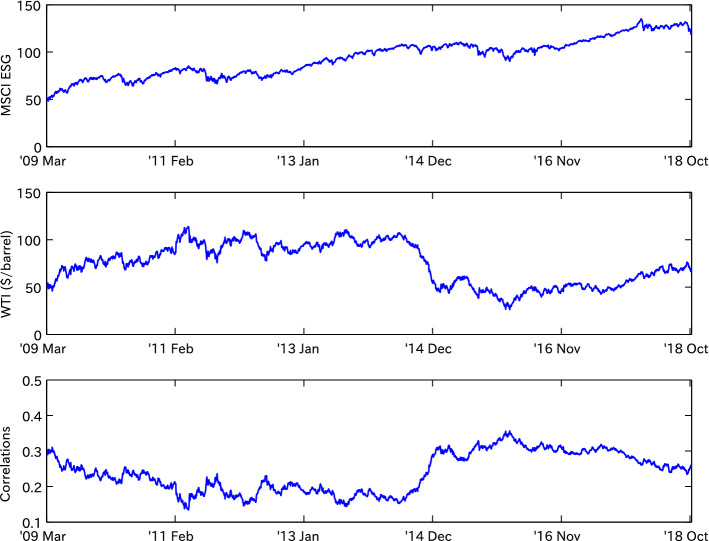
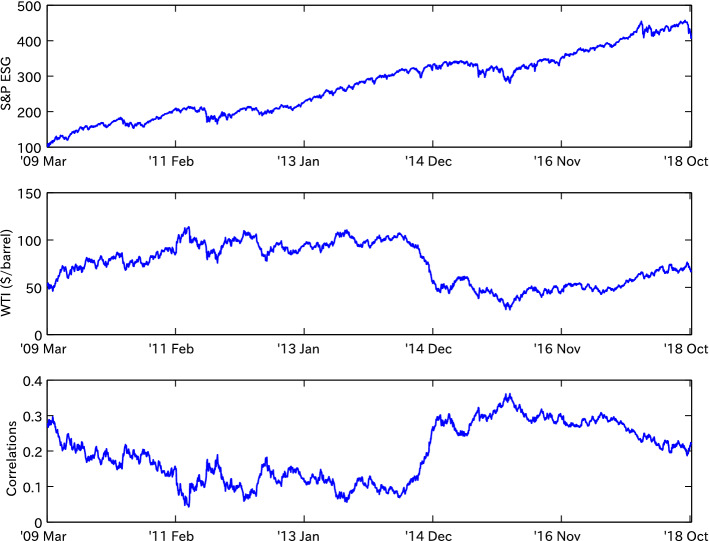
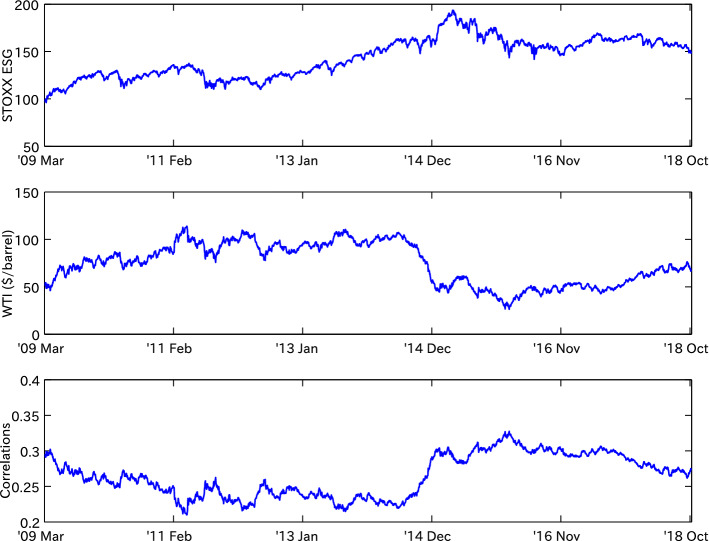
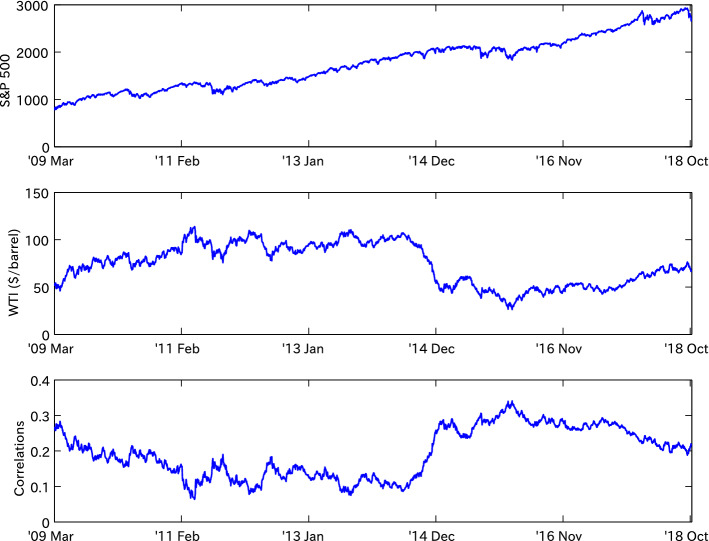
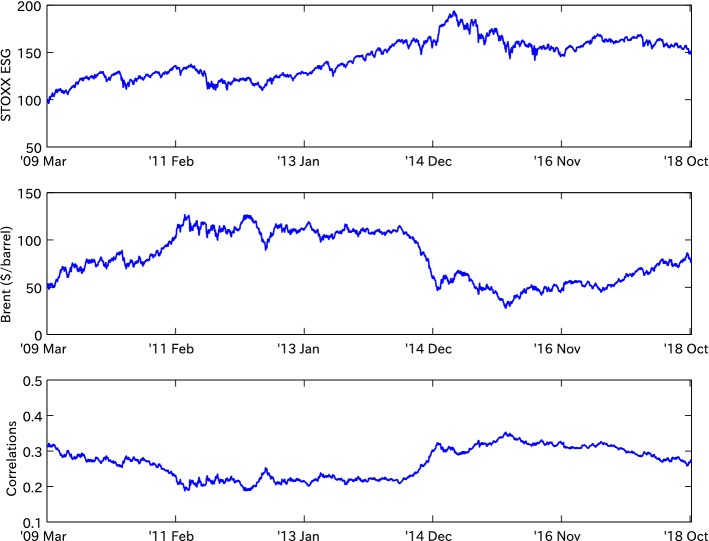
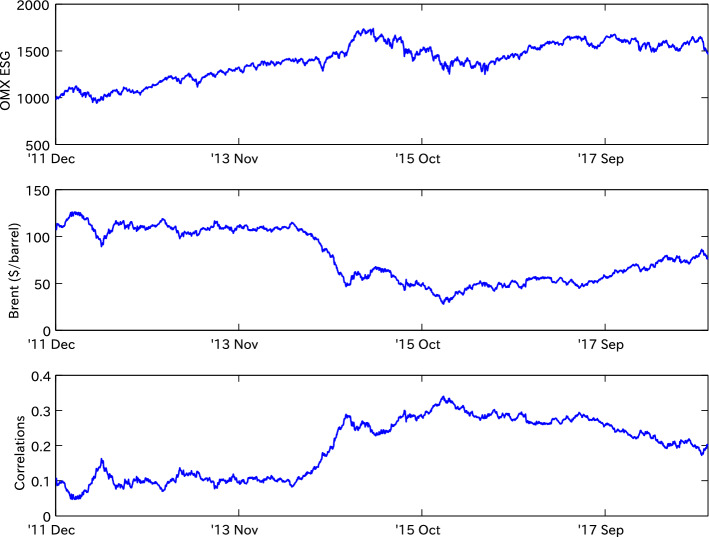
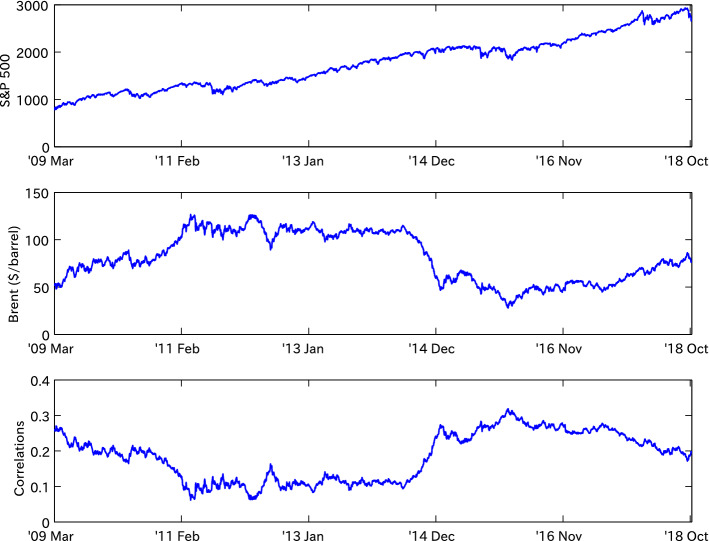
Table 2 shows the parameter estimation results for the MSCI ESG index and the WTI crude oil prices. All estimates are statistically significant judging from the corresponding standard errors. is estimated as a positive value, implying that the correlations between the MSCI ESG index and WTI crude oil prices are a decreasing function of the latter. Figure 1 shows the relationship between the MSCI ESG index, WTI crude oil prices, and the correlations. It demonstrates that the correlations are positive but move in the opposite direction to the WTI crude oil prices over time. The parameter representing the supply curve shape of WTI crude oil is estimated as a positive value, implying that the relationship between the crude oil prices and their volatility shows the opposite relationship from Eq. (21). We find that the results of using the S&P, STOXX, and OMX ESG indexes with WTI crude oil prices (Table 3 and Fig. 2, Table 4 and Fig. 3, and Table 5 and Fig. 4, respectively) are the same as the result of using the MSCI ESG index with WTI crude oil prices. Thus, from the point of the relationship between energy and environmental value, there is no distinction among the ESG indexes. As a comparison with the ESG index, we examine the relationship between the S&P 500 index and WTI crude oil prices. The result (Table 6 and Fig. 5) is consistent with the results of using all the ESG indexes with WTI crude oil prices. Therefore, it seems that the ESG indexes share the same characteristics as the S&P 500 concerning the relationship between energy and environmental value.
Table 2.
CR Model Parameter Estimation between MSCI ESG index and WTI Crude Oil Price: Note all estimates are statistically significant judging from the corresponding standard errors
| Estimates | 0.496 | 1.040E+03 | 413.564 | 4.741 | 8.646E+02 | 2.176E-06 | 0.122 | −2.742E-01 | 2.317E-03 |
| Std Errors | 0.000 | 6.588E-09 | 0.000 | 0.002 | 0.000 | 1.286E-10 | 0.000 | 9.331E-09 | 9.314E-09 |
| Loglikelihood | 16,887 | ||||||||
| AIC | −33,756 | ||||||||
| SIC | −33,704 |
is estimated as a positive value, implying that the correlations between the MSCI ESG index and WTI crude oil prices are a decreasing function of the latter.
Fig. 1.
MSCI ESG index, WTI Crude Oil Price, and Correlations: The correlations in the lower figure are positive but move in the opposite direction to WTI in the middle figure over time
Table 3.
CR Model Parameter Estimation between S&P ESG index and WTI Crude Oil Price: Note all estimates are statistically significant judging from the corresponding standard errors
| Estimates | 0.496 | 4.050E+02 | 161.301 | 3.576 | 2.011E+02 | 1.469E-06 | −0.197 | −3.370E-01 | 1.919E-03 |
| Std Errors | 0.000 | 2.514E-06 | 0.000 | 0.000 | 0.000 | 2.859E-10 | 0.000 | 1.245E-08 | 6.877E-08 |
| Loglikelihood | 16,682 | ||||||||
| AIC | −33,346 | ||||||||
| SIC | −33,293 |
is estimated as a positive value, implying that the correlations between the S&P ESG index and WTI crude oil prices are a decreasing function of the latter.
Fig. 2.
S&P ESG index, WTI Crude Oil Price, and Correlations: The correlations in the lower figure are positive but move in the opposite direction to WTI in the middle figure over time
Table 4.
CR Model Parameter Estimation between STOXX ESG index and WTI Crude Oil Price: Note all estimates are statistically significant judging from the corresponding standard errors
| Estimates | 0.548 | 1.914E+02 | 61.165 | 1.306 | 1.416E+02 | 1.583E+00 | 0.232 | −1.065E-01 | 1.082E-03 |
| Std Errors | 0.002 | 4.099E-01 | 0.729 | 0.001 | 0.067 | 1.496E-02 | 0.015 | 1.247E-02 | 1.676E-04 |
| Loglikelihood | 14,843 | ||||||||
| AIC | −29,667 | ||||||||
| SIC | −29,615 |
is estimated as a positive value, implying that the correlations between the STOXX ESG index and WTI crude oil prices are a decreasing function of the latter.
Fig. 3.
STOXX ESG index, WTI Crude Oil Price, and Correlations: The correlations in the lower figure are positive but move in the opposite direction to WTI in the middle figure over time
Table 5.
CR Model Parameter Estimation between OMX ESG index and WTI Crude Oil Price: Note all estimates are statistically significant judging from the corresponding standard errors
| Estimates | 0.970 | 1.885E+03 | 113.324 | 2.613 | 2.381E+02 | 8.217E-06 | 0.370 | −4.512E-03 | 4.239E-04 |
| Std Errors | 0.000 | 1.393E-08 | 0.000 | 0.000 | 0.000 | 3.045E-09 | 0.026 | 1.261E-07 | 2.951E-08 |
| Loglikelihood | 10,555 | ||||||||
| AIC | −21,092 | ||||||||
| SIC | −21,042 |
is estimated as a positive value, implying that the correlations between the OMX ESG index and WTI crude oil prices are a decreasing function of the latter.
Fig. 4.
OMX ESG index, WTI Crude Oil Price, and Correlations: The correlations in the lower figure are positive but move in the opposite direction to WTI in the middle figure over time
Table 6.
CR Model Parameter Estimation between S&P 500 index and WTI Crude Oil Price: Note all estimates are statistically significant judging from the corresponding standard errors
| Estimates | 0.573 | 1.515E+03 | 438.173 | 3.399 | 3.139E+04 | 1.252E-06 | 0.092 | −7.417E+00 | 7.029E-02 |
| Std Errors | 0.000 | 8.789E-08 | 0.000 | 0.000 | 0.000 | 3.160E-09 | 0.000 | 4.629E-05 | 6.622E-09 |
| Loglikelihood | 16,956 | ||||||||
| AIC | −33,894 | ||||||||
| SIC | −33,842 |
is estimated as a positive value, implying that the correlations between the S&P 500 index and WTI crude oil prices are a decreasing function of the latter.
Fig. 5.
S&P 500 index, WTI Crude Oil Price, and Correlations: The correlations in the lower figure are positive but move in the opposite direction to WTI in the middle figure over time
To examine the differences in kinds of crude oil, we use Brent in comparison with WTI crude oil. The results of using Brent crude oil for the MSCI, S&P, STOXX, and OMX ESG indexes and the S&P 500 index (Table 7 and Fig. 6, Table 8 and Fig. 7, Table 9 and Fig. 8, Table 10 and Fig. 9, and Table 11 and Fig. 10, respectively) are completely identical to the results of using WTI crude oil for the MSCI, S&P, STOXX, and OMX ESG indexes and the S&P 500 index.
Table 7.
CR Model Parameter Estimation between MSCI ESG index and Brent Crude Oil Price: Note all estimates are statistically significant judging from the corresponding standard errors
| Estimates | 0.739 | 9.216E+02 | 133.027 | 4.703 | 8.493E+02 | 2.583E-06 | 0.046 | −4.452E-01 | 3.004E-03 |
| Std Errors | 0.000 | 9.165E-09 | 0.000 | 0.000 | 0.000 | 4.906E-10 | 0.000 | 3.912E-08 | 9.553E-09 |
| Loglikelihood | 17,168 | ||||||||
| AIC | −34,317 | ||||||||
| SIC | −34,265 |
is estimated as a positive value, implying that the correlations between the MSCI ESG index and Brent crude oil prices are a decreasing function of the latter.
Fig. 6.
MSCI ESG index, Brent Crude Oil Price, and Correlations: The correlations in the lower figure are positive but move in the opposite direction to Brent in the middle figure over time
Table 8.
CR Model Parameter Estimation between S&P ESG index and Brent Crude Oil Price: Note all estimates are statistically significant judging from the corresponding standard errors
| Estimates | 0.587 | 6.757E+02 | 189.796 | 3.510 | 1.885E+02 | 2.047E-06 | 0.194 | −8.282E-02 | 9.735E-04 |
| Std Errors | 0.000 | 9.466E-07 | 0.000 | 0.000 | 0.000 | 1.121E-08 | 0.000 | 2.464E-08 | 2.789E-06 |
| Loglikelihood | 16,947 | ||||||||
| AIC | −33,877 | ||||||||
| SIC | −33,824 |
is estimated as a positive value, implying that the correlations between the S&P ESG index and Brent crude oil prices are a decreasing function of the latter.
Fig. 7.
S&P ESG index, Brent Crude Oil Price, and Correlations: The correlations in the lower figure are positive but move in the opposite direction to Brent in the middle figure over time
Table 9.
CR Model Parameter Estimation between STOXX ESG index and Brent Crude Oil Price: Note all estimates except are statistically significant judging from the corresponding standard errors
| Estimates | 0.740 | 5.532E+02 | 79.615 | 1.324 | 1.405E+02 | 1.351E+00 | 0.400 | 1.532E-03 | 4.381E-04 |
| Std Errors | 0.002 | 1.001E+00 | 0.570 | 0.001 | 0.066 | 1.556E-02 | 0.012 | 4.299E-03 | 5.077E-05 |
| Loglikelihood | 15,116 | ||||||||
| AIC | −30,214 | ||||||||
| SIC | −30,161 |
is estimated as a positive value, implying that the correlations between the STOXX ESG index and Brent crude oil prices are a decreasing function of the latter.
Fig. 8.
STOXX ESG index, Brent Crude Oil Price, and Correlations: The correlations in the lower figure are positive but move in the opposite direction to Brent in the middle figure over time
Table 10.
CR Model Parameter Estimation between OMX ESG index and Brent Crude Oil Price: Note all estimates are statistically significant judging from the corresponding standard errors
| Estimates | 1.099 | 2.328E+03 | 78.369 | 2.560 | 2.085E+02 | 1.143E-05 | −0.034 | −4.342E-02 | 2.868E-04 |
| Std Errors | 0.000 | 9.447E-09 | 0.000 | 0.000 | 0.000 | 7.034E-10 | 0.000 | 8.401E-07 | 9.703E-09 |
| Loglikelihood | 10,753 | ||||||||
| AIC | −21,488 | ||||||||
| SIC | −21,439 |
is estimated as a positive value, implying that the correlations between the OMX ESG index and Brent crude oil prices are a decreasing function of the latter.
Fig. 9.
OMX ESG index, Brent Crude Oil Price, and Correlations: The correlations in the lower figure are positive but move in the opposite direction to Brent in the middle figure over time
Table 11.
CR Model Parameter Estimation between S&P 500 index and Brent Crude Oil Price: Note all estimates are statistically significant judging from the corresponding standard errors
| Estimates | 0.765 | 2.050E+02 | 26.437 | 3.894 | 3.189E+06 | 2.453E-06 | 0.382 | −9.997E+00 | 4.000E+01 |
| Std Errors | 0.000 | 4.171E-07 | 0.000 | 0.000 | 0.000 | 2.704E-08 | 0.000 | 9.002E-08 | 1.605E-05 |
| Loglikelihood | 17,297 | ||||||||
| AIC | −34,575 | ||||||||
| SIC | −34,523 |
is estimated as a positive value, implying that the correlations between the S&P 500 index and Brent crude oil prices are a decreasing function of the latter.
Fig. 10.
S&P 500 index, Brent Crude Oil Price, and Correlations: The correlations in the lower figure are positive but move in the opposite direction to Brent in the middle figure over time
Regardless of the ESG indexes used, the correlations between the ESG indexes and the energy prices are a decreasing function of the energy prices. This is completely different from the results of environmental assets, including green bonds (Kanamura, 2020), clean energy indexes (Gupta, 2017; Kanamura, 2022), and carbon assets (Kanamura, 2016). The finding may imply that ESG indexes cannot adequately demonstrate environmental values, but instead reflect social and governance values, i.e., (E)SG, from the complementary point of view. The results obtained in this paper are consistent with the finding of Petitjean (2019) that the existence of emission reduction or climate change policies in large U.S. companies does not seem to be broadly associated with better financial performance. This seems in sharp contrast with Derwall et al. (2005) where E aspect generates the returns. They suggest that the portfolio return of companies with relatively high-ranked environmental value is superior to the portfolio return of companies with relatively low-ranked environmental value within the industry. However, the reasons for the differences may come from their usage of historical data from 1995 to 2003, their usage of static models without time variance, such as CAPM and multi-factor models, and their non-considerations of the relationship between energy and environmental values. As the interpretation of (E)SG, the separation between E and SG comes from differences in time horizons, because E affects long-term aspects such as ten- or twenty-years government plans for climate change actions, whereas SG affects short-term aspects such as this year’s financial performance of companies. The results are completely in alignment with Pedersen et al. (2021), who have recently shown that higher G proxies predict an increase in future profitability, while E proxies are not robustly related to fundamentals. In addition, the results are almost consistent with Giese et al. (2021), who have empirically shown that G pillar scores are far more significant than E and S pillars over a relatively short period in terms of their impact on profitability, idiosyncratic risk, and systematic risk, whereas E and S indicators are more significant over longer periods, as reflected in stock-price performance.
ESG premium analysis
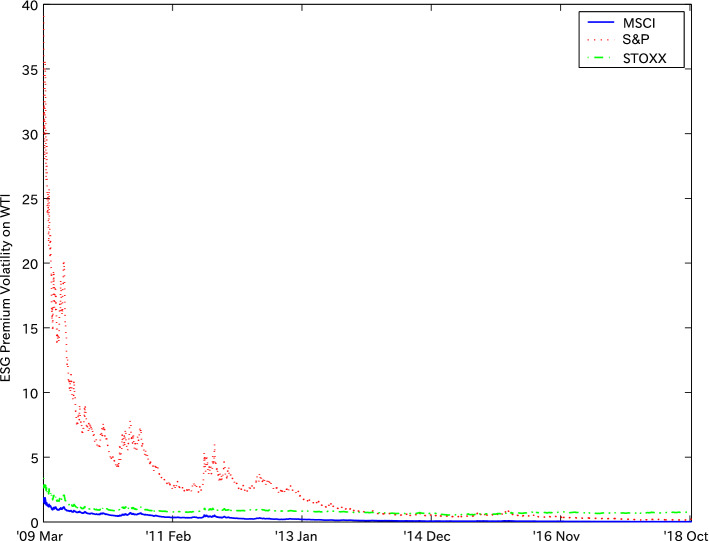
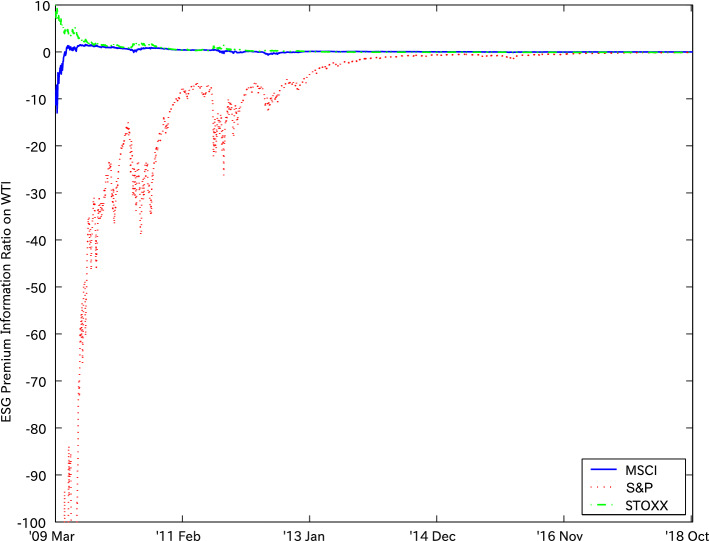
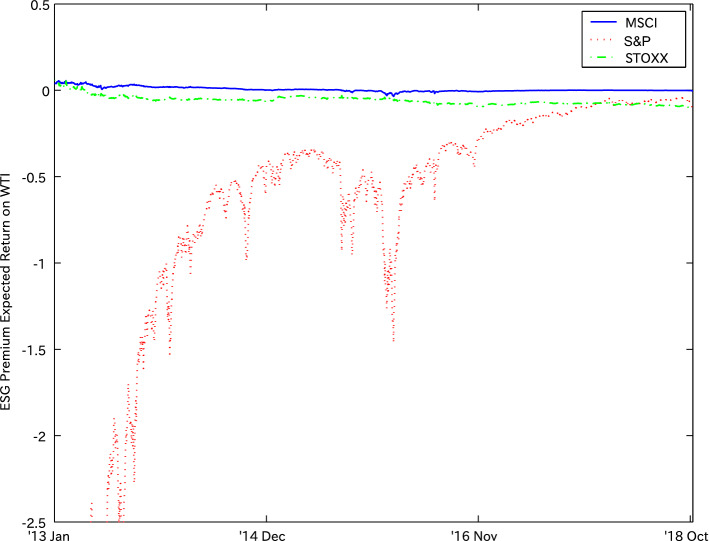
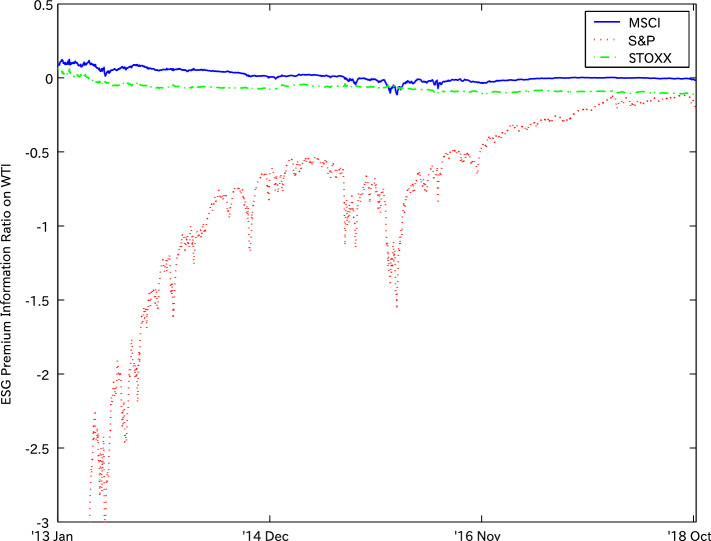
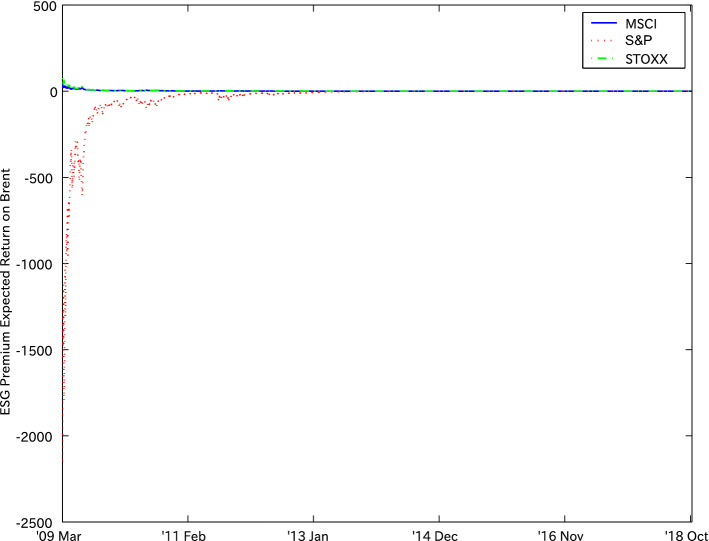
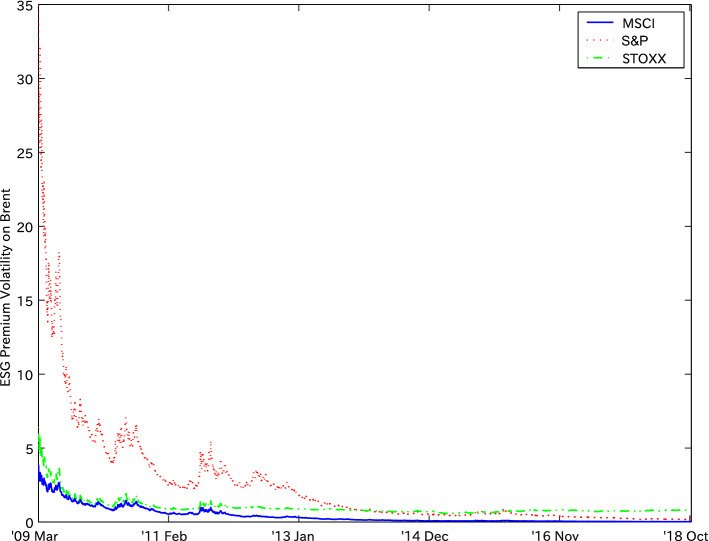
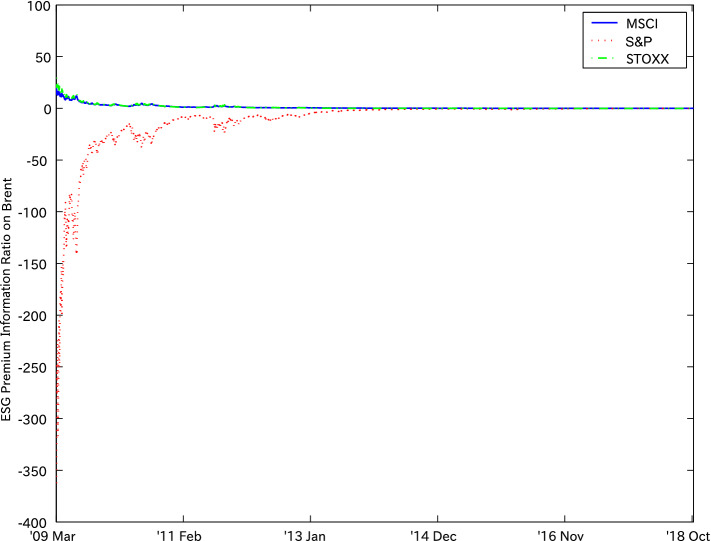
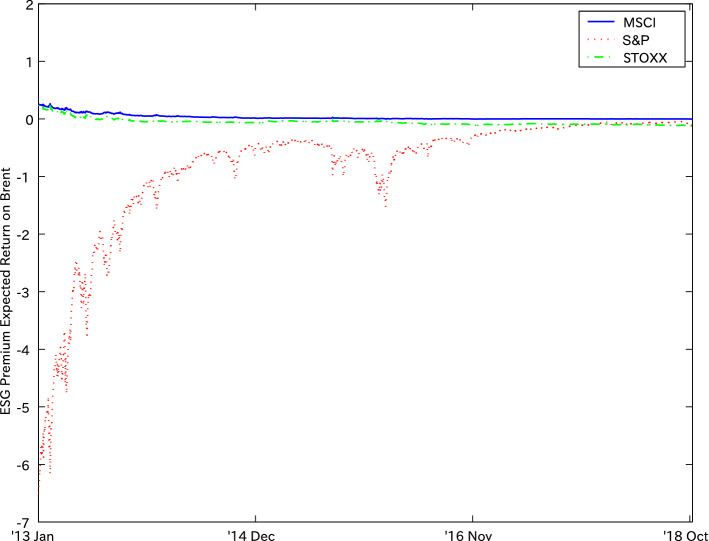
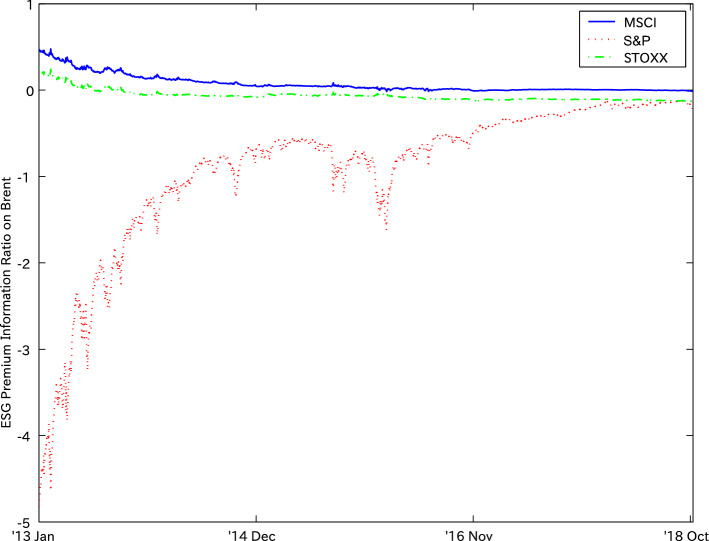
We analyze the ESG premiums by using the ESG premium model we proposed. Figures 11, 13, and 14 report the expected return of ESG premiums (i.e., the expected excess return to the S&P 500 benchmark), the risk of ESG premiums (i.e., the volatility of excess ESG index returns to the S&P 500 benchmark), and the information ratio (i.e., the ratio between the expected return of ESG premiums and the risk of ESG premiums by using WTI crude oil prices). Figures 12 and 15 are enlarged versions of Figs. 11 and 14, respectively. Note that we employ three ESG indexes of the MSCI, S&P, and STOXX to use the same sample period for the indexes as long as possible. Here, we employ the whole data sample correlations between the ESG index and the S&P 500 for in Eq. (17). According to Fig. 11 while the MSCI and STOXX ESG indexes take positive expected returns at the beginning of the sample period,5 the S&P ESG indexes take negative expected returns. However, according to Fig. 12, as time goes by, all of the ESG indexes converge to almost zero expected returns. According to Fig. 13, the volatilities of the ESG premiums of the MSCI and STOXX take smaller values than those of the S&P at the beginning of the sample period. However, as time proceeds, the volatilities of all the ESG premiums converge to almost constant values. According to Fig. 14, the information ratios of the ESG premiums of the MSCI and STOXX take positive values at the beginning of the sample period,6 while the information ratio of the ESG premium of the S&P takes negative values. However, based on Fig. 15, as time goes on, the information ratios of all the ESG premiums converge to almost zero as decreasing.7 We also find the same results when using Brent crude oil for the expected return, risk, and information ratio of ESG premiums (Figs. 16, 17, and 18 with Figs. 19 and 20, which are enlarged versions of Figs. 16 and 18, respectively) instead of WTI crude oil.
Fig. 11.
ESG Premium Expected Return for MSCI, S&P, and STOXX ESG Indexes on WTI: MSCI and STOXX ESGs tend to be positive expected returns in the beginning, while S&P one starts with negative ones
Fig. 13.
ESG Premium Volatility for MSCI, S&P, and STOXX ESG Indexes on WTI: The volatilities of the ESG premiums of MSCI and STOXX start with smaller values than those of the ESG premiums of S&P. The volatility of all ESG premiums has converged to constant values over time
Fig. 14.
ESG Premium Information Ratio for MSCI, S&P, and STOXX ESG Indexes on WTI: The information ratios of the ESG premiums of MSCI and STOXX tend to be positive values in the beginning, while the information ratio of the ESG premiums of S&P starts with negative values
Fig. 12.
ESG Premium Expected Return for MSCI, S&P, and STOXX ESG Indexes on WTI (Enlarged Version for Recent Years): As time goes by, all ESG indexes converge to almost zero expected returns
Fig. 15.
ESG Premium Information Ratio for MSCI, S&P, and STOXX ESG Indexes on WTI (Enlarged Version for Recent Years): The figure demonstrates that the information ratios of all ESG premiums have converged to almost zero over time
Fig. 16.
ESG Premium Expected Return for MSCI, S&P, and STOXX ESG Indexes on Brent: MSCI and STOXX ESGs start with positive expected returns, while S&P ESG does with negative expected returns
Fig. 17.
ESG Premium Volatility for MSCI, S&P, and STOXX ESG Indexes on Brent: The volatilities of the MSCI and STOXX ESG premiums start with smaller values than S&P ones. The volatilities of all ESGs have converged to constant values over time
Fig. 18.
ESG Premium Information Ratio for MSCI, S&P, and STOXX ESG Indexes on Brent: The information ratios of the ESG premiums of MSCI and STOXX start with positive values, while the information ratio of the ESG premiums of S&P starts with negative values
Fig. 19.
ESG Premium Expected Return for MSCI, S&P, and STOXX ESG Indexes on Brent (Enlarged Version for Recent Years): As time goes by, all ESG indexes converge to almost zero expected returns
Fig. 20.
ESG Premium Information Ratio for MSCI, S&P, and STOXX ESG Indexes on Brent (Enlarged Version for Recent Years): The figure demonstrates that as time goes on, the information ratios of all ESG premiums have converged to almost zero
In summary, we demonstrate that the expected returns of ESG premiums tend to be positive in the beginning. The positivity is consistent with many studies that show the positive effect of ESG factors on investment performance (Derwall et al., 2005; Kempf & Osthoff, 2007; Sudha, 2015; Weber & Wei Rong, 2016; Ashwin Kumar et al., 2016; Kappou & Oikonomou, 2016; Park & Lee, 2018; Sherwood & Pollard, 2018; Broadstock et al., 2021). More interestingly, we show that the risks of ESG premiums are decreasing and have been converging to almost zero in recent years. As the result of the balance between the risk and the return, we find positive but decreasing information ratios. This may imply stable returns of ESG investments and embody the significance of ESG investments compared to market index investments. However, the significance may be limited because positive but close-to-zero information ratios mean that ESG investment performance will converge to market portfolio investment performance over time. This may suggest that ESG – in particular, SG – components will be incorporated into the market over time.
Discussion of findings
A comparative analysis with previous studies
To highlight and summarize the scientific value of this study, we discuss the findings with comparison of obtained results with the results described in previous publications. Many studies are showing the positive effects of ESG factors on investment performance. Derwall et al. (2005) have demonstrated that equity portfolios with high eco-efficiency scores yield higher risk-adjusted returns than portfolios with low eco-efficiency scores. Kempf & Osthoff (2007) have found that the abnormal returns are significant by incorporating socially responsible screens into their investment process even after taking into account reasonable transaction costs. Sudha (2015) has demonstrated that annualized returns of the ESG India index have outperformed the returns of the two Indian market indexes, CNX Nifty and CNX 500. Weber & Wei Rong (2016) have found that an emerging market’s socially responsible investing (SRI) index, which is the same concept as ESG, is ranked higher in terms of mean return than most conventional emerging market portfolios. Ashwin Kumar et al. (2016) have empirically suggested that companies with ESG factors demonstrate higher returns and lower volatility in the stock performance than their peers in the same industry. Kappou & Oikonomou (2016) found that the addition of a stock to the MSCI KLD 400, the most well-known social stock index, does not cause a material change in its market price, but deletion leads to negative cumulative abnormal returns. Park & Lee (2018) have demonstrated that in the short- and long-terms, the announcement of inclusion in the SRI governance index has a positive effect on the stock market, whereas exclusion has a negative effect. Regarding the performance of ESG investing, Sherwood & Pollard (2018) have found significant outperformance based on ESG integration within emerging market investment strategies. Broadstock et al. (2021) have examined the role of ESG performance in China during the market-wide COVID-19 financial crisis, attaining three findings: (i) high-ESG portfolios generally outperform low-ESG portfolios; (ii) ESG performance mitigates financial risk during the financial crisis; and (iii) the role of ESG performance is attenuated in normal times. However, there are also a small number of empirical studies that show that ESG factors do not always have a positive effect on investment performance. Ur Rehman et al. (2016) have shown that there are no significant differences in the risk-adjusted returns between the ESG indexes and the composite indexes; moreover, the market volatility of the ESG indexes was higher than that of the conventional indexes within eight Asian countries from 2002 to 2014. These studies are highly significant in that they discuss ESG investing performance empirically from risk and return. However, given that these studies comprehensively examine investment performance across all ESG factors, they do not demonstrate which E, S, or G factor drives ESG investment performance. Mǎnescu (2011) has examined the impacts of seven environmental, social, and governance (ESG) attributes on risk-adjusted stock returns regarding large publicly traded U.S. firms from July 1992 to June 2008, finding that the only positive impact of community relations in S comes not from compensation for risk but mispricing. By using a new data set of environmental, social, and corporate governance company ratings for the European market from 2004 to 2012, Auer (2016) has attained the following results: (i) negative screens excluding ESG unrated stocks from a representative European stock universe allow investors to significantly outperform a passive investment in a diversified European stock benchmark portfolio; (ii) additional negative screens based on environmental and social scores do not change portfolio value under not too high cut-off rates; and (iii) by contrast, governance screens can significantly increase portfolio performance under similar conditions. Concerning the impact of each ESG component on future performance, Pedersen et al. (2021) have recently shown that higher G proxies predict an increase in future profitability, while E proxies are not robustly related to fundamentals. Auer & Schuhmacher (2016) have demonstrated that in Europe, investors tend to pay a price for socially responsible investing out of ESG investing and that geographical location has an impact on ESG investment performance, such that in the Asia-Pacific region and the United States, ESG investors perform similarly to the market, while in Europe, ESG investors end up with significantly lower risk-adjusted performance than the passive benchmarks. Giese et al. (2021) have empirically demonstrated that G pillar scores are far more significant than E and S pillars over a relatively short period in terms of their impact on profitability, idiosyncratic risk, and systematic risk, while E and S indicators are more significant over longer periods, as reflected in stock-price performance. These papers include very important implications regarding the different impacts of E, S, and G components on financial performance. However, if E (environment) is a dominant feature of ESG assets, then we expect that the ESG assets will reflect the relationship with energy assets, as observed in existing environmental assets such as green bonds (Kanamura, 2020), clean energy indexes (Gupta, 2017; Kanamura, 2022), and carbon assets (Kanamura, 2016). This relationship may be effective in scrutinizing the impact of environmental components on ESG investments. However, previous studies examining which E, S, or G factor drives ESG investment performance have not evaluated the chronological performance of ESG indexes based on energy-environment value relations.
As a completely different approach to examining the ESG investing performance from existing literature, this research analyzed the presence of environmental values in ESG indexes based on the positive value relationship between energy and the environment found in existing studies and identified the characteristics of environmental, social, and governance (ESG) investments by examining the performance of ESG investments compared to market portfolios. As the first contribution of this study, based on the supply demand-based correlation model, we proposed a new model of the expected return, the risk, and the performance ratio of ESG premiums, which is referred to as ‘the ESG premium model.’ As the second contribution of this study, empirical studies have shown that regardless of the kinds of ESG indexes in question, their correlations with energy prices are a decreasing function of energy prices. This is completely different from the results of environmental assets such as green bonds (Kanamura, 2020), clean energy indexes (Gupta, 2017; Kanamura, 2022), and carbon assets (Kanamura, 2016). As the third contribution of this study, using the empirical findings of this study that the information ratio of the ESG premiums tends to be positive but declines and approaches zero over time, this paper indicates that although ESG investments can be significant compared to market index investments, the significance is limited because ESG investment performance converges with market portfolio performance. A comparative analysis with previous studies discussed above is summarized in Table 12 to highlight the difference between this study and the existing literature.
Table 12.
A comparative analysis with previous studies
| ESG | SRI | E, S, G | E impact from | |
|---|---|---|---|---|
| investing | investing | factor | energy-environment | |
| performance | performance | analysis | relation | |
| Derwall et al. (2005) | X | |||
| Kempf & Osthoff (2007) | X | |||
| Mǎnescu (2011) | X | X | ||
| Sudha (2015) | X | |||
| Auer & Schuhmacher (2016) | X | X | ||
| Weber & Wei Rong (2016) | X | |||
| Ashwin Kumar et al. (2016) | X | |||
| Auer (2016) | X | X | ||
| Ur Rehman et al. (2016) | X | |||
| Kappou & Oikonomou (2016) | X | |||
| Sherwood & Pollard (2018) | X | |||
| Park & Lee (2018) | X | |||
| Pedersen et al. (2021) | X | X | ||
| Broadstock et al. (2021) | X | |||
| Giese et al. (2021) | X | X | ||
| This research | X | X | X |
Academic and managerial implications
The empirical analysis has shown that ESG indexes do not adequately represent the charactreistics of environmental assets from energy-environment relationship. This has been based on the results of an empirical study showing that the correlation between ESG indexes and energy prices is a decreasing function of energy prices, irrespective of ESG indexes, using the MSCI, S&P, STOXX, and OMX ESG indexes and WTI and Brent crude oil prices. From the academic and managerial perspectives, the results may imply that ESG indexes cannot adequately demonstrate environmental values, but reflect social and governance values, i.e., (E)SG, from the complementary point of view. More importantly, we demonstrate that the expected returns of ESG premiums converge to almost zero and the risks of ESG premiums have been decreasing and converging on certain values over time in recent years, resulting in decreasing information ratios. This may suggest stable returns of ESG investments and embody the significance of ESG investing compared to market index investing. However, it also suggests that the significance is limited because the positive but close-to-zero information ratios mean that ESG investing performance will converge to market portfolio investing performance over time.
Policy recommendations
One of the implications that emerge for clean energy policy from the findings of this study’s correlation analyses is that in promoting ESG investment for clean energy, which has received a lot of attention in recent years, it is important to note that environmental (E) aspects do not necessarily and immediately represent an effect on the value of the ESG investment. It is difficult for energy industries to have short-term environmental value evaluated in markets by investing in clean energy as environmental measures through ESG investments, which are just beginning. In other words, given that renewable energy investments under ESG investments may not accurately value the environment, renewable energy policy decision-makers need to clearly distinguish between ESG investments and renewable energy investments as an important policy recommendation. To put it further, renewable energy investments would better reflect environmental values if they were invested in as renewable energy investments themselves, rather than within the framework of ESG investments. However, it is also true that renewable energy has been implemented in many ESG investment frameworks. Thus, using the results of the empirical analysis of the ESG premiums, we consider recommendations for clean energy policies when renewable energy is implemented within the ESG investment framework. Using the empirical findings of this study that the information ratio of the ESG premium tends to be positive but declines and approaches zero over time, this paper indicated that although ESG investments can be significant compared to market index investments, the significance is limited because ESG investment performance converges with market portfolio performance. Thus, as another important policy recommendation, we should be prepared for the fact that the superior investment performance due to social and governance values, rather than environmental values, will not last long, if investments in renewable energy projects are treated as ESG investments. To put it further, the value of renewable energy projects within the framework of ESG investing is short-term, not long-term. Finally, in alignment with the clear distinction between ESG and renewable energy investments argued for in this study, a positive relationship with energy prices was observed in an analysis using clean energy indexes (Gupta, 2017; Kanamura, 2022), which are more specific to renewable energy than ESG indexes. On this basis, the environmental value of renewable energy is accompanied by the energy value of fossil fuels. Energy policymakers, including clean energy policymakers, need to pay close attention to the existence of a positive relationship between renewable energy and fossil fuel generation against asset risk diversification when considering the optimal asset portfolio of the generation mix. While the mass deployment of renewable energy and the reduction of fossil fuel power generation is arguably the best way to reduce CO emissions, there may be a relationship where the more the value of renewable energy is emphasized, the more the value of fossil fuel power is highlighted.
Limitations of the study
As a limitation of the data, four ESG indexes were used in this study - MSCI, S&P, STOXX, and OMX - but these have sub-indexes including MSCI Japan ESG Select Leaders Index, which were not analyzed. Also, although WTI and Brent were used as oil prices, Dubai and other oil prices were not used. However, both the ESG indexes and oil prices used in the analysis are representative of global indexes and the generality of the results should not be compromised. This study focused on the economic aspects of the environmental value of ESG investments. However, it did not address the environmental value from technological aspects in technologies such as renewable energy, which constitute ESG investments. This is an important limitation of this study.
Replicability of study
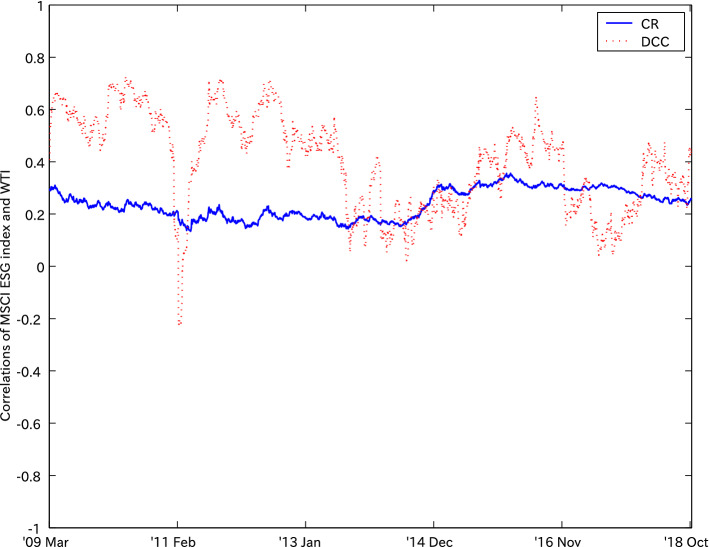
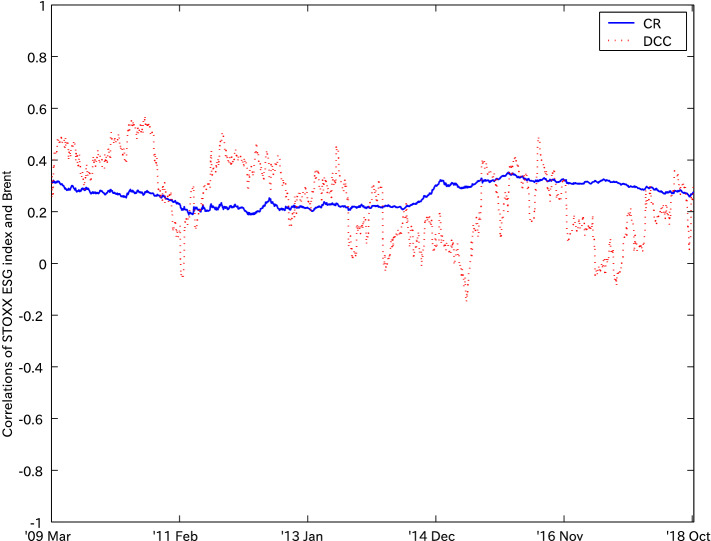
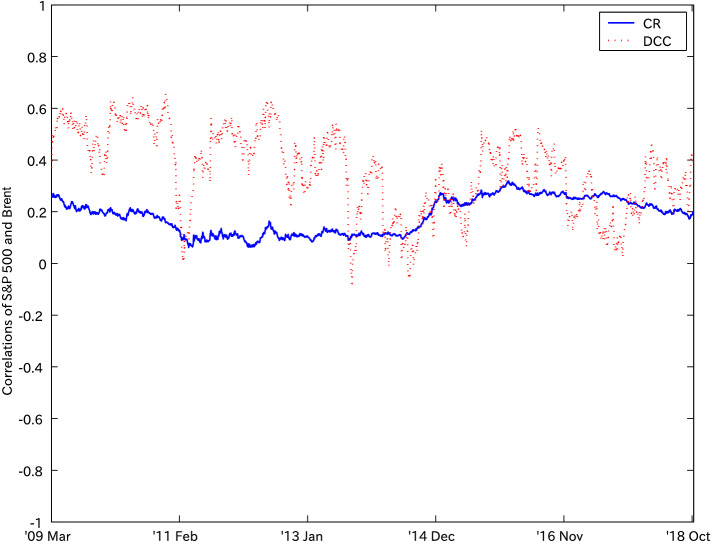
To clarify the replicability of this study, we investigate the validity of the CR model proposed in this paper by examining the relationship between crude oil prices of WTI and Brent and stock indexes of the MSCI ESG, S&P ESG, STOXX ESG, OMX ESG, and S&P 500 obtained from the existing dynamic conditional correlation (DCC) model of Engle (2002). The details of the DCC model are given in “Appendix A”. The estimation results for the MSCI ESG and WTI crude oil prices are reported in Table 13. All estimated parameters are statistically significant. The statistical significance of , , , and suggests the GARCH effects in the MSCI ESG and WTI crude oil price returns. The correlations between the MSCI ESG and WTI crude oil price returns are time-varying because of the significance of and . Figure 21 shows the comparisons of the correlations between the MSCI ESG and WTI crude oil price returns from the CR model with those from the DCC model. It suggests that similarly to the CR model, the DCC model demonstrates time-varying and almost positive correlations between the MSCI ESG and WTI crude oil price returns. Given that the model demonstrates the same level of correlations as the DCC model, we can safely say that the CR model works well as the correlation model between the MSCI ESG and WTI crude oil price returns.
Table 13.
DCC Model Parameter Estimation between MSCI ESG index and WTI Crude Oil Price: Note all estimates are statistically significant
| Parameters | ||||||||
|---|---|---|---|---|---|---|---|---|
| Estimates | 9.568E-07 | 0.100 | 0.890 | 2.539E-06 | 0.052 | 0.942 | 0.026 | 0.967 |
| Std Errors | 4.110E-07 | 0.025 | 0.026 | 1.260E-06 | 0.012 | 0.013 | 0.007 | 0.010 |
| Loglikelihood | 1.546E+04 | |||||||
| AIC | −3.090E+04 | |||||||
| SIC | −3.085E+04 |
The correlations between the MSCI ESG and WTI crude oil price returns are time-varying because of the significance of and
Fig. 21.
Comparison of CR and DCC on Correlations between MSCI ESG index and WTI Crude Oil Price
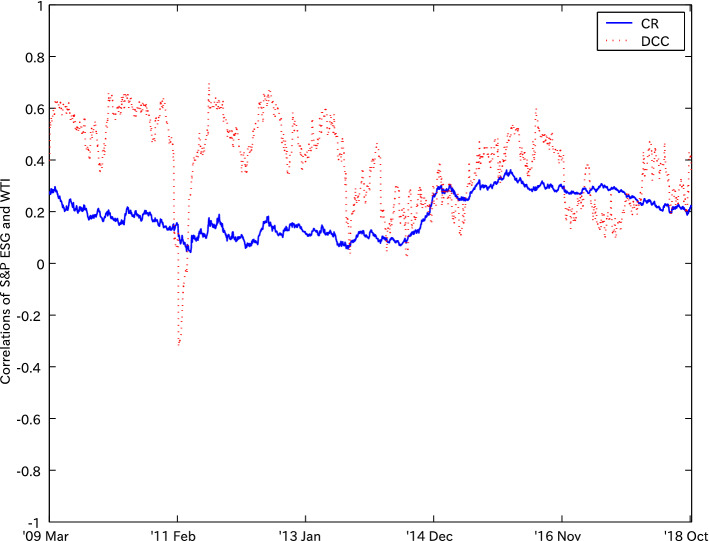
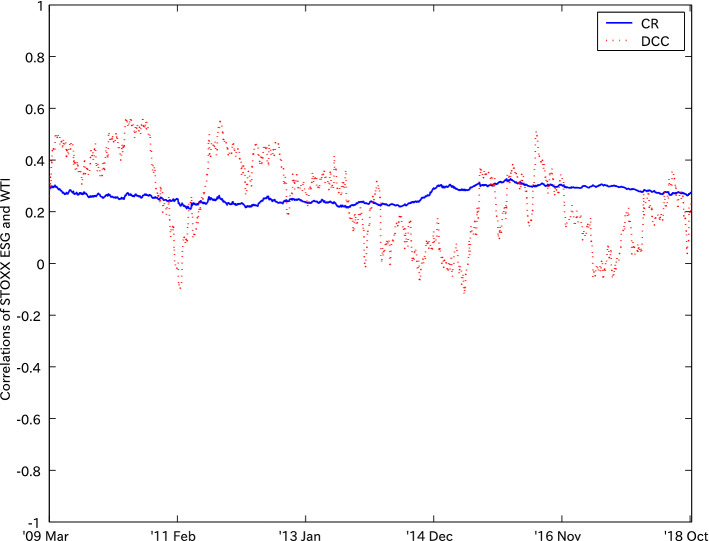
The results of using the S&P, STOXX, and OMX ESG indexes and the S&P 500 index with WTI crude oil prices are the same as that of using MSCI ESG and WTI crude oil prices, as shown in Table 14 and Fig. 22, Table 15 and Fig. 23, Table 16 and Fig. 24, and Table 17 and Fig. 25, respectively. Simultaneously, the results of using Brent crude oil follow those of using WTI crude oil, as in Table 18 and Fig. 26, Table 19 and Fig. 27, Table 20 and Fig. 28, Table 21 and Fig. 29, and Table 22 and Fig. 30.
Table 14.
DCC Model Parameter Estimation between S&P ESG index and WTI Crude Oil Price: Note all estimates are statistically significant
| Parameters | ||||||||
|---|---|---|---|---|---|---|---|---|
| Estimates | 2.663E-06 | 0.122 | 0.853 | 2.539E-06 | 0.052 | 0.942 | 0.027 | 0.961 |
| Std Errors | 7.786E-07 | 0.021 | 0.023 | 1.260E-06 | 0.012 | 0.013 | 0.008 | 0.011 |
| Loglikelihood | 1.497E+04 | |||||||
| AIC | −2.992E+04 | |||||||
| SIC | −2.987E+04 |
The correlations between the S&P ESG and WTI crude oil price returns are time-varying because of the significance of and
Fig. 22.
Comparison of CR and DCC on Correlations between S&P ESG index and WTI Crude Oil Price
Table 15.
DCC Model Parameter Estimation between STOXX ESG index and WTI Crude Oil Price: Note all estimates are statistically significant
| Parameters | ||||||||
|---|---|---|---|---|---|---|---|---|
| Estimates | 2.170E-06 | 0.115 | 0.857 | 2.539E-06 | 0.052 | 0.942 | 0.020 | 0.973 |
| Std Errors | 6.349E-07 | 0.018 | 0.021 | 1.260E-06 | 0.012 | 0.013 | 0.006 | 0.009 |
| Loglikelihood | 1.519E+04 | |||||||
| AIC | −3.037E+04 | |||||||
| SIC | −3.032E+04 |
The correlations between the STOXX ESG and WTI crude oil price returns are time-varying because of the significance of and
Fig. 23.
Comparison of CR and DCC on Correlations between STOXX ESG index and WTI Crude Oil Price
Table 16.
DCC Model Parameter Estimation between OMX ESG index and WTI Crude Oil Price: Note the estimates except are statistically significant
| Parameters | ||||||||
|---|---|---|---|---|---|---|---|---|
| Estimates | 1.984E-06 | 0.081 | 0.901 | 2.433E-06 | 0.061 | 0.934 | 0.014 | 0.982 |
| Std Errors | 8.133E-07 | 0.019 | 0.021 | 1.312E-06 | 0.015 | 0.016 | 0.004 | 0.005 |
| Loglikelihood | 1.051E+04 | |||||||
| AIC | −2.100E+04 | |||||||
| SIC | −2.096E+04 |
The correlations between the OMX ESG and WTI crude oil price returns are time-varying because of the significance of and
Fig. 24.
Comparison of CR and DCC on Correlations between OMX ESG index and WTI Crude Oil Price
Table 17.
DCC Model Parameter Estimation between S&P 500 index and WTI Crude Oil Price: Note all estimates are statistically significant
| Parameters | ||||||||
|---|---|---|---|---|---|---|---|---|
| Estimates | 2.803E-06 | 0.129 | 0.840 | 2.539E-06 | 0.052 | 0.942 | 0.029 | 0.958 |
| Std Errors | 7.589E-07 | 0.022 | 0.023 | 1.260E-06 | 0.012 | 0.013 | 0.009 | 0.013 |
| Loglikelihood | 1.515E+04 | |||||||
| AIC | −3.029E+04 | |||||||
| SIC | −3.024E+04 |
The correlations between the S&P 500 and WTI crude oil price returns are time-varying because of the significance of and
Fig. 25.
Comparison of CR and DCC on Correlations between S&P 500 index and WTI Crude Oil Price
Table 18.
DCC Model Parameter Estimation between MSCI ESG index and Brent Crude Oil Price: Note the estimates except are statistically significant
| Parameters | ||||||||
|---|---|---|---|---|---|---|---|---|
| Estimates | 9.568E-07 | 0.100 | 0.890 | 1.859E-06 | 0.050 | 0.946 | 0.026 | 0.967 |
| Std Errors | 4.110E-07 | 0.025 | 0.026 | 1.013E-06 | 0.012 | 0.013 | 0.008 | 0.011 |
| Loglikelihood | 1.563E+04 | |||||||
| AIC | −3.124E+04 | |||||||
| SIC | −3.119E+04 |
The correlations between the MSCI ESG and Brent crude oil price returns are time-varying because of the significance of and
Fig. 26.
Comparison of CR and DCC on Correlations between MSCI ESG index and Brent Crude Oil Price
Table 19.
DCC Model Parameter Estimation between S&P ESG index and Brent Crude Oil Price: Note the estimates except are statistically significant
| Parameters | ||||||||
|---|---|---|---|---|---|---|---|---|
| Estimates | 2.663E-06 | 0.122 | 0.853 | 1.859E-06 | 0.050 | 0.946 | 0.024 | 0.968 |
| Std Errors | 7.786E-07 | 0.021 | 0.023 | 1.013E-06 | 0.012 | 0.013 | 0.007 | 0.010 |
| Loglikelihood | 1.513E+04 | |||||||
| AIC | −3.025E+04 | |||||||
| SIC | −3.020E+04 |
The correlations between the S&P ESG and Brent crude oil price returns are time-varying because of the significance of and
Fig. 27.
Comparison of CR and DCC on Correlations between S&P ESG index and Brent Crude Oil Price
Table 20.
DCC Model Parameter Estimation between STOXX ESG index and Brent Crude Oil Price: Note the estimates except are statistically significant
| Parameters | ||||||||
|---|---|---|---|---|---|---|---|---|
| Estimates | 2.170E-06 | 0.115 | 0.857 | 1.859E-06 | 0.050 | 0.946 | 0.020 | 0.973 |
| Std Errors | 6.349E-07 | 0.018 | 0.021 | 1.013E-06 | 0.012 | 0.013 | 0.007 | 0.012 |
| Loglikelihood | 1.537E+04 | |||||||
| AIC | −3.073E+04 | |||||||
| SIC | −3.068E+04 |
The correlations between the STOXX ESG and Brent crude oil price returns are time-varying because of the significance of and
Fig. 28.
Comparison of CR and DCC on Correlations between STOXX ESG index and Brent Crude Oil Price
Table 21.
DCC Model Parameter Estimation between OMX ESG index and Brent Crude Oil Price: Note the estimates except and are statistically significant
| Parameters | ||||||||
|---|---|---|---|---|---|---|---|---|
| Estimates | 1.984E-06 | 0.081 | 0.901 | 1.945E-06 | 0.058 | 0.937 | 0.024 | 0.945 |
| Std Errors | 8.133E-07 | 0.019 | 0.021 | 1.079E-06 | 0.014 | 0.014 | 0.014 | 0.046 |
| Loglikelihood | 1.062E+04 | |||||||
| AIC | −2.123E+04 | |||||||
| SIC | −2.119E+04 |
The correlations between the OMX ESG and Brent crude oil price returns are time-varying because of the significance of
Fig. 29.
Comparison of CR and DCC on Correlations between OMX ESG index and Brent Crude Oil Price
Table 22.
DCC Model Parameter Estimation between S&P 500 index and Brent Crude Oil Price: Note the estimates except are statistically significant
| Parameters | ||||||||
|---|---|---|---|---|---|---|---|---|
| Estimates | 2.803E-06 | 0.129 | 0.840 | 1.859E-06 | 0.050 | 0.946 | 0.025 | 0.965 |
| Std Errors | 7.589E-07 | 0.022 | 0.023 | 1.013E-06 | 0.012 | 0.013 | 0.008 | 0.012 |
| Loglikelihood | 1.531E+04 | |||||||
| AIC | −3.061E+04 | |||||||
| SIC | −3.057E+04 |
The correlations between the S&P 500 and Brent crude oil price returns are time-varying because of the significance of and
Fig. 30.
Comparison of CR and DCC on Correlations between S&P 500 index and Brent Crude Oil Price
Conclusions
Against the background of the positive relationship between environmental asset values and energy asset values observed for many environmental assets, the paper focused on the relationship between ESG indexes and energy commodity prices. With this focus, we quantitatively examined the importance of environmental, social, and governance components in ESG indexes and the outperformance of ESG investments on market portfolios in terms of risk-return relationships, and discussed the implications of ESG investments for clean energy policy. As a basic pricing model for the quantitative analysis, the Kanamura (2022) model was applied to a price correlation model between ESG indexes and energy commodities. The study made three contributions. The first contribution, in the form of an application of the basic pricing model, is the proposal of a new model ‘ESG Premium Model’ that represents the expected return, risk, and performance ratio of the ESG premium, which can test the role of environmental values in ESG indexes and the outperformance of ESG investments relative to the market portfolio. The second contribution is that the empirical analysis has shown that ESG indexes do not adequately represent environmental values, but reflect social and governance values, i.e., (E)SG, in the complementary perspective. This has been based on the results of an empirical study showing that the correlation between ESG indexes and energy prices is a decreasing function of energy prices, irrespective of ESG indexes, using the MSCI, S&P, STOXX, and OMX ESG indexes and WTI and Brent crude oil prices. As the third contribution, although the empirical analysis has suggested stable returns for ESG investments and embodies the importance of ESG investments compared to market index investments (in alignment with, e.g., Ashwin Kumar et al., 2016), the performance of ESG investments is likely to converge with that of the market portfolio over time, implying that good ESG investing performance may be of limited significance. This is based on recent evidence of positive but decreasing information ratios as the result of the balance between the return and the risk, where the expected return on the ESG premium converges to a positive value and the risk of the ESG premium decreases over time and converges to a constant value, respectively.
As the implications and policy recommendations from this study, two points should be noted about ESG investing in clean energy policy: given the dilution of environmental values in ESG investing, a clear distinction should be made between ESG investing and renewable energy investing; even if investments in renewable energy projects are treated as ESG investments, reflecting current market trends, we should be prepared for the fact that the superior investment performance due to social and governance values, rather than environmental values, will not last long.
Acknowledgements
This research is supported by a grant-in-aid from Financial Support Programme for Green Bond Issuance for FY2019: Research on pricing, risk, impact, etc., of Green Bonds and others. The views expressed in this paper are those of the author. I am grateful to two anonymous referees, the associate editor Assunta di Vaio, the editor-in-chief Luc Hens, and the co-editor-in-chief Jingzheng Ren for their valuable comments and suggestions. All remaining errors are mine.
A DCC model
We model the log return of prices using Engle’s DCC model as follows
| A1 |
| A2 |
| A3 |
where , and . For , we have
| A4 |
| A5 |
| A6 |
| A7 |
where is the diagonal component of the square root of the diagonal elements of 8 and is the filtration at time . Eq. (A4) represents the GARCH(1,1) effect for each price return, which may generally be observed in energy futures markets. The conditional correlations are calculated using Eq. (A6) where Eq. (A7) represents time-varying conditional covariance. The scale parameters and represent the effects of previously standardized shock and conditional correlation persistence, respectively.9 If either of the estimates of or in Eq. (A7) is statistically significant, the correlation structure of the pairs demonstrates time-varying. The estimation is conducted in two steps: First, conditional volatilities are estimated using the univariate GARCH(1,1) model. Second, we estimate the parameters of the conditional variance by using the standardized residuals derived from the first step. Here the loglikelihood function (L) for the bivariate model is given by
| A8 |
After the estimation of parameters using the QMLE, the time-varying conditional correlations are empirically calculated using the errors () obtained from each GARCH(1,1) model.
Footnotes
The first partial derivative of energy-EUA price correlation with respect to energy price is positive because of the parameter estimation result of .
This study focuses on the economics of ESG investments. However, as an important fact, there exist technical aspects of ESG investments in the background. For example, the technological aspects, such as environmental remediation, wastewater treatment, renewable and clean energy production, and the application of nanostructured materials for storage to address environmental issues, will have a significant impact on the promotion of ESG investments (e.g., Mahdavi et al., 2022; Hosseinzadeh et al., 2022; Tabatabaeinejad et al., 2021; Zinatloo-Ajabshir et al., 2021; Etemadi et al., 2021; Zinatloo-Ajabshir & Mousavi-Kamazani, 2021; Zinatloo-Ajabshir et al., 2019). Although these technological developments are not in the scope of this study, they are actually key factors that have an impact on ESG investments. The linkage between technological aspects and ESG investment is an important topic for future research.
The MSCI represents the MSCI World ESG Leaders Index. The S&P ESG and STOXX ESG are the S&P 500 ESG and STOXX Europe ESG Leaders Select 30 launched on 8 April 2019 and 14 October 2015, respectively. To secure a sufficient survey period, we employ this data period historically tracked by the S&P and Bloomberg.
The data for the OMX ESG cover from 30 December 2011 to 26 October 2018 due to the available data length.
In detail the MSCI takes positive expected returns from May 2009.
In detail the MSCI takes positive information ratios from May 2009.
The reason for S&P ESG’s negative expected return and negative information ratio, unlike the other ESG indexes, may come from the fact that it started trading later than the other indexes, on 8 April 2019, and was not yet established as an ESG index.
Define . Then,
represents the persistence of the conditional covariance matrix. Since the standardized shock is used for the calculation, is approximately considered as the conditional correlation persistence.
Publisher's Note
Springer Nature remains neutral with regard to jurisdictional claims in published maps and institutional affiliations.
References
- Ashwin Kumar NC, Smith C, Badis L, Wang N, Ambrosy P, Tavares R. ESG factors and risk-adjusted performance: A new quantitative model. Journal of Sustainable Finance and Investment. 2016;6:292–300. doi: 10.1080/20430795.2016.1234909. [DOI] [Google Scholar]
- Auer BR. Do socially responsible investment policies add or destroy European stock portfolio value? Journal of Business Ethics. 2016;135:381–397. doi: 10.1007/s10551-014-2454-7. [DOI] [Google Scholar]
- Auer BR, Schuhmacher F. Do socially (ir)responsible investments pay? New evidence from international ESG data. The Quarterly Review of Economics and Finance. 2016;59:51–62. doi: 10.1016/j.qref.2015.07.002. [DOI] [Google Scholar]
- Broadstock DC, Chan K, Cheng LTW, Wang X. The role of ESG performance during times of financial crisis: Evidence from COVID-19 in China. Finance Research Letters. 2021;38:101716. doi: 10.1016/j.frl.2020.101716. [DOI] [PMC free article] [PubMed] [Google Scholar]
- Derwall J, Guenster N, Bauer R, Koedijk K. The eco-efficiency premium puzzle. Financial Analysts Journal. 2005;61:51–63. doi: 10.2469/faj.v61.n2.2716. [DOI] [Google Scholar]
- Engle RF. Dynamic conditional correlation: A new simple class of multivariate GARCH models. Journal of Business and Economic Statistics. 2002;20:339–350. doi: 10.1198/073500102288618487. [DOI] [Google Scholar]
- Etemadi H, Afsharkia S, Zinatloo-Ajabshir S, Shokri E. Effect of alumina nanoparticles on the antifouling properties of polycarbonate-polyurethane blend ultrafiltration membrane for water treatment. Polymer Engineering and Science. 2021;61:2364–2375. doi: 10.1002/pen.25764. [DOI] [Google Scholar]
- Giese G, Nagy Z, Lee LE. Deconstructing ESG ratings performance: Risk and return for E, S, and G by time horizon, sector, and weighting, The. Journal of Portfolio Management. 2021;47:94–111. doi: 10.3905/jpm.2020.1.198. [DOI] [Google Scholar]
- Gupta K. Do economic and societal factors influence the financial performance of alternative energy firms? Energy Economics. 2017;65:172–182. doi: 10.1016/j.eneco.2017.05.004. [DOI] [Google Scholar]
- Henriques I, Sadorsky P. Can environmental sustainability be used to manage energy price risk? Energy Economics. 2010;32:1131–1138. doi: 10.1016/j.eneco.2010.01.006. [DOI] [Google Scholar]
- Hosseinzadeh G, Ghasemian N, Zinatloo-Ajabshir S. TiO2/graphene nanocomposite supported on clinoptilolite nanoplate and its enhanced visible light photocatalytic activity. Inorganic Chemistry Communications. 2022;136:109144. doi: 10.1016/j.inoche.2021.109144. [DOI] [Google Scholar]
- Kanamura T. Financial turmoil in carbon markets. The Journal of Alternative Investments. 2013;15:92–113. doi: 10.3905/jai.2012.15.3.092. [DOI] [Google Scholar]
- Kanamura T. A supply-and-demand based price model for financial assets. The Journal of Investment Strategies. 2015;4:19–53. doi: 10.21314/JOIS.2015.054. [DOI] [Google Scholar]
- Kanamura T. Role of carbon swap trading and energy prices in price correlations and volatilities between carbon markets. Energy Economics. 2016;54:204–212. doi: 10.1016/j.eneco.2015.10.016. [DOI] [Google Scholar]
- Kanamura T. Are green bonds environmentally friendly and good performing assets? Energy Economics. 2020;88:104767. doi: 10.1016/j.eneco.2020.104767. [DOI] [Google Scholar]
- Kanamura, T. (2022), A model of price correlations between clean energy indices and energy commodities, Journal of Sustainable Finance and Investment, 12, 319–359.
- Kappou K, Oikonomou I. Is there a gold social seal? The financial effects of additions to and deletions from social stock indices. Journal of Business Ethics. 2016;133:533–552. doi: 10.1007/s10551-014-2409-z. [DOI] [Google Scholar]
- Kempf A, Osthoff P. The effect of socially responsible investing on portfolio performance. European Financial Management. 2007;13:908–922. doi: 10.1111/j.1468-036X.2007.00402.x. [DOI] [Google Scholar]
- Mahdavi K, Zinatloo-Ajabshir S, Yousif QA, Salavati-Niasar M. Enhanced photocatalytic degradation of toxic contaminants using Dy 2 O 3-SiO 2 ceramic nanostructured materials fabricated by a new, simple and rapid sonochemical approach. Ultrason Sonochem. 2022;82:105892. doi: 10.1016/j.ultsonch.2021.105892. [DOI] [PMC free article] [PubMed] [Google Scholar]
- Mǎnescu C. Stock returns in relation to environmental, social and governance performance: Mispricing or compensation for risk? Sustainable Development. 2011;19:95–118. doi: 10.1002/sd.510. [DOI] [Google Scholar]
- Park JW, Lee CW. Performance of stock price with changes in SRI governance index. Corporate Social Responsibility and Environmental Management. 2018;25:1121–1129. doi: 10.1002/csr.1526. [DOI] [Google Scholar]
- Pedersen, L. H., Fitzgibbons, S., & Pomorski, L. (2021). Responsible investing: The ESG-efficient frontier, Journal of Financial Economics, 142, 572–592.
- Petitjean M. Eco-friendly policies and financial performance: Was the financial crisis a game changer for large US companies? Energy Economics. 2019;80:502–511. doi: 10.1016/j.eneco.2019.01.028. [DOI] [Google Scholar]
- PRI (2019). PRINCIPLES FOR RESPONSIBLE INVESTMENT: An investor initiative in partnership with UNEP Finance Initiative and the UN Global Compact, PRI, https://www.unpri.org/download?ac=6303.
- Sherwood MW, Pollard JL. The risk-adjusted return potential of integrating ESG strategies into emerging market equities. Journal of Sustainable Finance and Investment. 2018;8:26–44. doi: 10.1080/20430795.2017.1331118. [DOI] [Google Scholar]
- Sudha S. Risk-return and volatility analysis of sustainability index in India. Environment, Development and Sustainability. 2015;17:1329–1342. doi: 10.1007/s10668-014-9608-8. [DOI] [Google Scholar]
- Tabatabaeinejad SM, Zinatloo-Ajabshir S, Amiri O, Salavati-Niasari M. Magnetic Lu2Cu2O5-based ceramic nanostructured materials fabricated by a simple and green approach for an effective photocatalytic degradation of organic contamination. RSC Advances. 2021;11:40100–40111. doi: 10.1039/D1RA06101A. [DOI] [PMC free article] [PubMed] [Google Scholar]
- Ur Rehman R, Zhang J, Uppal J, Cullinan C, Akram Naseem M. Are environmental social governance equity indices a better choice for investors? An Asian perspective, Business Ethics. 2016;25:440–456. [Google Scholar]
- Weber O, Wei Rong A. The performance, volatility, persistence and downside risk characteristics of sustainable investments in emerging market. ACRN Oxford Journal of Finance and Risk Perspectives. 2016;5:1–12. [Google Scholar]
- Zinatloo-Ajabshir S, Baladi M, Salavati-Niasari M. Sono-synthesis of MnWO4 ceramic nanomaterials as highly efficient photocatalysts for the decomposition of toxic pollutants. Ceramics International. 2021;47:30178–30187. doi: 10.1016/j.ceramint.2021.07.197. [DOI] [Google Scholar]
- Zinatloo-Ajabshir S, Mousavi-Kamazani M. Recent advances in nanostructured Sn-Ln mixed-metal oxides as sunlight-activated nanophotocatalyst for high-efficient removal of environmental pollutants. Ceramics International. 2021;47:23702–23724. doi: 10.1016/j.ceramint.2021.05.155. [DOI] [Google Scholar]
- Zinatloo-Ajabshir S, Salehi Z, Amiri O, Salavati-Niasari M. Simple fabrication of Pr2Ce2O7 nanostructures via a new and eco-friendly route; a potential electrochemical hydrogen storage material. Journal of Alloys and Compounds. 2019;791:792–799. doi: 10.1016/j.jallcom.2019.04.005. [DOI] [Google Scholar]


