

Abstract
Environmental crises and resource depletion have adversely affected the food security around the world. Food security in the future can be guaranteed by sustainable agriculture that respects the environment. So, it is necessary to decrease the energy consumption of resources for agricultural productions to achieve the maximum sustainability. For agricultural productions, environmental and energy issues are completely interrelated, and a comprehensive evaluation is necessary to manage them in all productions. In this study, energy, environmental, and economic indicators in cantaloupe production were studied. The studied energy indices included energy efficiency, energy productivity, net energy gain, and energy intensity. Life cycle method based on ISO 14040 standard was used to evaluate the environmental impacts. This method includes goal statement, identification of inputs and outputs, and a system for assessing and interpreting the environmental impacts of various agricultural productions. Also, for economic analysis, the average prices of inputs and outputs and also net return (NR), gross return (GR), and profit-to-cost ratio were used. The results showed that nitrogen fertilizer (32.28%) and diesel fuel (30.52%) had the highest and cantaloupe seeds (0.39%), and oil consumption in tractor engines (0.43%) had the lowest share of energy consumption, respectively. Energy efficiency, energy productivity, energy intensity, and net energy gain were estimated 0.56, 0.70 kg MJ−1, 1.41 MJ kg−1, and − 11,775.86 MJ ha−1, respectively. The results of the present status of environmental impacts showed that the most effective factor in climate change is direct emissions from the diesel fuel. Also, indirect emissions from phosphorus and urea fertilizers had the highest effect on ecosystem quality. Various machine operations such as primary and secondary plowing, spraying, and transportation were the main causes of high diesel fuel consumption. Economic analysis showed that the profit-to-cost ratio and the productivity values were calculated about 1.6 and 7.27, respectively, which means that for every dollar spent in cantaloupe farms, it produced 7.27 kg of cantaloupe production. The variable costs were estimated at 1154.5 and fixed cost was 1487 $ha−1. Among the variable costs, transportation and fuel costs were the highest with 64.3%. Decreasing the diesel fuel consumption by using appropriate farm management methods and using the reduce tillage methods can play an effective role in reducing the consumption of this input and improving the energy, environmental, and economic indicators in cantaloupe production.
Keywords: Mechanization, Environmental effects, Sustainability, Human health
Introduction
Environmental crises and resource degradation have adversely affected the food security worldwide (Yadav et al. 2019), and achieving sustainability is a major challenge for researchers and policymakers in countries (Bilali et al. 2019; Lindgren et al. 2018). The growing population (9 billion to 2050) and increase in food demand are other challenges that humans have faced in the recent years (Buckwell et al. 2014; FAO 2017; Cobbenhagen et al. 2021). So, in order to provide food resources in the future, intensive and sufficient production of agricultural products with respect to resource sustainability is necessary (Gebbers and Adamchuk 2010). The latest researches have proved that if the necessary technologies and measures and proper management of inputs are not available and used, the environmental effects will be increased in the future (Springmann et al. 2018), but by using appropriate technologies and improving the management, it is possible to optimize the consumption of resources and achieve the maximum productivity (Taheri-Rad et al. 2017). Agricultural systems are one of the main sections that use a lot of energy. Optimal use of energy in agriculture can reduce the environmental effects and make the achievement of sustainable agriculture (Erdal et al. 2007). Recently, some researchers evaluated the different agricultural productions based on energy pattern and environmental effects.
For example, in a study by Mardini et al (2022) using data envelopment analysis, they evaluated the energy efficiency of rice production in Iran based on seven energy inputs. The total input energy was 34,423 MJ ha−1, and energy productivity, energy use efficiency, net energy, and specific energy were 0.14 kg ha−1, 3.58, 85665 MJ ha−1, and 6.88 MJ kg−1, respectively. They reported that half of farmers use inputs inefficiently (Mardani et al. 2022). In another study, optimization of energy consumption and greenhouse gas emission in wheat production was investigated. The results showed that the average input and output energies were 21.07 GJ ha−1 and 50.99 GJ ha−1 respectively. The amount of greenhouse gas emissions was also calculated as 592.12 kg CO2 eq ha−1 (Imran and Ozcatalbas 2021). In a study, Khanali et al. (2021) optimized the multi-objective pattern of energy consumption and environmental emissions in walnut production. In this study, environmental emissions were divided into two sections: on-orchard emissions (direct emissions) and off-orchard emissions (indirect publications). The results showed that on-orchard emissions including gasoline and diesel fuel had a major impact on environmental impact. Also, gasoline (0.14.80%) and diesel fuel (0.14.09%) had the highest input energy, respectively. The total input and output energy in the walnut production system was calculated at 2903.92 MJ ha−1 and 3340.33 MJ ha−1 respectively. The results showed that walnut production was energy inefficient because the energy ratio was estimated to be less than one (0.88%). The amount of environmental emissions in the category of climate change was calculated as 2364.60 kg CO2 eq per ton of walnuts. Primary tillage and diesel fuel consumption for the transport of farmyard manure and the use of old mechanisms in agricultural machinery were among the reasons for the excessive use of gasoline and diesel fuel (Khanali et al. 2021).
In addition to the need to manage energy consumption and environmental challenges, economic issues are another important issue in the agricultural sector that it is necessary to take the necessary measures to properly manage it (Buckwell et al. 2014; FAO 2017).
Ghisellini et al. (2016) stated that having sufficient tools and indicators to evaluate economic performance is strategic and important (Ghisellini, Cialani, and Ulgiati 2016). Economic evaluation in agriculture not only provides the necessary guidance to set goals, but also shows the regions that have developed in a country and allows comparisons between regions and countries (Elia et al., 2017). In addition, such assessments make it possible to identify problems at different stages of the production and to develop measures to correct inefficiencies and to identify strengths for reinforcement (Genovese et al. 2017; Vasa et al., 2017). At the same time, increasing demand and competition for limited resources will increase price volatility and destroy countries’ environment. Therefore, moving towards sustainable development and at the same time creating opportunities for economic growth requires a fundamental change in producer and consumer behavior (Maio et al. 2015).
Cantaloupe with the scientific name Cucumis melo L is one of the most important economically and commercially available fruits and products worldwide, which also has great phenotypic and genetic diversity (Pitrat 2013; Yilmaz et al., 2011). Cantaloupe is an important commercial garden product that exhibits a wide variety of phenotypes and genetics. Cantaloupe belongs to the Cucurbitaceae family with edible fruit and includes species such as Crenshaw, casaba, and honeydew.
Cantaloupe is a tasty, juicy fruit with nutritious and medicinal properties that is mostly produced in the tropics (de Figueiredo et al. 2013; Gómez-García et al. 2020).
Cantaloupe is a nutritious food, and its seeds are used to treat tuberculosis. It has a high level of potassium and is considered a diuretic due to its high-water content. Recent researches have shown that cantaloupe can reduce the risk of cancer. This product contains lycopene and antioxidants and is an excellent source of vitamin A, vitamin C, potassium, and magnesium (Mehra et al., 2015). In addition, it has beneficial medicinal properties such as analgesic, anti-inflammatory, anti-cancer, antimicrobial, and anti-diabetic (Milind and Kulwan 2011). According to the Food and Agriculture Organization of the United Nations (FAO) in 2019, the area under cultivation of this crop in the world was 1,039,691 h with a production of 27,501,360 tons. The largest producer of cantaloupe is China (13489373 tons) and then Turkey (1777059 tons) and Iran with 40,529 h under cultivation and production of 854,090 tons in 2019 (FAO 2019).
Considering that cantaloupe is one of the most important summer products in Iran, so far, the study of eco-energy and environmental evaluation of cantaloupe production has not been evaluated. Furthermore, today, the adverse effects of the use of pesticides on the health of agricultural products and environmental pollution have increasingly attracted the attention of all segments of society. For this purpose, this study was defined and conducted based on the needs in this field, taking into account the energy and environmental aspects. In addition to the energy and environmental aspects in the production of various agricultural products, having an economic justification in the production of a product is of very importance.
Given the role of economic issues in sustainable development, it is necessary to examine the economic justification for the production of each product in agriculture. The importance of this issue is further highlighted by the fact that even the degree of profitability of production varies from region to region depending on the spatial diversity and the amount of consumption inputs (Roberts et al. 2006).
The final results of this study can be used by all the farmers to reduce the energy and environmental effects of cantaloupe production. Evaluation of energy indicators with environmental impacts in the cantaloupe production process enables the country’s agricultural managers to make decisions in the context of water shortage crisis, drought, and climate change, relying on more accurate information on the development of summer vegetables. Based on the above literature, the purpose of this study was to evaluate the economic-energy and environmental impacts of cantaloupe production using the life cycle assessment method in Darrehshahr region (southwest of Iran). This crop is grown in this area in summer.
Materials and methods
Study region and data collection
This study was performed in Darhshahr town that is located in the south of Ilam province (Southwest of Iran). (Within 33′ 30° latitude and 48′ 0° longitude) (Amarilam, 2019). In this region, cantaloupe cultivation occurs in the summer. The required data related to all types of agricultural input and output parameters was randomly gathered from 40 cantaloupe producers via visiting the farms by using face to face questionnaires (Appendix Table 10) and an equation in (Cochran 1977) (Eq. 1)
| 1 |
Table 10.
Questionnaire

In Eq. (1), n is the statistical population of the farmers who raise barley in the area under study; t is the acceptable reliability coefficient which can be obtained from the student’s t-table assuming that the given feature is normally distributed. S2 estimates the variance of the feature studied in the population, d is the probable optimal accuracy (half the confidence interval), and n is the sample size (N = 100; t = 1.96; d = 0.05; S = 0.235). Figure 1 shows the process of cantaloupe production in the study area.
Fig. 1.

The process of cantaloupe production on the farm
Energy consumption and analysis method
In order to analyze the energy consumption, in the first step, the information about the inputs to produce 1 ha of cantaloupe (human power, machinery, fuel, chemical fertilizers, and pesticides) was collected. Then, energy coefficients were used to calculate the input and output energy content in the cantaloupe production process. The energy equivalent coefficients indicate the amounts of energy per unit input and output. A standard procedure was used to convert each agricultural input and output into energy equivalents. Table 1 is applied to turn all the input into energy equivalents.
Table 1.
Energy equivalent of inputs and output in cantaloupe production
| Item | Unit | Energy equivalent (MJ unit−1) |
Reference |
|---|---|---|---|
| A. Inputs | |||
| 1. Human labor | h | 1.96 | (Soltanali et al. 2016) |
| 2. Agricultural machinery | h | 62.7 | (Mohammadi et al. 2008) |
| 3. Diesel fuel | L | 56.31 | (Kaab et al. 2019) |
| 4. Chemical fertilizers | kg | ||
| Nitrogen (N) | kg | 66.14 | (Mostashari-Rad et al. 2019) |
| Phosphate (P2O5) | kg | 12.44 | (Mobtaker et al., 2012) |
| Potassium (K2O) | kg | 11.15 | (Unakıtan and Aydın 2018) |
| 5. Chemical toxins | L | ||
| Pesticide | L | 199 | (Gündoğmuş 2006) |
| Herbicide | L | 238 | (Gündoğmuş 2006) |
| Fungicide | L | 92 | (Gündoğmuş 2006) |
| 6. Transportation | h | 62.7 | (Banaeian and Namdari 2011) |
| 7. Electricity | Kwh | 11.93 | (Ozkan et al., 2004b) |
| 8. Water for irrigation | M3 | 1.03 | (Karimi et al. 2008) |
| 9. Seed | kg | 50 | (Ozkan et al. 2004b) |
| B. Output | |||
| Cantaloupe | kg | 0.8 | (Ozkan et al., 2004a) |
The energy equivalent of each input or output is calculated by multiplying the amount of each input or output by the appropriate energy equivalent coefficient.
The energy equivalent associated with labor varies considerably, depending on the approach chosen; it must be adapted to the actual living conditions in the target region (Moore 2010). In this study, the energy coefficient of 1.96 MJ h−1 was applied. It means only the muscle power is used in different field operations of crop production.
Also, in order to make an analysis of the embodied energy in the farm machinery, it was assumed that the embodied energy of tractors and agricultural machinery depreciated during their economic lifetime (Tabar et al., 2010); so, the embodied energy in machinery was calculated by multiplying the depreciated weights of machinery (kg ha−1) with their energy equivalents (MJ kg−1).
The energy of utilized inputs in cantaloupe production was measured according to 1 ha−1.
It is obvious that energy transformation factors vary by geography, but within a specific area, these parameters could be utilized to allow experts to make a meaningful comparative analysis of the use of energy in the production of different crops or commodities.
Based on quantity of applied agri-inputs and respective coefficients, agri-input energy was estimated and expressed in energy terms as MJ ha−1 (Table 2) (Singh et al. 2021; Taki et al. 2018).
Table 2.
Equations used in the estimation of input and output energy in cantaloupe production
| Inputs energy | Equation | Parameters |
|---|---|---|
| SE = Seed energy (MJ ha−1) |
SQ = Quantity of seed used (kg) SC = Energy conversion factor (MJ kg−1) A = Size of farm (ha) |
|
| FE = Diesel fuel energy (MJ ha−1) |
= Fuel consumed (L) fC = Energy conversion factor (MJ L−1) A = Size of farm (ha) |
|
| HE = Human labor energy (MJ ha−1) |
H = Working duration (h) lC = Energy conversion factor (MJ h−1) A = Size of farm (ha) |
|
| CFE = Chemical fertilizer energy (MJha−1) |
= Quantity of N, P2O5 and Mn (kg) NC = nutrient (N, ) energy conversion factor (MJ kg−1) A = Size of farm (ha) |
|
| AME = Agri − machinery energy input (MJ ha−1) |
CF = energy conversion factor (MJ kg−1) W = Weight of agri-machinery (kg) L = Useful life of agri-machinery (h) T = Working time (h) A = Size of farm (ha) |
|
| EE = electricity energy input (Kwh ha−1) |
g = gravitational acceleration (m/) ρ = Water density (kg/) H = Total dynamic well head (h) ɸ = Water flow rate ( ε1 = Pumping efficiency varying between 0.7 and 0.9 ε2= Efficiency of energy and power (0.18–0.22 for electro pump and 0.25–0.30 for diesel) |
Following the calculation of energy input and output equivalents, to determine the relationships between the output and input energies, energy indicators including energy ratio, energy productivity, specific energy and net energy gain were calculated (Table 3). These indicators represent the amount of energy efficiency in the manufacturing process (Omid et al. 2011). These indicators make it possible to study and compare systems in more detail (Ziaei et al., 2015).
Table 3.
Energy indices in cropping system of cantaloupe production
In this study, the energy content of inputs used in the cantaloupe production process was examined in four categories including direct, indirect, renewable, and non-renewable energy. Direct energy included human labor, diesel fuel, and water for irrigation. Indirect energy included seed energy, chemical fertilizers, animal manures, pesticides, and agricultural machinery. Also, energy from human labor, seed, chemical fertilizers, and water for irrigation were considered as renewable energy, and diesel fuel energy, pesticides, chemical fertilizers, and machinery were considered as non-renewable energy (Mobtaker et al. 2010; Nikkhah et al. 2014).
After calculating the energy consumption for each input, the total amounts of energy consumed and energy produced in 1 ha of cantaloupe production were presented based on the direct or indirect and renewable or non-renewable forms. The total input energy was 21,792.56 MJ.
Evaluation of environmental impacts by life cycle assessment method
Define the life cycle assessment and its phase
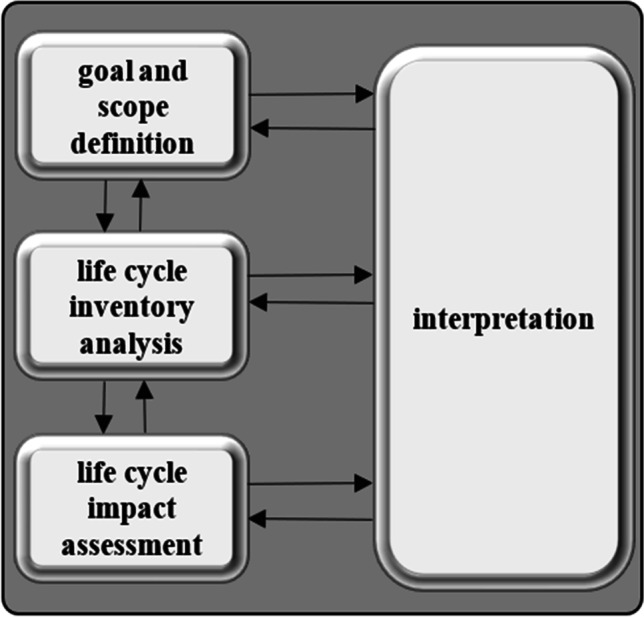
Life cycle assessment is an appropriate environmental management method that is usually used for evaluation of the environmental aspects of a product over its lifetime (Kouchaki-Penchah et al. 2016). Life cycle assessment includes goal statement, identification of inputs and outputs, and a system for assessing and interpreting the environmental impacts of various agricultural productions (Nabavi-Pelesaraei et al. 2019). Guidelines for assessing environmental impacts based on the life cycle assessment method are provided by ISO 14040 (ISO 2006). In this method, all the sources and inputs in the farm, as well as the amounts of emissions that are released into the environment using different types of inputs, are considered based on the reference unit (Guinée and Lindeijer 2002). The main phases of life cycle evaluation include goal and scope definition, life cycle inventory analysis (LCI), life cycle impact assessment (LCIA), and interpretation. Figure 2 shows all the steps of life cycle assessment based on ISO 14044 standards.
Fig. 2.
Life cycle assessment framework
With LCA method, the environmental effects of all inputs such as pesticides and fertilizers, human labor, agricultural machinery, electricity, and transportation in cantaloupe production were investigated.
The information needed to determine the type and amount of each input in the cantaloupe production process was collected using a questionnaire.
Emission equivalents of each input were obtained using the Ecoinvent database (EcoInvent version 3.8), table of values, and related relationships (Ecoinvent 2021).
The Ecoinvent database contains information on greenhouse gas emissions in the European region and is suitable for the Iranian region and has been used in numerous studies in Iran (Elhami et al. 2021).
Finally, impact assessment was performed using SIMAPRO software version 9.2.0.1.
The method used in SIMAPRO software was IMPACT 2002+, which allows the phase of characterization and classifying the impact category, identifying the impacts, normalization, and weighting. This method can analyze the environmental emissions under four endpoints and fifteen midpoints. Figure 3 shows the relationships between these points and the categories of influence in this method (Taki et al. 2018).
Fig. 3.

Distribution of 15 midpoints based on IMPACT 2002+ method
The boundary of the system used in this study was cradle to the gate which included from the phase of input to the farm to the time of cantaloupe harvest.
The process of transporting the product from the farm to the market was not examined in this study. Also, the human labor used on the farm was considered male only, because the necessary information about the working hours of women on the farm was not accurately stated by the farmers. A functional unit was considered to assess the environmental impact of 1 ton of cantaloupe. Figure 4 shows the boundary of the cantaloupe production system in this study.
Fig. 4.

The system boundary of cantaloupe production
The economic indicators
In order to specify the production expenditures in the process of cantaloupe production, the price of each input must be taken from regional markets. For this purpose, the market price for different key inputs was taken for calculation of gross returns (GRs). Furthermore, the costs of fertilizer, pesticides, manure, diesel fuel, human labor, and seed were considered as variable costs, and the costs of renting land and farm equipment were considered as fixed costs. For economic analysis, the average prices of inputs and outputs and also net return (NR), gross return (GR), and profit to cost ratio were used (Banaeian, Omid, and Ahmadi 2011).
Net returns (NRs) were calculated by deducting the total cost production (TCP) of cultivation from gross value of production (GVP) (NR = GVP − TCP) (Parihar et al. 2017). Gross return (GR) was calculated by deducting the gross value of production (GVP) from variable cost production (VCP) (GR = GVP − VCP).
The Benefit-Cost Ratio index could be determined by the division of the gross value of production (GVP) by the total production costs (TCPs) for 1 ton of produce. Also, all data were converted from Iranian Rial (IRR) to the US Dollar ($) using the exchange rate (200,000 Iranian Rials to US$1 at 2021–2021). Economic indicators were calculated based on the following equations (Table 4) (Banaeian and Namdari 2011; Ghorbani et al. 2011; Namdari 2011).
Table 4.
Economic indicators used to evaluate cantaloupe production
| GR = GVP − VCP (2) | |
| GVP = CY − CP (3) | |
| NR= GPV − TCP (4) | |
| TCP = VCP − FCP (5) | |
| B to C = (6) |
where GR is gross returns ($ ha−1), GVP is gross value of production ($ ha−1), VCP is variable cost production ($ ha−1), CY is crop yield (kg ha−1), CP is crop price ($ha−1), NR is net returns ($ha−1), TCP is total cost production ($ha−1), FCP is fixed cost production ($ha−1) and B to C is benefit to cost ratio.
Results and discussion
Analysis of energy flow and indicators
Identifying energy inputs and their contribution to product production is very important. In the first step of this section, the input and output energy pattern and also energy indicators were calculated. Table 5 shows the amount of inputs and output and the share of each them in cantaloupe production (all the calculations for 1 ha).
Table 5.
The input-output energy of cantaloupe production
| Item | Unit | Quantity per unit area (ha) | Total energy equivalent (MJ) |
|---|---|---|---|
| A. Inputs | |||
| Human labor | h | 832.98 | 1632.63 |
| Agricultural machinery | h | 27.61 | 1731.45 |
| Diesel fuel | L | 147.18 | 8287.42 |
| Lubricant oil | L | 2.42 | 115.54 |
| Nitrogen (N) | kg | 132.54 | 8766.03 |
| Phosphate (P2O5) | kg | 39.96 | 497.13 |
| Chemical toxins | L | 4.25 | 656.10 |
| Seed | kg | 106.25 | 106.25 |
| Electricity | kwh | 106.50 | 1270.55 |
| Water for irrigation | M3 | 4012.50 | 4092.75 |
| Total energy input | MJ ha−1 | – | 21792.56 |
| B. Output | |||
| Yield | kg | 19225 | 15380 |
The reference flow in this study was 1 ha, meaning that the collected data were done for 1 ha. Energy indices were also calculated and expressed on the basis of 1 ha. But the functional unit in the evaluation of environmental impacts was considered 1 ton of cantaloupe production.
The results of calculating energy indices showed that the total inputs and output energies are 27,155.86 and 15,380 MJha−1 respectively.
The results of Table 5 indicated that nitrogen fertilizer and diesel fuel with 8766.03 (32.28%) and 8287.42 MJ ha−1 (30.52%) had the highest share of input energy consumption followed by irrigation (15.07%), agricultural machinery (6.38%), human labor (6.01%), and electricity (4.68%) energies. Figure 5 shows the share of each input in cantaloupe production.
Fig. 5.

The share of each input in cantaloupe production
The highest energy consumption in the process of cantaloupe production was related to nitrogen fertilizer with an amount of 8766.03 MJ/ha−1. The prevailing belief of farmers about the role of chemical fertilizer such as nitrogen in increasing the crop production also led to the use of nitrogen fertilizer regardless of soil testing.
Increasing the consumption of nitrogen fertilizer more than the needs of farms, in addition to emitting greenhouse gases, causes pollution of water and soil resources. The results of research by Khanali et al. (2021) also showed that environmental emissions are more sensitive to changes in the use of chemical fertilizers (Khanali et al. 2021).
Due to the fact that the use of manure in agriculture has more effective nutritional effects compared to chemical fertilizers and their production requires much less energy, replacing chemical fertilizers with manure can reduce energy consumption and optimize consumption inputs and help in the production system (Nikkhah et al. 2014). In addition, increasing the efficiency of nitrogen consumption according to the needs of the product and choosing the right time for fertilization can reduce the amount of environmental impacts from them as well as nitrate leaching (Cambria and Pierangeli 2012).
After nitrogen, diesel fuel input with 8287.42 MJ/ha−1 had the highest energy consumption in the production process. Deep plowing and the use of tractors to transport inputs as well as farmers’ transportation to the farm were the main factors in increasing diesel fuel consumption in the production process. Also, various machine operations such as primary and secondary plowing, canalization, spraying, and transportation can increase the fuel consumption in cantaloupe production.
Ecologically, the consumption of fuel input is considered completely undesirable, because it increases the share of non-renewable energy in the production of agricultural products and reduces the sustainability of the ecosystem of agricultural systems. The results of researchers’ studies also showed that the energy from diesel fuel in the production of various agricultural products has the highest consumption of total input energy (Ozkan et al. 2004a), which was consistent with the results of the present study.
The results showed that in the process of cantaloupe production, an average of 832.98 man-hours per hectare was used. The most important reasons for the high use of human labor in the process of cantaloupe production was the lack of mechanization and manual operations, so that seed planting, irrigation, and harvest in the study area were done completely traditionally (manually). Among the various operations, the highest amount of human labor time was related to the presence of the farmer on the farm to care for the crop, such as harvesting and seeding operations. This showed that traditional operations played a significant role in increasing the input of human labor in cantaloupe production. Given the current state of the COVID-19 disease and more difficult access to human labor, this could pose problems for cantaloupe growers. In the study area, part of the labor required for the production process was provided by family members and the rest by rent.
Figure 6 classifies the total energy consumption in cantaloupe production into direct, indirect, renewable, and non-renewable. This figure showed that the share of direct, indirect, renewable, and non-renewable energies in cantaloupe production was 57%, 43%, 06%, and 94%, respectively.
Fig. 6.

The share of direct, indirect, renewable, and non-renewable energies in cantaloupe production
One of the main reasons for the difference between some non-renewable energy in this study and similar studies in Iran was the method of water supply for irrigation, in which electric pumps were used to supply water, while in other areas, gravity flow was used to supply water.
Table 6 reports the results of energy indices in cantaloupe production. Mousavi-Avval et al. (2011) in the study improving energy use efficiency of canola production using data envelopment analysis (DEA) approach reported the amount of non-renewable energy in canola production 94.8% and stated that canola production depends on the consumption of non-renewable energy sources (Mousavi-Avval et al. 2011).
Table 6.
Energy indices for cantaloupe production in Darrehshahr Region
| Item | Unit | Value |
|---|---|---|
| Energy use efficiency | – | 0.56 |
| Energy productivity | kg mJ−1 | 0.70 |
| Specific energy | MJ kg−1 | 1.41 |
| Net energy gain | MJ ha −1 | − 11,775.86 |
| Direct energy | MJ ha −1 | 15,398.89 |
| Indirect energy | MJ ha −1 | 11,756.96 |
| Renewable energy | MJ ha −1 | 1738.88 |
| Nonrenewable energy | MJ ha −1 | 25,416.98 |
According to the results of Table 6, energy use efficiency, energy productivity, specific energy, and net energy gain were calculated as 0.56, 0.70 kg MJ−1, 1.41 MJ kg−1, and − 11,755.86 MJ ha−1, respectively.
Analysis of cantaloupe production energy indices showed that cantaloupe production is not energy efficient because energy use efficiency (EUE) is less than 1 (0.56). When the energy efficiency is less than 1, this indicates that the total input energy is greater than the output energy. In other words, the process of cantaloupe production not only increases the total energy consumption in nature but also reduces the world’s energy resources (Khanali et al. 2021).
Low price of diesel fuel and the lack of incentive and punitive policies for producers with optimal consumption are the reasons for high consumption of diesel fuel in the process of production of cantaloupe and other agricultural products in Iran (Khanali et al. 2021). In general, in the production of cantaloupe, factors such as the use of deep plowing for primary tillage, the use of worn-out tractors, and the old mechanism in agricultural machinery led to the excessive use of diesel fuel. The small size of farms and the transportation of inputs by agricultural machinery on a small scale were other reasons for the reduced efficiency of the use of inputs in the study area. Furthermore, comparison of energy indicators of cantaloupe production system with other products shows the inefficiency of energy consumption in the production of this product, which further reveals the need for optimization. For example, energy use efficiency in watermelon production was reported to be 2.02 (Azizpanah et al., 2020), corn 2 (Boehmel et al., 2008), apple 1.16 (Rafiee et al., 2010), walnut 2.9 (Banaeian et al. 2011), and almond 2.02 (Baran et al. 2020).
Another study in California reported that the amount of energy consumed per 1 kg of cantaloupe was 910 kJ. The highest energy consumption in the production of a cantaloupe was related to consumables (fertilizer, pesticide, and seeds) (38%), irrigation (30.4%), and deisel fuel (25%), respectively. Primary and secondary tillage each accounted for 10% of the input energy in the production process. Given the importance of the contribution of fertilizer and fuel in the input energy, the researchers suggested that farmers should seek techniques to optimize the use of these two inputs (Alexandrou et al. 2009).
In the study of energy indices of paddy production in northern Iran, diesel fuel (44.34%) and nitrogen fertilizer (14.94%) had the highest and fungicide (0.52%) and herbicide (1.67%) the lowest input energy dedicated to themselves (Nabavi-Pelesaraei et al. 2018).
Evaluation and analysis of environmental indicators in cantaloupe production
Chemicals (fertilizers or pesticides) can be released into the environment (air, water, and soil) at the all stages of the life cycle of products, services, and systems. Emissions from various products may contain hundreds of chemicals that many of them have the potential to adversely affect the ecosystems. So, to assess the environmental impact of a crop production system, all aspects of system must be considered (Khoshnevisan et al. 2014). In this section, first, the amount of impact categories studied in cantaloupe production is presented, and in the next step, the effects of inputs consumption on four endpoint impact categories were evaluated.
In Simapro software for evaluating environmental impacts, it is possible to select the functional unit in kg and ton. In this study, environmental impacts in the cantaloupe production process were calculated in terms of 1 ton of production (Table 7).
Table 7.
Amount of input emissions for each impact category based on 1 ton of cantaloupe production
| Indicator | Unit | Value |
|---|---|---|
| Carcinogens | kg C2H3Cl eq | 2.65 |
| Non-carcinogens | kg C2H3Cl eq | 17.95 |
| Respiratory inorganics | kg PM2.5 eq | 41.76 |
| Ionizing radiation | Bq C-14 eq | 597.85 |
| Ozone layer depletion | kg CFC-11 eq | 0.00 |
| Respiratory organics | kg C2H4 eq | 0.06 |
| Aquatic ecotoxicity | kg TEG water | 21230.62 |
| Terrestrial ecotoxicity | kg TEG soil | 51373.52 |
| Terrestrial acid/nutrients | kg SO2 eq | 4.97 |
| Land occupation | m2org.arable | 1323.60 |
| Aquatic acidification | kg SO2 eq | 0.81 |
| Aquatic eutrophication | kg PO4 P-lim | 0.01 |
| Global warming | kg CO2 eq | 155.66 |
| Non-renewable energy | MJ primary | 1210.53 |
| Mineral extraction | MJ surplus | 3.70 |
Table 7 shows the number of environmental indicators that assessed cantaloupe production in tons. The amount of global warming potential (GWP) was estimated at 155.66 kg CO2 eq for the 1 ton cantaloupe production. Potential amount of carcinogenic and non-carcinogenic substances, ionizing radiation, aquatic acidification, and aquatic utrification were calculated about 2.65 kg C2H3Cl eq, 17.95 kg C2H3Cl eq, 597.85 Bq C-14 eq, 0.81 kg SO2 eq, and 0.01 kg PO4-lim respectively.
In a similar study, the amount of greenhouse gas emissions for apples, almonds, and pistachios reported 89, 2009, 2119 kg CO2 eq for the production of 1 ton (Bartzas et al., 2017).
The environmental impacts listed in Table 7 are due to the consumption of various inputs in the cantaloupe production process. Figure 7 shows the contribution of each input in the amount of environmental impacts in each impact category (unit in Table 7).
Fig. 7.

The effects of each input on total emissions of cantaloupe production
According to Fig. 7, emissions from direct consumption of inputs such as labor respiration and diesel fuel, on the farm, which are called direct emissions, had the most environmental effects in most categories of impact. Direct emissions and indirect greenhouse gases emissions from diesel fuel have the highest level of environmental pollution in the category of adverse effects on human health due to the emission of particulate matter (PM) and its compounds (NOx), SOx, NH3.
Diesel fuel and direct emissions from the use of input inputs also had the highest effects on soil acidification. Acidification describes a process in which the addition of nitrogen lowers soil pH, which can have a variety of direct and indirect effects on plant growth (Clark et al. 2013). During the acidification process, changes in soil pH decrease with the release of carbonates and open cations from the soil (Bowman et al. 2008).
Once these materials are depleted, the clay minerals in the soil can decompose, releasing toxic minerals into the soil (especially aluminum, Al3+).
In general, open acidification through adverse effects on plant rejuvenation, changing the concentration of toxic minerals (e.g., Al3+) or nutrients (e.g., N, P, base cations) in the soil, reduces biodiversity, because plants that can withstand acidic conditions are low (Horswill et al. 2008; Stevens et al. 2010).
Direct emissions are caused by the entry of environmental pollutants into the air, soil, and water, due to using of fertilizers and chemical toxins, diesel fuel, oil, and the respiration of labors. Ammonia causes acidification and atrification of sensitive ecosystems (Nemecek et al., 2011).
The oceans reduce climate change by absorbing carbon dioxide from fossil fuels in the atmosphere, land use change, and so on. It is estimated that during the period 2014–2005, about 26% of the total carbon dioxide emissions from human activities were absorbed by the oceans (Le Quéré et al. 2015). Acidification is the ongoing decrease in the pH value of the Earth’s oceans, caused by the uptake of carbon dioxide (CO2) from the atmosphere. The main cause of ocean acidification is the burning of fossil fuels. Most of the carbon dioxide released into the Earth’s atmosphere as a result of burning fossil fuels is eventually absorbed by the oceans, with potentially adverse consequences for marine life. When carbon dioxide dissolves in the ocean, it lowers the pH and makes the ocean more acidic. Most organisms are near the surface, where most pH changes are expected, but deep-sea organisms may also be sensitive to pH changes (Caldeira and Wickett 2003).
Menzi et al. (1997) reported that about 30% of nitrogen is lost in the form of ammonia, which can be reduced with appropriate measures into about 40–20% (Menzi et al. 1997). The amount of greenhouse gas emissions in the production of each ton of paddy 1166.09 kg of carbon dioxide has been reported (Nabavi-Pelesaraei et al. 2018).
Mousavi-Avval et al. (2017) studied the energy and economic analysis and evaluation of environmental life cycle (LCA) of rapeseed production in Mazandaran province (northern Iran) and stated that the use of chemical fertilizers, especially nitrogen, played a key role in environmental emissions (Mousavi-Avval et al. 2017).
They stated that chemical fertilizers are one of the main sources of energy consumption and environmental emissions, especially for the categories of global warming, acidification, and eutrophication. In another study, Hosseini-Fashami et al. (2019) pointed out that diesel fuel had the highest environmental emissions in strawberry production (Hosseini-Fashami et al. 2019).
Figure 8 shows the environmental effects of inputs in four endpoint impact categories including human health, ecosystem quality, global warming, and resources. It indicates that diesel fuel consumption has the greatest environmental impact in most categories. Table 8 shows the amount of environmental impacts for cantaloupe production.
Fig. 8.

Distribution of environmental impacts of inputs in 4 endpoints based on IMPACT 2002+ method for cantaloupe production
Table 8.
Amount of environmental impacts at 4 endpoints based on IMPACT 2002+ method for cantaloupe production
| Endpoint | Unit | Quantity |
|---|---|---|
| Human health | DALYa | 0.03 |
| Ecosystem quality | PDF*m2*yearb | 1855.33 |
| Climate change | kg*CO2*eq | 155.67 |
| Resources | MJ primary | 1214.24 |
aDALY: An emission of 1 is equivalent to lack of 1 life year of 1 personal, or 1 person suffers 4 years from an inability with a weight of 0.25.
bPDF*m2*year: An emission of 1 is equivalent to disappearing of all species from 1 m2 throughout 1 year, or vanishing of 10% of species from 1 m2 throughout 10 years, or vanishing of 10% of species from 10 m2 throughout 1 year.
In the final effect sections, direct emissions from inputs had the highest environmental impact on human health. Indirect emissions from phosphorus and urea fertilizers had the highest impact on ecosystem quality. The most effective factor in climate change was direct emissions from the consumption of inputs, and in the resource sector, diesel fuel had the greatest environmental impact. In the human health and ecosystem quality subjects, the total amount of environmental effects of cantaloupe production was 0.03 DALY and 1855.33 PDF*m2*year. In the category of climate change, the amount of emissions from cantaloupe production was 155.67 kg CO2 eq. The release of fossil fuel CO2 to the atmosphere by human activity has been implicated as the predominant cause of global climate change (Menon et al. 2007). Khanali et al. (2021) in environmental evaluation of walnut production reported the amount of emissions in categories of human health, ecosystem quality, climate change, and resources as 0.005 DALY, 35498.08 PDF*m2*year, 2364.60 kg* CO2*eq, and 28872.21 MJ primary, respectively (Khanali et al. 2021).
Economic analysis
Based on the results of Table 9, in cantaloupe production farms, the gross production value was 4236.1 $ha−1. The variable costs were estimated at 1154.5 $ha−1, and fixed cost was 1487 $ha−1.
Table 9.
Analysis of economic indicators for summer cantaloupe production
| Index | Unit | Amount |
|---|---|---|
| Yield | kg ha−1 | 19,255 |
| Average selling price | $kg−1 | 0.22 |
| Gross value | $ha−1 | 4236.1 |
| Variable costs | $ha−1 | 1154.5 |
| Fixed costs | $ha−1 | 1487 |
| The total cost of a production period | $ha−1 | 2641.5 |
| gross revenue | $ha−1 | 3081.6 |
| net income | $ha−1 | 1594.6 |
| Benefit to cost ratio | Dimensionless | 1.6 |
| Efficiency | kg$ | 7.28 |
Due to the high cost of renting agricultural land, the share of fixed costs was higher than variable costs.
Among the variable costs, transportation and fuel costs accounted for the largest amount with 64.3%.
The benefit to cost ratio and the productivity values were calculated about 1.6 and 7.28, respectively which means that for every dollar spent in summer cantaloupe fields, it produced 7.28 kg of cantaloupe production.
One of the main goals in agriculture is to achieve profitability, so the consumption of resources and waste should be reduced as much as possible, and the productivity rate and ultimately profitability should be increased.
Calegari et al. (2013) stated that the optimal use of pesticides is one of the effective ways to significantly reduce production costs (Calegari et al., 2013).
Conclusion
One of the main problems of the agricultural sector, especially in Iran, is the excessive consumption of various energies due to the relatively low prices of energy carriers. These studies can show the future state of the environment by assessment of the energy and determining its environmental consequences. Economic study along with energy and environmental analyzes can show the reader energy consumption with how much spending has caused environmental degradation. So, in this study, energy and environmental indicators for cantaloupe production system were evaluated. The results indicated that for cantaloupe production (reference flow: 1 ha), nitrogen fertilizer (32.28%), and diesel fuel (30.52%) had the highest and cantaloupe seeds (0.39%) and oil consumption (0.43%) had the lowest share in total energy consumption, respectively. Energy efficiency, energy productivity, specific energy, and net energy gain were estimated to be 0.56, 0.70 kg MJ−1, 1.41 MJ kg−1, and − 11,755.86 MJ ha−1, respectively. The share of direct, indirect, renewable, and non-renewable energy was 57%, 43%, 06%, and 94% of total energy consumption, respectively. The results showed that the inputs were not used optimally in the agricultural industry to produce cantaloupe. One of the main reasons for the low energy use efficiency in the study area was the high share of input energy in the production process. In order to achieve a sustainable system for agricultural production, the share of renewable energy use must be increased and non-renewable energy must be reduced. This can be achieved through careful management and planning on farms, such as reducing machine traffic on the farm and using organic fertilizers instead of chemical fertilizers. The life cycle analysis (LCA) showed that diesel fuel emissions had the highest effect on total environment. The global warming potential for cantaloupe production was also calculated to be 155.67 kg CO2eq, and the most effective factor in climate change was direct emission from the consumption of inputs and then diesel fuel. In cantaloupe farms, the gross production value was 4236.1 $ha−1, and the profit to cost ratio and productivity values were 1.6 and 7.28, respectively. Among the variable costs, transportation and fuel costs were the highest with 64.3%. Decreasing the diesel fuel consumption by using appropriate farm management methods and using the reduce tillage methods can play an effective role in reducing the consumption of this input and improving the energy, environmental, and economic indicators in cantaloupe production. The amount of energy consumption for production has an effective role in the economic profitability, because the costs related to energy inputs such as diesel fuel and chemical fertilizers account for a large part of production costs. On the other hand, more energy consumption due to the use of various inputs such as diesel fuel, chemical fertilizers, and herbicide causes environmental emissions. Therefore, it can be said that there is a relationship between input consumption, production costs, profitability, and environmental emissions. Hence, identifying critical points in the production process and reducing input energy both reduce costs and increase profitability and are effective in reducing environmental emissions.
Data availability
The datasets used and analyzed during the current study are available from the corresponding author on reasonable request
Nomenclature
- LCA
Life cycle assessment
- LCIA
Life cycle impact assessment
- GWP
Global warming potential
- FU
Functional unit
- EUE
Energy use efficiency
- EP
Energy productivity
- SE
Specific energy
- NEG
Net energy gain
- DE
Direct energy
- IDE
Indirect energy
- RE
Renewable energy
- NRE
Non-renewable energy
- FYM
Farmyard manure
- SE
Seed energy (MJ ha−1)
- FE
Diesel fuel energy (MJ ha−1)
- HE
Human labor energy (MJ ha−1)
- CFE
Chemical fertilizer energy (MJ ha−1)
- AME
Agri − machinery energy input (MJ ha−1)
- EE
Electricity energy input (Kwh ha−1)
- A
Size of farm (ha)
- L
Useful life of agri-machinery (h)
- ρ
Water density (kg m3)
- H
Total dynamic well head (h)
- ε1
Pumping efficiency varying
- FCP
Fixed cost production
- GVP
Gross value of production
- VCP
Variable costs production
- TCP
Total production costs
- GR
Gross returns
- NR
Net returns
- C
Cost
- B
Benefit
- B to C
Benefit-to-cost ratio
- IRR
Iranian Rial
- $
US dollar
- DALY
Disability-adjusted life years
Potentially disappeared fraction of species
- SQ
Quantity of seed used (kg ha−1)
Energy conversion factor (M)
- FC
Fuel consumed (L)
- fC
Energy conversion factor (MJ L−1)
- H
Working duration (h)
- lC
Energy conversion factor (MJ h−1)
- W
Weight of agri-machinery (kg)
- T
Working time (h)
- g
Gravitational acceleration (m S2)
- ɸ
Water flow rate (m3 h−1)
- ε2
Efficiency of energy and power
Appendix
Author contribution
Amir Azizpanah: supervising, conceptualization; Rostam Fathi: methodology, software, investigation, writing—original draft; Morteza Taki: writing—review and editing, visualization
Funding
This study was supported by the Agricultural Sciences and Natural Resources University of Khuzestan and University of Ilam, Iran. The authors received support from the universities.
Declarations
Ethics approval and consent to participate
Not applicable in this section.
Consent for publication
Not applicable in this section.
Conflict of interest
The authors declare no competing interests.
Footnotes
Publisher’s note
Springer Nature remains neutral with regard to jurisdictional claims in published maps and institutional affiliations.
References
- Alexandrou A, Vyrlas P, Adhikari D, Goorahoo D (2009) Energy inputs for cantaloupe production in San Joaquin Valley, California. Agric Eng Int: CIGR J 11
- Amarilam (2019) Management and Planning Organization of Ilam Province, Deputy of Statistics and Information, Statistical Yearbook of 1398. Land, Climate. 2019 25. Retrieved (http://www.amarilam.ir/SalnamehAmari.aspx)
- Azizpanah A, Fathi R, S. yousefenejad. Evaluation of economic indices, energy and GHG emissions in watermelon production (case study: Ilam Province) J Crop Prod. 2020;13(2):37–50. [Google Scholar]
- Banaeian N, Namdari M. Effect of ownership on energy use efficiency in watermelon farms–a data envelopment analysis approach. International Journal of Renewable Energy Research. 2011;1(3):75–82. [Google Scholar]
- Banaeian N, Omid M, Ahmadi H. Energy and economic analysis of greenhouse strawberry production in Tehran Province of Iran. Energy Convers Manage. 2011;52(2):1020–1025. doi: 10.1016/j.enconman.2010.08.030. [DOI] [Google Scholar]
- Baran MF, Eren O, Gökdoğan O, Oğuz HI. Determination of energy efficiency and greenhouse gas (GHG) emissions in organic almond production in Turkey. Erwerbs-Obstbau 2020 62:3. 2020;62(3):341–346. doi: 10.1007/S10341-020-00507-9. [DOI] [Google Scholar]
- Bartzas G, Vamvuka D, Komnitsas K. Comparative life cycle assessment of pistachio, almond and apple production. Information Processing in Agriculture. 2017;4(3):188–198. doi: 10.1016/j.inpa.2017.04.001. [DOI] [Google Scholar]
- Tabar B, Iman AK, Rafiee S. Energy balance in Iran’s agronomy (1990-2006) Renew Sustain Energy Rev. 2010;14(2):849–855. doi: 10.1016/j.rser.2009.10.024. [DOI] [Google Scholar]
- El Bilali H, Callenius C, Strassner C, Probst L. Food and nutrition security and sustainability transitions in food systems. Food and Energy Security. 2019;8(2):e00154. doi: 10.1002/FES3.154. [DOI] [Google Scholar]
- Boehmel C, Lewandowski I, Claupein W. Comparing annual and perennial energy cropping systems with different management intensities. Agric Syst. 2008;96(1–3):224–236. doi: 10.1016/J.AGSY.2007.08.004. [DOI] [Google Scholar]
- Bowman WD, Cleveland CC, Halada Ĺ, Hreško J, Baron JS. Negative impact of nitrogen deposition on soil buffering capacity. Nat Geosci. 2008;1(11):767–770. doi: 10.1038/ngeo339. [DOI] [Google Scholar]
- Buckwell A, Uhre AN, Williams A, Polakova J, Blum WEH, Schiefer J, Lair GJ, Heissenhuber A, Sciebl P, Kramer C, Haber W(2014) Sustainable intensification of european agriculture a review sponsored by the RISE Foundation. Center for European Policy Studies (CEPS)
- Caldeira K, Wickett ME. Anthropogenic carbon and ocean pH. Nature. 2003;425(6956):365. doi: 10.1038/425365a. [DOI] [PubMed] [Google Scholar]
- Calegari F, Tassi D, Vincini M. Economic and environmental benefits of using a spray control system for the distribution of pesticides. Journal of Agricultural Engineering. 2013;44(2s):163–165. doi: 10.4081/jae.2013.s2.e32. [DOI] [Google Scholar]
- Cambria D, Pierangeli D. Application of a life cycle assessment to walnut tree (Juglans regia L.) high quality wood production: a case study in Southern Italy. J Clean Prod. 2012;23(1):37–46. doi: 10.1016/j.jclepro.2011.10.031. [DOI] [Google Scholar]
- Clark CM, Bai Y, Bowman WD, Cowles JM, Fenn ME, Gilliam FS, Phoenix GK, Siddique I, Stevens CJ, Sverdrup HU (2013) Nitrogen deposition and terrestrial biodiversity. In: Levin SA (Ed.) Encyclopedia of Biodiversity, Second Edition, Volume 5, Waltham, MA: Academic Press. Pp. 519-536 5:519–36
- Cobbenhagen ATJR, Antunes DJ, van de Molengraft MJG, Heemels WPMH (2021) Opportunities for control engineering in arable precision agriculture. Ann Rev Contr 51(August 2020):47–55. 10.1016/J.ARCONTROL.2021.01.001
- Cochran WG. The Estimation of Sample Size. Sampl Tech. 1977;3:72–90. [Google Scholar]
- Ebrahimi S, Gundoshmian TM, Abdi R, Jadidi MR. Energy efficiency improvement for broiler production using non-parametric techniques. Agric Eng Int CIGR J. 2016;18(2):121–132. [Google Scholar]
- Ecoinvent (2021) https://www.Ecoinvent.org/Database/Ecoinvent-371/Ecoinvent-371.Html. 2021
- Elhami B, Raini MGN, Taki M, Marzban A, Heidarisoltanabadi M. Analysis and comparison of energy-economic-environmental cycle in two cultivation methods (seeding and transplanting) for onion production (case study: central parts of Iran) Renewable Energy. 2021;178:875–890. doi: 10.1016/j.renene.2021.06.117. [DOI] [Google Scholar]
- Elia V, Gnoni MG, Tornese F. Measuring circular economy strategies through index methods: a critical analysis. J Clean Prod. 2017;142:2741–2751. doi: 10.1016/J.JCLEPRO.2016.10.196. [DOI] [Google Scholar]
- Erdal G, Esengün K, Erdal H, Gündüz O. Energy use and economical analysis of sugar beet production in Tokat Province of Turkey. Energy. 2007;32(1):35–41. doi: 10.1016/j.energy.2006.01.007. [DOI] [Google Scholar]
- FAO (2017) The future of food and agriculture. trends and challenges. Rome: Food and Agriculture Organization of the United Nations. Available Online:<http://www.Fao.org/3/a-I6583e.Pdff>, Last Access 15th of February 2019
- FAO (2019) FAOSTAT.2021 (Melons, Other (Inc.Cantaloupes)). Retrieved (http://www.fao.org/faostat/en/#data/QCL)
- de Figueiredo M, Brito C, Kroeze C, Potting J, da Silva V, Barros FA, de Aragão S, Gondim RS, de Lima T, Santos, and Imke J. M. de Boer. The carbon footprint of exported Brazilian yellow melon. J Clean Prod. 2013;47:404–414. doi: 10.1016/j.jclepro.2012.09.015. [DOI] [Google Scholar]
- Gebbers R, Adamchuk VI. Precision agriculture and food security. Science. 2010;327(5967):828–831. doi: 10.1126/science.1183899. [DOI] [PubMed] [Google Scholar]
- Genovese A, Acquaye AA, Figueroa A, Lenn SC, Koh. Sustainable supply chain management and the transition towards a circular economy: evidence and some applications. Omega. 2017;66:344–357. doi: 10.1016/J.OMEGA.2015.05.015. [DOI] [Google Scholar]
- Ghisellini P, Cialani C, Ulgiati S. A review on circular economy: the expected transition to a balanced interplay of environmental and economic systems. J Clean Prod. 2016;114:11–32. doi: 10.1016/j.jclepro.2015.09.007. [DOI] [Google Scholar]
- Ghorbani R, Mondani F, Amirmoradi S, Feizi H, Khorramdel S, Teimouri M, Sanjani S, Anvarkhah S, Aghel H. A case study of energy use and economical analysis of irrigated and dryland wheat production systems. Appl Energy. 2011;88(1):283–288. doi: 10.1016/j.apenergy.2010.04.028. [DOI] [Google Scholar]
- Gómez-García R, Campos DA, Aguilar CN, Madureira AR, Pintado M. Valorization of melon fruit (Cucumis melo L.) by-products: phytochemical and biofunctional properties with emphasis on recent trends and advances. Trends Food Sci Technol. 2020;99:507–519. doi: 10.1016/j.tifs.2020.03.033. [DOI] [Google Scholar]
- Guinée JB, Lindeijer E (eds) (2002) Handbook on life cycle assessment: Operational guide to the ISO standards. Kluwer Academic Publishers. New York, Boston, Dordrecht, London, Moscow. Khordad 10, 1381 AP - Nature Springer Science & Business Media 7:692
- Gündoğmuş E. Energy use on organic farming: a comparative analysis on organic versus conventional apricot production on small holdings in Turkey. Energy Convers Manage. 2006;47(18–19):3351–3359. doi: 10.1016/j.enconman.2006.01.001. [DOI] [Google Scholar]
- Heidari MD, Omid M, Akram A. Energy efficiency and econometric analysis of broiler production farms. Energy. 2011;36(11):6536–6541. doi: 10.1016/j.energy.2011.09.011. [DOI] [Google Scholar]
- Horswill P, O’Sullivan O, Phoenix GK, Lee JA, Leake JR. Base cation depletion, eutrophication and acidification of species-rich grasslands in response to long-term simulated nitrogen deposition. Environ Pollut. 2008;155(2):336–349. doi: 10.1016/j.envpol.2007.11.006. [DOI] [PubMed] [Google Scholar]
- Hosseini-Fashami F, Motevali A, Nabavi-Pelesaraei A, Hashemi SJ, Kwok-wing wing Chau. Energy-life cycle assessment on applying solar technologies for greenhouse strawberry production. Renew Sustain Energy Rev. 2019;116(May):109411. doi: 10.1016/j.rser.2019.109411. [DOI] [Google Scholar]
- Imran M, Ozcatalbas O. Optimization of energy consumption and its effect on the energy use efficiency and greenhouse gas emissions of wheat production in Turkey. Discover Sustainability. 2021;2(1):1–13. doi: 10.1007/s43621-021-00035-w. [DOI] [Google Scholar]
- ISO (2006) 14040 International Standard. Environmental Management–Life Cycle Assessment–Principles and Framework, International Organization for Standardization, Geneva, Switzerland. 14040 International Standard. Environmental Management–Life Cycle Assessment–Principles and Framework, International Organization for Standardization, Geneva, Switzerland
- Kaab A, Sharifi M, Mobli H, Nabavi-Pelesaraei A, Chau K-w. Combined life cycle assessment and artificial intelligence for prediction of output energy and environmental impacts of sugarcane production. Sci Total Environ. 2019;664:1005–1019. doi: 10.1016/j.scitotenv.2019.02.004. [DOI] [PubMed] [Google Scholar]
- Karimi M, RajabiPour A, Tabatabaeefar A, Borghei A. Energy analysis of sugarcane production in plant farms a case study in Debel Khazai Agro-Industry in Iran. American-Eurasian Journal of Agricultural and Environmental Science. 2008;4(2):165–171. [Google Scholar]
- Khanali M, Akram A, Behzadi J, Mostashari-Rad F, Saber Z, Chau K-w, Nabavi-Pelesaraei A. Multi-objective optimization of energy use and environmental emissions for walnut production using imperialist competitive algorithm. Appl Energy. 2021;284:116342. doi: 10.1016/j.apenergy.2020.116342. [DOI] [Google Scholar]
- Khoshnevisan B, Rafiee S, Omid M, Mousazadeh H, Clark S. Environmental impact assessment of tomato and cucumber cultivation in greenhouses using life cycle assessment and adaptive neuro-fuzzy inference system. J Clean Prod. 2014;73:183–192. doi: 10.1016/J.JCLEPRO.2013.09.057. [DOI] [Google Scholar]
- Kouchaki-Penchah H, Sharifi M, Mousazadeh H, Zarea-Hosseinabadi H, Nabavi-Pelesaraei A (2016) Gate to gate life cycle assessment of flat pressed particleboard production in Islamic Republic of Iran. J Clean Prod 112(June 2020):343–50. 10.1016/j.jclepro.2015.07.056
- Lindgren E, Harris F, Dangour AD, Gasparatos A, Hiramatsu M, Javadi F, Loken B, Murakami T, Scheelbeek P, Haines A. Sustainable food systems—a health perspective. Sustain Sci. 2018;13(6):1505–1517. doi: 10.1007/s11625-018-0586-x. [DOI] [PMC free article] [PubMed] [Google Scholar]
- Di Maio F, Rem PC, Di Maio F, Rem PC. A robust indicator for promoting circular economy through recycling. J Environ Prot. 2015;10:1095–1104. doi: 10.4236/JEP.2015.610096. [DOI] [Google Scholar]
- Mardani M, Sabouni M, Azadi H, Taki M. Rice production energy efficiency evaluation in North of Iran; application of robust data envelopment analysis. Cleaner Engineering and Technology. 2022;6:100356. doi: 10.1016/j.clet.2021.100356. [DOI] [Google Scholar]
- Mehra M, Pasricha V, Gupta RK (2015) Estimation of nutritional, phytochemical and antioxidant activity of seeds of musk melon (Cucumis melo) and water melon (Citrullus lanatus) and nutritional analysis of their respective oils. J Pharmacog Phytochem 3(6): 98
- Menon S, Denman KL, Brasseur G, Chidthaisong A, Ciais P, Cox PM, Dickinson RE, Hauglustaine D, Heinze C, Holland E (2007) Couplings between changes in the climate system and biogeochemistry. Lawrence Berkeley National Lab.(LBNL), Berkeley, CA (United States)
- Menzi H, Kaufmann R, Frick R, Kaufmann R (1997) Ammoniak-Emissionen in Der Schweiz: Ausmass Und Technische Beurteilung Des Reduktionspotentials. Eidgenössische Forschungsanstalt für Agrarökologie und Landbau
- Milind P, Kulwan S. Musk melon is eat-must melon musk melon is eat-must melon Parle Milind * and Singh Kulwant. International Research Journal of Pharmacy. 2011;8(June):52–57. [Google Scholar]
- Mobtaker HG, Akram A, Keyhani A. Energy use and sensitivity analysis of energy inputs for alfalfa production in Iran. Energy Sustain Dev. 2012;16(1):84–89. doi: 10.1016/j.esd.2011.10.009. [DOI] [Google Scholar]
- Mobtaker HG, Keyhani A, Mohammadi A, Rafiee S, Akram A. Sensitivity analysis of energy inputs for barley production in Hamedan Province of Iran. Agr Ecosyst Environ. 2010;137(3–4):367–372. doi: 10.1016/j.agee.2010.03.011. [DOI] [Google Scholar]
- Mohammadi A, Tabatabaeefar A, Shahin S, Rafiee S, Keyhani A. Energy use and economical analysis of potato production in Iran a case study: Ardabil Province. Energy Convers Manage. 2008;49(12):3566–3570. doi: 10.1016/j.enconman.2008.07.003. [DOI] [Google Scholar]
- Moore SR. Energy efficiency in small-scale biointensive organic onion production in Pennsylvania, USA. Renewable Agric Food Syst. 2010;25(3):181–188. doi: 10.1017/S1742170510000098. [DOI] [Google Scholar]
- Mostashari-Rad F, Nabavi-Pelesaraei A, Soheilifard F, Hosseini-Fashami F, Kwok-wing wing Chau. Energy optimization and greenhouse gas emissions mitigation for agricultural and horticultural systems in Northern Iran. Energy. 2019;186:115845. doi: 10.1016/J.ENERGY.2019.07.175. [DOI] [Google Scholar]
- Mousavi-Avval SH, Rafiee S, Jafari A, Mohammadi A. Improving energy use efficiency of canola production using data envelopment analysis (DEA) Approach. Energy. 2011;36(5):2765–2772. doi: 10.1016/J.ENERGY.2011.02.016. [DOI] [PubMed] [Google Scholar]
- Mousavi-Avval SH, Rafiee S, Sharifi M, Hosseinpour S, Shah A. Combined application of life cycle assessment and adaptive neuro-fuzzy inference system for modeling energy and environmental emissions of oilseed production. Renew Sustain Energy Rev. 2017;78:807–820. doi: 10.1016/J.RSER.2017.05.002. [DOI] [Google Scholar]
- Nabavi-Pelesaraei A, Rafiee S, Mohtasebi SS, Hosseinzadeh-Bandbafha H, Chau K-w. Assessment of optimized pattern in milling factories of rice production based on energy, environmental and economic objectives. Energy. 2019;169:1259–1273. doi: 10.1016/j.energy.2018.12.106. [DOI] [Google Scholar]
- Nabavi-Pelesaraei A, Rafiee S, Mohtasebi SS, Hosseinzadeh-Bandbafha H, Kwok wing Chau. Integration of artificial intelligence methods and life cycle assessment to predict energy output and environmental impacts of paddy production. Sci Total Environ. 2018;631–632:1279–1294. doi: 10.1016/j.scitotenv.2018.03.088. [DOI] [PubMed] [Google Scholar]
- Namdari M. Energy use and cost analysis of watermelon production under different farming technologies in Iran. Int J Environ Sci. 2011;1(6):1144–1153. [Google Scholar]
- Nemecek T, Schnetzer-Agroscope Reckenholz-Tänikon J and Undefined 2011. n.d. Methods of assessment of direct field emissions for LCIs of agricultural production systems. Researchgate.Net.
- Nikkhah A, Emadi B, Shabanian F, Hamzeh-Kalkenari H (2014) Energy sensitivity analysis and greenhouse gas emissions for tea production in Guilan Province. Iran, Agroecology 6(3). (In Persian)
- Omid M, Ghojabeige F, Delshad M, Ahmadi H. Energy use pattern and benchmarking of selected greenhouses in Iran using data envelopment analysis. Energy Convers Manage. 2011;52(1):153–162. doi: 10.1016/j.enconman.2010.06.054. [DOI] [Google Scholar]
- Ozkan B, Akcaoz H, Fert C. Energy input-output analysis in Turkish agriculture. Renewable Energy. 2004;29(1):39–51. doi: 10.1016/S0960-1481(03)00135-6. [DOI] [Google Scholar]
- Ozkan B, Akcaoz H, Fert C. Energy input–output analysis in Turkish agriculture. Renewable Energy. 2004;29(1):39–51. doi: 10.1016/S0960-1481(03)00135-6. [DOI] [Google Scholar]
- Parihar CM, Jat SL, Singh AK, Majumdar K, Jat ML, Saharawat YS, Pradhan S, Kuri BR. Bio-energy , water-use ef fi ciency and economics of maize-wheat-mungbean system under precision-conservation agriculture in semi-arid agro-ecosystem. Energy. 2017;119:245–256. doi: 10.1016/j.energy.2016.12.068. [DOI] [Google Scholar]
- Pitrat M (2013) Phenotypic diversity in wild and cultivated melons (Cucumis melo). Plant Biotechnol 30(3):273–278
- Le Quéré C, Moriarty R, Andrew RM, Peters GP, Ciais P, Friedlingstein P, Jones SD, Sitch S, Tans P, Arneth A. Global Carbon Budget 2014. Earth Syst. Sci. Data. 2015;7:47–85. doi: 10.5194/essd-7-47-2015. [DOI] [Google Scholar]
- Rafiee S, Avval SHM, Mohammadi A. Modeling and sensitivity analysis of energy inputs for apple production in Iran. Energy. 2010;35(8):3301–3306. doi: 10.1016/J.ENERGY.2010.04.015. [DOI] [Google Scholar]
- Roberts RK, English BC, Larson JA, Cochran RL, Goodman WR, Larkin SL, Marra M, Martin SW, P KWaxton, Shurley WD (2006) Use of precision farming technologies by cotton farmers in eleven states. in Proceedings of the Beltwide Cotton Conferences [San Antonio, TX, 3-6 January 2006], ed., D. Richter. Memphis, TN: National Cotton Council of America
- Singh P, Gurdeep Singh GPS, Sodhi, and Sandeep Sharma. Energy optimization in wheat establishment following rice residue management with happy seeder technology for reduced carbon footprints in North-Western India. Energy. 2021;230:120680. doi: 10.1016/j.energy.2021.120680. [DOI] [Google Scholar]
- Soltanali H, Emadi B, Rohani A, Khojastehpour M, Nikkhah A. Optimization of energy consumption in milk production units through integration of data envelopment analysis approach and sensitivity analysis. Iranian Journal of Applied Animal Science. 2016;6(1):15–23. [Google Scholar]
- Springmann M, Clark M, Mason-D’Croz D, Wiebe K, Bodirsky BL, Lassaletta L, De Vries W, Vermeulen SJ, Herrero M, Carlson KM. Options for keeping the food system within environmental limits. Nature. 2018;562(7728):519–525. doi: 10.1038/s41586-018-0594-0. [DOI] [PubMed] [Google Scholar]
- Stevens CJ, Ken Thompson J, Grime P, Long CJ, Gowing DJG. Contribution of acidification and eutrophication to declines in species richness of calcifuge grasslands along a gradient of atmospheric nitrogen deposition. Funct Ecol. 2010;24(2):478–484. doi: 10.1111/j.1365-2435.2009.01663.x. [DOI] [Google Scholar]
- Taheri-Rad A, Khojastehpour M, Rohani A, Khoramdel S, Nikkhah A. Energy flow modeling and predicting the yield of Iranian paddy cultivars using artificial neural networks. Energy. 2017;135:405–412. doi: 10.1016/j.energy.2017.06.089. [DOI] [Google Scholar]
- Taki M, Soheili-Fard F, Rohani A, Chen G, Yildizhan H. Life cycle assessment to compare the environmental impacts of different wheat production systems. J Clean Prod. 2018;197:195–207. doi: 10.1016/J.JCLEPRO.2018.06.173. [DOI] [Google Scholar]
- Unakıtan G, Aydın B. A comparison of energy use efficiency and economic analysis of wheat and sunflower production in Turkey: a case study in thrace region. Energy. 2018;149:279–285. doi: 10.1016/j.energy.2018.02.033. [DOI] [Google Scholar]
- Vasa L, Angeloska A, Trendov NM. Comparative analysis of circular agriculture development in selected western balkan countries based on sustainable performance indicators. Economic Annals-XXI. 2017;168(11–12):44–47. doi: 10.21003/EA.V168-09. [DOI] [Google Scholar]
- Yadav GS, Das A, Lal R, Babu S, Datta M, Meena RS, Patil SB, Singh R. Impact of no-till and mulching on soil carbon sequestration under rice (Oryza sativa L.)-rapeseed (Brassica campestris L. var. rapeseed) cropping system in Hilly agro-ecosystem of the Eastern Himalayas, India. Agr Ecosyst Environ. 2019;275:81–92. doi: 10.1016/J.AGEE.2019.02.001. [DOI] [Google Scholar]
- Yilmaz H, Demircan V, Kurtluk S. An economic analysis of open-field melon (Cucumis melo L.) production in Cankiri Province of Turkey. Bulgarian J Agr Sci. 2011;17(4):484–490. [Google Scholar]
- Ziaei SM, Mazloumzadeh SM, Jabbary M. A comparison of energy use and productivity of wheat and barley (case study) J Saudi Soc Agric Sci. 2015;14(1):19–25. [Google Scholar]