Abstract
Previous studies showed that lanthanum hydroxide (LH) has a therapeutic effect on chronic kidney disease (CKD) and vascular calcification, which suggests that it might have clinical value. However, the target and mechanism of action of LH are unclear. Metabolomics of clinical samples can be used to predict the mechanism of drug action. In this study, metabolomic profiles in patients with end-stage renal disease (ESRD) were used to screen related signaling pathways, and we verified the influence of LH on the ROS-PI3K-AKT-mTOR-HIF-1α signaling pathway by western blotting and quantitative real-time RT-qPCR in vivo and in vitro. We found that ROS and SLC16A10 genes were activated in patients with ESRD. The SLC16A10 gene is associated with six significant metabolites (L-cysteine, L-cystine, L-isoleucine, L-arginine, L-aspartic acid, and L-phenylalanine) and the PI3K-AKT signaling pathway. The results showed that LH inhibits the ESRD process and its cardiovascular complications by inhibiting the ROS-PI3K-AKT-mTOR-HIF-1α signaling pathway. Collectively, LH may be a candidate phosphorus binder for the treatment of vascular calcification in ESRD.
Keywords: metabolomics, end-stage renal disease, lanthanum hydroxide, vascular calcification, signal pathway
1. Introduction
Drug discovery is a long and complex process, and elucidation of the mechanism of action of drugs is difficult and costly.1) Most financial losses caused by the failure of new drugs result from the inability to accurately predict the pharmacological mechanism of candidate drugs. Many methods are available to study the mechanism of action of drugs, such as serum pharmacology to determine the structure of drugs and targets.2) However, these traditional strategies have limitations; they mainly focus on epigenetic and morphological observations or only identify the molecular targets.3) To fully understand the wide range of molecular interactions and their effects required for drug action, novel methods are being developed. Omics is an emerging discipline that has increasingly gained interest in research on drug mechanism of action. This discipline includes metabolomics, genomics, and proteomics. Metabolomics is the comprehensive study of biochemical substances (or small molecules) present in the metabolome, cells, tissues, and body fluids. Metabolic research is a rapidly developing field worldwide that will have a profound impact on medical practice. Metabolic profiles provide a quantifiable reading of the biochemical state, ranging from normal physiology to various pathophysiologic states. A series of pioneering studies on human samples, supported by the National Institutes of Health through the Pharmacometabonomics Research Network, provided new ideas for the elucidation and discovery of many drug mechanisms.4) Thereafter, the Pharmacometabonomics Research Network has become a complementary and powerful tool in precision medicine.5) Given the long-term research on the metabolism of kidney diseases, metabolomics have quickly been incorporated into nephrology research. In recent years, metabolomics is increasingly being used in research and has proved to be useful for studying the mechanism of action of existing drugs and candidates in the drug discovery stage.6,7)
CKD is characterized by gradual loss of kidney function, decrease in glomerular filtration rate, increase in serum urea and creatinine levels, and abnormal phosphorus excretion. According to the National Kidney Foundation, 26 million adults suffer from CKD in the United States and millions of adults are at an increased risk of CKD.8) Epidemiological studies have shown that the prevalence of CKD in Chinese adults is 10.8%, representing 120 million patients.9) As of 2017, there are about 1 million patients with CKD in China, associated with a huge economic and health burden on affected families and the entirety of society. There has also been a significant increase in the global mortality rate caused by CKD; CKD was the 27th most common cause of death in 1990 and became the 18th most common in 2010.10) At present, more than 2 million people worldwide receive dialysis or have undergone kidney transplantation, accounting for only 10% of the population who need these treatments.11) Vascular calcification is a common complication of CKD. The histological anatomy and degree of vascular calcification predict subsequent vascular death in patients with CKD.12) In patients with CKD, a variety of factors, such as oxidative stress, dyslipidemia, elevated glycation end products, and mineral metabolism disorders, cause vascular calcification.13) Intimal and medial calcification increases the risk of cardiovascular death in patients with ESRD by 10–100 times.14) Therefore, the development of new drugs for treatment of CKD is essential. Previous studies reported that LH has a high affinity with phosphate, and it is easy to form a lanthanum phosphate complex with phosphate. Lanthanum phosphate has low water solubility, does not pass easily through the intestinal wall, and can be excreted through the feces, thereby achieving the effect of alleviating renal failure in CKD rat models, decreasing serum phosphorus levels, and inhibiting vascular calcification, equivalent to the effects of lanthanum carbonate (LC).15,16) LC has been used clinically and is regarded as safe,17) so it is suggested that the safety of LH may also be good. Because of the long-term administration in our experiment, there is a very small amount of absorption of lanthanum ions. In order to more accurately determine the toxicity of lanthanum ions, we conducted a safety evaluation experiment. We found no obvious toxicity for the time being when the dose of LH was more than 50 times the current dose.
Previous studies on CKD and vascular calcification mainly focused on rat models. However, there are interspecies differences in ESRD models; therefore, it is difficult to accurately predict the mechanism of action of candidate drugs in humans, which explains why many drugs fail in clinical research. In the current study, we used comprehensive omics of humans and animals to analyze the metabolites and signal pathways in humans. We also evaluated the possible in vivo and in vitro signal pathways in rats and human vascular smooth muscle cells (VSMCs). The use of clinical omics research can improve the success rate of pre-clinical drug research and development. Clinical omics research also provides a basis for LH to be studied as a candidate phosphorus binder.
2. Materials and methods
2.1. Liquid chromatography-tandem mass spectrometry analysis of serum metabolites.
Samples were incubated for 10 min with pre-chilled methanol at a ratio of 1:3 to precipitate proteins. The samples were centrifuged at 12000 r/min for 15 min at 4 ℃. The supernatants were analyzed using Dionex UltiMate3000 Rapid Resolution Liquid Chromatography and Q Exactive mass spectrum (Thermo Fisher Scientific, Sunnyvale, CA, U.S.A.). The analytes were separated in an XBridge BEH Amide chromatographic column (2.1 × 100 mm; Waters Co., Milford, MA, U.S.A.) using 0.1% formic acid and acetonitrile as mobile phases A and B, respectively. The flow rate was set at 0.4 mL/min, with an injection volume of 5 µL and column temperature of 25 ℃. The mass spectrum signals were obtained using the positive and negative ion scanning modes.
2.2. Participants.
This study included 36 adult patients with CKD and 30 healthy controls for experiments performed between June 2020 and December 2020 at Ordos Central Hospital in Inner Mongolia. The patients had CKD stage 3–5 based on estimated glomerular filtration rate for at least 3 months. Patients were excluded if they had acute kidney injury, liver disease, gastrointestinal pathology, active vasculitis, cancer, need for dialysis, need for immunosuppressive or chemotherapy, or history of kidney transplant. Blood samples were obtained after an overnight fast, and the serum was separated and stored at −80 ℃ for subsequent studies. The research strictly complied with the ISHLT ethics statement, and was approved by the Ethics Committee of Ordos Central Hospital (no. ZXYY2021014), and all patients provided informed consent.
2.3. Animals and experimental protocol.
Six-week-old male Wistar rats, weighing 200 ± 20 g, were purchased from Weitong Lihua Biotechnology Co., Ltd. (Beijing, SCXK 2016-0006, China). The rats were placed in a specific IVC cage free of pathogens. The rats were maintained in a 12-h light/dark cycle, ambient temperature of 21–22 ℃, and humidity of 40–50%. The rats were allowed to eat and drink freely. Before the start of the experiment, rats were adaptively reared for 1 week. The animal experiments were approved by the Medical Ethics Committee of Inner Mongolia Medical University (no. YKD2019019).
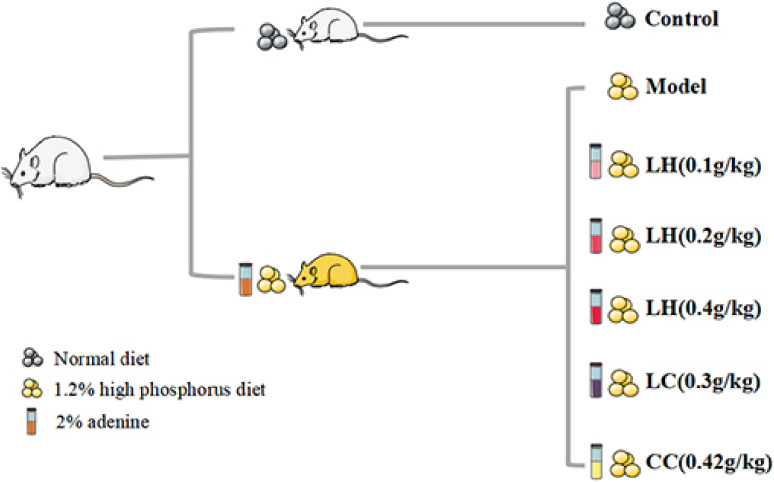
Figure 1 depicts the process of establishing the CKD animal model. For 1–2 weeks, rats in the model group were administered 2% adenine suspension daily (dose: 200 mg/kg). Within 3–4 weeks, all model rats were administered the same concentration of adenine suspension on alternate days, according to their body weight. After the adenine suspension was administered for 4 weeks, blood was collected from the fundus venous plexus of the rats to measure creatinine and urea nitrogen levels to determine the successful establishment of the CKD model. Then, we evaluated the serum phosphorus level in CKD rats to determine the progression of vascular calcification. The rats were randomly assigned to seven groups (15 rats per group): control group, model group, LH group (0.1 g/kg), LH group (0.2 g/kg), LH group (0.4 g/kg), LC group (0.3 g/kg), and calcium carbonic acid group (CC, 0.42 g/kg). During the experiment, rats in the control group were fed ordinary food, and those in the CKD group were fed 1.2% high-phosphorus food (Beijing Keao Xieli Feed Co., Ltd. 2021070107, Beijing, China). Serum biochemical indicators, such as creatinine (Scr), blood urea nitrogen (BUN), phosphorus, superoxide dismutase (SOD), malondialdehyde (MDA), parathyroid hormone (PTH), fibroblast growth factor 23 (FGF23), and lipid peroxide (LPO) were measured after 4 and 8 weeks of treatment. At the end of 12 weeks, all animals were sacrificed. Blood samples were collected from the abdominal aorta, and serum was separated and stored at −80 ℃. We collected the aorta from each animal by quick freezing in liquid nitrogen for subsequent western blotting. The right kidney and thoracic aorta samples were immersed in 10% phosphate buffered formalin for histological analysis.
Figure 1.
(Color online) Flow chart for establishment of the chronic kidney disease (CKD) rat model. For 1–2 weeks, CKD rats were administered 2% adenine suspension by gavage daily at a dose of 200 mg/kg. In 3–4 weeks, all model rats were administered adenine suspension on alternate days. After 4 weeks, each administration group was administered lanthanum hydroxide (LH, 0.1 g/kg, 0.2 g/kg, or 0.4 g/kg), lanthanum carbonate (LC, 0.3 g/kg), or calcium carbonic acid (CC, 0.42 g/kg) by intragastric administration for 8 weeks.
2.4. Cell culture.
Human aortic VSMCs (item #C740; Shanghai Yubo Biotechnology Co., Ltd., Shanghai, China) were cultured in growth medium containing 10% fetal bovine serum in high-sugar Dulbecco’s modified Eagle’s medium and 1% penicillin-streptomycin. After cell fusion, cells at passage 5–7 were used for experiments. The medium was changed every 2 days, and 3 mmol/L of Pi (consisting of Na2HPO4/NaH2PO4, pH = 7.4) was added for 6 days to induce cell calcification. On the 4th day, different concentrations of lanthanum chloride (LaCl3) were added for continuous culture for 2 days. Rats were divided into control group (normal phosphorus, 1 mmol/L phosphate buffer), control + LaCl3 (60 µmol/L) group, model group (3 mmol/L phosphate buffer), model + NaCl group (180 µmol/L), LaCl3 low-dose group (15 µmol/L), LaCl3 medium-dose group (30 µmol/L), LaCl3 high-dose group (60 µmol/L), sodium pyrophosphate tetrabasic decahydrate (PPI) group (100 µmol/L), normal phosphorus + dimethyloxallyl glycine (DMOG, 100 µmol/L) + LaCl3 (60 µmol/L) group, and normal phosphorus + platelet-derived growth factor-BB (PDGF-BB, 20 ng/mL) + LaCl3 (60 µmol/L) group.
2.5. Reagents and antibodies.
We used the following reagents and antibodies: LH (CAS: 2020-9, laboratory synthesis, purity: 96%), LC (CAS: 54451-24-0, Sigma-Aldrich, St Louis, MO, U.S.A.), CC (CAS: 471-34-1, Sigma-Aldrich), adenine (CAS: 73-24-5, Sigma-Aldrich), uratan (DC08BA0021, Shenggong Bioengineering [Shanghai] Co., Ltd., Shanghai, China), phosphorus test kit (C006-1-1, Nanjing Jiancheng Institute of Biological Engineering), calcium determination kit (C004-2-1, Nanjing Jiancheng Institute of Biological Engineering), creatinine determination kit (C011-2-1, Nanjing Jiancheng Institute of Biological Engineering), urea nitrogen determination kit (C013-2-1, Nanjing Jiancheng Institute of Biological Engineering), FGF23 ELSA Kit (F4444-B, Shanghai Yili Biotechnology Co., Ltd., Shanghai, China), PTH ELSA Kit (F4378-B, Shanghai Yili Biotechnology Co., Ltd.), SOD determination kit (A001-1, Nanjing Jiancheng Institute of Biological Engineering), MDA determination kit (A003-1, Nanjing Jiancheng Institute of Biological Engineering), LPO ELISA Kit (F4454-B, Shanghai Yili Biotechnology Co., Ltd.), LaCl3 (Sigma-Aldrich, Cat. #298182), PPI (Sigma-Aldrich, Cat. #S6422), PDGF-BB (MedChemExpress, Monmouth Junction, NJ, U.S.A., Cat. #HY-P7055), DMOG (Sigma-Aldrich, Cat. #400091), phosphatase inhibitor (P1082, Beyotime, Shanghai, China), RIPA lysis solution (P0013B, Beyotime), monoclonal mouse anti-SM22α (SC-53932, Santa Cruz Biotechnology, Santa Cruz, CA, U.S.A.), monoclonal mouse anti-BMP-2/4 antibody (SC-137087, Santa Cruz Biotechnology), monoclonal mouse anti-RUNX2 antibody (SC-101145, Santa Cruz Biotechnology), polyclonal rabbit anti-β-Actin (K101527P, Solarbio, Beijing, China), polyclonal rabbit anti-phospho-PI3K (ab182651, Abcam, Cambridge, U.K.), monoclonal rabbit anti-PI3K (4257S, Cell Signaling Technology, Beverly, MA, U.S.A.), monoclonal rabbit anti-phospho-AKT antibody (13038S, Cell Signaling Technology), monoclonal rabbit anti-AKT (4685S, Cell Signaling Technology), monoclonal rabbit anti-phospho-mTOR (5536S, Cell Signaling Technology), monoclonal rabbit anti-mTOR (2983S, Cell Signaling Technology), monoclonal mouse anti-HIF-1α (ab1, Abcam), polyclonal rabbit anti-Lamin A/C (10298-1-AP, Protein Tech Group, Wuhan, China), marker (Thermo Fisher Scientific), nuclear protein extraction kit (78833, Thermo Fisher Scientific NE-PER Nuclear and Cytoplasmic Extraction Reagents), and BCA protein concentration determination kit (P0012, Beyotime).
2.6. Histologic analyses.
For histological analysis, we fixed rat kidney and thoracic aorta tissues from each group with 10% phosphate-buffered formalin, then embedded them in paraffin, and stained with hematoxylin and eosin (H&E), Masson stain, Von Kossa stain, and Verhoeff Van Gieson (EVG) stain in accordance with the method described below (Wuhan Saville Biotechnology Co., Ltd., Wuhan, China). Images were analyzed using a Leica DM2000 microscope (Germany Leica Microsystems, Wetzlar, Germany).
2.6.1. H&E staining.
Rat kidney and thoracic aorta tissues were fixed in 4% paraformaldehyde for 24 h, and then the kidney was cut in the salt coronal plane whereas the thoracic aorta was cut in the sagittal plane. The tissues were placed in a dehydration box with an alcohol gradient. After removal from the dehydration box, tissues were placed in a shelf for embedding with melted wax. Then, the tissues were cooled at −20 ℃. After the wax block was solidified, it was removed from the shelf and trimmed. The block was cut into 4-micron slices using a microtome. The slices were floated on warm water at 40 ℃ to flatten the tissues. Then, the tissues were removed with a glass slide and baked in an oven at 60 ℃.
After dehydration, the slices were stained with an aqueous solution of hematoxylin for several minutes. The slices then underwent color separation in acid water and ammonia water, each for a few seconds. Then, they were rinsed with running water for 1 h and distilled water was added over 2–3 min. The slices were dehydrated with 70% and 90% alcohol for 10 min each. Then, alcohol eosin staining solution was added for 2–3 min, and the samples were dehydrated and made transparent using xylene. The transparent sections were mounted with gum and covered with a cover glass for sealing. After the gum had slightly dried, a sticker was attached and microscopic examination was performed. Microscopic images were acquired and analyzed.
2.6.2. Masson staining.
The nucleus was stained with Weigert hematoxylin solution for 5–10 min, washed thoroughly with Masson Ponceau acid red for 5–10 min, immersed in 2% glacial acetic acid aqueous solution for 2–3 min, differentiated with 1% phosphomolybdic acid aqueous solution for 3–5 min, and stained with aniline blue or light green solution for 5 min. Then, the sample was soaked in 0.2% glacial acetic acid aqueous solution for a period and the slides were mounted with natural resin glue. Microscopic images were collected and analyzed.
2.6.3. Von Kossa staining.
The blood vessel slices were removed from the glass slides, treated with APES, and dried. Toluene was used twice for dewaxing for 15 min each time, and 100%, 95%, and 80% gradient ethanol was added. The slices were washed with water, and 1 mL of 1% silver nitrate solution was added. The solution was irradiated under sunlight for 30 min. The silver nitrate solution was removed and 1 mL of 5% sodium thiosulfate solution was added and left for 1 min. Basic fuchsin was used for backstaining for 10 seconds, followed by dehydration twice with 95% and absolute ethanol. The xylene was transparent after dehydration; the slides were mounted with natural resin glue, and microscopic images were obtained and analyzed.
The cells were washed with phosphate-buffered saline (PBS; pH: 7.2–7.4) and fixed with 4% paraformaldehyde for 30 min at 37 ℃. The cells were washed again with PBS, treated with reagent A in the Von Kossa staining kit (Cat. #G1452, Solarbio), and irradiated with ultraviolet light until the calcium phosphate crystals turned black. The cells were washed three times with PBS to remove excess dye. After 2 min of sodium thiosulfate treatment, the cells were washed three times with PBS. The cells were stained with eosin staining solution (Cat. #G1120, Solarbio) and observed using a microscope.
2.6.4. EVG staining.
The blood vessel slices were stained with EVG dye solution (hematoxylin, ferric chloride, and iodine solution = 5:2:2) for 30 min and rinsed with tap water. The slices were differentiated with ferric chloride differentiation solution and rinsed with tap water. This process was repeated to control the degree of differentiation visible using a microscope and continued until the elastic fibers appeared purple-black and the background was almost colorless. EVG dye solution was used for 1–3 min for counterstaining. The slices were rapidly washed and dehydrated with absolute ethanol. The film was sealed with neutral gum for 1–5 min and examined using a microscope. Microscopic images were acquired and analyzed.
2.7. Alizarin red staining.
The cells were washed with PBS (pH: 7.2–7.4) and fixed with 4% paraformaldehyde for 30 min at 37 ℃. The cells were washed again with PBS and stained with 1% Alizarin red stain (pH: 4.2, Cat. #G1452, Solarbio) for 5 min. The cells were washed with PBS until the staining solution was washed out. The culture plate was analyzed using a microscope and photomicrographs were obtained. Then, calcium crystals were dissolved with 10% acetic acid staining solution. A multi-detection microplate reader (Dynex, Lincoln, U.K.) was used to measure the absorbance at 420 nm to quantify the calcification.
2.8. Western blotting analysis.
A cocktail of complete phosphatase and protease inhibitors (Thermo Fisher Scientific) were used to lyse rat aortic tissue and VSMCs. Then, the lysate was centrifuged for 10 min at 12000 rpm and 4 ℃, and the supernatant was collected. The supernatant was mixed with Roti-Load1 buffer (Carl Roth GmbH, Karlsruhe, Germany) at a ratio of 4:1. The proteins were boiled at 100 ℃ for 10 min. Then, we separated the same volume of protein by SDS-PAGE and transferred to a PVDF membrane. Thereafter, we incubated the proteins overnight at 4 ℃ with the primary antibody. The primary antibodies used were as follows: monoclonal rabbit anti-PI3K (1:1000), monoclonal mouse anti-BMP-2/4 (1:600), monoclonal mouse anti-RUNX2 (1:600), polyclonal rabbit anti-phospho-PI3K (1:500), monoclonal rabbit anti-phospho-AKT antibody (1:1000), monoclonal rabbit anti-AKT (1:1000), monoclonal rabbit anti-phospho-mTOR (1:1000), monoclonal rabbit anti-mTOR (1:1000), polyclonal rabbit anti-β-actin (1:2000), and anti-HIF-1 antibody (1:5000). Afterward, the proteins were incubated with the secondary antibody for 1 h at room temperature in the dark, using secondary anti-rabbit IgG (H+L) (1:5000) or anti-mouse IgG (H+L) (1:5000). Finally, we used stripping buffer (Thermo Fisher Scientific) to strip the membrane at room temperature for 40 min for subsequent testing and loading control. The protein bands were exposed on an Odyssey CLX dual-color infrared laser imaging system (LI-COR) and quantified using ImageJ software. The data were standardized at the ratio of total protein/β-actin or nuclear protein/lamin A or phosphorylation/total protein.
2.9. Quantitative real-time RT-qPCR.
The RNA Simple Total RNA Kit (Cat. #DP419, Tiangen Biochemical Technology [Beijing] Co., Ltd.) was used to extract total RNA from cells and thoracic aortic tissues, in accordance with the manufacturer’s instructions. Then, a reverse transcription kit (AceqPCRRT kit, Cat. #FSQ-101, ToYoBo Life Science, Osaka, Japan) was used to synthesize cDNA using the extracted total RNA. In addition, a Piko real-time PCR detection system (Thermo Fisher Scientific) was used for quantitative analysis of RT-qPCR. The primer sequences are shown in Table S1.
The melting curve of the PCR product was used to prove its specificity, and each procedure was repeated twice. The relative mRNA expression fold change was measured by the 2−ΔΔCt method, using GAPDH as the internal control.
2.10. Statistical analysis.
Data are expressed as mean ± standard error of the mean (SEM). Statistical analysis and drawing were performed using GraphPad Prism 8.0 (GraphPad Software, San Diego, CA, U.S.A.). Using one-way analysis of variance, data were compared between the groups. A difference of p < 0.05 was considered to be statistically significant. Partial least squares discriminant analysis (PLS-DA) of SIMCA-P+13.0 (Umetrics, AB, Umeå, Sweden) and principal component analysis (PCA) were used to assess normalized gas chromatography-mass spectrometry data. Variable influence on projection values were used to identify significant variables with values >1.0 and p < 0.05. The significant variables were used to identify the spectral peaks. Student’s t-test was used to analyze differences between the groups. The taxonomic rank differential between groups was determined using Student’s t-test (v3.1.2; R programming language). Correlations between genera abundance and rat behavior were assessed using Spearman’s correlation coefficients (R language). p < 0.05 was considered statistically significant.
3. Results
3.1. LH delays the process of renal failure and protects residual renal function in CKD rats.
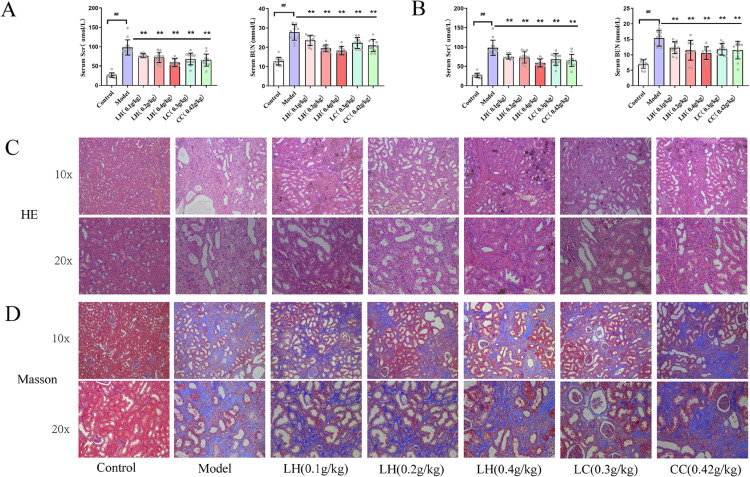
After administering adenine gavage for 4 weeks, we measured serum creatinine and BUN levels in CKD rats. We found significant elevation of serum BUN and creatinine levels in the model group compared with the control group (Table S2) (p < 0.01). This suggested that CKD hyperphosphatemia rat model was successfully established. Compared with the CKD group, the creatinine and BUN levels of LH-treated group were significantly reduced (p < 0.01 and p < 0.05, respectively) after LH administration for 4 weeks. After LH was administered for 8 weeks, serum creatinine levels in the LH groups (0.1 g/kg, 0.2 g/kg, and 0.4 g/kg) decreased by approximately 24%, 26%, and 40%, respectively, compared with the model group; BUN was reduced by approximately 20%, 25%, and 31%, respectively. These reductions were observed in a dose-dependent manner (Figs. 2A and 2B). Furthermore, we also observed these protective effects in renal pathological examination after LH treatment. Compared with the control group, CKD rat specimens exhibited many cystic dilated tubules, adenine crystallization, protein casts, and glomerular necrosis (Fig. 2C). We also observed that the renal mesenchyme was accompanied by a large number of inflammatory cell infiltrates and mesenchymal fibrosis in the model group (Fig. 2D). However, after LH treatment, renal injury, cystic dilatation of renal tubules, and inflammatory cell infiltration were improved. The LC group and CC group also showed a protective effect on the kidneys. Notably, compared with the LC group and CC group, there was more significant improvement in kidney pathology in the LH (0.4 g/kg), suggesting that LH has greater therapeutic effects. However, there was no significant improvement in renal fibrosis in any group (Fig. 2D).
Figure 2.
(Color online) Renal function of rats with chronic kidney disease (CKD) after treatment with lanthanum hydroxide. (A) Drug treatment after 4 weeks. (B) Drug treatment after 8 weeks. (a) Serum Scr. (b) Serum BUN ( , compared to the control group, ##p < 0.01; compared to the model group, **p < 0.01, n = 15). (C) Hematoxylin and eosin (HE) staining of kidney tissues of CKD rats after 8 weeks of drug treatment (n = 5). (D) Masson staining of kidney tissue of CKD rats after 8 weeks of drug treatment (n = 5).
3.2. LH inhibits vascular calcification induced by CKD.
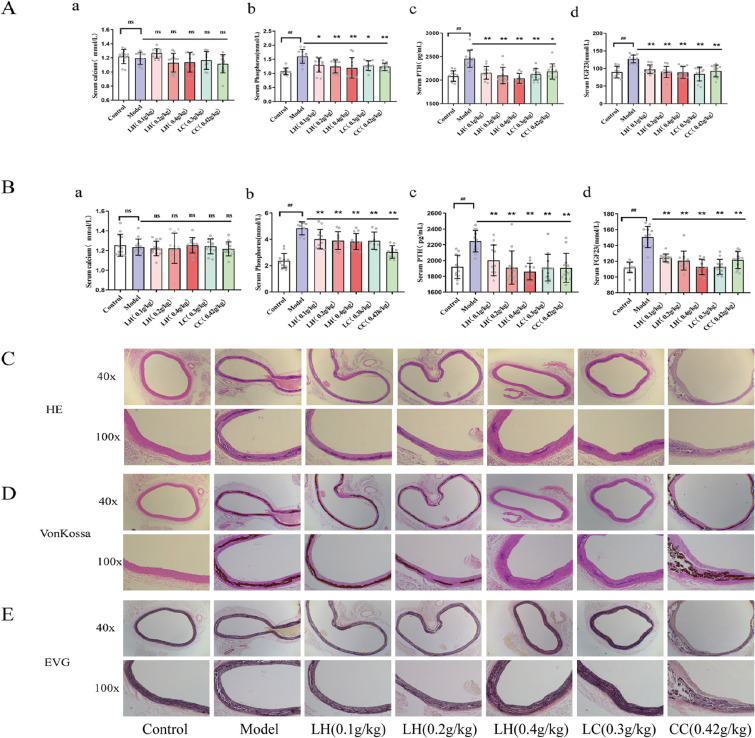
Vascular calcification in ESRD is the main cause of the high mortality in these patients. In patients with ESRD, phosphate excretion is impaired and the phosphorus load in the body is exacerbated, eventually leading to vascular calcification. Therefore, we measured serum phosphorus and calcium levels after LH treatment and found that compared with CKD rats, serum phosphorus in the LH-treated group was significantly lower (p < 0.01). After 8 weeks of treatment, serum phosphorus levels were reduced by approximately 28%, 34%, and 47% in the LH groups (0.1 g/kg, 0.2 g/kg, and 0.4 g/kg, respectively) compared with the model group. These effects were seen in a dose-dependent manner. Unfortunately, no significant difference was observed in the serum calcium levels after treatment for 4 and 8 weeks. We also measured the levels of FGF23 and PTH after administering the adenine diet (Table S2). We found that compared with the model group, PTH levels in the model group were significantly increased by approximately 40%. Additionally, the FGF23 level was also significantly increased (p < 0.01). After 8 weeks of treatment, compared with the control group, PTH level in the LH groups (0.1 g/kg, 0.2 g/kg, and 0.4 g/kg) was significantly reduced by approximately 11%, 15%, and 17%, respectively. Additionally, the FGF23 level was significantly reduced by approximately 17%, 20%, and 25%, respectively, in a dose-dependent manner. This suggested that LH decreases serum PTH and FGF23 levels, regulating calcium and phosphorus metabolism and reducing the incidence of cardiovascular diseases (Fig. 3).
Figure 3.
(Color online) Effect of lanthanum hydroxide treatment on vascular calcification in rats with chronic kidney disease (CKD) and hyperphosphatemia. (A) Drug treatment after 4 weeks. (B) Drug treatment after 8 weeks. (a) Serum calcium. (b) Serum phosphorus. (c) Serum PTH. (d) Serum FGF23 ( , compared with the control group, ##p < 0.01; compared with the model group, *p < 0.05, **p < 0.01, n = 15, ns: not significant). (C) Hematoxylin and eosin (HE) staining of thoracic aortic tissues of CKD rats. (D) Von Kossa staining of thoracic aortic tissues of CKD rats. (E) EVG staining of thoracic aortic tissues of CKD rats (n = 5).
Morphologic analysis of rat thoracic aortic tissues showed distinct pathologic changes (Fig. 3C), with enlarged and reduced elasticity of aortic tissues. Additionally, a large amount of black calcification was observed in the media (Fig. 3B), and there were reduced broken elastic fibers in the calcified area (Fig. 3C). This showed that LH significantly inhibits vascular calcification and the breakage of elastic fibers in CKD rats. Notably, LH (0.4 g/kg) significantly inhibited vascular calcification. Vascular calcification did not improve in the CC group.
3.3. Serum metabolomics in patients with ESRD.
Although the pharmacodynamic effect of LH on vascular calcification in CKD and hyperphosphatemia is proven, its mechanism of action is not clear. Therefore, we used metabolomics to analyze the mechanism of CKD vascular calcification, to provide a basis for evaluating LH as a clinical drug.
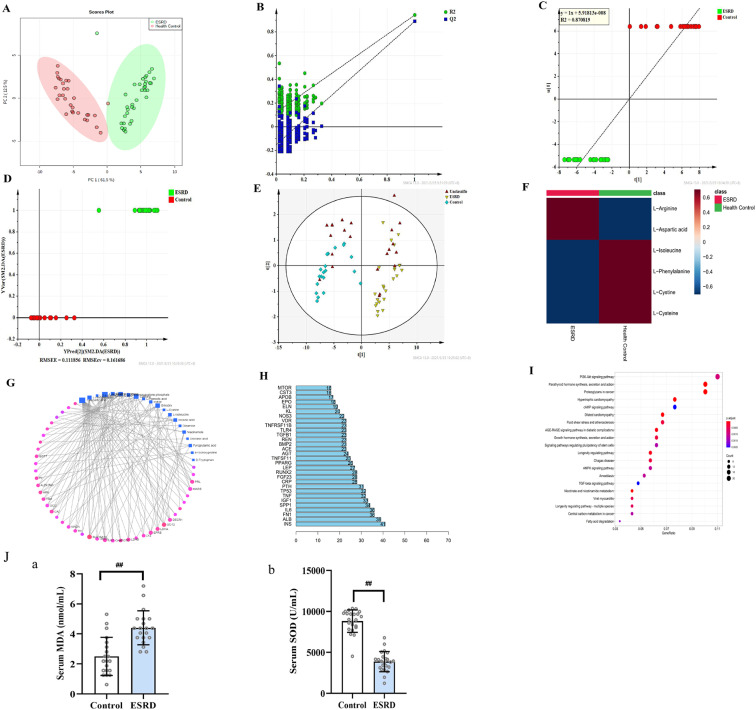
The demographic characteristics of healthy controls and patients with ESRD are shown in Tables S3 and S4, including age, gender, blood pressure, serum phosphorus, and information related to primary disease. This study included 36 healthy controls (Table S3) and 36 patients with ESRD (Table S4). Serum phosphorus level of healthy controls and patients with ESRD were 1.19 ± 0.03 mmol/L and 1.39 ± 0.26 mmol/L, respectively. Using liquid chromatography-tandem mass spectrometry we identified 2,190 variables in positive ion mode and 794 variables in negative ion mode from 66 subjects. PCA was used to analyze the serum metabolites of healthy controls and patients with ESRD. The serum metabolites from the two groups were well distinguished (Fig. 4A). PLS-DA was used to identify significant metabolites that differentiated the two groups. The results showed that the metabolites of the two groups were well separated, with a reduced dispersion within the ESRD group. This model had a high explanatory and prediction rate (R2Y = 0.92 and Q2Y = 0.92). Permutation experiments demonstrated that the R2 and Q2 intercepts were 0.49 and −0.013, respectively (Fig. 4B). Meanwhile, Q2 < 0 indicated a lack of overfitting. The control group (1–12) and ESRD group (1–12) samples were used as prediction samples. The prediction samples were unclassified. The results showed that the sample has good predictive ability (correlation coefficient, R2 = 0.870819 and RMSEE = 0.111856) (Figs. 4C–4E). A significant change was observed in 32 metabolites (log-fold change > 1, p < 0.05) from the two groups.
Figure 4.
(Color online) Untargeted metabolomics of patients with end-stage renal disease (ESRD). (A) PCA analysis of 72 objects. (B) Permutation test of difference variables. (C, D) Positive test of 72 objects. (E) PLS-DA forecast model diagram. (F) Level of six significant metabolomics. (G) Gene-metabolomics network. (H) Bar plot diagram. (I) KEGG enrichment. (J) (a) Serum MDA level and (b) serum SOD level in ESRD patients ( , compared with the control group, ##p < 0.01, n = 36).
In a network analysis for significant genes and metabolomics (Figs. 4G and 4H), the SLC16A10 gene was activated in ESRD. Furthermore, the SLC16A10 gene was related to six significant metabolomics (Fig. 4F) (L-cysteine, L-cystine, L-isoleucine, L-arginine, L-aspartic acid, and L-phenylalanine) and the PI3K-AKT signaling pathway (Fig. 4I). We found MDA, as a product of free oxygen radicals, in the serum of patients with ESRD increased by 76%, and the oxygen free radical scavenger SOD decreased by 57% compared with healthy people (Fig. 4J).
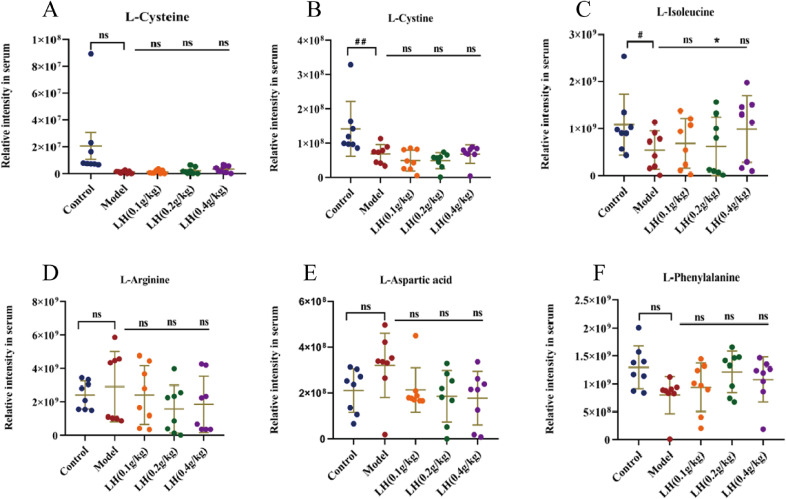
Furthermore, we analyzed the level of six significant metabolomics in CKD rats treated with adenine. Compared with the control group, L-arginine and L-aspartic acid increased, whereas L-cysteine, L-cystine, L-isoleucine, and L-phenylalanine decreased, in the model group. Compared with the control group, the administration group had decreased L-arginine and L-aspartic acid, and increased L-isoleucine and L-phenylalanine (Fig. 5). These results indicated that these six metabolites affected the PI3K-AKT signaling pathway.
Figure 5.
(Color online) Relative content of differential metabolites in chronic kidney disease (CKD) model rats. Serum levels of L-cysteine, L-cystine, L-isoleucine, L-arginine, L-aspartic acid, and L-phenylalanine in rats from each group ( , compared with the control group, #p < 0.05, ##p < 0.01; compared with the model group, *p < 0.05, n = 15, ns: not significant).
3.4. LH inhibits vascular calcification in rats by inhibiting the PI3K-AKT-mTOR-HIF-1α signaling pathway, activated by reactive oxygen species in vivo and in vitro.
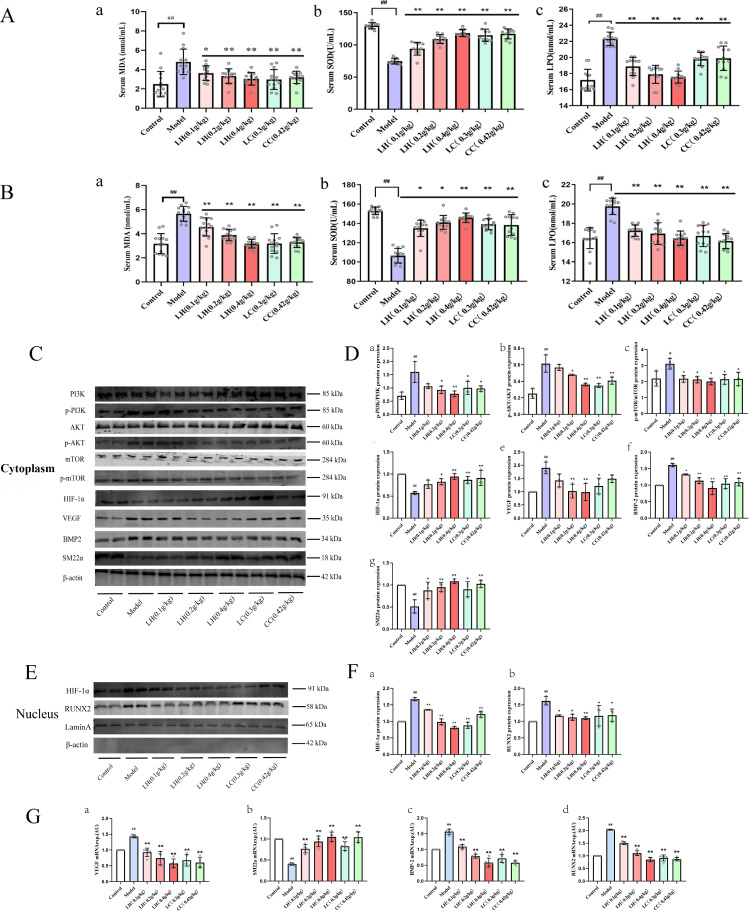
CKD causes oxidative stress. Many studies have reported that reactive oxygen species (ROS) activates the PI3K-AKT signaling pathway.18–22) Although LH may be a promising candidate drug for CKD treatment compared with LC, its mechanism of action is not clear. This metabolomics, proteomics, and network pharmacology study showed that CKD and its complications (vascular calcification) are related to the PI3K-AKT signaling pathway (Figs. 4, 5, and S1). Previous studies showed that activation of the PI3K-AKT-mTOR-HIF-1α signaling pathway promoted osteoblast growth and proliferation. Additionally, the signaling pathway can be activated by ROS.23,24) We aimed to explore whether LH inhibits vascular calcification in patients with CKD through the ROS-PI3K-AKT-HIF-1α signaling pathway. Therefore, we verified the changes in ROS in CKD rats (Figs. 6A and 6B), and we found significantly increased levels of free oxygen radicals in the model group compared to the control group (p < 0.01). After treatment with LH, free oxygen radicals decreased in CKD rats in a dose-dependent manner, and SOD was significantly increased (p < 0.01). Furthermore, we examined the influence of ROS on osteogenic differentiation using western blotting analysis. Compared with the control group, the expression of p-PI3K, p-AKT, and p-mTOR in the CKD group was significantly increased (p < 0.01), the expression of HIF-1α in the nucleus was significantly increased by 67%, and the expression of downstream protein vascular endothelial growth factor (VEGF) was significantly increased by 89% (Fig. 6C). Compared with the control group, the expression of BMP-2 and RUNX2 proteins in the model group were significantly increased by 60% and 62%, respectively (p < 0.01), whereas the VSMC marker SM22α was significantly reduced by 49% (p < 0.01). This indicated activation of PI3K-AKT-HiF-1α signaling pathway and transdifferentiation of VSMCs into osteoblasts. After LH treatment, compared with the model group, expression of SM22α was significantly increased (p < 0.01), and the expression levels of p-PI3K, p-AKT, p-mTOR, BMP-2, and RUNX2 were significantly decreased (p < 0.01). Next, we used real-time PCR technology to detect the expression levels of VEGF, SM22α, BMP-2, and RUNX2 mRNA. Compared with the WT rats, the expression level of VSMC marker SM22α mRNA in CKD rats was significantly reduced (p < 0.01), and the expression levels of osteogenic markers BMP-2 and RUNX2 mRNA were significantly increased (p < 0.01). Additionally, the expression level of VEGF mRNA in the HIF-1α pathway was significantly increased (p < 0.01) (Fig. 6G). Treatment with LH reversed the expression levels of these genes in a dose-dependent manner.
Figure 6.
(Color online) Effects of lanthanum hydroxide treatment on PI3K-AKT-HIF-1α pathway related proteins in the thoracic aorta of chronic kidney disease (CKD) model rats. (A) Serum ROS levels in rats with CKD and hyperphosphatemia after 4 weeks of treatment with lanthanum hydroxide. (B) Serum ROS levels in rats with CKD and hyperphosphatemia after 4 weeks of treatment with lanthanum hydroxide. (a) MDA; (b) SOD; (c) LPO ( , compared with the control group, ##p < 0.01; compared with the model group, *p < 0.05, **p < 0.01, n = 15). (C) Expression levels of PI3K, p-PI3K, AKT, p-AKT, m-TOR, p-mTOR, HIF-1α, VEGF, BMP-2, and SM22α in the cytoplasm. (D) Quantification of PI3K, p-PI3K, AKT, p-AKT, m-TOR, p-mTOR, HIF-1α, VEGF, BMP-2, and SM22α expression levels in the cytoplasm. (E) Expression levels of HIF-1α and RUNX2 in the nucleus. (F) Quantification of HIF-1α and RUNX2 expression levels in the nucleus. (G) Effect of lanthanum hydroxide on the expression levels of VEGF, SM22α, BMP-2, and RUNX2 mRNA ( , compared with the control group, #p < 0.05, ##p < 0.01; compared with the model group, *p < 0.05, **p < 0.01, n = 3).
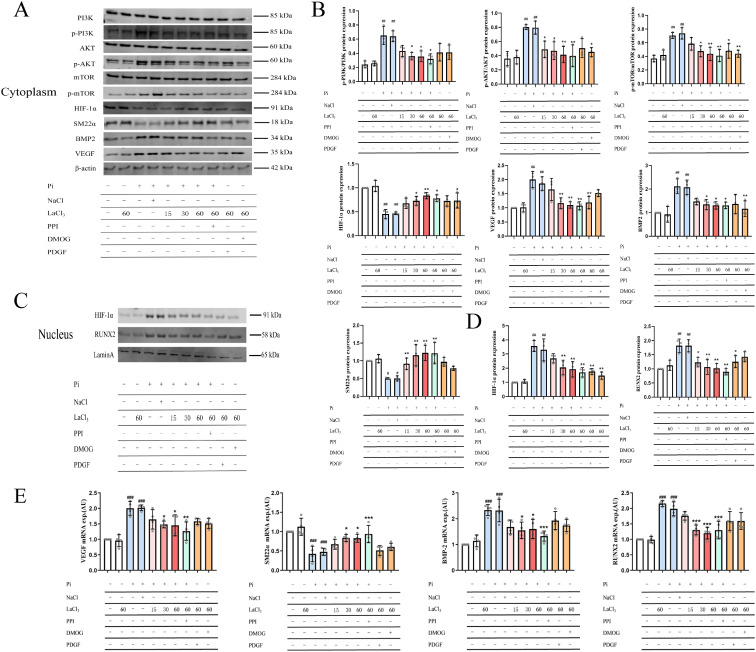
In hyperphosphatemia complicated by CKD, there are various reasons for the occurrence of vascular calcification. Including the formation of CPP or nano-hydroxyapatite, mechanistic vesicles, and transdifferentiation of VSMCs induced by a high phosphate environment.25–28) In addition, the above three processes are completely different mechanisms. However, in this study, we only focused on the phosphate-induced VSMC transdifferentiation process. The other two processes are not involved. In our experiments, we examined whether ROS affects PI3K-AKT-HIF-1α expression in VSMC transdifferentiation. We used western blotting to determine whether lanthanum ions can block VSMC calcification by inhibiting the activation of the ROS-PI3K-AKT-HIF-1α signaling pathway. Our results showed that increased phosphorus load increases ROS production by VSMCs (Fig. S2), which activates the PI3K-AKT-HIF-1α signaling pathway. Protein detection and mRNA detection showed similar results in vitro and in vivo. The addition of inhibitors partially inhibited osteogenic transdifferentiation of VSMCs, suggesting that LH indirectly inhibits PI3K-AKT-HIF-1α (Figs. 7A–7D). Alizarin red staining and Von Kossa staining results suggested that high phosphorus induces an increase in mineralized nodules (Fig. S3). The addition of lanthanum ions prevents ROS production induced by high phosphorus and the production of mineralized nodules (Figs. S2 and S3). Inhibition of the PI3K-AKT-HIF-1α signaling pathway (Fig. 7) prevents transdifferentiation of VSMCs.
Figure 7.
(Color online) Effect of lanthanum chloride on the PI3K-AKT-HIF-1α pathway related proteins in H-vascular smooth muscle cells (VSMCs). (A) Expression levels of PI3K, p-PI3K, AKT, p-AKT, m-TOR, p-mTOR, HIF-1α, SM22α, BMP2, and VEGF in the cytoplasm of H-VSMCs. (B) Quantification of PI3K, p-PI3K, AKT, p-AKT, m-TOR, p-mTOR, HIF-1α, VEGF, BMP-2, and SM22α expression levels in the cytoplasm of H-VSMCs. (C) Expression levels of HIF-1α and RUNX2 in the nucleus of VSMCs. (D) Quantification of HIF-1α and RUNX2 expression levels in the nucleus. (E) Effect of lanthanum ion on the expression levels of VEGF, SM22α, BMP-2, and RUNX2 mRNA ( , compared with the control group, #p < 0.05, ##p < 0.01, ###p < 0.001; compared with the model group, *p < 0.05, **p < 0.01, ***p < 0.001, n = 3).
4. Discussion
In patients with CKD, mechanisms such as anemia, microvascular disease, hyperphosphatemia, and mitochondrial dysfunction contribute to the hypoxic state of the body. In hypoxic conditions, mitochondria produce large quantities of ROS, thereby damaging nephron excretion. ROS also prevents the maintenance of homeostasis and causes accumulation of metabolites.29) Renal regulatory mechanisms, such as glomerular feedback, muscle reflex supplying small arteries, and the renin-angiotensin-aldosterone system, are also affected by ROS; therefore, the kidneys are unable to compensate for the imbalance in water, electrolytes, and acid-base system. As a result, the renal excretion of phosphorus is once again destroyed, and the phosphorus load in the body is increased. The development of a positive feedback mechanism leads to aggravation of oxidative stress and hypoxia-stress response.30,31) ROS activates the PI3K-AKT signaling pathway, promotes expression of its downstream target genes (m-TOR and RUNX2), and promotes VSMC calcification and osteoblast proliferation.32,33) The level of oxidative stress was significantly increased in patients with ESRD (Fig. 4), which is related to the signal pathway that we identified. HIF-1 mediates a series of cellular hypoxia responses in hypoxic conditions and plays an important role in vascular calcification. In hypoxia, owing to limited hydroxylation of oxygen levels, the HIF-1α subunit stabilizes and activates downstream signaling pathways, including VEGF signaling. VEGF signaling plays a central role in the process of angiogenesis and bone formation through its effects on chondrocytes and osteoblasts. Previous studies reported that ROS activates the PI3K-AKT-HIF-1α signaling pathway to promote the osteogenic marker RUNX2.34) The previous study results were consistent with our metabolomics and proteomics results (Figs. 3 and S1). Therefore, our study confirmed the signaling pathway in vivo and in vitro.
The study results showed that p-PI3K, p-AKT, and p-mTOR levels in the model group were significantly higher compared with the control group (Fig. 6). Additionally, the expression level of HIF-1α in the nucleus was significantly increased by 67%, the expression of the downstream protein VEGF was significantly increased by 89%, and BMP2 and RUNX2 expression levels were increased by 60% and 62%, respectively, in the model group compared with the control group. The expression level of SM22α decreased by 49% (Fig. 6) in vitro and in vivo. Notably, after adding the inhibitor, the expression of the above-mentioned protein was reversed (Fig. 7). Similarly, after administration of the lanthanum ion, expression of the above-mentioned protein was reversed in a dose-dependent manner. However, lanthanum ions indirectly influence the pathway (Fig. 7). Our results suggest that VSMCs differentiate into osteoblast-like cells and lanthanum ions inhibit the transdifferentiation. Therefore, LH inhibits the CKD process and vascular calcification by blocking the ROS-PI3K-AKT-HIF-1α signaling pathway (Fig. 8).
Figure 8.
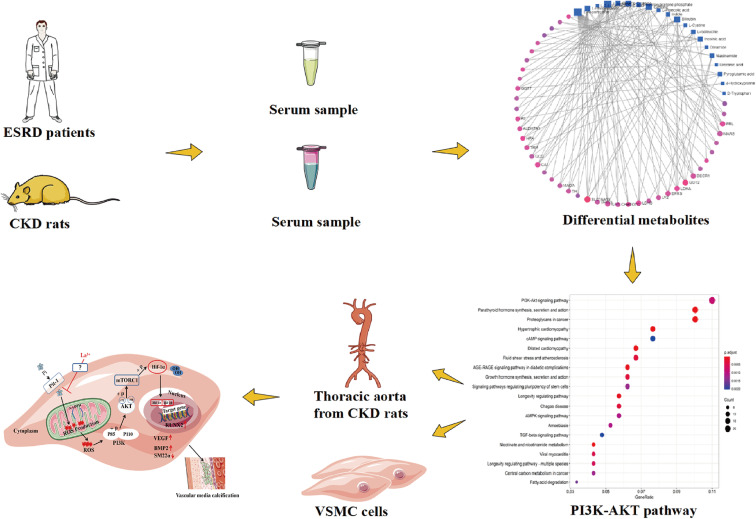
(Color online) Graphical abstract of the screening and verification of signal pathways.
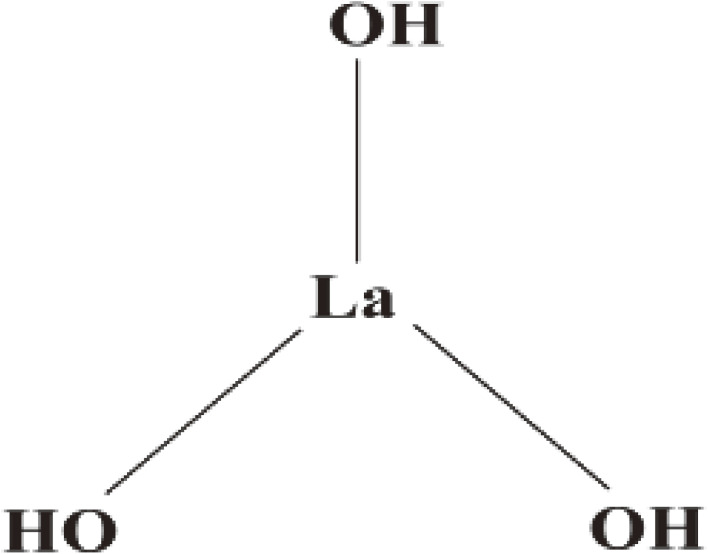
Vascular calcification is the main reason for the high mortality of patients with CKD. CKD is mainly treated with kidney transplantation and dialysis, but these methods are very expensive. Therefore, the development of drugs to treat vascular calcification is key to reducing the CKD mortality. However, drug development, from preclinical research to clinical research, is a long and complicated process.35) The development of new therapeutic agents is a multi-stage process with ethical, scientific, and economic challenges.36) The probability of successful clinical development is about 10%, and few drugs prove to be effective in clinical trials.37) For example, the clinical success rates of systemic anti-infective drugs, neuropharmacology, and cardiovascular drugs are 27%, 8%, and 7%, respectively.38) The lack of efficacy of drugs is the main reason for failure of drug development in the clinical studies, which may be explained by poor external validity of preclinical (cell, tissue, and animal) models of human diseases and differences in species.39) In our study, we used metabolomics to predict the possible mechanism of an effective candidate drug in patients with ESRD and simulate the disease process in a preclinical study for new drug discovery. In previous metabolomics studies, metabolites were usually administered to rats to observe changes in signal pathways; some other studies only assessed the metabolites.40–42) In this study, we propose a method for combining human and animal metabolomics to screen signal pathways, thereby avoiding interspecies differences, and it was proved for the first time that LH (a white powdery solid with a weight of 189.92752 g/mol, hardly soluble in water and the chemical formula is shown in Fig. 9) can be used as a new phosphorus binder to inhibit the occurrence of vascular calcification through the ROS-PI3K-AKT-mTOR-HIF-1α signaling pathway, which increases the likelihood of successful clinical studies of the candidate phosphorus-binding agent LH.
Figure 9.
The chemical formula of lanthanum hydroxide.
Supplementary Material
Supplementary materials are available at https://doi.org/10.2183/pjab.98.019.
Acknowledgments
We are grateful to Hong Liu for his contribution to the synthesis of lanthanum hydroxide and to Xiaodong Cao for the analysis of pathological sections. We thank LetPub (www.letpub.com) for its linguistic assistance during the preparation of this manuscript.
Conflict of interest
The authors declare that the research was conducted in the absence of any commercial or financial relationships that could be construed as a potential conflict of interest.
Author contributions
Chao Gu and Yuan Gao analyzed and interpreted the data and wrote the first draft of the manuscript. Gang Li and Changhai Su conceived, designed, and implemented the research, as well as analyzed and interpreted the data. They also wrote the study methodology and revised the manuscript. Yang Liu and Min Guo critically revised the manuscript. Changhai Su provided information on the human source sample and participated in data analysis of the human source sample. Hong Liu assisted in data interpretation and participated in critical revision of the manuscript. All of the authors approved the final version of this manuscript. Gang Li is the guarantor of this work; he has full access to research data and is responsible for data integrity and accuracy of data analysis.
Funding
This research was supported by major scientific and technological projects of the Inner Mongolia Autonomous Region (no. zdzx201805).
References
- 1).Ekins S., Clark A.M., Swamidass S.J., Litterman N., Williams A.J. (2014) Bigger data, collaborative tools and the future of predictive drug discovery. J. Comput. Aided Mol. Des. 28, 997–1008. [DOI] [PMC free article] [PubMed] [Google Scholar]
- 2).Wagner B.K., Schreiber S.L. (2016) The power of sophisticated phenotypic screening and modern mechanism-of-action methods. Cell Chem. Biol. 23, 3–9. [DOI] [PMC free article] [PubMed] [Google Scholar]
- 3).Grapov D., Fahrmann J., Wanichthanarak K., Khoomrung S. (2018) Rise of deep learning for genomic, proteomic, and metabolomic data integration in precision medicine. OMICS 22, 630–636. [DOI] [PMC free article] [PubMed] [Google Scholar]
- 4).Azad R.K., Shulaev V. (2019) Metabolomics technology and bioinformatics for precision medicine. Brief. Bioinform. 20, 1957–1971. [DOI] [PMC free article] [PubMed] [Google Scholar]
- 5).Beger R.D., Dunn W., Schmidt M.A., Gross S.S., Kirwan J.A., Cascante M., et al. (2016) Metabolomics enables precision medicine: “a white paper, community perspective”. Metabolomics 12, 149. [DOI] [PMC free article] [PubMed] [Google Scholar]
- 6).Creek D.J., Chua H.H., Cobbold S.A., Nijagal B., MacRae J.I., Dickerman B.K., et al. (2016) Metabolomics-based screening of the malaria box reveals both novel and established mechanisms of action. Antimicrob. Agents Chemother. 60, 6650–6663. [DOI] [PMC free article] [PubMed] [Google Scholar]
- 7).Zhao Y.-Y., Cheng X.-L., Vaziri N.D., Liu S., Lin R.-C. (2014) UPLC-based metabonomic applications for discovering biomarkers of diseases in clinical chemistry. Clin. Biochem. 47, 16–26. [DOI] [PubMed] [Google Scholar]
- 8).Long M., Li Q.M., Fang Q., Pan L.-H., Zha X.-Q., Luo J.-P. (2019) Renoprotective effect of Laminaria japonica polysaccharide in adenine-induced chronic renal failure. Molecules 24, 1491. [DOI] [PMC free article] [PubMed] [Google Scholar]
- 9).Khoury T., Tzukert K., Abel R., Rmeileh A.A., Levi R., Ilan Y. (2017) The gut-kidney axis in chronic renal failure: a new potential target for therapy. Hemodial. Int. 21, 323–334. [DOI] [PubMed] [Google Scholar]
- 10).GBD Chronic Kidney Disease Collaboration (2020) Global, regional, and national burden of chronic kidney disease, 1990–2017: a systematic analysis for the Global Burden of Disease Study 2017. Lancet 395, 709–733. [DOI] [PMC free article] [PubMed] [Google Scholar]
- 11).Yang C.W., Harris D.C.H., Luyckx V.A., Nangaku M., Hou F.F., García-García G., et al. (2020) Global case studies for chronic kidney disease/end-stage kidney disease care. Kidney Int. Suppl. (2011) 10, e24–e48. [DOI] [PMC free article] [PubMed] [Google Scholar]
- 12).Mizobuchi M., Towler D., Slatopolsky E. (2009) Vascular calcification: the killer of patients with chronic kidney disease. J. Am. Soc. Nephrol. 20, 1453–1464. [DOI] [PubMed] [Google Scholar]
- 13).Giachelli C.M. (2009) The emerging role of phosphate in vascular calcification. Kidney Int. 75, 890–897. [DOI] [PMC free article] [PubMed] [Google Scholar]
- 14).Huveneers S., Daemen M.J., Hordijk P.L. (2015) Between Rho(k) and a hard place: The relation between vessel wall stiffness, endothelial contractility, and cardiovascular disease. Circ. Res. 116, 895–908. [DOI] [PubMed] [Google Scholar]
- 15).Ma Z., Yu T., Wu Y., Liu D., Zhang X., Miao X., et al. (2019) Nano-lanthanum hydroxide, a novel phosphate binder, for treating hyperphosphatemia: a preclinical study. Biomed. Pharmacother. 111, 909–916. [DOI] [PubMed] [Google Scholar]
- 16).Zhao L., Wang S., Liu H., Du X., Bu R., Lim B., et al. (2021) The pharmacological effect and mechanism of lanthanum hydroxide on vascular calcification caused by chronic renal failure hyperphosphatemia. Front. Cell Dev. Biol. 9, 639127. [DOI] [PMC free article] [PubMed] [Google Scholar]
- 17).Hutchison A.J., Wilson R.J., Garafola S., Copley J.B. (2016) Lanthanum carbonate: safety data after 10 years. Nephrology (Carlton) 21, 987–994. [DOI] [PMC free article] [PubMed] [Google Scholar]
- 18).Paloian N.J., Giachelli C.M. (2014) A current understanding of vascular calcification in CKD. Am. J. Physiol. Renal Physiol. 307, F891–F900. [DOI] [PMC free article] [PubMed] [Google Scholar]
- 19).Ponnusamy A., Sinha S., Hyde G.D., Borland S.J., Taylor R.F., Pond E., et al. (2018) FTI-277 inhibits smooth muscle cell calcification by up-regulating PI3K/Akt signaling and inhibiting apoptosis. PLoS One 13, e0196232. [DOI] [PMC free article] [PubMed] [Google Scholar]
- 20).Kim H., Kim H.-J., Lee K., Kim J.-M., Kim H.S., Kim J.-R., et al. (2012) α-Lipoic acid attenuates vascular calcification via reversal of mitochondrial function and restoration of Gas6/Axl/Akt survival pathway. J. Cell. Mol. Med. 16, 273–286. [DOI] [PMC free article] [PubMed] [Google Scholar]
- 21).Nguyen T.T., Quan X., Xu S., Das R., Cha S.-K., Kong I.D., et al. (2016) Intracellular alkalinization by phosphate uptake via type III sodium-phosphate cotransporter participates in high-phosphate-induced mitochondrial oxidative stress and defective insulin secretion. FASEB J. 30, 3979–3988. [DOI] [PubMed] [Google Scholar]
- 22).Deng S., Dai G., Chen S., Nie Z., Zhou J., Fang H., et al. (2019) Dexamethasone induces osteoblast apoptosis through ROS-PI3K/AKT/GSK3β signaling pathway. Biomed. Pharmacother. 110, 602–608. [DOI] [PubMed] [Google Scholar]
- 23).Byon C.H., Javed A., Dai Q., Kappes J.C., Clemens T.L., Darley-Usmar V.M., et al. (2008) Oxidative stress induces vascular calcification through modulation of the osteogenic transcription factor Runx2 by AKT signaling. J. Biol. Chem. 283, 15319–15327. [DOI] [PMC free article] [PubMed] [Google Scholar]
- 24).Joshi S., Singh A.R., Durden D.L. (2014) MDM2 regulates hypoxic hypoxia-inducible factor 1α stability in an E3 ligase, proteasome, and PTEN-phosphatidylinositol 3-kinase-AKT-dependent manner. J. Biol. Chem. 289, 22785–22797. [DOI] [PMC free article] [PubMed] [Google Scholar]
- 25).Lee S.J., Lee I.-K., Jeon J.-H. (2020) Vascular Calcification-New Insights Into Its Mechanism. Int. J. Mol. Sci. 21, 2685. [DOI] [PMC free article] [PubMed] [Google Scholar]
- 26).Park H.J., Kim Y., Kim M.K., Hwang J.J., Kim H.J., Bae S.K., et al. (2020) Inhibition of gastrin-releasing peptide attenuates phosphate-induced vascular calcification. Cells 9, 737. [DOI] [PMC free article] [PubMed] [Google Scholar]
- 27).Voelkl J., Lang F., Eckardt K.U., Amann K., Kuro-O M., Pasch A., et al. (2019) Signaling pathways involved in vascular smooth muscle cell calcification during hyperphosphatemia. Cell. Mol. Life Sci. 76, 2077–2091. [DOI] [PMC free article] [PubMed] [Google Scholar]
- 28).Kutikhin A.G., Feenstra L., Kostyunin A.E., Yuzhalin A.E., Hillebrands J.L., Krenning G. (2021) Calciprotein particles: balancing mineral homeostasis and vascular pathology. Arterioscler. Thromb. Vasc. Biol. 41, 1607–1624. [DOI] [PMC free article] [PubMed] [Google Scholar]
- 29).Mokas S., Larivière R., Lamalice L., Gobeil S., Cornfield D.N., Agharazii M., et al. (2016) Hypoxia-inducible factor-1 plays a role in phosphate-induced vascular smooth muscle cell calcification. Kidney Int. 90, 598–609. [DOI] [PubMed] [Google Scholar]
- 30).Jha J.C., Banal C., Chow B.S., Cooper M.E., Jandeleit-Dahm K. (2016) Diabetes and kidney disease: role of oxidative stress. Antioxid. Redox Signal. 5, 657–684. [DOI] [PMC free article] [PubMed] [Google Scholar]
- 31).Liu J., Wei Q., Guo C., Dong G., Liu Y., Tang C., et al. (2017) Hypoxia, HIF, and associated signaling networks in chronic kidney disease. Int. J. Mol. Sci. 18, 950. [DOI] [PMC free article] [PubMed] [Google Scholar]
- 32).Stegen S., Carmeliet G. (2018) The skeletal vascular system — breathing life into bone tissue. Bone 115, 50–58. [DOI] [PubMed] [Google Scholar]
- 33).Dai J., Rabie A.B. (2007) VEGF: an essential mediator of both angiogenesis and endochondral ossification. J. Dent. Res. 86, 937–950. [DOI] [PubMed] [Google Scholar]
- 34).Yildirim O., Gottwald M., Schüler P., Michel M.C. (2016) Opportunities and challenges for drug development: public-private partnerships, adaptive designs and big data. Front. Pharmacol. 7, 461. [DOI] [PMC free article] [PubMed] [Google Scholar]
- 35).Alsultan A., Alghamdi W.A., Alghamdi J., Alharbi A.F., Aljutayli A., Albassam A., et al. (2020) Clinical pharmacology applications in clinical drug development and clinical care: a focus on Saudi Arabia. Saudi Pharm. J. 28, 1217–1227. [DOI] [PMC free article] [PubMed] [Google Scholar]
- 36).Byon C.H., Javed A., Dai Q., Kappes J.C., Clemens T.L., Darley-Usmar V.M., et al. (2008) Oxidative stress induces vascular calcification through modulation of the osteogenic transcription factor Runx2 by AKT signaling. J. Biol. Chem. 283, 15319–15327. [DOI] [PMC free article] [PubMed] [Google Scholar]
- 37).Kaitin K.I. (2010) Deconstructing the drug development process: the new face of innovation. Clin. Pharmacol. Ther. 87, 356–361. [DOI] [PMC free article] [PubMed] [Google Scholar]
- 38).Hingorani A.D., Kuan V., Finan C., Kruger F.A., Gaulton A., Chopade S., et al. (2019) Improving the odds of drug development success through human genomics: modelling study. Sci. Rep. 9, 18911. [DOI] [PMC free article] [PubMed] [Google Scholar]
- 39).Helmlinger G., Sokolov V., Peskov K., Hallow K.M., Kosinsky Y., Voronova V., et al. (2019) Quantitative systems pharmacology: an exemplar model-building workflow with applications in cardiovascular, metabolic, and oncology drug development. CPT Pharmacometrics Syst. Pharmacol. 8, 380–395. [DOI] [PMC free article] [PubMed] [Google Scholar]
- 40).Chen D.Q., Cao G., Chen H., Liu D., Su W., Yu X.Y., et al. (2017) Gene and protein expressions and metabolomics exhibit activated redox signaling and wnt/β-catenin pathway are associated with metabolite dysfunction in patients with chronic kidney disease. Redox Biol. 12, 505–521. [DOI] [PMC free article] [PubMed] [Google Scholar]
- 41).Chen H., Cao G., Chen D.Q., Wang M., Vaziri N.D., Zhang Z.H., et al. (2016) Metabolomics insights into activated redox signaling and lipid metabolism dysfunction in chronic kidney disease progression. Redox Biol. 10, 168–178. [DOI] [PMC free article] [PubMed] [Google Scholar]
- 42).Liu X., Zhang B., Huang S., Wang F., Zheng L., Lu J., et al. (2019) Metabolomics analysis reveals the protection mechanism of Huangqi-Danshen decoction on adenine-induced chronic kidney disease in rats. Front. Pharmacol. 10, 992. [DOI] [PMC free article] [PubMed] [Google Scholar]
Associated Data
This section collects any data citations, data availability statements, or supplementary materials included in this article.
Supplementary Materials
Supplementary materials are available at https://doi.org/10.2183/pjab.98.019.


