

Abstract
Extreme heat is a recognized threat to human health. This study examines projected future trends of multiple measures of extreme heat across Texas throughout the next century, and evaluates the expected climate changes alongside Texas athletic staff (coach and athletic trainer) attitudes toward heat and climate change. Numerical climate simulations from the recently published Community Earth System Model version 2 and the Climate Model Intercomparison Project were used to predict changes in summer temperatures, heat indices, and wet bulb temperatures across Texas and also within specific metropolitan areas. A survey examining attitudes toward the effects of climate change on athletic programs and student athlete health was also distributed to high‐school and university athletic staff. Heat indices are projected to increase beyond what is considered healthy/safe limits for outdoor sports activity by the mid‐to‐late 21st century. Survey results reveal a general understanding and acceptance of climate change and a need for adjustments in accordance with more dangerous heat‐related events. However, a portion of athletic staff still do not acknowledge the changing climate and its implications for student athlete health and their athletic programs. Enhancing climate change and health communication across the state may initiate important changes to athletic programs (e.g., timing, duration, intensity, and location of practices), which should be made in accordance with increasingly dangerous temperatures and weather conditions. This work employs a novel interdisciplinary approach to evaluate future heat projections alongside attitudes from athletic communities toward climate change.
Keywords: climate change, extreme heat in Texas, human health, wet bulb temperature, student athletes, exertional heat illness
Key Points
This study examines projected trends in extreme heat across Texas throughout the next century from Community Earth System Model version 2 alongside a survey of athletic staff
Heat indices are projected to increase beyond what is considered healthy/safe limits for outdoor sports activity by the mid‐to‐late 21st century
While most athletic staff acknowledge the need for changes to prevent heat‐related illness in student athletes, a smaller portion still do not
1. Introduction
Climate change is expected to increase temperatures and alter weather patterns throughout much of the United States; by the mid‐21st century, the annual number of days above 100°F is projected to double (Dahl et al., 2019). If there is no effort made to reduce emissions, Texas and the Southern Plains regions are predicted to experience 30–60 additional days per year where temperatures exceed 100°F by the late 21st century (Wuebbles et al., 2017). Overall, there will be more extreme heat events as a result of the thermodynamic and possibly dynamic effects of global warming (Perkins‐Kirkpatrick & Lewis, 2020; Russo et al., 2014). A study from Horton et al. (2015) shows that a greater occurrence and persistence of anticyclonic patterns is correlated with more extreme high temperatures and heat waves. Changes in such regional circulation patterns can drive extreme temperature events by initiating a cascade of self‐reinforcing, heat‐accumulating land‐atmosphere feedback processes (Miralles et al., 2019).
Across North America, the frequency, spatial extent, and severity of heat waves will increase due to climate change (Perkins‐Kirkpatrick & Lewis, 2020). While there is no single standard definition of a heat wave, they are generally defined as a series of days/nights with maximum/minimum temperatures above a particular high percentile threshold, usually the 90th and 99th percentiles of the daily temperature distribution (Keellings et al., 2018). For example, the National Weather Service (NWS) Heat Wave criteria define an event as the number of consecutive days with a high of at least 90°F (US Department of Commerce, n.d.‐a). Changes in heat wave patterns are projected for Texas: heat wave frequency and total land mass affected by heat waves are projected to increase, while heat wave patches are changing and becoming more complex in shape (Keellings et al., 2018). In general, by 2100, almost half of the world's population is likely to experience annual lethal heat wave events (Mora et al., 2017). Lyon et al. (2019) reported that based on an RCP8.5 forcing scenario, the size of contiguous U.S. summer heat waves and the exposed population is projected to increase by a factor of over 2 by the mid‐21st century. Additional work by Nabizadeh et al. (2019) reported an increase in the size of the blocking events, which to some extent explains these projected increases in the size of heat waves. Temperature anomalies caused by blocking events are shown to intensify over land under climate change (Nabizadeh et al., 2021).
These increasing heat wave hazard trends are concerning as heat waves have long been known to have profound impacts on human health. Indeed, NWS statistics (US Department of Commerce, n.d.‐b) indicate that heat is the number one weather‐related cause of death in the United States. High temperatures can result in illness and death directly (e.g., heat stroke) and can also exacerbate preexisting medical conditions and increase overall mortality rates (Gasparrini et al., 2015); these effects may be pronounced among individuals who spend time outdoors (Wexler, 2002). In addition, heat waves substantially impact outdoor sports, as athletes are physically affected by extreme heat conditions. Specifically, extreme heat events are associated with exertional heat illnesses (EHIs) (Hosokawa et al., 2019), and athletes training outdoors in the heat are at increased risk for developing EHIs (Kerr et al., 2013; Navarro et al., 2017). EHIs manifest on a spectrum of symptoms but are largely preventable (Gauer & Meyers, 2019). Mild cases might present symptoms, such as heat rash, exercise‐associated muscle cramps, exercise‐associated collapse, or heat edema. More severe cases can range from heat exhaustion to a life‐threatening heat stroke (Howe & Boden, 2007).
Exertional heat stroke, the most serious form of EHI, is one of the leading causes of death among high‐school athletes (Barrow & Clark, 1998). Estimates suggest that roughly 9,000 high‐school athletes are affected by EHIs each year (Gauer & Meyers, 2019). Within collegiate athletics, football players experience the most EHIs, but all NCAA athletes are at risk of EHIs (Yeargin et al., 2019). Risk factors for EHI can be intrinsic (e.g., age) or extrinsic (e.g., weather) (Casa et al., 2015; Smith, 2019). It has been shown that the incidence of EHIs increases when wet bulb globe temperature (WBGT), a measure of heat stress in direct sunlight, is higher than usual (Cooper et al., 2016). In a retrospective analysis on hyperthermia deaths in American football players, all deaths occurred under “high” or “extreme” conditions as measured by the WBGT (Grundstein et al., 2012), though the level of WBGT that leads to death varies depending on regional climate and acclimatization (Grundstein et al., 2018). Generally, atypically high solar radiation, temperature and humidity conditions can increase the risk of EHIs.
Guidelines do exist in various settings to reduce incidence of EHIs through the modification of activity duration and intensity (Hosokawa et al., 2019). For example, the National Athletic Trainers' Association has provided comprehensive guidelines for how to address and prevent EHIs in athletes (Casa et al., 2015). Texas provides recommendations regarding EHIs in outdoor sports (e.g., via the University Interscholastic League (UIL, n.d.)). Most but not all high‐school athletic trainers have explicit policies to reduce incidence of EHIs (Scarneo‐Miller et al., 2020), and some states have recommended heat policies specifically for football, a sport in which EHIs are particularly common (Cooper et al., 2020).
Given an already vast and growing body of climate literature (e.g., IPCC, 2013, and IPCC AR6, in press) that indicates more frequent and severe heat waves, athletic staff must be prepared to address growing heat‐related health concerns for the safety of their athletes. In addition to temperature, specific humidity increases with global warming following the Clausius‐Clapeyron relationship; this will further exacerbate EHIs by reducing sweating efficiency: higher humidity reduces the skin‐air difference in moisture, which leads to less evaporative cooling (Buzan & Huber, 2020). Additionally, there has been a greater increase in exposure to humid heat compared to dry heat (Rogers et al., 2021). Previous work addresses climate change's effect on human thermoregulation (Hanna & Tait, 2015; Lim, 2020; Smith, 2019; Williams, 2020), and more recent work addresses the relationships between heat waves and heat illness in athletes, given recent increases in high heat events (Kerr et al., 2019). For example, significant attention was paid to heat risk in the lead up to the Tokyo Olympics (e.g., Kakamu et al., 2017; Vanos, Thomas, et al., 2020), motivated by climate change.
While such studies linking high temperatures to athlete health risks exist, these efforts are generally geared toward monitoring immediate threats in the present. Given the severity of projected future warming, additional adaptation will likely be required. Focus on regional analyses of extremes is lacking in large compilation reports (e.g., IPCC AR6), specifically for Texas. Furthermore, to date, the attitudes of trainers and athletic directors toward climate change and increasing temperatures have not been assessed.
Addressing this gap, here, we perform a coupled study of temperature change projections and attitudes toward outdoor sports in Texas in the context of a warming climate. We evaluate a realistic warming scenario (SSP3‐7.0) in a state‐of‐the‐art general circulation model (GCM), the Community Earth System Model version 2 (CESM2), for the state of Texas using multiple measures of temperature stress. Frequency and intensity of high‐heat days are characterized using three complementary metrics: average and maximum daily surface air temperatures (T A ), heat index (T HI ), and wet bulb temperature (T WB ). The three measures differ in that both T HI and T WB explicitly consider humidity in combination with temperature; at extremely high levels (e.g., >95°F), T WB provides a quantitative thermodynamic limit for mammalian heat dissipation (Sherwood & Huber, 2010), and NWS uses heat index as a metric for heat warnings in the United States (Hawkins et al., 2017).
To the best of our knowledge, ours is the first study to evaluate attitudes from athletic communities toward climate change and athlete health concerns in concert with future heat projections. Using climate projections and the survey results, we test the following hypotheses:
[H1 A ] Extreme summer temperatures and metrics of heat stress rise in Texas over the coming decades as a function of carbon emissions scenario;
[H2 A ] Concern over temperature and climate change positively relates to consideration of these factors when making practice decisions;
[H2 B ] Athletic staff are largely not concerned about temperature and/or climate change.
By addressing these hypotheses, we seek to provide a novel understanding of athletic perspectives on climate change and potential for adaptation to rising temperatures in our state and local communities.
2. Methods
We first introduce the survey design, which explores attitudes from athletic staff regarding how climate change will affect their sports, as well as the climate data and metrics used to analyze heat trends in Texas.
2.1. Survey of Athletic Directors, Trainers, and Coaches in Texas
High school and collegiate athletic staff (i.e., coaches, directors, and athletic trainers) participated in an anonymous, online, cross‐sectional survey that evaluated attitudes toward outdoor sports and climate change. Participants received an email entitled Participate in a Rice University Survey on Heat, Student‐Athlete Health and Sports; the full text of the email and the survey questions are given in Supplementary Information Text S1 and S2 in Supporting Information S1. Responses were collected over a period of three and half months beginning in January 2021 and closing in mid‐April. We define a sport to be an “outdoor sport” if official competitions take place outdoors. We focus on Texas due to the high interest in outdoor sports, especially football, and Texas's extreme risk to rising temperatures by 2100.
2.1.1. Participants and Study Design
Participants were invited to participate in the survey via a variety of methods to create as large and representative a sample of athletic staff in Texas as possible. Surveys were shared by email and word of mouth (e.g., direct solicitation and snowball sampling) at universities and high schools across Texas. We reached out to 4,701 email contacts in total. Surveys were sent to all varsity athletics departments at 166 Texas colleges and universities and 3,796 Texas high schools. We obtained a list of all the Texas colleges and universities from the Texas Comptroller of Public Accounts website and manually eliminated schools with no varsity sports. We targeted athletic programs located in Dallas, Houston, Austin, San Antonio, and McAllen (the five largest metro areas by population), along with El Paso and Amarillo (the largest metro areas in West Texas and the panhandle, respectively).
The survey contained 22 questions, none of which required responses (i.e., they could all be completed voluntarily, and thus individual questions varied in terms of the number of responses reported). We restrict our reported data to those individuals who had complete data for our primary variables of interest (e.g., those related to climate change and temperature). The objective of the survey questions was to measure attitudes toward outdoor sports and climate change, specifically with respect to extreme heat, humidity, and student athlete health and safety.
A total of 299 individuals took the initial survey, of which 224 surveys were fully completed for primary variables of interest (as noted in figure captions). Using the total number of institutions contacted as our subject pool, we received responses from approximately 8% of the total contacts (N = 299). However, because we did not require responses to every question, we removed the participants with missing data to avoid issues with interpretation of response means; this resulted in N = 224. Thus, in our correlation tables, we used data from a total of 224 participants.
Of these individuals, 93% (213) coach sports in the fall (September–November), 81% (186) coach sports in the winter (December–February), 90% (206) coach sports in the spring (March–May), and 67% (153) coach sports during the summer months (June–August); note that many staff members coach multiple sports across multiple seasons. These details are shown in Figure 1. Regarding sports coached, 51% (117) of the sample coach football, 40% (91) coach track and field, 29% (66) coach soccer, 24% (55) coach softball, 23% (53) coach baseball, 23% (52) coach cross‐country, 19% (43) coach tennis, 19% (43) coach golf, 11% (26) coach swimming, 1% (2) coach lacrosse, and 12% (28) selected “other” sports. In terms of facilities, 60% (135) of the sample have access to indoor climate‐controlled facilities, but 40% (88) do not; the majority of participants coach “always” or “mostly” outdoors (67%; 151). Regarding decision‐making, 88% (202) of participants have the power to decide if practice will occur or not. These demographic survey results provide insight as to what resources are available to athletic programs, how heat currently influences practices, and the sport(s) and seasons in which the coaches work.
Figure 1.

Athletic staff access to facilities and attitudes. (a) Indoor versus Outdoor coaching. (b) Access to Climate‐Controlled facilities. (c) Discussions on temperature issues among athletic program directors. *Note that four people skipped (a) indoor versus outdoor question, and one person skipped (b) access to indoor climate‐controlled facilities.
The first three questions ask participants what season their sport takes place in, for which sport they coach/train students, and if they help decide if practice will occur. The next questions ask about the impact heat and humidity might have on practice. For example, one question asks participants how often they have canceled practice due to high temperatures. The survey also asks participants about how concerned they are about climate change affecting outdoor sports at their institution. The last part of the survey asks participants about their long‐term concerns about their athletics program, the attitudes of student athletes toward high temperatures, and if school officials outside of the athletics program have addressed temperature concerns. The complete survey questionnaire and unfiltered results can be found in the Supplemental Materials (Text S1‐S3, Figures S4–S12 in Supporting Information S1).
2.1.2. Measures
The research team generated original self‐report items to assess attitudes and behaviors related to climate change, high temperatures, and the conditions necessary to influence practice cancellation decisions.
In an effort to demonstrate construct validity with other preexisting measures regarding attitudes toward climate change, we conducted a small, second validation study to demonstrate convergent validity (DeVellis & Thorpe, 2021). We include details in the pertinent table captions with more information in Supplemental Materials (Table S1, Figures S4–S12 in Supporting Information S1). Significant evidence of convergent validity emerged for both the concern and consider composites herein described.
2.1.2.1. Concern Composite
The Concern measure assesses participants' concern regarding temperature and climate change effects on their athletes and the longevity of their program. It consists of four items, using a 5‐point Likert‐type scale, ranging from 1 (Extremely concerned) to 5 (Not concerned at all). These items included: 1—“How concerned are you about the effects of temperature on the long‐term success of your athletic program?”; 2—“How concerned are you about the effects of temperature on practices and student‐athlete health?”; 3—“How concerned are you about the effects of climate change on the long‐term success of your athletic program?”; and 4—“How concerned are you about the effects of climate change on practices and student‐athlete health?”
We conducted an exploratory factor analysis (EFA) on these items (a traditional approach when examining the reliability of a measure) to see if the items quantitatively load together (see DeVellis and Thorpe (2021)). We used eigenvalues greater than 1, principle axis factoring, and a varimax rotation for the EFA. This analysis generated one factor, using a cut on the scree plot, which accounted for 91% of the total scale variance. Thus, we averaged the items into one composite with good reliability (Cronbach's Alpha = 0.97).
2.1.2.2. Consider Composite
The Consider measure assessed if participants factored daily temperature and humidity levels into their practice decisions. It consists of two items, using a 3‐point scale: 1—Yes, 2—No, 3—I don't know. The items include: 1—“Do you/your school consider daily temperatures in decisions to hold practice?”; 2—“Do you/your school consider humidity levels in decisions to hold practice?” We averaged the two items together to generate one composite with good reliability (Cronbach's Alpha = 0.84).
2.1.2.3. Single Item Measures
The remaining items that we measured are single items, utilizing a variety of scales. They are listed here: 1—“Have you/your school ever canceled a practice due to high temperatures?” (1a—Yes, multiple times; 1b—Once or twice; 1c—Never; 1d—Unsure); 2—“Example scenario: it's 100°F outside. Do you…” (2a—Hold practice as normal, 2b—Adjust practice activities/duration, 2c—Move practice indoors, 2d—Cancel practice altogether); 3—“Are you aware of heat warnings issued by the NWS?” (3a—Yes, 3b—No); 4—“During a season, how often do you cancel practice for heat‐related reasons?” (4a—Never, 4b—Once or twice, 4c—Three to five times, 4d—More than six times); 5—“Do you have access to indoor climate‐controlled facilities?” (5a—Yes, 5b—No); 6—“Do athletes complain about temperature?” (6a—A great deal, 2b—A lot, 2c—A moderate amount, 2d—A little, 2e—Not at all).
2.2. Climate Model Simulations and Temperature Indices
This study utilizes open source, fully coupled numerical climate simulations from the CESM2 large ensemble to model the past, present, and future climate states through the year 2100 ([data set] Danabasoglu et al., 2020; Rodgers et al., 2021). CESM2 is a state‐of‐the‐art GCM developed at the National Center for Atmospheric Research. The data set consists of a 100‐member Large Ensemble at a horizontal resolution of ∼1° for the “current climate” (1850–2014) based on the historical radiative forcing, and the same number of members for the “future climate” (2015–2100) based on the SSP3‐7.0 radiative forcing scenario, which refers to +7 W/m 2 of radiative imbalance due to anthropogenic greenhouse gas emissions. We use this high‐emissions scenario given that emission trends over the past few decades track slightly above previously used business‐as‐usual radiative forcing, RCP8.5 (Peters et al., 2013). Here, we only use the 50‐member sub‐ensemble based on the original CMIP6 biomass burning emission protocols. Variables including reference height air temperature (2‐m temperature), maximum air temperature, and relative humidity were extracted for each model day. In our analysis, we compared the last 25 years of the 20th (1976–2000) and 21st centuries (2076–2100), labeled as current versus future. We assigned model grid cells to urban areas (e.g., Dallas or Houston) by minimizing the distance between the grid cell center and the given city location (a single grid cell per city).
To compare the results from CESM2 to alternative GCMs and forcing scenarios, we employ the Climate Model Intercomparison Project 6 (CMIP6 [data set] Eyring et al., 2016) multimodel ensemble, which was extracted via the Pangeo platform ([software] Eynard‐Bontemps et al., 2019). We used temperature data for two complementary emission scenarios, SSP2‐4.5 and SSP5‐8.5, for comparison. Note that the Pangeo CMIP6 model archive includes roughly 15 GCMs which contained the required temperature and humidity data (Text S5, Table S2 in Supporting Information S1). Surface temperature and relative humidity at 1,000 hPa were used to compute wet‐bulb temperature and heat index, following the methods described in Text S4 in Supporting Information S1.
Note that the horizontal resolution of the GCMs employed in this study is insufficient to resolve microclimate effects that can influence local manifestations of heat stress (e.g., CESM2 has ∼1° resolution), which may bias our results. For example, urban heat islands and other local land surface features are not captured in these GCM simulations, which omits fine‐scale patterns of near‐surface air temperature and humidity (Zhao et al., 2018). The impacts of these assumptions are discussed in Section 4.
To compare future projections of climate in Texas with past and current conditions, we calculated heat index (HI) and wet‐bulb temperature (T W B) from the climate model data and examined these metrics alongside raw mean and maximum temperature. Heat index estimates the equivalent human‐perceived temperature and can be calculated from the ambient air temperature (T) and relative humidity (RH, %) to represent how weather conditions feel in shaded areas. In direct sunlight, the apparent temperature may increase by up to 15°F. Specifically, the apparent temperature represents the temperature felt by a human body based on human heat balance principles; heat index is a simplified representation of apparent temperature that requires knowing only temperature and humidity (Rothfusz, 1990). Heat index is developed from multiple regression of temperature and humidity against apparent temperature (Vanos, Baldwin, et al., 2020).
We chose to include the heat index in this study in part because it is the measure used by most local offices of the NWS to make decisions about when to issue heat warnings. NWS states that heat indices at or above 103°F can lead to dangerous heat disorders with prolonged exposure and/or physical activity in the heat. However, heat‐related risk increases across a range of heat index values, and the values at which the heat index is dangerous varies widely by location (Gasparrini et al., 2015). In general, heat warnings are issued at lower values of the heat index in the northern United States and higher values in the southern United States (Hawkins et al., 2017; US Department of Commerce, n.d.‐a). In warm places like Texas, higher values of the heat index may be more strongly related to health outcomes. The NWS Southern Region has region‐specific criteria for Texas areas, including HGX (“Coastal Offices,” Houston), EWX (Austin, San Antonio), and FWD (“Non‐Coastal Offices,” https://www.weather.gov/images/srh/SRHeatCriteriaApril2016.JPG). In Houston, Austin, and San Antonio, heat advisories are issued for heat index greater than or equal to 108°F or temperatures greater than or equal to 103°F; excessive heat warnings are issued for heat index greater than or equal to 113°F or temperatures greater than or equal to 105°F (US Department of Commerce, n.d.‐a). In Dallas, the T HI values are slightly lower; heat advisories are issued for heat index greater than or equal to 105°F, or temperatures greater than or equal to 103°F; excessive heat warnings are issued heat index greater than or equal to 110°F, temperature greater than or equal to 105°F (US Department of Commerce, n.d.‐a).
All equations for combined temperature‐humidity metrics of heat stress are provided in the Supplemental Materials, Text S4 in Supporting Information S1, but we summarize these metrics here. We calculate heat index using the Steadman equation (Rothfusz, 1990) for temperatures below 80°F; the Rothfusz regression is employed when conditions of temperature and humidity yield a heat index value above 80°F (Rothfusz, 1990). Wet‐bulb temperature (T WB ) measures the temperature of an object undergoing evaporative cooling assuming a constant ambient air temperature and good air flow. Most cooling of the human body is mediated through sweating and its related evaporative cooling; therefore, T WB is an accurate tool for determining if there is a heat hazard present for humans (Buzan & Huber, 2020). We calculate T WB from ambient temperature (T) in degrees Celsius and relative humidity (RH%) using the Stull formula (Stull, 2011) (Supplemental Text S4 in Supporting Information S1). A T WB exceeding 95°F (35°C) for an extended period of time will put humans at risk of hyperthermia (Raymond et al., 2020; Rogers et al., 2021), a physiologic upper limit to survivability. However, we note that other health impacts are likely to occur at or before reaching these temperatures, especially if physical activity is involved (Vanos, Baldwin, et al., 2020). For example, recently, Vecellio et al. (2022) found that the 35°C T WB threshold may be too high in more realistic settings and varies depending on humidity; the critical threshold for heat tolerance in an experimental group of young, healthy adults was found to be 30–31°C T WB for warm‐humid conditions and ranged from 25 to 28°C T WB for various hot‐dry conditions.
Note that we employ both mean and maximum daily temperatures representing the hottest temperature of each day in each model month in our analyses. Daily maximum temperatures are the likely unit athletes and staff use in their decision‐making. Evaluating the changes in mean temperature shifts is also useful for understanding changes in temperatures over time.
3. Results
We first evaluate survey responses surrounding staff attitudes and concerns about heat (Section 3.1). Changes in climate for the state of Texas are reviewed to contextualize survey response results in Section 3.2. We evaluate three metrics: mean and maximum daily temperature, heat index, and wet‐bulb temperature. Temperature changes are evaluated geographically, and as time series to examine the evolution of temperatures in four cities (Houston, Austin, Dallas, and San Antonio) through 2100. We additionally provide probability density functions (PDFs) showing temperature shifts in the beginning and end of the 21st Century. Tables documenting current and future 90th and 99th percentile temperatures for the largest cities in Texas are also provided. Note that while considerable year‐to‐year variability (natural variability) is observed within individual ensemble members in the time series data, we here focus on the average of all 50 CESM2 ensemble members, which represents the forced response (or anthropogenic climate change signal) in temperature changes.
3.1. Survey Results: Attitudes Toward Heat and Athlete Safety
The coach attitudes and concerns subsection of the survey results describe our findings in terms of how athletic staff perceive climate versus heat in relation to student health and success of their athletic program, what their primary concerns are for their programs both at present and in the long term, and their thoughts on how extreme heat may affect the future of their programs. Note that additional survey details and results are given in Supplementary Text S1–S3 in Supporting Information S1.
3.1.1. Composite Results
We report data for a cross‐sectional survey assessing climate change‐related attitudes and behaviors of Texas high school and college athletic staff. As described in our initial hypotheses (Section 1), we expect athletic directors' attitudes to be related to their behaviors. For example, if staff report that they are concerned about temperature and climate change's effects on athlete health and athletic programs, we expect that they would also be more likely to cancel or alter practices due to temperature.
As summarized in Table 1, Table S1 in Supporting Information S1, and Figure 2, we observe a significant, positive correlation (0.159) between concern about temperature and climate change impacts and considering temperature and humidity in decisions to hold practice (Figure 4). This is consistent with our hypothesis H2a: concern over temperature and climate change should positively relate to taking these factors into consideration when making practice decisions. We also observed a significant, positive correlation between athletic directors' concern over and consideration of temperatures (0.337 and 0.399, respectively) and canceling practices due to high temperatures. Further, data indicated that athletic staff factor in the longevity of their program and their athletes' health (r = 0.16, p = 0.018, 95% C.I [0.028, 0.284]) when factoring temperature into decision making, including their decisions to cancel practice for high temperature (r = 0.34, p < 0.001, 95% C.I [0.216, 0.449]), and their perceptions that athletes complain about heat (r = 0.37, p < 0.001, 95% C.I [0.252, 0.478]). Yet, still, they reported being less likely to cancel practice at 100°F (r = −0.225), and rather opted to adjust activities (Figures 5b and 5d). It is possible we see this relationship because 100°F is simply not considered that hot in the locations we studied, which could explain the negative correlation between canceling due to high temperatures and canceling at 100°F. This potentially also drove the significant, negative correlation between this concern and the frequency with which they canceled practice (−0.425). Thus, while their athletes' health is a primary driver of their concern, so too is their concern over the longevity of their athletic program. For example, canceling practice more frequently may lead to decreased longevity in one's coaching career, particularly in Texas sports. Access to indoor facilities was not significantly related to concern regarding the longevity of programs and athletes health (related to temperature and climate change; p > 0.05). Finally, as shown in Figure 3, 99% of the sample report being aware of heat warnings issued by the NWS and 88% (196) of those participants state that they factor those warnings into decisions to cancel/modify practice.
Table 1.
Correlations of Coach and Athletic Director Responses
| Metric | μ | σ | Concern | Consider | Cancel high temperature | Cancel 100°F | Cancel often | Indoor access | Athletes complain |
|---|---|---|---|---|---|---|---|---|---|
| Concern (1–5 scale) | 2.97 | 1.12 | 1 | 0.159* | 0.337** | −0.225** | −0.425** | 0.111 | 0.370** |
| Consider (1–3 scale) | 1.33 | 0.41 | 1 | 0.399** | −0.264** | −0.283** | 0.114 | 0.135* | |
| Cancel High Temperature (1–4 scale) | 2.21 | 0.89 | 1 | −0.330** | −0.577** | 0.149* | 0.224** | ||
| Cancel 100 Degrees (1–4 scale) | 2.03 | 0.55 | 1 | 0.253** | −0.206** | −0.156* | |||
| Cancel Often (1–4 scale) | 1.56 | 0.67 | 1 | −0.074 | −0.333** | ||||
| Indoor Access (1–yes, 2–no) | 1.39 | 0.5 | 1 | 0.13 | |||||
| Athletes Complain (1–5 scale) | 3.38 | 0.97 | 1 |
Note. Correlation Table with variables including: level of concern of athletic staff toward impacts of temperature and climate change on athlete health and athletic program, consideration of temperature and climate warnings, canceling practice due to high temperatures, canceling practice when it is above 100°F, canceling practice often, having access to indoor facilities, and having athletes complain about temperatures.
Correlation Is Significant at p < 0.05
Correlation Is Significant at p < 0.01.
Figure 2.

(a) Level of concern on the impact of temperature on practices and student‐athlete health. (b) Level of concern on the impact of temperature on long‐term success of athletic program. (c) Level of concern for the impact of climate change on practices and student‐athlete health. (d) Level of concern for the impact of climate change on long‐term success of athletic program.
Figure 4.

Factors considered for holding practice (Consider Composite; see Table 1. (a) Decisions to hold practice based on daily temperatures. (b) Decisions to hold practice based on humidity levels. *Note that one person skipped (b) humidity question.
Figure 5.
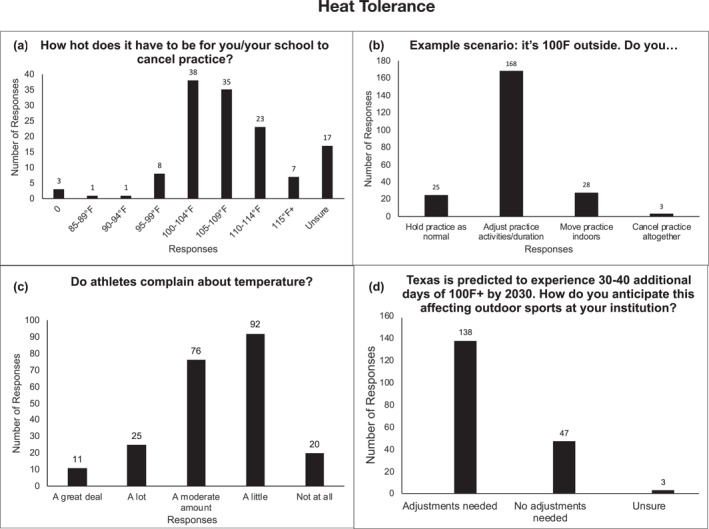
(a) Temperature threshold for canceling practice. (b) 100°F scenario. Reactive behavior during 100°F conditions regarding athletic practices. (c) Do athletes complain about temperature? (d) Anticipated effects of increased summer temperatures in Texas on outdoor sports. Responses to the projected scenario where Texas is predicted to experience 30–40 additional days of 100°F+ weather by 2030. Are adjustments/adaptation needed?
Figure 3.

(a) Coach awareness of National Weather Service (NWS) heat warnings. (b) Use of NWS warnings in the decision‐making process to modify or cancel practice. (c) Have athletic staff ever canceled practice due to temperature. (d) Frequency practice cancelations due to high temperatures. *Note that one person skipped (d) frequency of practice cancelations question.
The responses to individual survey questions contain item‐level trends, which could arguably have a reliability issue (e.g., individual‐level items can be idiosyncratic). We thus limit our discussion to general takeaways (and see Supplementary Materials, Text S3, Figures S4–S12 in Supporting Information S1 for more information). Despite the dangerous impacts that high temperatures and humidity have on humans, only 54% of survey respondents indicated that they take humidity into account when deciding whether to host practice for athletes or not (Figure 4b). However, 88% of respondents do utilize the heat warnings issued by the NWS to determine whether or not to host practice, which do account for humidity via the use of the heat index (Figures 3a and 3b). This discrepancy suggests that there may be a lack of understanding among athletic staff in how humidity affects perceived temperature.
Regarding athletic staff attitudes toward hosting practices in hotter temperatures due to climate change, frequent responses included adjusting practice time (to early morning or later in the evening), moving practices indoors, and modified practices (more water breaks, less intense practices, equipment changes, and heat acclimation) (Figure 5, Figure S12 in Supporting Information S1). Other responses regarded warming temperatures as irrelevant either because their sport season does not occur in the summer or they do not anticipate warming to occur.
Perhaps most interesting is the fact that athletic staff placed heavier emphasis on and were more concerned about the impact of temperature rather than climate change (Figure 2, Text S3 in Supporting Information S1). Temperature and climate change are fundamentally different concepts (i.e., temperature can be interpreted to be about present‐day temperature and its variations, while climate change focuses on the future). Differences may stem from perceived short‐versus long‐term impacts on programs rather than the choice of terminology. However, we cannot rule out that the response differences may be driven by differences in participant beliefs in climate change. With respect to the effects of these two factors on student‐athlete health, the most common response (38%) was “very concerned” with the effect of daily temperatures, while the most common response (30%) was “not concerned at all” with the effect of climate change (Figures 2a and 2c). A similar observation emerges comparing the responses to the level of concern about temperature and climate change on the future of athletic programs. The highest number of responses (29%) was “moderately concerned” and the second highest (21%) was ”very concerned” about the impact of temperature, while the highest number of responses (32%) were, once again, “not concerned at all” about the impact of climate change (Figures 2a and 2c). These results indicate partial support for Hypothesis H2b, athletic staff are largely not concerned about temperature and/or climate change.
3.2. Projected Changes in Extreme Heat in Texas Over the 21st Century
3.2.1. Geographic Changes in Temperature
Spatial projections of temperature across the state of Texas indicate heterogeneous warming through the 21st century (Figures 6, 7, 8). We first evaluate 2‐m air temperatures. We extracted daily mean (T MEAN) and daily maximum temperatures (i.e., the hottest temperature during the day, T MAX) for summer months (June–July–August, JJA) at all model grid points. Figure 6b shows that average summer air temperatures over Texas regularly exceed 90°F by end‐of‐century; Figures 6c and 6f further indicate that the changes in mean temperatures range from +6 to +8.5°F with maximum increases in north and west Texas. Notably, maximum daily temperatures (Figure 6e) exceed ∼100–104°F almost everywhere in Texas by 2076–2100.
Figure 6.

Temperature changes across Texas in the 21st century. Shown are the June‐July‐August mean 2‐m air temperatures (a–c) and monthly maximum 2‐m air temperatures (d–f); (a), (d) Show the current climate, defined as 1976–2000; (b), (d) show the future climate, defined as 2076–2100; (c), (f) show the difference between the two periods (future minus current).
Figure 7.

Heat index changes across Texas in the 21st century. Shown are the June‐July‐August mean heat index values (a–c) and monthly maximum heat index values (d–f); (a), (d) Show the current climate, defined as 1976–2000; (b), (d) show the future climate, defined as 2076–2100; (c), (f) show the difference between the two periods (future minus current).
Figure 8.

Wet‐bulb temperature changes across Texas in the 21st century. Shown are the June‐July‐August mean wet‐bulb temperatures (a–c) and monthly maximum wet‐bulb temperatures (d–f); (a), (d) Show the current climate, defined as 1976–2000; (b), (d) show the future climate, defined as 2076–2100; (c), (f) show the difference between the two periods (future minus current).
Similarly, Figure 7 shows the changes in heat index across Texas by the end of the 21st century, which considers the joint impacts of humidity and temperature. Heat index values are averaged over summer months (JJA) and are shown for current (1976–2000, a, d) and future (2076–2100, b, e) climates as well as the change in heat index between the current and future climates (c, f). Coastal regions along the Gulf of Mexico are projected to experience the greatest increase in average heat index with a net change of 14–16°F. The southern region of Texas along the Mexican border shows the largest increase in maximum daily heat index for T MAX (Figure 7f) with values rising by up to 22°F. These changes in heat index are substantial and indicate maximum summer heat index values exceeding 110°F for most of the state by end‐of‐century.
Finally, we show the change in wet‐bulb temperatures in Figure 8. Again, due to elevated humidity, the highest wet‐bulb temperatures are found along the Gulf Coast in both current and future climates with future climates exhibiting wet‐bulb temperatures 5–6°F warmer than present. Wet‐bulb temperatures decrease from east to west roughly as a function of longitude (Figures 8a, 8b, 8d, 8e), which corresponds to the strong precipitation gradient across Texas (Nielsen, 2018). The largest increases in the wet‐bulb temperature occur through the west‐central regions of the state by the end of the 21st century. JJA wet bulb temperatures calculated from daily maximum temperatures remain below the survivability threshold of 95°F by end‐of‐century (Figure 8e).
3.2.2. Probability Density Functions
To further compare the current and future climate in Texas, we use PDFs to examine how the distribution of temperatures is expected to change. PDFs for summer (JJA) daily temperatures, heat indices, and wet bulb temperatures are shown in Figures 9 and 10. Figure 9 shows current and future PDFs for Houston, Austin, San Antonio, and Dallas using JJA daily mean temperatures (a, d, g, j), heat index (b, e, h, k), and wet‐bulb temperature (c, f, i, l). Unsurprisingly, in all cities, mean summer temperatures shift toward hotter temperatures; PDFs consistently indicate increased probability of higher temperatures in the future across Texas. The largest shifts occur for heat index values, which regularly exceed 110°F in all cities by 2076–2100 (Figures 9b, 9e, 9h and 9k). Note that Austin's air temperatures by end‐of‐century exceed those of Houston (Figures 9a and 9g); however, when humidity is considered using heat index, Houston's distribution for T HI (Figure 9b) exceeds that of Austin (Figure 9h).
Figure 9.
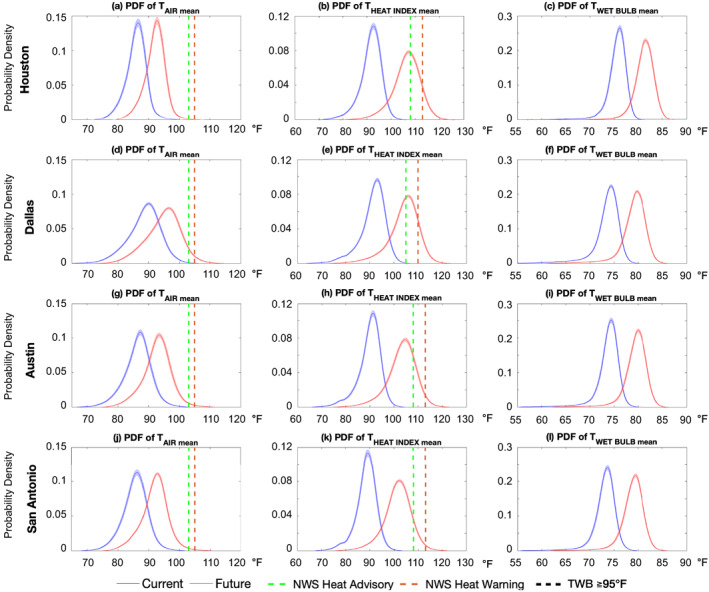
Current and future probability density functions of heat metrics for the four largest cities in Texas from Community Earth System Model version 2 June‐July‐August projections, calculated from daily mean temperatures. Current probability density functions (PDFs) in blue are based on data from 1976 to 2000, and the future PDFs in red are based on data from 2076 to 2100. Left column: air temperature; middle column: heat index; right column: wet bulb temperature. Cities are demarcated on the y axis. NWS heat advisory (green dashed line); NWS heat warning (red dashed line).
Figure 10.
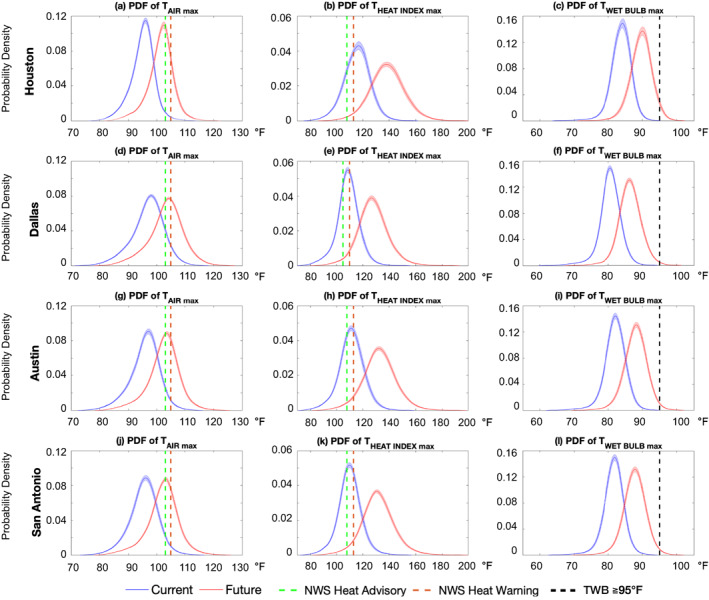
Current and future probability density functions of heat metrics for the four largest cities in Texas from Community Earth System Model version 2 June‐July‐August projections, calculated from daily maximum temperatures. Current probability density functions (PDFs) in blue are based on data from 1976 to 2000, and the future PDFs in red are based on data from 2076 to 2100. Left column: air temperature; middle column: heat index; right column: wet‐bulb temperature. Cities are demarcated on the y axis. NWS heat advisory (green dashed line); NWS heat warning (red dashed line). The black‐dashed line indicates the T WB survivability limit.
The PDFs for maximum daily temperatures show much larger changes (Figure 10). Raw temperatures (Figures 10a–10d) shift toward means and extremes >10°F hotter than the current climate with future temperature averages centered on approximately 105°F in all four cities. As mentioned above, T WB > 95°F is generally considered a physiological limit for heat dissipation. Panels (c, f, i, l) show that in all four cities, the upper tails of the maximum monthly summer wet bulb temperatures all exceed 95°F. The heat index calculations are even more striking: Figures 10b, 10e, 10h, 10k show heavy skew toward extremely high T HI−MAX values in all four cities, exceeding 150°F regularly. Given that (a) heat index values above 113°F (110°F) result in heat and excessive heat warnings in Houston, San Antonio, Austin (and Dallas) and are considered dangerous, and (b) wet bulb temperatures are projected to exceed 95°F, these results provide a stark warning of future high heat extremes in the state's major metropolitan areas. An important caveat to interpreting the absolute quantitative values of these projections is that nonlinearity of the temperature‐humidity metrics creates sensitivity to the temporal resolution of the data used for analysis. Using higher temporal resolution data (e.g., 6‐hourly) or calculating heat index and wet bulb temperature as diagnostics on the GCM model timestep using HumanIndexMod, for example, (Buzan et al., 2015), might reduce these values. Nevertheless, the large shift in extremes between the two periods is striking, and qualitatively robust.
3.2.3. Time Series
Finally, the averages of daily mean and daily maximum temperature during each summer in the four largest cities in Texas were analyzed as time series in CESM2 over the 21st century (Supplemental Figures S1–S3 in Supporting Information S1). Specifically, we averaged summer (June‐August, JJA) daily temperatures (T MEAN), and then additionally averaged the daily maximum temperatures (JJA, T MAX). Both T MEAN and T MAX are plotted for the years 2000–2100. Panels a–d show the evolution over time of the summer high temperatures for Houston, Austin, San Antonio, and Dallas, respectively. For all three temperature metrics and in all four cities, temperatures show a steady linearly‐increasing trend in heat from 2000 to 2100. Figure S3 in Supporting Information S1 in particular shows the time series of T WB change; JJA‐mean wet‐bulb temperatures calculated from daily maximum temperatures in all cities are at least 5°F below the physiological threshold for humans of 95°F by end‐century. However, as the PDFs in Section 3.2.2 indicate, the variability around these mean values can still yield intermittent temperature spikes above the 95°F survivability threshold.
Finally, all daily temperatures were analyzed in each city to produce 90th and 99th percentiles for the current (1976–2000) to future (2076–2100) climate scenarios. Tables 2 and 3 provide the change in the 90th and 99th percentiles of daily mean and maximum temperatures, respectively. Tables 2 and 3 additionally include heat metrics for hotter and drier major cities in Texas (Lubbock, El Paso, Midland/Odessa, and Abilene) for completeness. Temperatures are projected to increase by approximately 5–7°F in Houston, Austin, San Antonio, and Dallas. In all four cities, heat index values at both the 90th and 99th percentile in the future scenario are regularly above the 108/113 threshold for NWS heat warnings in Houston, Austin, and San Antonio and the 105/110 threshold for Dallas. In west and north Texas cities (Lubbock, El Paso, Midland/Odessa, and Abilene), average heat index values (Table 2) increase by even larger amounts, up to 13°F; maximum T HI changes (Table 3) in these cities are closer to ∼+30°F. Note that the physiological T WB value of 35°C is approximately 95°F; a threshold closer to 30.5°C (or lower for hot‐dry climates) measured in Vecellio et al. (2022) is about 87°F. This threshold is exceeded in maximum summer temperatures projected for every single city, no matter its average climate, except for El Paso (Table 3, T WB−MAX 99).
Table 2.
The 90th and 99th Percentiles of Average Daily Mean Summertime Temperatures in Current (1976–2000) and Future (2076–2100) Climates of Texas Cities (°F) and Heat Stress Metrics Calculated From These Temperatures
| City | T MEAN 90 | T MEAN 99 | T WB−MEAN 90 | T WB−MEAN 99 | T HI−MEAN 90 | T HI−MEAN 99 |
|---|---|---|---|---|---|---|
| Houston | Current: 89°F | Current: 94°F | Current: 77°F | Current: 77°F | Current: 96°F | Current: 99°F |
| Future: 95°F | Future: 99°F | Future: 84°F | Future: 85°F | Future: 112°F | Future: 117°F | |
| Dallas | Current: 94°F | Current: 99°F | Current: 76°F | Current: 77°F | Current: 97°F | Current: 100°F |
| Future: 100°F | Future: 106°F | Future: 82°F | Future: 83°F | Future: 110°F | Future: 115°F | |
| Austin | Current: 91°F | Current: 96°F | Current: 76°F | Current: 77°F | Current: 94°F | Current: 98°F |
| Future: 97°F | Future: 103°F | Future: 82°F | Future: 83°F | Future: 109°F | Future: 114°F | |
| San Antonio | Current: 90°F | Current: 94°F | Current: 75°F | Current: 77°F | Current: 93°F | Current: 96°F |
| Future: 96°F | Future: 102°F | Future: 81°F | Future: 83°F | Future: 107°F | Future: 113°F | |
| Lubbock | Current: 90°F | Current: 99°F. | Current: 71°F | Current: 73°F | Current: 89°F | Current: 92°F |
| Future: 98°F | Future: 103°F | Future: 77°F | Future: 79°F | Future: 100°F | Future: 104°F | |
| El Paso | Current: 88°F | Current: 91°F | Current: 68°F | Current: 70°F | Current: 85°F | Current: 88°F |
| Future: 97°F | Future: 101°F | Future: 74°F | Future: 76°F | Future: 96°F | Future: 100°F | |
| Midland/Odessa | Current: 90°F | Current: 94°F | Current: 71°F | Current: 73°F | Current: 87°F | Current: 92°F |
| Future: 98°F | Future: 103°F | Future: 77°F | Future: 79°F | Future: 101°F | Future: 105°F | |
| Abilene | Current: 92°F | Current: 96°F | Current: 73°F | Current: 74°F | Current: 91°F | Current: 95°F |
| Future: 99°F | Future: 104°F | Future: 78°F | Future: 80°F | Future: 103°F | Future: 108°F |
Note. All temperatures/numbers are in degrees Fahrenheit (°F). 90th and 99th percentiles are labeled as 90 and 99, respectively.
Table 3.
The 90th and 99th Percentiles of Average Daily Maximum Summertime Temperatures in Current (1976–2000) and Future (2076–2100) Climates of Texas Cities (°F) and Heat Stress Metrics Calculated From These Temperatures
| City | T MAX 90 | T MAX 99 | T WB−MAX 90 | T WB−MAX 99 | T HI−MAX 90 | T HI−MAX 99 |
|---|---|---|---|---|---|---|
| Houston | Current: 99°F | Current: 105°F | Current: 86°F | Current: 89°F | Current: 123°F | Current: 134°F |
| Future: 106°F | Future: 112°F | Future: 93°F | Future: 95°F | Future: 151°F | Future: 165°F | |
| Dallas | Current: 103°F | Current: 109°F | Current: 84°F | Current: 87°F | Current: 117°F | Current: 129°F |
| Future: 110°F | Future: 117°F | Future: 90°F | Future: 94°F | Future: 140°F | Future: 157°F | |
| Austin | Current: 101°F | Current: 107°F | Current: 85°F | Current: 88°F | Current: 120°F | Current: 131°F |
| Future: 108°F | Future: 114°F | Future: 91°F | Future: 95°F | Future: 145°F | Future: 162°F | |
| San Antonio | Current: 101°F | Current: 107°F | Current: 84°F | Current: 88°F | Current: 118°F | Current: 131°F |
| Future: 108°F | Future: 115°F | Future: 91°F | Future: 95°F | Future: 144°F | Future: 162°F | |
| Lubbock | Current: 102°F | Current: 108°F | Current: 80°F | Current: 85°F | Current: 108°F | Current: 120°F |
| Future: 111°F | Future: 117°F | Future: 86°F | Future: 92°F | Future: 128°F | Future: 150°F | |
| El Paso | Current: 99°F | Current: 103°F | Current: 76°F | Current: 80°F | Current: 100°F | Current: 106°F |
| Future: 108°F | °FFuture: 113°F | Future: 82°F | Future: 86°F | Future: 116°F | Future: 128°F | |
| Midland/Odessa | Current: 101°F | Current: 106°F | Current: 80°F | Current: 84°F | Current: 107°F | Current: 118°F |
| Future: 110°F | Future: 116°F | Future: 86°F | Future: 91°F | Future: 128°F | Future: 146°F | |
| Abilene | Current: 103 | Current: 110°F | Current: 82°F | Current: 86°F | Current: 113°F | Current: 127°F |
| Future: 111°F | Future: 118°F | Future: 88°F | Future: 93°F | Future: 133°F | Future: 154°F |
Note. All temperatures/numbers are in degrees Fahrenheit (°F). 90th and 99th percentiles are labeled as 90 and 99, respectively.
3.2.4. Sensitivity to GCM and Carbon Emissions Scenario
As described above, CESM2 is used in this study to model future temperature scenarios for Texas between 2076 and 2100 under the SSP3‐7.0 emission scenario. The CESM2 ensemble accounts for irreducible uncertainty due to internal variability, but neglects structural uncertainty associated with our imperfect understanding of the climate system and computational constraints. It also neglects scenario spread associated with uncertainty in future carbon emissions trajectories. An ensemble of multiple GCMs forced with different emissions scenarios, such as the Coupled Model Intercomparison Project (CMIP), provides an opportunity to evaluate this structural and scenario uncertainty and the robustness of CESM2 projections (IPCC, 2013). Furthermore, while SSP3‐7.0 is plausible, the use of different emissions scenarios, such as a lower (SSP2‐4.5) and higher (SSP5‐8.5) forcing applied through 2100, provides a lens into the reduced temperature benefits of climate mitigation efforts.
Thus, we recomputed the PDFs described in Section 3.2.2 (Figures 9 and 10) using the CMIP6 model output for the two additional emissions scenarios. Figure 11 shows PDFs of summer temperature for the CMIP6 model ensemble for SSP2‐4.5, a lower emissions scenario (Figure 11, magenta line) and SSP5‐8.5, a higher emissions scenario (Figure 11, red line). The average of all the models' PDFs is shown as the multimodel average, and the shading represents the standard error among the model ensemble members. The summer temperature projections in the CMIP6 ensemble data are broadly consistent with those of CESM2: average air temperatures, heat index values, and wet bulb temperatures rise substantially in the future (Figure 11). In agreement with the CESM2 PDFs shown in Figure 9, heat index values regularly exceed 113°F in all four cities, even in the lower emissions scenario SSP2 (Figures 11b, 11e and 11h, 11k, magenta line). For the higher emissions scenario SSP5 (Figures 11b, 11e and 11h, 11k, red line), the average heat index values are approximately 125°F for Dallas, Austin, and San Antonio, 12°F above the NWS heat warning levels. Note that the CMIP6 ensemble T HI values are comparable to the average CESM2 T HI for these four cities shown in Figure 9, indicating that CESM2 is consistent with average IPCC model projections. Finally, and crucially, in SSP2‐4.5 (Figures 11c and 11f, 11i, 11l, magenta line), wet‐bulb temperatures very rarely exceed the 95°F physiological limit; by contrast, in SSP5‐8.5 (Figures 11c, 11f and 11i, 11l, red line), the PDFs' upper tails for all four cities exceed 95°F, indicating that critical differences in dangerous heat conditions emerge depending on future carbon emission scenarios.
Figure 11.

SSP2‐4.5 and SSP5‐8.5 current and future probability density functions of heat index for the four largest cities in Texas (Climate Model Intercomparison Project Model output multimodel average, June‐July‐August). Current probability density functions (PDFs) in blue are based on data from 1976 to 2000, and the future PDFs in magenta (SSP2) and red (SSP5) are based on data from 2076 to 2100. Left column: air temperature; middle column: heat index; right column: wet‐bulb temperature. Cities are demarcated on the y axis. The average of all the models' PDFs is shown as the multimodel average, and the shading represents the standard error among the models. NWS heat advisory (green dashed line); NWS heat warning (red dashed line). The black‐dashed line indicates the T WB survivability limit.
4. Discussion
This work evaluated future heat projections through the lens of athlete health risks; using an interdisciplinary and novel approach, we assessed attitudes from athletic communities toward climate change and juxtaposed those survey results with regional future heat projections. We examined future projections for temperature, heat index, and wet‐bulb temperature in Texas under a high emissions scenario (SSP3‐7.0) relative to current climate conditions. Using the coupled GCM CESM2, we compared two key 25‐year periods: 1976–2000 (a base control representing current climate) and 2076–2100 (end of the twenty‐first century representing future climate). We also contextualized these projections against results from the CMIP6 multimodel ensemble with two contrasting high‐ and low‐emission scenarios. These data were further subdivided by city to create a finer‐grained understanding of how temperature and humidity conditions are expected to change. We also conducted a survey of over 200 high school and university athletic staff members across the state of Texas to gain insight into how athletic programs currently function with respect to extreme heat, and the short‐ and long‐term attitudes and concerns held by the athletic staff with respect to the impact of temperature on their programs. Here, we review our results and their implications for human health and outdoor sports in the context of a rapidly changing climate.
4.1. Climate Projections for Texas in the 21st Century
Temperature, heat index, and wet‐bulb temperatures are projected to increase in Texas by the end of the twenty‐first century. On average, ambient mean summer temperatures are expected to rise by approximately 6–8°F by 2100 (Figure 6), reaching 105°F in Houston, Austin, San Antonio, and Dallas (Figure 9, S1 in Supporting Information S1). Accounting for natural variability, these changes could realistically result in temperature changes exceeding more than 10°F by end‐of‐century. Similarly, maximum heat index and wet‐bulb temperatures, both of which account for humidity, are expected to increase by 15–23°F (Figure 7f.) and 5–6°F (Figure 8f.), respectively. Summertime maximum heat indices regularly exceed thresholds for NWS heat advisory (T HI >= 108°F) and excessive heat warning (T HI >= 113°F); local warnings are issued at even lower values for the Dallas area (NWS‐FWD), T HI >= 110°F (US Department of Commerce, n.d.‐a).
We interrogated future temperature projections as maps, time series, PDFs, and as raw values in Tables 2 and 3 to provide a comprehensive view of the Texas temperature projections. From a health perspective, all metrics are meaningful; however, the PDFs of heat metrics are likely most relevant, given that exposure to even a single day's worth of extremely high temperature can have substantial impacts on health (Gasparrini et al., 2015). The PDFs show the full range of daily heat metrics for all summer days; by contrast, the time series show the JJA seasonal averages of daily mean and maximum temperatures, averaging out extreme temperatures captured by the distribution. The PDFs from both CESM2 and the CMIP6 model ensembles show the probability that wet bulb temperatures will exceed 95°F during the 21st century. The sections of the distribution exceeding T WB = 95°F are small (Figures 10 and 11), but far from negligible. Sherwood and Huber (2010) argue that, based on human energy budget considerations, a 4–6 hr‐long exposure >95°F/35°C wet‐bulb temperature would be fatal. Thus, to have a large impact on heat stress requires only relatively short‐duration periods above this temperature. Thus, we assert that both measures (time series and maps vs. PDFs) are important but imply different things: the mean projections suggest that these locations remain habitable, but the distribution suggests that adaptation is going to be necessary for outdoor activities (like sports) for many days in the summer.
4.2. Attitudes Toward Temperature, Climate Change, and Athlete Health
Our climate projections provide context for interpreting the results of our survey, which examines athletic staff attitudes toward the impact of high temperatures and climate change on their programs (Table 1, and Figures 1, 2, 3, 4, 5). Concerns over athlete health were hypothesized to correlate with their behaviors of actually canceling practices due to high temperatures. Two key concepts/terms, temperature versus climate change, were differentiated in our questions purposefully. When athletic staff are asked to consider “temperature,” they are likely to consider daily threats to their programs. By contrast, when considering “climate change,” athletic staff may be prompted to think solely about future threats. The differences in responses to the two terms may be due to the fact that athletic staff are more concerned about present‐day effects rather than effects that seem far off in the future. Weather variations could also be large compared to the increases due to climate change (though this is not addressed here).
In terms of practice cancellation, there is a broad disconnect between attitudes toward temperature and heat‐related events and actions in response to these events (e.g., Figures 3d, 5). While 88% of respondents report considering temperatures when deciding to hold practices, only 1% of respondents report canceling practice if the temperature was 100°F outside (Figure 5b). Comparing attitudes toward temperature and the reality of when it becomes dangerous for human health (T = 103°F), we found that only 17% of respondents consider 100–104°F to be the threshold temperature for when to cancel practice (Figure 5a); a majority said they would only cancel practice at even higher temperatures.
In Texas, the NWS issues heat advisories when the heat index exceeds 108–110°F or temperature exceeds 103–105°F (depending on region), implying a human health hazard above those temperatures; a T WB of 95°F is considered the upper limit of survivability for humans. Further, health impacts are likely at or before reaching the most extreme heat thresholds, especially if physical activity is involved. Vecellio et al. (2022) found that the 35°C limit may be too high in both warm‐humid and hotter, drier environments (conditions which essentially encompass most Texas cities) and found a critical threshold for heat exposure closer to 30.55 ± 0.98°C in warm‐humid climates due to increased skin heating and limited variation in sweat rates. Thus, the observed status of attitudes toward practice cancellation in response to heat is concerning: wet‐bulb temperatures and heat indices are projected to increase dramatically in the future throughout Texas (Lutsko, 2021). Taken together, our results suggest there is a large, urgent need for further education among Texan athletic staff about the role of humidity in heat stress to promote accurate adaptation of practices in a warming climate.
4.3. Caveats and Future Work
We acknowledge important limitations of this study and directions for future work, which we separate for the survey and the climate model projections for clarity.
4.3.1. Survey
Our survey results include a relatively small sample size of 299 respondents that were not required to answer each question (we had N = 224 with complete data on our key variables of interest). Specifically, two of our survey questions were directed to a subsample and yielded fewer than 200 responses, limiting our sample size in response to some items. In addition, our low survey response rate (8%) of those we solicited may be due in part to the time of year in which the study was conducted (January–April), as many athletic staff are also full‐time teachers. Given the relatively small sample, our survey responses may not be representative of all athletic staffs in Texas, especially considering that we focused efforts on distribution in metropolitan areas (i.e., Houston, Austin, Dallas, and San Antonio). In the future, we hope to expand this work to conduct a larger‐scale study, exploring whether the same distribution of answers applies throughout Texas.
The voluntary nature of the survey may also skew our results toward athletic staff who are already interested in heat policy and therefore more interested in taking the survey. The survey was designed as a convenience sample (i.e., we accepted responses from any coach who provided them). This has two important implications: (a) We are not able to tell if the athletic staff who responded represent the general population of athletic staff in terms of sport, season, geographic location, etc., and (b) it is possible that athletic staff who self‐select and take the survey are more likely to have certain attitudes (e.g., thinking climate change is important) rather than athletic staff who chose not to take it. Sampling bias is possible if athletic staff who participated are more concerned about the implications of future climate change, and would cause underrepresentation of the quantity of athletic staff who reject the fact that is climate change. Thus, these data may have yielded a relatively conservative test of our main research questions.
Finally, while we did prompt athletic staff with plausible projections for the number of days over 100°F by 2030 (see Figure 5d), we did not provide the maps, time series, or PDF data to participants prior to taking the survey. This was due to the fact that we evaluated multiple sets of climate model results throughout the project as model data availability increased (e.g., the CESM2 large ensemble was released after the survey was completed). Providing the data given in Figures 6, 7, 8, 9, 10, 11 to participants in advance may change the survey outcomes and forms the basis for further study. More broadly, providing this information to athletic staff is also an important step for future work in outreach and communication.
4.3.2. Climate Model Results
The main GCM employed in this work (CESM2) has a horizontal resolution of approximately 1° × 1°, and the CMIP6 GCMs have varying but comparable resolutions. This is insufficient to resolve micro‐climate effects such as urban heat islands, which are important drivers of near‐surface air temperature on human‐relevant spatial scales. While a single model grid point can provide projections of temperature and heat index, these values may vary dramatically at the sub‐grid scale as a function of the above‐mentioned micro‐climate effects. For example, thermal comfort in a practice field in an urban area surrounded by pavement, versus a practice field in a less developed area surrounded by open fields and trees, could vary greatly, and we are unable to resolve these differences with GCMs.
The climate analysis in this study focuses on temperature and humidity in one climate model ensemble (CESM2, N = 50 ensemble members). As we are using SSP3‐7.0, the highest “business as usual” emission scenario, it follows that the results generated with these data represent a hotter scenario of possible future climate. Furthermore, previous research does indicate that, among other IPCC‐class GCMs, the equilibrium climate sensitivity in CESM2 is on the high‐end compared to other models (5.3 K for a doubling of CO 2) (Gettelman et al., 2019). To address this uncertainty, we compared the CESM2 output to CMIP6 temperature projections under two complementary forcing scenarios, SSP2‐4.5 and SSP5‐8.5 (Figure 11), which bracket the SSP3‐7.0 forcing used in the CESM2 large ensemble simulations. As described in Section 3.2.4, the results suggest that a lower emission pathway (SSP2‐4.5) drastically reduces the risk of exposure to wet‐bulb temperatures T WB exceeding 95°F.
Concerted mitigation efforts to lower emissions will decrease health risks. To this end, further comparisons of temperature and humidity across various models and across lower emission scenarios would thus enhance the work presented here. Analyzing T HI and T WB at the model time step (1‐hourly, 6‐hourly) or calculated directly by the model using HumanIndexMod, for example, (Buzan et al., 2015) would also enhance this work, given the nonlinearity of these metrics and complex subdaily relationship between temperature and humidity (Buzan et al., 2015). Buzan et al., (2015) also note that the Stull (2011) TWB formula is inaccurate in drier climates and overestimates wet bulb temperatures compared to the formulation presented in Davies‐Jones (2008); thus, for west and north Texas cities (drier climates), our wet bulb temperature estimates may be slightly high. Sensitivity to both heat index and wet bulb temperature formulations can and should be addressed in future work.
Finally, we focused on magnitude of daily heat metrics, but our work could be expanded to consider heat duration, which also plays an important role in heat stress (Baldwin et al., 2019). While high temperatures are expected to increase incidence of heat stroke/EHI, this study does not analyze mortality/morbidity explicitly. Future work might seek to quantitatively project EHI in the context of a warming climate. Our survey results indicate that athletic staff anticipate the need for adaptation (Figure 5d), and that a majority are discussing temperature issues with school officials (Figure 1c). Future generations could potentially become acclimatized to a warmer climate alongside increased access to climate‐controlled facilities and other adjustments (e.g., Figure 1, S12 in Supporting Information S1), hopefully reducing risk.
4.4. Climate Change Adaptation and Mitigation Policy Implications
Extreme heat events are projected to increase globally, especially in high‐emission scenarios (e.g., Figure 11). While these impacts are well‐known and widely documented in previous work (e.g., IPCC, 2013, and IPCC AR6, in press), the survey results presented here underscore novel implications for how scientists must work with decision‐makers and local community members in the arena of Texas athletics. As mentioned above, guidelines are in place to prevent EHIs (Cooper et al., 2020; Hosokawa et al., 2019; Scarneo‐Miller et al., 2020), including via the National Athletic Trainers' Association (Casa et al., 2015), and the University Interscholastic League (UIL, n.d.), but further outreach is required to establish, educate about, and enforce local policies and public health interventions to reduce risk. Individual college athletic programs generate hundreds of millions of dollars in revenue per year (UT Football revenue topped $200 million in 2020 alone, Davis, 2021). Public health policy interventions are necessary both to protect athletes' health and to help ensure the longevity and continued economic and cultural value of athletic programs in Texas.
As shown in Figure 11, the differences in temperature projections with and without carbon emissions mitigation are stark. In a lower forcing scenario (SSP2‐4.5), wet‐bulb temperatures rarely (if ever) exceed physiological survivability limits, even in the summer, but in a higher forcing scenario (SSP5‐8.5), the physiological limit is intermittently exceeded. The comparison between these different climate projection results is highly relevant for policy makers, and in the context of this study, the possible implications for sports are clear: mitigation reduces athlete health risks. This physiological limit is highly conservative, and exertional heat impacts become substantial well below this value, especially in hot and humid conditions, making mitigation all the more critical (Vanos, Thomas, et al., 2020; Vecellio et al., 2022). The importance of communicating the connections between mitigation and heat exposure to local policy makers cannot be understated: beyond the athletic staff community, local leaders and stakeholders must be informed about the risks of exposure to extreme heat and the possible implications for the athletics industry as a whole if carbon emissions are not abated.
5. Conclusions
Summer temperatures across Texas are expected to increase in the next century. Changes in humidity will compound with increasing temperatures, resulting in wet‐bulb temperatures and heat index values that exceed existing guidelines for heat stress safety. Utilizing climate simulations from CESM2 and the CMIP6 model ensemble to model past, present, and future climate states through the year 2100, the evidence for a changing climate in Texas is clear (supporting Hypothesis H1 A ). The consequences of these climate projections include more adverse effects on human health, especially for student athletes during the hottest months of the year. Currently, heat stroke is one of the leading causes of death among high‐school athletes (Yeargin et al., 2019). With the increasingly extreme heat conditions, the rate of heat stroke is likely to worsen in the future.
The results of this study suggest the vast majority of trainers do consider temperature as a risk factor, indicating a baseline level of awareness of heat impacts that could be built upon for climate change adaptation (providing support for Hypothesis H2 A ). However, only 54% consider humidity. Furthermore, despite the dangers a changing climate poses for student athletes, concern about the impacts of climate change with regard to athletic training is currently limited (offering limited support for Hypothesis H2 B ). The lack of awareness and/or initiative to plan for a hotter, more humid future is concerning when considering the potential impacts on student athlete health: adjustments must be made including but not limited to rescheduled/canceled practices, increased hydration, transition to indoor facilities, and adjusted exercise regimens. Such decisions are likely to be required in the future to save lives and prevent EHI‐related adverse health impacts.
This analysis of attitudes toward climate change from athletic staff alongside projected climate changes in Texas necessitates a pointed response from athletic programs. A challenge exists in the timescale of projections, which often exceeds the timescale of school strategic planning. Nevertheless, a key result emerges in the differences in heat extremes in lower (SSP2‐4.5) and higher (SSP5‐8.5) emission scenarios, and these divergent estimates of heath risks should be communicated to local stakeholders. Future work should enhance climate projections to more rigorously model physiological response to heat stress while exercising and could explore how educating athletic staff about these climate change projections changes their decision‐making and awareness of heat stress. Our work takes a first step toward merging climate and social science data to anticipate and plan for societal response to extreme heat in the future, specifically regarding collegiate and high‐school student athletes. We hope that this and other forthcoming studies may contribute to critical public education on heat extremes and athlete health risks.
Conflict of Interest
The authors declare no conflicts of interest relevant to this study.
Supporting information
Supporting Information S1
Acknowledgments
This work was spearheaded by a team of undergraduate researchers at Rice University, who were supported by grants from the Rice Office of Undergraduate Research and Inquiry. S. Dee acknowledges funding from Rice University. We thank Adam Krueger (Chief Meteorologist at CW39‐Houston), Dan Reilly (Warning Coordination Meteorologist, National Weather Service (NWS) Houston/Galveston), and Eric Berger (Senior Space Editor, Ars Technica; Space City Weather) for help obtaining regional heat warning information from the NWS. We additionally thank Dr. Gabriel Vecchi and Dr. Jonathan Moch for conversations, which inspired this study at the Princeton Environmental Institute's 25th Anniversary Celebration in October 2019. Finally, we acknowledge the World Climate Research Programme, which, through its Working Group on Coupled Modelling, coordinated and promoted CMIP6. We thank the climate modeling groups for producing and making available their model output, the Earth System Grid Federation (ESGF) for archiving the data and providing access, and the multiple funding agencies who support CMIP6 and ESGF.
Dee, S. G. , Nabizadeh, E. , Nittrouer, C. L. , Baldwin, J. W. , Li, C. , Gaviria, L. , et al. (2022). Increasing health risks during outdoor sports due to climate change in Texas: Projections versus attitudes. GeoHealth, 6, e2022GH000595. 10.1029/2022GH000595
Data Availability Statement
CESM2 All of the Community Earth System Model version 2 (CESM2) data employed in this work is publicly available via the Earth System Grid: earthsystemgrid.org ([data set] Danabasoglu et al., 2020; Rodgers et al., 2021). CMIP6 Climate Model Intercomparison Project Model output (CMIP6) ([data set] Eyring et al., 2016) was obtained from the Pangeo Platform at http://gallery.pangeo.io/repos/pangeo-gallery/cmip6/intake_ESM_example.html ([software] Eynard‐Bontemps et al., 2019). The CMIP6 data are also available from the Pangeo repository at https://github.com/pangeo-data/pangeo-datastore. NWS National Weather Service heat warning criteria were obtained from https://www.weather.gov/images/srh/SRHeatCriteriaApril2016.JPG (US Department of Commerce, n.d.‐a).
References
- Baldwin, J. W. , Dessy, J. B. , Vecchi, G. A. , & Oppenheimer, M. (2019). Temporally compound heat wave events and global warming: An emerging hazard. Earth's Future, 7(4), 411–427. 10.1029/2018ef000989 [DOI] [Google Scholar]
- Barrow, M. W. , & Clark, K. A. (1998). Heat‐related illnesses. American Family Physician, 58(3), 749. [PubMed] [Google Scholar]
- Buzan, J. , Oleson, K. , & Huber, M. (2015). Implementation and comparison of a suite of heat stress metrics within the community land model version 4.5. Geoscientific Model Development, 8(2), 151–170. 10.5194/gmd-8-151-2015 [DOI] [Google Scholar]
- Buzan, J. R. , & Huber, M. (2020). Moist heat stress on a hotter Earth. Annual Review of Earth and Planetary Sciences, 48(1), 623–655. 10.1146/annurev-earth-053018-060100 [DOI] [Google Scholar]
- Casa, D. J. , DeMartini, J. K. , Bergeron, M. F. , Csillan, D. , Eichner, E. R. , Lopez, R. M. , et al. (2015). National athletic trainers’ association position statement: Exertional heat illnesses. Journal of Athletic Training, 50(9), 986–1000. 10.4085/1062-6050-50-9-07 [DOI] [PMC free article] [PubMed] [Google Scholar]
- Cooper, E. R. , Ferrara, M. S. , Casa, D. J. , Powell, J. W. , Broglio, S. P. , Resch, J. E. , & Courson, R. W. (2016). Exertional heat illness in American football players: When is the risk greatest? Journal of Athletic Training, 51(8), 593–600. 10.4085/1062-6050-51.8.08 [DOI] [PMC free article] [PubMed] [Google Scholar]
- Cooper, E. R. , Grundstein, A. J. , Miles, J. D. , Ferrara, M. S. , Curry, P. , Casa, D. J. , & Hosokawa, Y. (2020). Heat policy revision for Georgia high school football practices based on data‐driven research. Journal of Athletic Training, 55(7), 673–681. 10.4085/1062-6050-542-18 [DOI] [PMC free article] [PubMed] [Google Scholar]
- Dahl, K. , Licker, R. , Abatzoglou, J. T. , & Declet‐Barreto, J. (2019). Increased frequency of and population exposure to extreme heat index days in the United States during the 21st century. Environmental Research Communications, 1(7), 075002. 10.1088/2515-7620/ab27cf [DOI] [Google Scholar]
- Danabasoglu, G. , Lamarque, J.‐F. , Bacmeister, J. , Bailey, D. , DuVivier, A. , Edwards, J. , et al. (2020). The community Earth system model version 2 (cesm2). Journal of Advances in Modeling Earth Systems, 12(2). 10.1029/2019ms001916 [DOI] [Google Scholar]
- Davies‐Jones, R. (2008). An efficient and accurate method for computing the wet‐bulb temperature along pseudoadiabats, Monthly Weather Review, 136, 2764–2785. [Google Scholar]
- Davis, B. (2021). Texas athletics generates 200.7millioninrevenue, 22.1 million profit in 2019‐20 fiscal year. Hookem. Retrieved from https://www.hookem.com/story/sports/football/2021/01/29/texas-football-longhorns-turn-22-1-million-profit-2020/4301655001/ [Google Scholar]
- DeVellis, R. F. , & Thorpe, C. T. (2021). Scale development: Theory and applications. Sage publications. [Google Scholar]
- Eynard‐Bontemps, G. , Abernathey, R. , Hamman, J. , Ponte, A. , & Rath, W. (2019). [cmip6] the pangeo big data ecosystem and its use at cnes. In Big data from space (bids’19). Turning data into insights 19‐21 fébruary 2019, Munich, Germany.
- Eyring, V. , Bony, S. , Meehl, G. A. , Senior, C. A. , Stevens, B. , Stouffer, R. J. , & Taylor, K. E. (2016). Overview of the coupled model intercomparison project phase 6 (cmip6) experimental design and organization. Geoscientific Model Development, 9(5), 1937–1958. 10.5194/gmd-9-1937-2016 [DOI] [Google Scholar]
- Gasparrini, A. , Guo, Y. , Hashizume, M. , Lavigne, E. , Zanobetti, A. , Schwartz, J. , et al. (2015). Mortality risk attributable to high and low ambient temperature: A multicountry observational study. Lancet, 386(9991), 369–375. 10.1016/s0140-6736(14)62114-0 [DOI] [PMC free article] [PubMed] [Google Scholar]
- Gauer, R. , & Meyers, B. K. (2019). Heat‐related illnesses. American Family Physician, 99(8), 482–489. [PubMed] [Google Scholar]
- Gettelman, A. , Hannay, C. , Bacmeister, J. T. , Neale, R. B. , Pendergrass, A. , Danabasoglu, G. , et al. (2019). High climate sensitivity in the community Earth system model version 2 (cesm2). Geophysical Research Letters, 46(14), 8329–8337. 10.1029/2019gl083978 [DOI] [Google Scholar]
- Grundstein, A. J. , Hosokawa, Y. , & Casa, D. J. (2018). Fatal exertional heat stroke and American football players: The need for regional heat‐safety guidelines. Journal of Athletic Training, 53(1), 43–50. 10.4085/1062-6050-445-16 [DOI] [PMC free article] [PubMed] [Google Scholar]
- Grundstein, A. J. , Ramseyer, C. , Zhao, F. , Pesses, J. L. , Akers, P. , Qureshi, A. , et al. (2012). A retrospective analysis of American football hyperthermia deaths in the United States. International Journal of Biometeorology, 56(1), 11–20. 10.1007/s00484-010-0391-4 [DOI] [PubMed] [Google Scholar]
- Hanna, E. G. , & Tait, P. W. (2015). Limitations to thermoregulation and acclimatization challenge human adaptation to global warming. International Journal of Environmental Research and Public Health, 12(7), 8034–8074. 10.3390/ijerph120708034 [DOI] [PMC free article] [PubMed] [Google Scholar]
- Hawkins, M. D. , Brown, V. , & Ferrell, J. (2017). Assessment of noaa national weather service methods to warn for extreme heat events. Weather, Climate, and Society, 9(1), 5–13. 10.1175/wcas-d-15-0037.1 [DOI] [Google Scholar]
- Horton, D. E. , Johnson, N. C. , Singh, D. , Swain, D. L. , Rajaratnam, B. , & Diffenbaugh, N. S. (2015). Contribution of changes in atmospheric circulation patterns to extreme temperature trends. Nature, 522(7557), 465–469. 10.1038/nature14550 [DOI] [PubMed] [Google Scholar]
- Hosokawa, Y. , Casa, D. J. , Trtanj, J. M. , Belval, L. N. , Deuster, P. A. , Giltz, S. M. , et al. (2019). Activity modification in heat: Critical assessment of guidelines across athletic, occupational, and military settings in the USA. International Journal of Biometeorology, 63(3), 405–427. 10.1007/s00484-019-01673-6 [DOI] [PMC free article] [PubMed] [Google Scholar]
- Howe, A. S. , & Boden, B. P. (2007). Heat‐related illness in athletes. The American Journal of Sports Medicine, 35(8), 1384–1395. 10.1177/0363546507305013 [DOI] [PubMed] [Google Scholar]
- IPCC . (2013). Summary for policymakers [book section]. In Climate change 2013: The physical science basis. Contribution of working group i to the fifth assessment report of the intergovernmental panel on climate change (pp. 1–30). Cambridge University Press. 10.1017/CBO9781107415324.004 [DOI] [Google Scholar]
- Kakamu, T. , Wada, K. , Smith, D. R. , Endo, S. , & Fukushima, T. (2017). Preventing heat illness in the anticipated hot climate of the Tokyo 2020 summer olympic games. Environmental Health and Preventive Medicine, 22(1), 1–6. 10.1186/s12199-017-0675-y [DOI] [PMC free article] [PubMed] [Google Scholar]
- Keellings, D. , Bunting, E. , & Engström, J. (2018). Spatiotemporal changes in the size and shape of heat waves over North America. Climatic Change, 147(1), 165–178. 10.1007/s10584-018-2140-3 [DOI] [Google Scholar]
- Kerr, Z. Y. , Casa, D. J. , Marshall, S. W. , & Comstock, R. D. (2013). Epidemiology of exertional heat illness among us high school athletes. American Journal of Preventive Medicine, 44(1), 8–14. 10.1016/j.amepre.2012.09.058 [DOI] [PubMed] [Google Scholar]
- Kerr, Z. Y. , Register‐Mihalik, J. K. , Pryor, R. R. , Pierpoint, L. A. , Scarneo, S. E. , Adams, W. M. , et al. (2019). The association between mandated preseason heat acclimatization guidelines and exertional heat illness during preseason high school American football practices. Environmental Health Perspectives, 127(4), 047003. 10.1289/ehp4163 [DOI] [PMC free article] [PubMed] [Google Scholar]
- Lim, C. L. (2020). Fundamental concepts of human thermoregulation and adaptation to heat: A review in the context of global warming. International Journal of Environmental Research and Public Health, 17(21), 7795. 10.3390/ijerph17217795 [DOI] [PMC free article] [PubMed] [Google Scholar]
- Lutsko, N. J. (2021). The relative contributions of temperature and moisture to heat stress changes under warming. Journal of Climate, 34(3), 901–917. 10.1175/jcli-d-20-0262.1 [DOI] [Google Scholar]
- Lyon, B. , Barnston, A. G. , Coffel, E. , & Horton, R. M. (2019). Projected increase in the spatial extent of contiguous us summer heat waves and associated attributes. Environmental Research Letters, 14(11), 114029. 10.1088/1748-9326/ab4b41 [DOI] [Google Scholar]
- Miralles, D. G. , Gentine, P. , Seneviratne, S. I. , & Teuling, A. J. (2019). Land–atmospheric feedbacks during droughts and heatwaves: State of the science and current challenges. Annals of the New York Academy of Sciences, 1436(1), 19–35. 10.1111/nyas.13912 [DOI] [PMC free article] [PubMed] [Google Scholar]
- Mora, C. , Dousset, B. , Caldwell, I. R. , Powell, F. E. , Geronimo, R. C. , Bielecki, C. R. , et al. (2017). Global risk of deadly heat. Nature Climate Change, 7(7), 501–506. 10.1038/nclimate3322 [DOI] [Google Scholar]
- Nabizadeh, E. , Hassanzadeh, P. , Yang, D. , & Barnes, E. A. (2019). Size of the atmospheric blocking events: Scaling law and response to climate change. Geophysical Research Letters, 46(22), 13488–13499. 10.1029/2019gl084863 [DOI] [Google Scholar]
- Nabizadeh, E. , Lubis, S. W. , & Hassanzadeh, P. (2021). The 3d structure of northern hemisphere blocking events: Climatology, role of moisture, and response to climate change. Journal of Climate, 34(24), 9837–9860. 10.1175/jcli-d-21-0141.1 [DOI] [Google Scholar]
- Navarro, C. S. , Casa, D. J. , Belval, L. N. , & Nye, N. S. (2017). Exertional heat stroke. Current Sports Medicine Reports, 16(5), 304–305. 10.1249/jsr.0000000000000403 [DOI] [PubMed] [Google Scholar]
- Nielsen, D. C. (2018). Influence of latitude on the us great plains east–west precipitation gradient. Agricultural & Environmental Letters, 3(1), 170040. 10.2134/ael2017.11.0040 [DOI] [Google Scholar]
- Perkins‐Kirkpatrick, S. , & Lewis, S. (2020). Increasing trends in regional heatwaves. Nature Communications, 11(1), 1–8. 10.1038/s41467-020-16970-7 [DOI] [PMC free article] [PubMed] [Google Scholar]
- Peters, G. P. , Andrew, R. M. , Boden, T. , Canadell, J. G. , Ciais, P. , Le Quéré, C. , et al. (2013). The challenge to keep global warming below 2 c. Nature Climate Change, 3(1), 4–6. 10.1038/nclimate1783 [DOI] [Google Scholar]
- Raymond, C. , Matthews, T. , & Horton, R. M. (2020). The emergence of heat and humidity too severe for human tolerance. Science Advances, 6(19), eaaw1838. 10.1126/sciadv.aaw1838 [DOI] [PMC free article] [PubMed] [Google Scholar]
- Rodgers, K. B. , Lee, S.‐S. , Rosenbloom, N. , Timmermann, A. , Danabasoglu, G. , Deser, C. , et al. (2021). Ubiquity of human‐induced changes in climate variability. Earth System Dynamics Discussions, 12(4), 1–22. 10.5194/esd-12-1393-2021 [DOI] [Google Scholar]
- Rogers, C. D. , Ting, M. , Li, C. , Kornhuber, K. , Coffel, E. D. , Horton, R. M. , et al. (2021). Recent increases in exposure to extreme humid‐heat events disproportionately affect populated regions. Geophysical Research Letters, 48(19), e2021GL094183. 10.1029/2021gl094183 [DOI] [Google Scholar]
- Rothfusz, L. P. (1990). The heat index equation (or, more than you ever wanted to know about heat index). National Oceanic and Atmospheric Administration, National Weather Service, Office of Meteorology, 9023. [Google Scholar]
- Russo, S. , Dosio, A. , Graversen, R. G. , Sillmann, J. , Carrao, H. , Dunbar, M. B. , et al. (2014). Magnitude of extreme heat waves in present climate and their projection in a warming world. Journal of Geophysical Research: Atmospheres, 119(22), 12–500. 10.1002/2014jd022098 [DOI] [Google Scholar]
- Scarneo‐Miller, S. E. , Belval, L. N. , Yeargin, S. W. , Hosokawa, Y. , Kerr, Z. Y. , & Casa, D. J. (2020). Exertional heat illness preparedness strategies: Environmental monitoring policies in United States high schools. Medicina, 56(10), 486. 10.3390/medicina56100486 [DOI] [PMC free article] [PubMed] [Google Scholar]
- Sherwood, S. C. , & Huber, M. (2010). An adaptability limit to climate change due to heat stress. Proceedings of the National Academy of Sciences, 107(21), 9552–9555. 10.1073/pnas.0913352107 [DOI] [PMC free article] [PubMed] [Google Scholar]
- Smith, C. J. (2019). Pediatric thermoregulation: Considerations in the face of global climate change. Nutrients, 11(9), 2010. 10.3390/nu11092010 [DOI] [PMC free article] [PubMed] [Google Scholar]
- Stull, R. (2011). Wet‐bulb temperature from relative humidity and air temperature. Journal of Applied Meteorology and Climatology, 50(11), 2267–2269. 10.1175/jamc-d-11-0143.1 [DOI] [Google Scholar]
- UIL . (n.d.). Heat stress and athletic participation. Expression Engine 2.0. Retrieved from https://www.uiltexas.org/health/info/heat-stress-and-athletic-participation
- US Department of Commerce, N. (n.d.‐a) . NOAA’s national weather Service. Retrieved from https://www.weather.gov/
- US Department of Commerce, N. (n.d.‐b) . Weather related fatality and injury statistics. NOAA’s National Weather Service. Retrieved from https://www.weather.gov/hazstat/ [Google Scholar]
- Vanos, J. K. , Baldwin, J. W. , Jay, O. , & Ebi, K. L. (2020). Simplicity lacks robustness when projecting heat‐health outcomes in a changing climate. Nature Communications, 11(1), 1–5. 10.1038/s41467-020-19994-1 [DOI] [PMC free article] [PubMed] [Google Scholar]
- Vanos, J. K. , Thomas, W. M. , Grundstein, A. J. , Hosokawa, Y. , Liu, Y. , & Casa, D. J. (2020). A multi‐scalar climatological analysis in preparation for extreme heat at the Tokyo 2020 olympic and Paralympic games. Temperature, 7(2), 191–214. 10.1080/23328940.2020.1737479 [DOI] [PMC free article] [PubMed] [Google Scholar]
- Vecellio, D. J. , Wolf, S. T. , Cottle, R. M. , & Kenney, W. L. (2022). Evaluating the 35°c wet‐bulb temperature adaptability threshold for young, healthy subjects (psu heat project). Journal of Applied Physiology, 132(2), 340–345. 10.1152/japplphysiol.00738.2021 [DOI] [PMC free article] [PubMed] [Google Scholar]
- Wexler, R. K. (2002). Evaluation and treatment of heat‐related illnesses. American Family Physician, 65(11), 2307. [PubMed] [Google Scholar]
- Williams, M. L. (2020). Global warming, heat related illnesses and the dermatologist. International Journal of Women’s Dermatology, 7(1), 70–84. 10.1016/j.ijwd.2020.08.007 [DOI] [PMC free article] [PubMed] [Google Scholar]
- Wuebbles, D. J. , Fahey, D. W. , Hibbard, K. A. , Arnold, J. R. , DeAngelo, B. , Doherty, S. , et al. (2017). Climate science special report: Fourth national climate assessment (nca4) (Vol. i).
- Yeargin, S. W. , Dompier, T. P. , Casa, D. J. , Hirschhorn, R. M. , & Kerr, Z. Y. (2019). Epidemiology of exertional heat illnesses in national collegiate athletic association athletes during the 2009–2010 through 2014–2015 academic years. Journal of Athletic Training, 54(1), 55–63. 10.4085/1062-6050-504-17 [DOI] [PMC free article] [PubMed] [Google Scholar]
- Zhao, L. , Oppenheimer, M. , Zhu, Q. , Baldwin, J. W. , Ebi, K. L. , Bou‐Zeid, E. , et al. (2018). Interactions between urban heat islands and heat waves. Environmental Research Letters, 13(3), 034003. 10.1088/1748-9326/aa9f73 [DOI] [Google Scholar]
Associated Data
This section collects any data citations, data availability statements, or supplementary materials included in this article.
Supplementary Materials
Supporting Information S1
Data Availability Statement
CESM2 All of the Community Earth System Model version 2 (CESM2) data employed in this work is publicly available via the Earth System Grid: earthsystemgrid.org ([data set] Danabasoglu et al., 2020; Rodgers et al., 2021). CMIP6 Climate Model Intercomparison Project Model output (CMIP6) ([data set] Eyring et al., 2016) was obtained from the Pangeo Platform at http://gallery.pangeo.io/repos/pangeo-gallery/cmip6/intake_ESM_example.html ([software] Eynard‐Bontemps et al., 2019). The CMIP6 data are also available from the Pangeo repository at https://github.com/pangeo-data/pangeo-datastore. NWS National Weather Service heat warning criteria were obtained from https://www.weather.gov/images/srh/SRHeatCriteriaApril2016.JPG (US Department of Commerce, n.d.‐a).