Notifying stakeholders, including the public, about the current community level of COVID-19 infection has become an integral part of the public health response to the epidemic. In a nationwide study, the ability of various metrics to predict community COVID-19 mortality risk was examined.
Abstract
Background:
Centers for Disease Control and Prevention (CDC) defines low, medium, and high “COVID-19 community levels” to guide interventions, but associated mortality rates have not been reported.
Objective:
To evaluate the diagnostic performance of CDC COVID-19 community level metrics as predictors of elevated community mortality risk.
Design:
Time series analysis over the period of 30 May 2021 through 4 June 2022.
Setting:
U.S. states and counties.
Participants:
U.S. population.
Measurements:
CDC “COVID-19 community level” metrics based on hospital admissions, bed occupancy, and reported cases; reported COVID-19 deaths; and sensitivity, specificity, and predictive values for CDC and alternative metrics.
Results:
Mean and median weekly mortality rates per 100 000 population after onset of high COVID-19 community level 3 weeks prior were 2.6 and 2.4, respectively, (interquartile range [IQR], 1.7 to 3.1) across 90 high episodes in states and 4.3 and 2.1, respectively, (IQR, 0 to 5.4) across 7987 high episodes in counties. In 85 of 90 (94%) episodes in states and 4801 of 7987 (60%) episodes in counties, lagged weekly mortality after onset exceeded 0.9 per 100 000 population, and in 57 of 90 (63%) episodes in states and 4018 of 7987 (50%) episodes in counties, lagged weekly mortality after onset exceeded 2.1 per 100 000, which is equivalent to approximately 1000 daily deaths in the national population. Alternative metrics based on lower hospital admissions or case thresholds were associated with lower mortality and had higher sensitivity and negative predictive value for elevated mortality, but the CDC metrics had higher specificity and positive predictive value. Ratios between cases, hospitalizations, and deaths have varied substantially over time.
Limitations:
Aggregate mortality does not account for nonfatal outcomes or disparities. Continuing evolution of viral variants, immunity, clinical interventions, and public health mitigation strategies complicate prediction for future waves.
Conclusion:
Designing metrics for public health decision making involves tradeoffs between identifying early signals for action and avoiding undue restrictions when risks are modest. Explicit frameworks for evaluating surveillance metrics can improve transparency and decision support.
Primary Funding Source:
Council of State and Territorial Epidemiologists.
Coronavirus disease 2019 was the third leading cause of death in the United States in 2020 and 2021 (1), and preventing mortality while minimizing disruption remains a critical objective for public health policy. In February 2022, Centers for Disease Control and Prevention (CDC) released new community metrics to inform COVID-19 prevention strategies based on explicit goals of avoiding severe illness and health care strain (2). Centers for Disease Control and Prevention characterizes local “COVID-19 community levels” as low, medium, or high on the basis of new COVID-19 cases, hospital admissions and inpatient bed use. Centers for Disease Control and Prevention recommends that “high” community levels trigger intensified prevention strategies, including community masking in public indoor settings.
A CDC Science Brief describing the design of the new metrics reported that indicators and thresholds for defining community levels were chosen to maximize predictive accuracy for severe disease and death 3 weeks later (3). Design choices for metrics were based on analysis of data from the Delta and early winter Omicron waves. However, the magnitude of expected mortality corresponding to COVID-19 community levels, either during past waves or anticipated in future waves, was not reported.
In this study, we present a framework for evaluating COVID-19 metrics as leading signals of population-level mortality. Using methods from clinical epidemiology, we treated COVID-19 community levels as analogous to a diagnostic test for elevated mortality risk. We adopted the same retrospective perspective and indicators as CDC and analyzed surveillance data on cases and hospitalizations in U.S. states and counties, over the Delta and Omicron waves, to define COVID-19 community levels on a weekly basis. Expanding on the CDC analysis, we estimated mortality rates linked to periods of high COVID-19 community levels. We evaluated the diagnostic performance of the CDC high community level designation as a marker of concurrent or subsequent mortality risk and compared the CDC definition against alternative definitions on the basis of different threshold levels for the same indicators. We further assessed time trends in measures that combined indicators on cases, hospital admissions, and deaths, highlighting challenges in forecasting mortality in future waves given uncertainties about future variants and changes in population immunity and testing and intervention patterns.
Methods
Construction of Community Levels
We conducted separate analyses for U.S. states and counties. The study period spanned the week of 30 May 2021 through the week of 29 May 2022 (ending 4 June 2022). We used data reported to the U.S. Department of Health and Human Services Unified Hospital Data Surveillance System on new admissions and inpatient bed use by patients with COVID-19 (4, 5) and aggregated counts of COVID-19 cases and deaths reported by state and local health agencies (6). Consistent with CDC reporting conventions, we computed measures at the midpoint of each week.
Over the study period, we identified weeks during which each state or county would be categorized as having a high COVID-19 community level according to the CDC metrics:
1. If fewer than 200 new COVID-19 cases per 100 000 population in the past 7 days: either new COVID-19 hospital admissions 20 or greater per 100 000 population (7-day total), or 15% or more of staffed inpatient beds occupied by patients with confirmed COVID-19 (7-day average)
2. If 200 or more new cases per 100 000: new COVID-19 admissions 10 or more per 100 000 (7-day total), or COVID-19 inpatient bed occupancy 10% or more (7-day average)
We defined distinct episodes of high COVID-19 community levels that began with each week a state or county transitioned to the high category after at least 1 week at low or medium. In sensitivity analyses, we examined alternative definitions of episodes that required at least 2 consecutive weeks in the same category for a change in levels. In stratified analyses, we divided the study period into 4-month intervals, which corresponded to the emergence and dominance of Delta, the Delta-to-Omicron transition and winter wave, and the evolution of Omicron subvariants.
Alternative Definitions of High Community Levels
For comparison to the CDC metrics, we defined 2 alternative definitions for high community levels that used the same indicators as the CDC metrics but with different threshold levels, chosen as case examples:
Alternative 1 (“lower hospitalization threshold”): either new COVID-19 admissions at 5 or more per 100 000 population (7-day total), or 5% or more of staffed inpatient beds occupied by patients with confirmed COVID-19 (7-day average)
Alternative 2 (“lower case threshold”): either 100 or more new cases per 100 000 population in the past 7 days, or new COVID-19 admissions at 10 or more (7-day total) per 100 000, or COVID-19 bed occupancy 10% or more (7-day average)
Primary Outcome
Our primary outcome of interest was the 7-day average COVID-19 deaths per 100 000 population. For some analyses, we focused on average mortality lagged by 3 weeks. The 3-week lag was used for consistency with the CDC approach to choosing indicators and thresholds, which selected this lag to maximize predictive accuracy for death and other severe outcomes (3). The lag is also consistent with the notion that preventive health actions will have limited scope to reduce death over the initial weeks after intervention, because of the time course of progression from infection to death, with approximate average duration of 3 weeks. When analyzing lagged mortality relating to onset of distinct episodes of high COVID-19 community level, we excluded new episodes beginning later than the week of 8 May 2022 to accommodate the lag.
We benchmarked mortality against a previously proposed threshold of 0.9 deaths per 100 000 population per week, defined in reference to peak mortality from viral respiratory illnesses during a high-severity year (7). Specifically, the threshold incorporates influenza deaths during the 2017 to 2018 season as well as yearly mortality from respiratory syncytial virus.
Evaluating Diagnostic Performance
To evaluate the CDC metrics in comparison with alternatives, we adopted a clinical epidemiologic perspective and treated the categorization of COVID-19 community levels as an imperfect diagnostic marker for high population-level mortality risk. We defined high mortality risk using the high-severity benchmark of weekly mortality above 0.9 per 100 000 population.
First, we compared the CDC and alternative definitions of high COVID-19 community levels in terms of the time between onset of a new high episode and death exceeding the reference benchmark. Time-to-event analysis was done using Kaplan–Meier estimators to allow for right censoring of follow-up (8). Next, we computed diagnostic test characteristics (sensitivity, specificity, positive predictive value, and negative predictive value) for the CDC and alternative metrics using standard logic of 2 × 2 paired contingency tables. These test characteristics evaluated a weekly “diagnosis” of a high COVID-19 community level against the “(true) disease condition” of high mortality risk, seen at different time lags from the diagnosis:
• Sensitivity of the high COVID-19 community level marker for detecting high mortality was computed as the fraction of all weeks in which observed mortality exceeded the benchmark level (the “disease-positive” condition), where the community COVID-19 level would also be characterized as high according to the CDC or alternative definitions (the “diagnostic test-positive” condition).
• Specificity was computed as the fraction of all weeks in which mortality did not exceed the benchmark level (“disease-negative”), where the community COVID-19 level would be marked as low or medium (“test-negative”).
• Negative predictive value was computed as the fraction of all weeks marked as low or medium community levels that had mortality that was below the benchmark level.
• Positive predictive value was computed as the fraction of all weeks marked as high community levels that had mortality above the benchmark level.
We computed the 4 diagnostic test characteristics for an array of different “true conditions” defined by observed mortality at weeks 0, 3, or 6 after a COVID-19 high community level “diagnosis.”
Time Trends
To consider the applicability of the CDC community metrics to guide decision making in future waves, we examined time trends in the relationships between case rates and hospitalization and mortality rates, specifically ratios of new hospital admissions to new cases (hospitalization-case ratios); ratios of 3-week lagged mortality to case reports (case-fatality ratios [CFR]); and ratios of 3-week lagged mortality to new hospital admissions (hospitalization-fatality ratios).
All analyses were done in R, version 4.2.0 (R Foundation for Statistical Computing) and Stata, version 16.1 (StataCorp). This study relied only on secondary analysis of aggregate-level, publicly available data. No institutional review board approval was needed because the research did not constitute human subjects research.
Role of the Funding Source
Funding organizations did not play any role in the design of the study; the collection, analysis, and interpretation of the data; or the decision to approve publication of the finished manuscript.
Results
Characteristics of High COVID-19 Community Level Episodes
Over the study period from 30 May 2021 through 4 June 2022, 41% and 40% of weeks across states and counties, respectively, met criteria for a high CDC COVID-19 community level. Overall, there were 102 distinct high episodes across the 50 states and District of Columbia (mean, 2.0 per state) and 8304 distinct high episodes across 3207 counties (mean, 2.6 per county), including 90 and 7987 distinct episodes, respectively, when truncating the inclusion period for new episodes at the week of 8 May to allow for 3-week mortality follow-up.
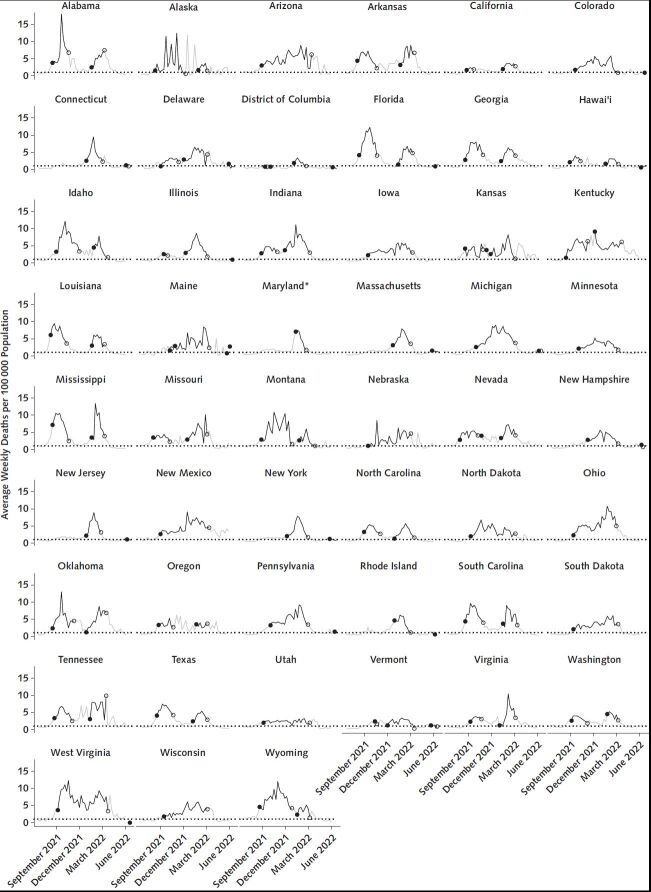
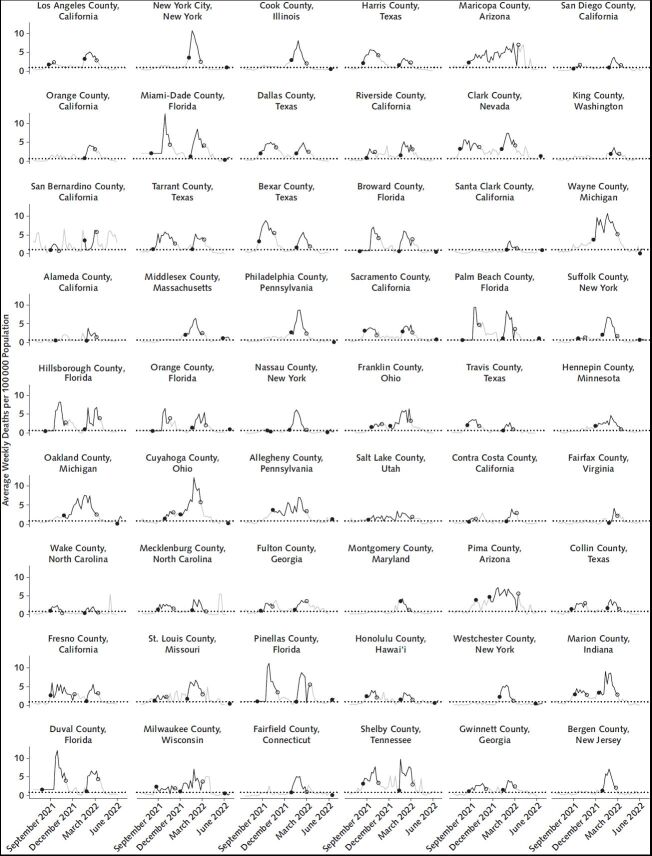
Episodes of high community levels were mapped to mortality levels 3 weeks later. Figure 1 shows time trends in 3-week lagged mortality associated with periods of high COVID-19 community levels in the 50 states and District of Columbia, for all distinct episodes beginning through the week of 8 May 2022, and Figure 2 shows trends in the 54 most populous counties. Mean and median weekly mortality rates per 100 000 population associated with onset of an episode 3 weeks prior were 2.6 and 2.4, respectively, (interquartile range [IQR], 1.7 to 3.1) across episodes in states and 4.3 and 2.1, respectively, (IQR, 0 to 5.4) across episodes in all counties (not restricted to the 54 most populous). In 85 of 90 (94%) episodes in states and 4801 of 7987 (60%) episodes in counties, weekly mortality 3 weeks after onset exceeded 0.9 per 100 000 population. In 57 of 90 (63%) and 4018 of 7987 (50%) episodes, lagged weekly mortality at onset exceeded 2.1 per 100 000 population, which is equivalent to approximately 1000 daily deaths in the national population. Lagged mortality associated with the final week of an episode was generally similar to or higher than mortality associated with the episode onset.
Figure 1. Average weekly deaths per 100 000 population by state, 30 May 2021 through 4 June 2022.
Segments marked in black show average mortality rates seen 3 weeks after a state meets the CDC criteria for high COVID-19 community level, whereas gray segments show 3-week lagged mortality rates after periods meeting criteria for low or medium COVID-19 community level. The dotted horizontal line marks a reference level of 0.9 deaths per 100 000 population per week (7). Solid circles mark the lagged mortality after the first week of a distinct episode of high community levels, whereas open circles mark the final week of a high episode. The choice of a 3-week lag for pairing observed mortality to weeks of high COVID-19 community levels follows the design of the CDC metrics based on predictive accuracy for mortality and other severe outcomes at a 3-week lag and is consistent with an approximate duration of 3 weeks between diagnosis and death. CDC = Centers for Disease Control and Prevention. * Maryland did not report case data from 5 December through 19 December 2021, and values in the New York Times data set were filled by repeating the 4 December value over the entire missing interval. For our purposes, we replaced those repeated values in our analytic data set with backfilled Maryland case data for 5 December to 19 December, obtained directly from the Maryland Department of Health, available at https://coronavirus.maryland.gov/datasets/mdcovid19-casesper100kpopulationstatewide/explore.
Figure 2. Average weekly deaths per 100 000 population for the 54 most populous U.S. counties, 30 May 2021 through 4 June 2022.
Segments marked in black show average death rates seen 3 weeks after a county meets CDC criteria for high COVID-19 community level, whereas gray segments show 3-week lagged death rates after periods meeting criteria for low or medium COVID-19 community level. The dotted horizontal line marks a reference level of 0.9 deaths per 100 000 population per week (7). Solid circles mark the lagged mortality after the first week of a distinct episode of high community levels, whereas open circles mark the final week of a high episode. The choice of a 3-week lag for pairing observed mortality to weeks of high COVID-19 community levels follows the design of the CDC metrics based on predictive accuracy for mortality and other severe outcomes at a 3-week lag and is consistent with an approximate duration of 3 weeks between diagnosis and death.
The Table summarizes outcome measures, including the individual CDC indicators that make up the community-level metrics and 3-week lagged mortality, related to all distinct episodes in states and counties. Results on outcome measures were similar in sensitivity analyses in which we excluded episodes that did not consist of at least 2 consecutive qualifying weeks or excluded episodes that were not preceded by at least 2 consecutive nonqualifying periods (not shown).
Table.
Outcome Measures (Cases, Hospital Admissions, Inpatient Bed Occupancy, and Deaths) Associated With Periods of High COVID-19 Community Levels According to CDC Metrics
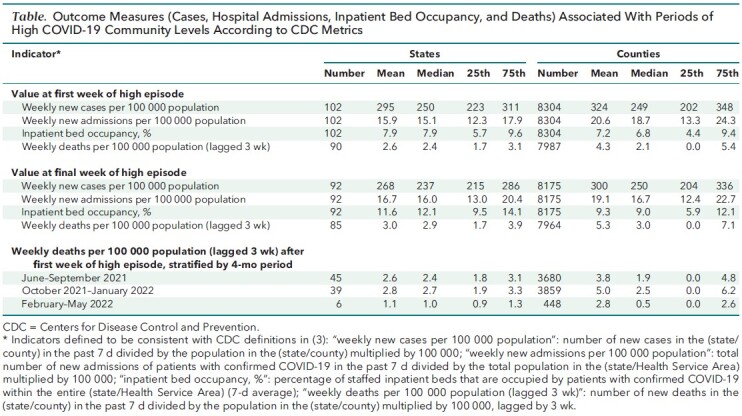
Stratifying by 4-month intervals (Table), lagged mortality in states and counties were both highest on average over October 2021 through January 2022, a period that reflected a mixture of Delta and Omicron variants. In both states and counties, lagged mortality has been lower after the January Omicron peak, with the average over February through May 2022 approximately 60% lower in states and 40% lower in counties, compared with the average levels over October 2021 through January 2022.
Mortality in Relation to Alternative Metrics
Compared with CDC metrics, the 2 alternative metrics (the first based on a hospitalization threshold lower than the CDC threshold and the second based on a lower case threshold) would have classified a higher proportion of weeks as high COVID-19 levels: 44% and 48%, respectively, in states, and 69% and 64%, respectively, in counties. On the other hand, both alternative metrics resulted in lower levels of mortality linked to the onset of a new high episode. For states, mean and median 3-week lagged mortality rates associated with onset of an episode were 0.8 and 0.8 per 100 000 population per week, respectively, (IQR, 0.5 to 1.1) for 79 distinct episodes defined using the lower hospitalization threshold and 1.2 and 1.1, respectively, (IQR, 0.7 to 1.6) for 99 distinct episodes defined using the lower case threshold. For counties, mean and median lagged mortality rates associated with onset of an episode were 2.1 and 0.0, respectively, (IQR, 0.0 to 2.1) for 8492 distinct episodes using the lower hospitalization threshold and 2.3 and 0.0, respectively, (IQR, 0.0 to 2.6) for 8031 distinct episodes using the lower case threshold.
Evaluation of Diagnostic Performance
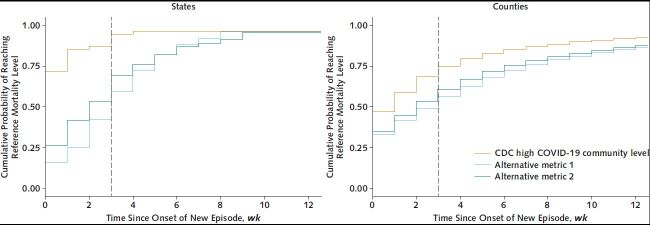
Figure 3 compares the distribution of times to reach the benchmark weekly mortality level of 0.9 per 100 000 population using the CDC metric or 2 alternatives across states or counties. In states, the median time to reach the mortality benchmark was 0 weeks for the CDC metrics, compared with 2 weeks for the lower hospitalization threshold and 3 weeks for the lower case threshold. In counties, the median time to reach the mortality benchmark was 1 week for the CDC metrics, compared with 2 weeks for the lower hospitalization threshold and 3 weeks for the lower case threshold.
Figure 3. Cumulative probability of reaching reference weekly mortality level of 0.9 deaths per 100 000 population (7) in relation to time since onset of a distinct episode of high COVID-19 community level in U.S. states (left) or counties (right) over the period 30 May 2021 through 4 June 2022.
CDC = Centers for Disease Control and Prevention.
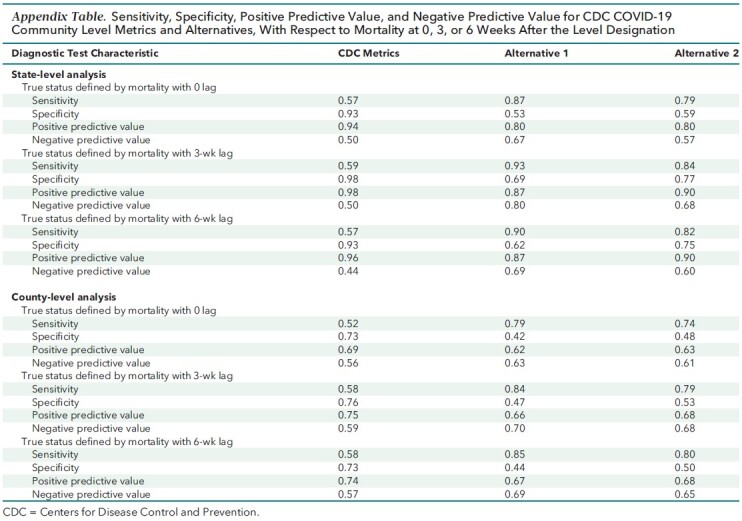
We compared sensitivity, specificity, positive predictive value, and negative predictive value for the CDC and alternative metrics, in reference to the “true” condition of weekly mortality (at different lags) exceeding the benchmark level of 0.9 per 100 000 population. Across both states and counties, the alternative metrics had higher sensitivity and negative predictive values (more true positives) than the CDC metrics, whereas the CDC metrics had higher specificity and positive predictive value (fewer false positives).
Using a 3-week lag on mortality, the sensitivity of alternative metrics was 0.84 to 0.93, compared with 0.59 for the CDC metrics in states, and 0.79 to 0.84 versus 0.58 in counties. The negative predictive values for alternative metrics were 0.68 to 0.80, compared with 0.5 for the CDC metrics in states, and 0.68 to 0.70 versus 0.59 in counties. Thus, the alternative metrics provided more reliable leading indicators of elevated mortality than the CDC metrics; to put the negative predictive value measures in context, among weeks that the CDC metrics did not mark as high COVID-19 community levels, 40% to 50% were followed by high mortality, compared with around 20% to 30% of instances for the alternate metrics. By contrast, the specificity for 3-week lagged mortality was 0.98 for CDC versus 0.69 to 0.77 for the alternatives in states and 0.76 for CDC versus 0.47 to 0.53 for alternatives in counties, implying that the CDC metrics correctly characterized a greater fraction of weeks that did not lead to high mortality, compared with alternative metrics.
The Appendix Table reports full details on the diagnostic characteristics for the CDC and alternative definitions of high COVID-19 levels in relation to mortality seen at 0, 3, or 6 week lags.
Appendix Table.
Sensitivity, Specificity, Positive Predictive Value, and Negative Predictive Value for CDC COVID-19 Community Level Metrics and Alternatives, With Respect to Mortality at 0, 3, or 6 Weeks After the Level Designation
Time Trends
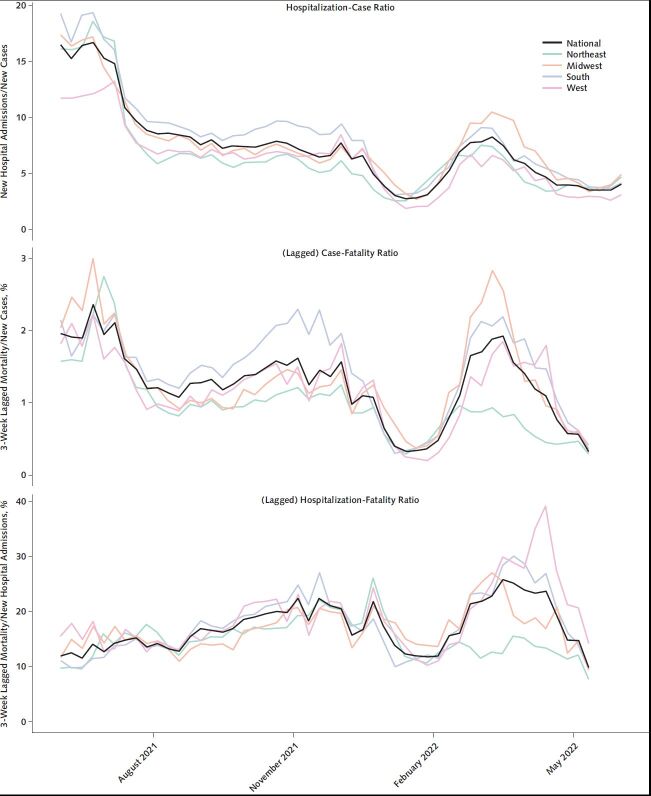
Examining summary measures comprising ratios of case, admissions, and mortality indicators, we saw substantial variation over time (Figure 4). In the period since December 2021, during which time the Omicron variant has been predominant, the national CFR has oscillated over a 7-fold range between a low of 0.29% and a high of 2.0%. During the same period, the hospitalization-fatality rate has also swung between extremes, although within a narrower 4-fold range, from 7.2% to 28%. Examining the timing of increases and decreases, we observe that the ratio of incident hospital admissions to incident cases has been a leading indicator for the changes in the CFR and hospitalization-fatality ratio. This finding suggests that the hospitalization-case ratio may have value in attempting to anticipate the short-term trajectory of the CFR, relevant to using the CDC metrics to guide public health decision making over future waves.
Figure 4. Coronavirus disease 2019 hospitalization-case ratio (top), case-fatality ratio (middle), and hospitalization-fatality ratio (bottom), United States and by U.S. Census region, 30 May 2021 through 4 June 2022.
Lines in colors represent regions, with the overall national level marked in black. In the case-fatality and hospitalization-fatality ratios, mortality is lagged by 3 weeks, and the series is truncated at 14 May to accommodate this lag.
Discussion
In this study, we estimated mortality associated with periods during the Delta and Omicron waves that would be characterized as high COVID-19 community levels according to current CDC guidance. Between the end of May 2021 and the beginning of June 2022, the onset of most episodes marked by high community case and hospitalization levels was followed, in both states and counties, by average mortality rates 3 weeks later exceeding 2.1 deaths per 100 000 population per week, a rate corresponding to approximately 1000 deaths per day in the national population. After the winter Omicron wave, the mortality associated with high COVID-19 community levels has declined but remained, on average, above mortality levels in a severe influenza season (7). Nevertheless, forecasting future mortality associated with high community levels is challenging because the case-fatality ratio continues to oscillate substantially.
These results have important implications both for interpreting COVID-19 community levels and for future efforts to refine and adapt metrics to the rapidly evolving COVID-19 pandemic. First, our findings suggest that earlier indicators may be needed to prompt preventive actions in time to avert substantial death in future COVID-19 surges. Because mortality lags case diagnosis and hospitalization, there is limited scope for changes in individual behavior and public health strategies to reduce mortality over the 3 weeks after communities reach the high COVID-19 category. Preventive interventions that are initiated at the onset of a new episode of high COVID-19 community level can affect transmission after that point, but many of the infections that will lead to severe disease and death over the weeks immediately after will have occurred already.
Second, our study emphasizes the value of being explicit about the tradeoffs embedded in COVID-19 metrics. In describing the analytic basis for community levels, CDC does not refer to specific mortality thresholds used to inform the choice of indicator thresholds demarcating low, medium, and high community levels. Nevertheless, any such categorization will implicitly encode such thresholds because of the progression from infection to death over a 2- to 3-week period. Therefore, although the value choices regarding levels of mortality that should trigger more aggressive intervention may not be stated, normative values are inherent in metrics design. The development of COVID-19 community levels was motivated by an explicit goal of shifting emphasis toward risk for severe disease and strain on the health care system (3), but making equally explicit the tradeoffs induced by that goal can permit a more transparent weighing of intended and unintended consequences in the choice of public health interventions.
In our diagnostic evaluation framework, we assess metrics on the basis of how they balance longer lead time against greater certainty that mortality will exceed an unacceptable threshold. Allowing more time for action entails spending more time in a state of higher alert, potentially under interventions that may impose unintended harmful consequences but more modest benefit. In our framework, we leverage a clinical analogy to a diagnostic test. By treating the CDC metrics as a diagnosis of elevated community COVID-19 risk, and benchmarking these “test” results against a reference condition of mortality exceeding a defined threshold, we were able to compare the CDC metrics against alternatives in a way that lends itself to further, explicit evaluation of benefits and costs of acting on true or false, positive or negative signals.
Our study has several limitations. We explore only a limited set of alternative metrics based on lower thresholds for hospital admissions or cases to illustrate the potential implications of defining metrics that will supply earlier signals of changing community-level risks. There are many design choices that give rise to innumerable possible metrics. Likewise, we demonstrate our framework for evaluating diagnostic performance based on a previously proposed benchmark for high mortality from respiratory viruses during a severe influenza season. Our evaluation framework can generalize across different choices along both dimensions.
Another set of limitations relates to our focus on community-level mortality as our primary outcome of interest. Although mortality (and hospital admissions) were emphasized by CDC in the development of the community level framework, mortality is only one of many epidemiologic outcomes that are relevant to understanding the population health effect of COVID-19. Infection itself has consequences for health and for other domains of well-being, including participation in work and social activities (9). The understanding of long-term consequences of infection, including postacute sequelae of COVID (“long COVID”) continues to evolve (10, 11). Further, outcomes aggregated at state or county level mask important disparities that have prevailed throughout the pandemic and have concentrated a disproportionate burden on underserved populations and communities of color (12–14).
Finally, setting thresholds is complicated by the evolving relationship between epidemiologic indicators and outcomes (15–17). In the future, this evolution will continue to be driven in large part by features of new variants (18) but also by levels of increasing and decreasing immunity from infection and vaccination (19); development and delivery plans for updated vaccines (20); availability and uptake of testing and antiviral treatments (21, 22); and changing policies and practices on preventive measures, such as masking, testing, and isolation and quarantine (23). In the context of uncertain and changing conditions, well-defined objectives are particularly important to allow efficient updating of metrics to accommodate this flux. We also emphasize the value of intermediate indicators, like the hospitalization-case ratio, that predict changes in the level of severe outcomes.
The combination of extraordinary health losses due to COVID-19 and unintended harms from mitigation measures has produced an urgent and persistent need for metrics to guide and target public health policies. Our study acknowledges that value choices are unavoidable in such metrics, and we suggest that being more explicit offers opportunities to interrogate both the value choices themselves and the policies they permit. Although choosing public health metrics and associated decision rules remains challenging, an explicit framework for designing, evaluating, and revising these indicators can improve credibility, transparency, policy efficacy, and durability of metrics intended to inform public health decision making.
Footnotes
This article was published at Annals.org on 2 August 2022.
References
- 1. Shiels MS , Haque AT , Berrington de González A , et al. Leading causes of death in the US during the COVID-19 pandemic, March 2020 to October 2021. JAMA Intern Med. 2022. [PMID: ] doi: 10.1001/jamainternmed.2022.2476 [DOI] [PMC free article] [PubMed] [Google Scholar]
- 2. Centers for Disease Control and Prevention. COVID-19 community levels. Accessed at www.cdc.gov/coronavirus/2019-ncov/science/community-levels.html on 30 June 2022. [PubMed]
- 3. Centers for Disease Control and Prevention. Science Brief: indicators for monitoring COVID-19 community levels and making public health recommendations. Accessed at www.cdc.gov/coronavirus/2019-ncov/science/science-briefs/indicators-monitoring-community-levels.html on 30 June 2022. [PubMed]
- 4. U.S. Department of Health and Human Services. COVID-19 reported patient impact and hospital capacity by state timeseries. Accessed at https://healthdata.gov/Hospital/COVID-19-Reported-Patient-Impact-and-Hospital-Capa/g62h-syeh on 5 July 2022.
- 5. U.S. Department of Health and Human Services. COVID-19 reported patient impact and hospital capacity by facility. Accessed at https://healthdata.gov/Hospital/COVID-19-Reported-Patient-Impact-and-Hospital-Capa/anag-cw7u on 27 June 2022.
- 6.Coronavirus (Covid-19) data in the United States. The New York Times. 2021. Accessed at https://github.com/nytimes/covid-19-data on 10 July 2022.
- 7. Emanuel EJ , Osterholm M , Gounder CR . A national strategy for the “new normal” of life with COVID. JAMA. 2022;327:211-12. [PMID: ] doi: 10.1001/jama.2021.24282 [DOI] [PubMed] [Google Scholar]
- 8. Kaplan EL, Meier P. Nonparametric estimation from incomplete observations. J Am Stat Assoc. 1958;53:457-81. doi: 10.2307/2281868 [DOI]
- 9. Cutler DM , Summers LH . The COVID-19 pandemic and the $16 trillion virus. JAMA. 2020;324:1495-96. [PMID: ] doi: 10.1001/jama.2020.19759 [DOI] [PMC free article] [PubMed] [Google Scholar]
- 10. Wisk LE , Nichol G , Elmore JG . Toward unbiased evaluation of postacute sequelae of SARS-CoV-2 infection: challenges and solutions for the long haul ahead [Editorial]. Ann Intern Med. 2022;175:740-43. [PMID: ] doi: 10.7326/M21-4664 [DOI] [PMC free article] [PubMed] [Google Scholar]
- 11. Sneller MC , Liang CJ , Marques AR , et al. A longitudinal study of COVID-19 sequelae and immunity: baseline findings. Ann Intern Med. 2022. [PMID: ] doi: 10.7326/M21-4905 [DOI] [PMC free article] [PubMed] [Google Scholar]
- 12. Shiels MS , Haque AT , Haozous EA , et al. Racial and ethnic disparities in excess deaths during the COVID-19 pandemic, March to December 2020. Ann Intern Med. 2021;174:1693-99. [PMID: ] doi: 10.7326/M21-2134 [DOI] [PMC free article] [PubMed] [Google Scholar]
- 13. Mackey K , Ayers CK , Kondo KK , et al. Racial and ethnic disparities in COVID-19-related infections, hospitalizations, and deaths. A systematic review. Ann Intern Med. 2021;174:362-73. [PMID: ] doi: 10.7326/M20-6306 [DOI] [PMC free article] [PubMed] [Google Scholar]
- 14. Tipirneni R , Karmakar M , O'Malley M , et al. Contribution of individual- and neighborhood-level social, demographic, and health factors to COVID-19 hospitalization outcomes. Ann Intern Med. 2022;175:505-12. [PMID: ] doi: 10.7326/M21-2615 [DOI] [PMC free article] [PubMed] [Google Scholar]
- 15. Dean N . Tracking COVID-19 infections: time for change. Nature. 2022;602:185. [PMID: ] doi: 10.1038/d41586-022-00336-8 [DOI] [PubMed] [Google Scholar]
- 16. Rader B , Gertz A , Iuliano AD , et al. Use of at-home COVID-19 tests - United States, August 23, 2021-March 12, 2022. MMWR Morb Mortal Wkly Rep. 2022;71:489-94. [PMID: ] doi: 10.15585/mmwr.mm7113e1 [DOI] [PMC free article] [PubMed] [Google Scholar]
- 17. Reinhart A , Brooks L , Jahja M , et al. An open repository of real-time COVID-19 indicators. Proc Natl Acad Sci U S A. 2021;118. [PMID: ] doi: 10.1073/pnas.2111452118 [DOI] [PMC free article] [PubMed] [Google Scholar]
- 18. Cao Y , Yisimayi A , Jian F , et al. BA.2.12.1, BA.4 and BA.5 escape antibodies elicited by Omicron infection. Nature. 2022. [PMID: ] doi: 10.1038/s41586-022-04980-y [DOI] [PMC free article] [PubMed] [Google Scholar]
- 19. Klaassen F , Chitwood MH , Cohen T , et al. Population immunity to pre-Omicron and Omicron SARS-CoV-2 variants in US states and counties through December 1, 2021. Clin Infect Dis. 2022. [PMID: ] doi: 10.1093/cid/ciac438 [DOI] [PMC free article] [PubMed] [Google Scholar]
- 20. Schmidt C. Omicron-specific COVID boosters are coming. Scientific American. 7 July 2022. Accessed at www.scientificamerican.com/article/omicron-specific-covid-boosters-are-coming/ on 11 July 2022.
- 21. Jayk Bernal A , Gomes da Silva MM , Musungaie DB , et al; MOVe-OUT Study Group. Molnupiravir for oral treatment of Covid-19 in nonhospitalized patients. N Engl J Med. 2022;386:509-20. [PMID: ] doi: 10.1056/NEJMoa2116044 [DOI] [PMC free article] [PubMed] [Google Scholar]
- 22. Hammond J , Leister-Tebbe H , Gardner A , et al; EPIC-HR Investigators. Oral nirmatrelvir for high-risk, nonhospitalized adults with Covid-19. N Engl J Med. 2022;386:1397-1408. [PMID: ] doi: 10.1056/NEJMoa2118542 [DOI] [PMC free article] [PubMed] [Google Scholar]
- 23. Linas BP, Xiao J, Dalgic OO, et al. Projecting COVID-19 mortality as states relax nonpharmacologic interventions. JAMA Health Forum. 2022;3:e220760. doi: 10.1001/jamahealthforum.2022.0760 [DOI] [PMC free article] [PubMed]


