Abstract
Aims
Various methods and post-processing software packages have been developed to quantify left atrial (LA) fibrosis using 3D late gadolinium-enhancement cardiac magnetic resonance (LGE-CMR) images. Currently, it remains unclear how the results of these methods and software packages interrelate.
Methods and results
Forty-seven atrial fibrillation (AF) patients underwent 3D-LGE-CMR imaging prior to their AF ablation. LA fibrotic burden was derived from the images using open-source CEMRG software and commercially available ADAS 3D-LA software. Both packages were used to calculate fibrosis based on the image intensity ratio (IIR)-method. Additionally, CEMRG was used to quantify LA fibrosis using three standard deviations (3SD) above the mean blood pool signal intensity. Intraclass correlation coefficients were calculated to compare LA fibrosis quantification methods and different post-processing software outputs. The percentage of LA fibrosis assessed using IIR threshold 1.2 was significantly different from the 3SD-method (29.80 ± 14.15% vs. 8.43 ± 5.42%; P < 0.001). Correlation between the IIR-and SD-method was good (r = 0.85, P < 0.001) although agreement was poor [intraclass correlation coefficient (ICC) = 0.19; P < 0.001]. One-third of the patients were allocated to a different fibrosis category dependent on the used quantification method. Fibrosis assessment using CEMRG and ADAS 3D-LA showed good agreement for the IIR-method (ICC = 0.93; P < 0.001).
Conclusions
Both, the IIR1.2 and 3SD-method quantify atrial fibrotic burden based on atrial wall signal intensity differences. The discrepancy in the amount of LA fibrosis between these methods may have clinical implications when patients are classified according to their fibrotic burden. There was no difference in results between post-processing software packages to quantify LA fibrosis if an identical quantification method including the threshold was used.
Keywords: atrial remodelling, atrial fibrillation, atrial fibrosis, cardiovascular magnetic resonance (CMR)
Graphical Abstract
Graphical Abstract.
Introduction
Atrial fibrillation (AF) is considered a progressive disease by which AF itself induces structural changes of the atria (i.e. remodelling), promoting the perpetuation of AF.1 Fibrosis, indicated by collagen deposition in the myocardial interstitial space, is recognized as an expression of arrhythmogenic structural remodelling.2,3 Left atrial (LA) fibrosis can be assessed using late gadolinium enhancement–cardiac MR (LGE-CMR) imaging.4,5
In patients with AF undergoing ablative therapy, the amount of pre-procedural LA fibrosis is associated with the likelihood of AF recurrence. Moreover, identification and quantification of atrial fibrosis using CMR may improve patient selection and stratification for AF ablative therapy.4,6 Classification of patients according to their LA fibrotic burden might aid in clinical decision-making for both ablative therapy and medical management.7 Consequently, the amount of quantified LA fibrosis may have clinical implications for the patient-specific treatment strategy.
LGE-CMR images can be post-processed using different software packages and LA fibrotic burden can be quantified using different methods. At present, mainly two methods are widely used to quantify LA fibrosis. The first method defines fibrotic tissue by using a threshold [a number of standard deviations (SDs)] above a reference value, usually the mean signal intensity for normal myocardium or mean signal intensity of the LA blood pool.6,8 The second method, referred to as the image intensity ratio (IIR) method proposed by Khurram et al., normalizes the signal intensity of the LA wall to the mean blood pool signal intensity.9,10 For the IIR method, a threshold of 1.2 is generally used to indicate fibrosis while a threshold of three SDs above the mean blood pool signal intensity is proposed using the SD-method (Supplementary data online, Table S1).8,10–12
Currently, it is unclear how the results of these two methods interrelate and whether values generated by different post-processing software packages provide the same LA fibrotic burden. Therefore, this study focuses on the comparison of LA fibrosis quantification methods (both using the blood pool as an internal reference for normalization) and compares LA fibrosis quantification by two different post-processing software packages (CEMRG, King’s College, London, UK and ADAS 3D LA, Galgo Medical, Barcelona, Spain).
Methods
This is a retrospective single-centre study. The study was conducted according to the principles outlined in the 1964 Declaration of Helsinki and its later amendments. Collection and management of data were approved by the local medical ethics committee (VU University Medical Center, Amsterdam, The Netherlands). Written informed consent was obtained from all individual participants included in the study.
Study population
AF patients were enrolled in the study between July 2018 and February 2020. All patients had paroxysmal or persistent AF according to the HRS/EHRA guidelines and were scheduled to undergo their first pulmonary vein isolation (PVI) ablation procedure.13 As part of routine clinical workup, patients underwent a pre-ablation CMR scan to evaluate pulmonary vein anatomy, exclude LA appendage thrombus, and to assess LA fibrosis. All study patients were in sinus rhythm during the CMR scan.
Exclusion criteria to participate in the study were general CMR contraindications (including metal implants and claustrophobia), contraindications for gadolinium-based contrast agent, mechanical heart valves, a cardiac implantable electronic device, and absence of sinus rhythm during the CMR scan.
CMR acquisition protocol
All scans were performed using a 1.5 T clinical MRI system (Siemens AVANTO, Erlangen, Germany) using a 32-channel array coil. The CMR protocol included balanced SSFP cine imaging in long-axis orientation (two-chamber and four-chamber view). An ECG gated free-breathing 3D contrast-enhanced MR angiogram (CE-MRA) of the LA and pulmonary veins was obtained immediately after a 20 mL (1 mL/s) single-dose bolus injection of contrast agent (Dotarem®, Guerbet, Roissy, France) followed by a body weight dependent slow infusion of contrast agent (slow infusion dose; 2.5–30.0 mL, infusion rate; 0.1–.25 mL/s) equal to a total dose of 0.4 mL/kg. Typical acquisition parameters were: repetition time (TR)/echo time (TE) 5.5/3.0 ms; flip angle, 25°; in-plane resolution 1.25 × 1.25 mm with slice thickness 2.5 mm (reconstructed to 0.625 × 0.625 × 1.25 mm).
High-resolution 3D LGE images were acquired using a navigator-based respiration- and ECG-gated inversion recovery prepared gradient echo pulse sequence applied between 15 and 25 minutes after contrast injection. Voxel size was 1.25 mm × 1.25 mm × 2.5 mm (reconstructed to 0.625 mm × 0.625 mm × 1.25 mm). Other typical sequence parameters were as follows: TR/TE 5.2/2.4 ms; flip angle, 20°.
Image analysis
LA volume and global function
Cine image analysis was performed using Circle CVI42 (Circle Cardiovascular Imaging, Inc., Calgary, Canada). Volumetric data of the LA were derived from the two-chamber and four-chamber cine images using the biplanar method. LA minimal volume (LAVmin) and maximal volume (LAVmax) were used to calculate the LA emptying fraction (LA EF). LAV index (LAVi) was calculated by dividing LAVmax by body surface area.
LA fibrosis quantification
Quantification of LA fibrosis was performed using commercially available ADAS 3D LA image post-processing software (Galgo Medical, Barcelona, Spain) and open-source CEMRG image post-processing software (King’s College London, UK).14 The 3D LGE images underwent stringent quality control (i.e. artefacts, proper myocardial nulling) by two experienced readers prior to post-processing, and images were excluded from analysis if the quality was deemed insufficient.
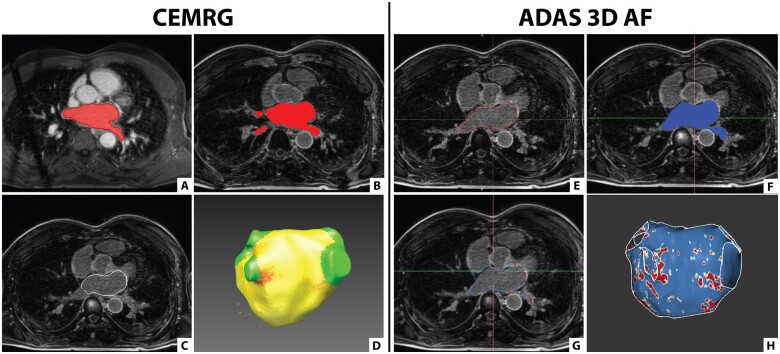
The segmentation process of the LA differs slightly between the two software packages (Figure 1). For analysis with CEMRG, the 3D CE-MRA was used for segmentation of the LA and this segmentation was co-registered with the 3D LGE images. Using ADAS 3D LA, the segmentation of the LA was performed directly on the 3D LGE images (Supplementary data online, Videos).
Figure 1.
Segmentation of the LA using CEMRG and ADAS 3D LA. (A–D) Screenshots taken in CEMRG. (A) LA segmentation (in red) on the 3D CE-MRA image using a thresholding tool. (B) Segmented LA (in red) co-registered with the 3D LGE image. (C) LA wall contour (in white) projected on the 3D LGE image. (D) 3D model of the LA incorporating fibrosis (red) after exclusion of the pulmonary veins and LA appendage. (E–H) Screenshots taken in ADAS 3D LA. (E) LA segmentation (in red) on the 3D LGE image by contouring the mid-LA wall. (F) LA segmentation (in blue) projected on the 3D LGE image. (G) LA wall contour (in blue) projected on the 3D LGE image. (H) 3D model of the LA incorporating fibrosis (red) after exclusion of the pulmonary veins and LA appendage.
CEMRG provides an assessment of LA fibrosis using either the SD or IIR-method whereas ADAS 3D LA only allows fibrosis quantification using the IIR-method. The equations for calculating fibrotic burden using these two methods are displayed in Supplementary data online, Table S2. A two-pixel LA wall thickness was handled as per the default setting in both ADAS 3D LA and CEMRG. For both methods, LA fibrosis is displayed as a percentage of the total LA surface.
LA fibrosis assessment using ADAS 3D LA
First, the LA wall including pulmonary vein (PV) extensions was segmented manually in multiple axial planes by drawing mid-atrial wall contours on the 3D LGE images. The software automatically interpolated the contours to the intermediate slices and adjustments were performed manually if necessary. Subsequently, a 3D reconstruction of the LA was automatically generated, and the LA appendage and the pulmonary veins were excluded at their ostia defined as the point of deflection from the LA wall. The mitral valve annulus was used to separate the LA from the LV cavity and mitral valve annulus enhancement was excluded for fibrosis analysis. Signal intensity was normalized to the mean blood pool intensity according to the IIR-method.9 The presence and amount of LA fibrosis were calculated using a default IIR threshold of 1.2 (1.2 times mean blood pool signal intensity)10,15 (Supplementary data online, Table S2).
LA fibrosis assessment using CEMRG
Using CEMRG, the LA blood pool including PV extensions was segmented semi-automatically in the 3D CE-MRA images on axial slices using a thresholding tool. The interpolated contours were adjusted manually in each axial plane. A two-voxel (1.25 mm) surface dilation was used to define the epicardial border. Subsequently, the 3D CE-MRA was co-registered with the 3D LGE images. A 3D reconstruction of the LA was generated, and the LA appendage and the pulmonary veins were manually excluded at their ostia defined as the point of deflection from the LA wall. The mitral valve annulus was used to separate the LA from the LV cavity, and mitral valve annulus enhancement was excluded for fibrosis analysis.
On the 3D LGE images, signal intensity was normalized to the mean blood pool intensity according to the IIR-method using various thresholds (i.e. 0.5, 0.97, 1.2, 1.32, 1.61, 2.0), as these thresholds are reported in the literature.9 In addition, LA fibrosis was calculated using various standard deviations (i.e. 1SD, 2SD, 3SD, 3.3SD, 4SD) above the mean of the blood pool. A threshold of 3SDs was considered as the default threshold based on previous publications8,11,12 (Supplementary data online, Table S1). Furthermore, the LGE blood pool signal to noise ratio (SNRBP) was calculated in CEMRG by dividing the reported mean LA blood pool signal intensity by the LA blood pool SD. Both fibrosis quantification methods are mathematically related via this SNRBP and IIR/SD threshold values can be converted into each other using the equation [IIR = SD/SNRBP + 1] (Supplementary data online, Table S2).16
Statistical analysis
Results are presented as mean ± standard deviation for normally distributed data and median including interquartile range (IQR) for data with a non-normal distribution. Normality of continuous data was assessed by inspection of histograms and Q–Q plots. Pearson’s correlation was used to quantify associations between continuous variables. The Cohen’s kappa was used as a statistic to test the agreement in categorization between the two quantification methods. Inter- and intra-observer variability was assessed in 15 randomly selected patients to test for reproducibility of fibrosis quantification in which the entire segmentation process was redone, including the exclusion of the pulmonary veins and mitral valve annulus. Agreement between measurements of LA fibrosis was assessed by intraclass correlation coefficients (ICCs) and visually by Bland–Altman analysis. ICCs for absolute agreement of single measurements were estimated using a two-way random effect model. Differences were considered significant if P-value <0.05. Statistical analysis was performed using SPSS Statistics v26 (IBM Corporation, Armonk, NY, USA).
Results
A total of 59 patients underwent 3D LGE-CMR prior to their AF ablation procedure. Of those, 12 patients (20%) were excluded from analysis due to insufficient LGE image quality. Baseline characteristics of the study participants are presented in Table 1. Two-thirds (66.0%) of the patient population was male and the mean age was 60 ± 9 years. Paroxysmal AF was present in 33 patients (70.2%) and persistent AF in 14 patients (29.8%). Mean LAVimax was 50.49 ± 15.59 mL/m2 and mean LA EF 50.60 ± 14.69%.
Table 1.
Baseline characteristics of study population (n = 47)
| Characteristic | Value |
|---|---|
| Age (years) | 60 ± 8.71 |
| Men | 31 (66.0%) |
| Body mass index (kg/m2) | 26.04 ± 3.85 |
| Hypertension | 17 (36.2%) |
| Diabetes mellitus | 2 (4.3%) |
| History of stroke/TIA | 1 (2.1%) |
| CHA2DS2-VASC score | 1.15 ± 1.24 |
| Paroxysmal AF | 33 (70.2%) |
| LV EDV (mL) | 171.41 ± 42.54 |
| LV ESV (mL) | 69.89 ± 25.76 |
| LV EF (%) | 59.59 ± 8.45 |
| LA volume min (mL) | 52.31 ± 29.46 |
| LA volume max (mL) | 101.62 ± 34.05 |
| LA EF (%) | 50.60 ± 14.69 |
| LA volume index (mL/m2) | 50.49 ± 15.59 |
All values are mean ± SD for categorical variables and number (%) for categorical variables.
AF, atrial fibrillation; EDV, end-diastolic volume; EF, ejection fraction; ESV, end-systolic volume; LA EF, left atrial emptying fraction; LA, left atrium; LV, left ventricle; TIA, transient ischaemic attack.
Agreement between IIR-method and SD-method
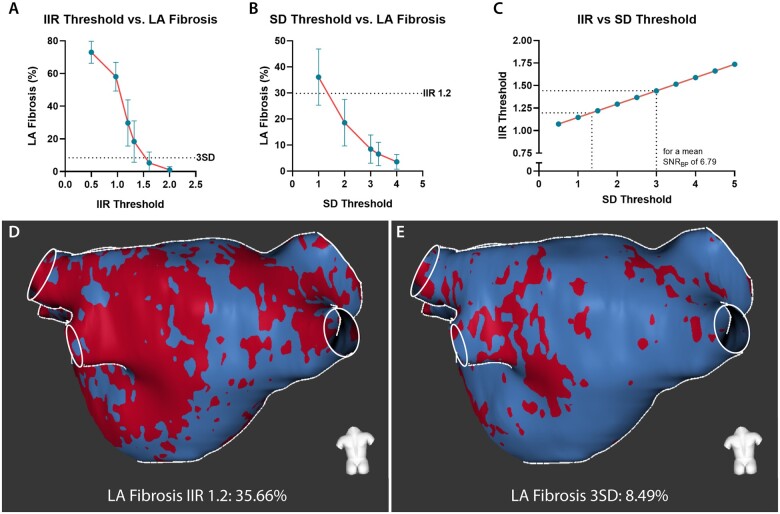
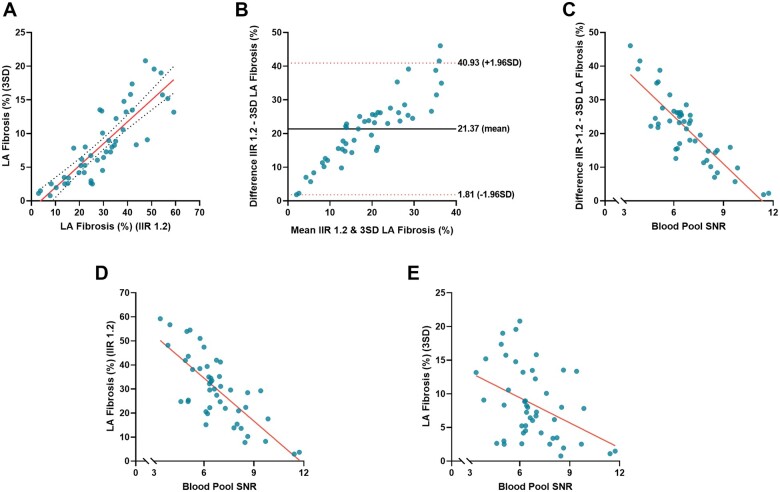
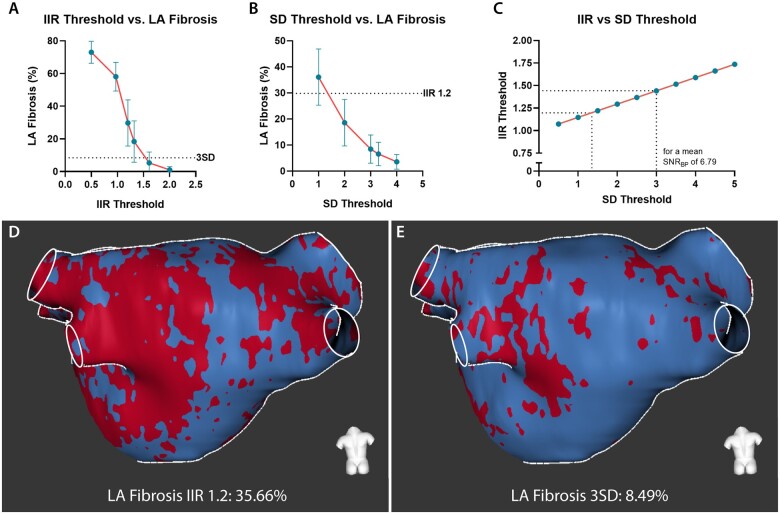
LA fibrosis quantified using IIR threshold 1.2 differed significantly from LA fibrosis quantified using threshold 3SD (29.80 ± 14.15% vs. 8.43 ± 5.42%, P < 0.001). In Supplementary data online, Figure S1, a gallery comparing the segmentations from the two methods is presented. LA fibrosis quantified using both methods did not correlate with LAVimax (IIR1.2: r = –0.06, P = 0.70; 3SD: r = –0.06, P = 0.71) and LA EF (IIR1.2: r = 0.11, P = 0.50; 3 SD: r = 0.06, P = 0.73). Overall, the IIR 1.2 method provided a higher fibrotic burden than the 3SD method and the mean difference between the two methods was 21.37 ± 9.98 percentage points. Correlation between the two quantification methods however was good (r = 0.85, P < 0.001) but agreement was poor (ICC = 0.19; P < 0.001). A substantial discordance was observed in the Bland–Altman plot demonstrating a larger difference between the two methods at increasing amounts of LA fibrosis. This difference in the amount of fibrosis was correlated with the LA LGE SNRBP with a Pearson correlation coefficient of –0.85 (P < 0.001). SNRBP was correlated with LA fibrosis quantified using the IIR 1.2 method (r = –0.76, P < 0.001) and LA fibrosis quantified using the 3SD method (r = –0.41, P < 0.01) (Figure 2). Considering the mean LA SNRBP (6.79 ± 1.81), an IIR threshold of 1.2 yielded a corresponding amount of LA fibrosis as an SD threshold of 1.36. A threshold of 3SDs reflected a similar fibrotic extent as an IIR threshold of 1.44 (Figure 3).
Figure 2.
Agreement between LA fibrosis quantified using IIR 1.2 method and 3SD method. (A) Scatterplot comparing LA fibrosis quantified using the IIR 1.2 method and 3SD method in CEMRG. (B) Bland–Altman plot demonstrating agreement of quantified fibrosis using IIR 1.2 method and 3SD method. The solid black line indicates mean bias and dashed red lines indicate limits of agreement. (C) Scatterplot comparing the difference in LA fibrosis between the IIR1.2 and 3SD method, and the blood pool signal to noise ratio (SNRBP). Based on the equation relating the IIR and SD method, 3SDs equals IIR1.25 at a SNRBP of 12. (D) Scatterplot comparing LA fibrosis quantified using the IIR 1.2 method and the SNRBP. (E) Scatterplot comparing LA fibrosis quantified using the 3SD method and the SNRBP.
Figure 3.
Difference in quantified LA fibrosis using different methods and thresholds. (A) LA fibrosis quantified in CEMRG using different IIR threshold values (i.e. 0.5, 0.97, 1.2, 1.32, 1.61, 2.0). (B) LA fibrosis quantified in CEMRG using different SD threshold values (i.e. 1.0, 2.0, 3.0, 3.3, 4.0). (C) the relation between IIR and SD for a mean blood pool SNR of 6.79. (D) LA fibrosis assessed using IIR 1.2, LA fibrosis 35.66%. (E) LA fibrosis from the same patient as indicated in (C) assessed using 3SD, LA fibrosis 8.49%.
Classifying fibrosis burden
Based on the results from the two quantification methods, four equally sized groups were created according to the LA fibrosis median and IQR (25–75%). For the IIR 1.2 method, median and IQR were 29.57% (20.75–39.40%) while median and IQR for the 3SD method were 7.83% (3.83–13.20%) (Figure 4). Applying both fibrosis quantification methods in the same patients revealed that several patients were re-assigned to a different group depending on the fibrosis quantification method used. From the 47 patients, 31 patients (65.96%) were assigned to the same fibrosis categories while 16 patients (34.04%) were reclassified to different fibrosis categories (Supplementary data online, Figure S2, Table S3). The Cohen’s kappa coefficient demonstrated that there is a weak [k = 0.55, 95% confidence interval (CI) 0.37–0.73; P < 0.01] agreement in categorization between the two quantification methods.
Figure 4.
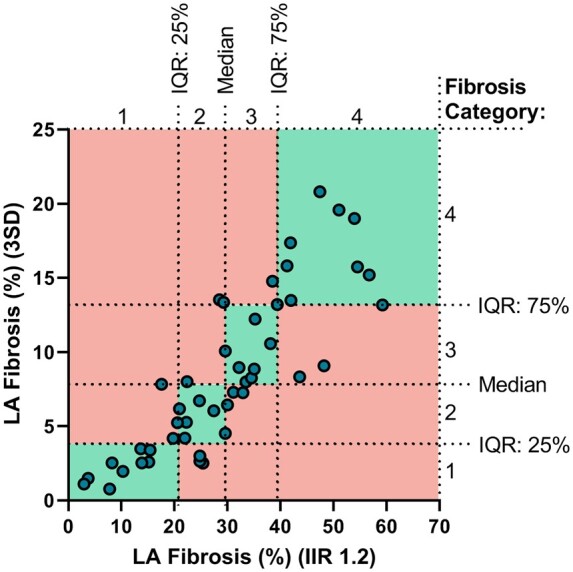
LA fibrosis classification based on the median and 25–75% range. Scatterplot comparing LA fibrosis quantified using the IIR 1.2 method and 3SD method. LA fibrosis 3SD category 1, defined as <3.83%, category 2 ≥3.83 to <7.83%, category 3 ≥7.83 to <13.20%, and category 4 ≥13.20%. LA fibrosis IIR 1.2 category 1, defined as <20.75%, category 2 ≥20.75 to <29.57%, category 3 ≥29.75 to <39.40%, and category 4 ≥39.40%. Patients (dots) in the green quadrants are assigned to the same LA fibrosis category independent of the used quantification method. Patients (dots) in the red quadrants are assigned to a different LA fibrosis category dependent on the quantification method used. Thirty-one of the 47 patients (65.96%) got assigned to the same fibrosis category while 16 patients (34.04%) got assigned to a different fibrosis category.
Agreement between ADAS 3D LA and CEMRG
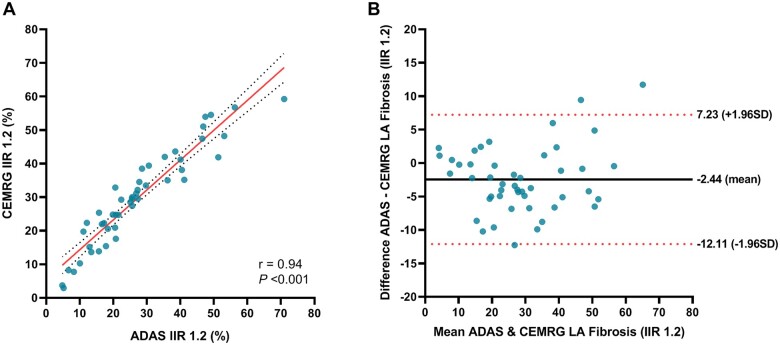
Fibrosis assessed with both software packages using an IIR threshold of 1.2 was 27.46 ± 15.92% for ADAS 3D LA and 29.44 ± 14.46% for CEMRG, respectively. LA fibrosis assessment with ADAS 3D LA and CEMRG correlated significantly (r = 0.94; P < 0.001) and showed good agreement (ICC = 0.93; P < 0.001). Bland–Altman analysis revealed an overall bias of −2.44 ± 4.93% for segmentation in ADAS 3D LA (Figure 5).
Figure 5.
Reproducibility of fibrosis quantification using CEMRG and ADAS 3D LA. (A) Scatterplots comparing LA fibrosis IIR 1.2 measured using CEMRG and ADAS 3D LA. (B) Bland–Altman plots demonstrating the agreement between LA fibrosis IIR 1.2 quantified using CEMRG and ADAS 3D LA.
Reproducibility
A total of 15 randomly selected patients underwent repeated review to assess intra- and inter-observer reliability. For ADAS 3D LA, the intraclass correlation coefficient for inter-reader variability of global LA fibrosis measurements was 0.97 (95% CI 0.89–0.99). The intraclass correlation coefficient for intra-reader variability of global LA fibrosis measurements was 0.99 (95% CI 0.98–0.99). For CEMRG, the intraclass correlation coefficient for inter-reader variability was 0.90 (95% CI 0.76–0.96) and the intraclass correlation coefficient for intra-reader variability was 0.96 (95% CI 0.87–0.99).
Discussion
This study was conducted to compare two commonly used fibrosis quantification methods [IIR-method and SDs (above blood pool) method] and to assess the performance of two post-processing software packages. We have shown that the correlation between the two quantification methods was good and both methods provide information about the appearance of contrast enhancement in the atrial wall. Both methods however, display a different degree of atrial fibrosis and the IIR 1.2 method resulted in a 21 percentage points higher fibrosis extent compared to the 3SD method. The magnitude of the difference in computed fibrotic burden was dependent on LGE LA blood pool SNR. Therefore, blood pool SNR may have a significant impact on the quantification of LA fibrosis regarding methods that use the blood pool as an internal reference. Classifying patients into quartiles according to fibrotic burden revealed that one-third of patients were assigned into different quartiles dependent on the used fibrosis quantification method. Consequently, the chosen quantification method may influence clinical decision-making and patient-specific therapeutic strategy. In general, there was a good agreement in fibrosis quantification between the two post-processing software packages (ADAS 3D LA and CEMRG) when the same quantification method and thresholding were applied. This implies that LA fibrosis values are comparable between these two software packages when identical methods and thresholds are used.
Atrial fibrosis quantification
The success rate of catheter ablation for the treatment of AF is modest and recurrence of AF is not infrequent.17 Consequently, repeat procedures increase AF ablation waiting lists and associated costs. Therefore, proper patient selection and accurate prediction of procedural outcome is of great importance.
Several groups have demonstrated that the extent of LA fibrosis assessed using LGE-CMR is predictive of AF ablation procedural outcome.6,18 In the DECAAF study, patients were assigned into one of the established four Utah fibrosis stages based on their LA fibrotic burden (ranging from <10% LA fibrosis to >30% LA fibrosis). Patients with a large extent of LA fibrosis were considered ineligible for AF ablation and those patients were proposed to be more suitable for other treatment strategies.7 The fibrosis quantification method used in the DECAAF study was relying on healthy atrial tissue as internal reference, and a non-fixed number of standard deviations (based on expert opinion) above this reference was used to indicate fibrosis. Due to the application of variable thresholds in this quantification strategy, we were unable to replicate this exact method. Nevertheless, the present study demonstrates that the measured fibrotic extent is influenced by the fibrosis quantification method used. Potentially, this might also indicate that the established Utah fibrosis stages are not generalizable as these stages are based on the Utah quantification method. Consequently, the use of these stages by other centres needs further validation when using different software tools and analysis methods.
Relation between both LA fibrosis quantification methods
In the present study, two LA-LGE quantification methods are presented that provide valuable information about the presence of atrial fibrosis based on signal intensity differences in the atrial wall (Supplementary data online, Figure S3). The correlation between the two methods was good (r = 0.85, P < 0.001). Use of the IIR-method however, results in a higher fibrotic burden compared to the SD-method (29.80 ± 14.15% vs. 8.43 ± 5.42%, P < 0.001). The difference in LA fibrotic burden was found to be influenced by LA LGE blood pool SNR. A low blood pool SNR resulted in a large difference between the fibrotic burden calculated using the IIR-method and SD-method while a high blood pool SNR resulted in a smaller difference. Moreover, normalizing to a high blood pool SNR is associated with a low overall LA fibrotic burden for both methods, which may cause underestimation of LA wall enhancement.
The blood pool SNR value is dependent on various internal and external influences such as the amount of contrast administration, the timing between contrast administration and LGE image acquisition, the scanner field strength, voxel size, image acquisition parameters, TI choice, and patient-specific clearance rate.16,19,20 Therefore, these factors influencing SNR may have affected the amount of fibrotic burden computed using both quantification methods differently. In the present study, each patient was its own control as the same CMR scan was post-processed using both software packages and the identical LA segmentation was used to quantify LA fibrosis using the IIR and SD-method in CEMRG. However, inter-patient comparability may be hampered when blood pool SNR values are dissimilar.
Classification of patients according to fibrotic burden
Due to the differences in the amount of fibrosis determined by the two methods, 16 patients (34.04%) were allocated to a different fibrosis category based on the quantification method-specific inter-quartile range. Consequently, classifying patients according to their fibrotic burden is not comparable between these different LA quantification methods. Establishing normal values for LA fibrosis and re-evaluation of the LA fibrosis categories based on centre-specific quantification methods and conceivably also LGE–CMR acquisition protocol is required. Importantly, to date, it is unknown which of the quantification methods provides the most truthful and meaningful clinical information. Especially, since the use of LA LGE is becoming more widespread for both research and clinical applications, there is a need for a standardized method of image analysis to advance the reliability and reproducibility of LA LGE quantification. Besides, histological validation of the quantification methods and associated threshold values is fundamental.
Validation of the LGE–CMR methods
Histological studies validating LGE–CMR LA fibrosis quantification are scarce and restricted to areas in which tissue samples can be collected using biopsies.4,21 One of the most extensive histological studies was performed by Harrison et al.4 A LGE-CMR signal intensity threshold of 3.3 SD above the mean signal intensity of the atrial blood pool was found to match histological findings. Of note, this research was performed in right atrial tissue obtained from a porcine model and research was focused on ablation-induced tissue changes including scar and oedema instead of pre-ablation diffuse atrial fibrosis.22 As a first step, this experimental validation in an animal model is essential. However, extrapolation of the results to human LA native fibrosis requires caution.
No direct validation of the IIR-method against histopathological findings has been executed although a validation in healthy volunteers has been performed. Healthy young volunteers, in which no/minimal LA fibrosis is expected, were used to set a standardized upper limit of normality resulting in an IIR threshold of 1.2.10
Both methods have been validated against low voltage area’s identified by electro-anatomical mapping, a surrogate used to detect atrial fibrosis.5 Low voltage cut-offs are commonly accepted to be <0.5 mV for abnormal myocardium (often interstitial fibrosis) and <0.1 mV for fibrotic scar.9 Both, the method based on a signal intensity ratio and the method using a threshold above a reference value, are correlated with these low voltage cut-offs although the agreement between the electro-anatomical maps and LGE-CMR is inconsistent in several studies.5,23 Interestingly, we have shown in the present study that there is a considerable difference in fibrotic burden dependent on the used quantification method while thresholds for both methods are established on similar low voltage cut-offs.
Agreement between software packages
Other new insights this study provides over previous ones are that fibrosis quantification using CEMRG and ADAS 3D LA yielded good agreement for the IIR 1.2 method. Although both software packages have a slightly different approach in segmenting the LA and delineation of the atrial wall, the quantified LA fibrotic burden matched well (Supplementary data online, Figure S4). In CEMRG, the LA is segmented on 3D CE-MRA images and these images are subsequently co-registered with the 3D LGE images. In ADAS 3D LA, the segmentation of the LA is performed directly on the 3D LGE images by drawing a contour mid-atrial wall. Segmentation of the LA on the 3D LGE images is potentially more challenging than segmenting on the 3D CE-MRA since contrast difference between LA wall, LA blood pool, and epi-atrial structures is more difficult to perceive. However, reproducibility analysis shows that ICC for intra-observer and inter-observer agreement are high for both software packages. Therefore, an advantage of LA segmentation in ADAS 3D LA over CEMRG is that a 3D MRA is not required for segmentation.
Limitations
Several limitations of the current study need to be addressed. Firstly, we used a threshold of IIR 1.2 and 3SD (above the mean blood pool signal intensity as a reference) to define atrial fibrosis. However, in literature, a variety of algorithms and thresholds to identify LA native fibrosis are proposed.11 Yet, there is no general agreement, a lack of standardization, and little external validation of these quantification methods.
Secondly, the LA wall is thin and segmentation of the LA wall may be challenging in LGE-CMR images. Considering the thin atrial wall relative to the LGE-CMR voxel size, the MR signal of the LA wall can be subject to the partial volume effect. Structures adjacent to the atrial wall such as the descending aorta might influence fibrosis quantification in this specific area.
Lastly, we recognize that it would be of interest to test the agreement of either method with low voltage areas identified by electro-anatomical mapping or fibrosis on histopathological analysis. In addition, outcome data can also be used to identify the method and threshold which best predicts outcome (i.e. recurrence after ablative therapy) and hence will be subject to future research.
Conclusions
Atrial fibrotic burden obtained by LGE-CMR is dependent on the quantification method used. The proportion of quantified LA fibrosis is greater when the IIR 1.2 method is applied compared to the 3SD method, although correlation between the two methods is good. When using the blood pool as internal reference for LA fibrosis evaluation, blood pool SNR may impact fibrotic burden quantification. Classification of patients according to their LA fibrotic burden is dependent on the used quantification method which may influence clinical decision-making. Analysis of fibrosis does not differ between software packages when an identical quantification method including threshold is used. Research incorporating histology is needed to identify the most accurate quantification method.
Supplementary data
Supplementary data are available at European Heart Journal - Cardiovascular Imaging online.
Supplementary Material
Contributor Information
Luuk H G A Hopman, Department of Cardiology, Amsterdam UMC, Vrije Universiteit Amsterdam, Amsterdam Cardiovascular Sciences, De Boelelaan 1118, 1081 HV Amsterdam, The Netherlands.
Pranav Bhagirath, Department of Cardiology, Amsterdam UMC, Vrije Universiteit Amsterdam, Amsterdam Cardiovascular Sciences, De Boelelaan 1118, 1081 HV Amsterdam, The Netherlands.
Mark J Mulder, Department of Cardiology, Amsterdam UMC, Vrije Universiteit Amsterdam, Amsterdam Cardiovascular Sciences, De Boelelaan 1118, 1081 HV Amsterdam, The Netherlands.
Iris N Eggink, Department of Cardiology, Amsterdam UMC, Vrije Universiteit Amsterdam, Amsterdam Cardiovascular Sciences, De Boelelaan 1118, 1081 HV Amsterdam, The Netherlands.
Albert C van Rossum, Department of Cardiology, Amsterdam UMC, Vrije Universiteit Amsterdam, Amsterdam Cardiovascular Sciences, De Boelelaan 1118, 1081 HV Amsterdam, The Netherlands.
Cornelis P Allaart, Department of Cardiology, Amsterdam UMC, Vrije Universiteit Amsterdam, Amsterdam Cardiovascular Sciences, De Boelelaan 1118, 1081 HV Amsterdam, The Netherlands.
Marco J W Götte, Department of Cardiology, Amsterdam UMC, Vrije Universiteit Amsterdam, Amsterdam Cardiovascular Sciences, De Boelelaan 1118, 1081 HV Amsterdam, The Netherlands.
Data Availability
The data underlying this article will be shared on reasonable request to the corresponding author.
References
- 1. Nattel S, Harada M.. Atrial remodeling and atrial fibrillation: recent advances and translational perspectives. J Am Coll Cardiol 2014;63:2335–45. [DOI] [PubMed] [Google Scholar]
- 2. Sohns C, Marrouche NF.. Atrial fibrillation and cardiac fibrosis. Eur Heart J 2020;41:1123–31. [DOI] [PubMed] [Google Scholar]
- 3. Burstein B, Nattel S.. Atrial fibrosis: mechanisms and clinical relevance in atrial fibrillation. J Am Coll Cardiol 2008;51:802–9. [DOI] [PubMed] [Google Scholar]
- 4. Harrison JL, Jensen HK, Peel SA, Chiribiri A, Grøndal AK, Bloch Let al. Cardiac magnetic resonance and electroanatomical mapping of acute and chronic atrial ablation injury: a histological validation study. Eur Heart J 2014;35:1486–95. [DOI] [PMC free article] [PubMed] [Google Scholar]
- 5. Oakes RS, Badger TJ, Kholmovski EG, Akoum N, Burgon NS, Fish ENet al. Detection and quantification of left atrial structural remodeling with delayed-enhancement magnetic resonance imaging in patients with atrial fibrillation. Circulation 2009;119:1758–67. [DOI] [PMC free article] [PubMed] [Google Scholar]
- 6. Marrouche NF, Wilber D, Hindricks G, Jais P, Akoum N, Marchlinski Fet al. Association of atrial tissue fibrosis identified by delayed enhancement MRI and atrial fibrillation catheter ablation: the DECAAF study. JAMA 2014;311:498–506. [DOI] [PubMed] [Google Scholar]
- 7. Higuchi K, Akkaya M, Akoum N, Marrouche NF.. Cardiac MRI assessment of atrial fibrosis in atrial fibrillation: implications for diagnosis and therapy. Heart 2014;100:590–6. [DOI] [PubMed] [Google Scholar]
- 8. Malcolme-Lawes LC, Juli C, Karim R, Bai W, Quest R, Lim PBet al. Automated analysis of atrial late gadolinium enhancement imaging that correlates with endocardial voltage and clinical outcomes: a 2-center study. Heart Rhythm 2013;10:1184–91. [DOI] [PMC free article] [PubMed] [Google Scholar]
- 9. Khurram IM, Beinart R, Zipunnikov V, Dewire J, Yarmohammadi H, Sasaki Tet al. Magnetic resonance image intensity ratio, a normalized measure to enable interpatient comparability of left atrial fibrosis. Heart Rhythm 2014;11:85–92. [DOI] [PMC free article] [PubMed] [Google Scholar]
- 10. Benito EM, Carlosena-Remirez A, Guasch E, Prat-González S, Perea RJ, Figueras Ret al. Left atrial fibrosis quantification by late gadolinium-enhanced magnetic resonance: a new method to standardize the thresholds for reproducibility. Europace 2017;19:1272–9. [DOI] [PubMed] [Google Scholar]
- 11. Pontecorboli G, Figueras I Ventura RM, Carlosena A, Benito E, Prat-Gonzales S, Padeletti Let al. Use of delayed-enhancement magnetic resonance imaging for fibrosis detection in the atria: a review. Europace 2017;19:180–9. [DOI] [PubMed] [Google Scholar]
- 12. Andreasen L, Bertelsen L, Ghouse J, Lundegaard PR, Ahlberg G, Refsgaard Let al. Early-onset atrial fibrillation patients show reduced left ventricular ejection fraction and increased atrial fibrosis. Sci Rep 2020;10:10039. [DOI] [PMC free article] [PubMed] [Google Scholar]
- 13. January CT, Wann LS, Alpert JS, Calkins H, Cigarroa JE, Cleveland JCet al. 2014 AHA/ACC/HRS guideline for the management of patients with atrial fibrillation. A report of the American College of Cardiology/American Heart Association Task Force on Practice Guidelines and the Heart Rhythm Society. Circulation 2014;64:e1–e76. [DOI] [PubMed] [Google Scholar]
- 14. Razeghi O, Solís-Lemus JA, Lee AWC, Karim R, Corrado C, Roney CHet al. CemrgApp: an interactive medical imaging application with image processing, computer vision, and machine learning toolkits for cardiovascular research. SoftwareX 2020;12:100570. [DOI] [PMC free article] [PubMed] [Google Scholar]
- 15. Bertelsen L, Alarcón F, Andreasen L, Benito E, Olesen MS, Vejlstrup Net al. Verification of threshold for image intensity ratio analyses of late gadolinium enhancement magnetic resonance imaging of left atrial fibrosis in 1.5T scans. Int J Cardiovasc Imaging 2020;36:513–20. [DOI] [PMC free article] [PubMed] [Google Scholar]
- 16. Peters DC, Bertelsen L, Caroline I, Chelikani S.. Atrial fibrosis segmentation thresholds: a theoretical and empirical study. J Cardiovasc Magn Reson 2016;18:P209. [Google Scholar]
- 17. Asad ZUA, Yousif A, Khan MS, Al-Khatib SM, Stavrakis S.. Catheter ablation versus medical therapy for atrial fibrillation. Circ Arrhythm Electrophysiol 2019;12:e007414. [DOI] [PubMed] [Google Scholar]
- 18. Khurram IM, Habibi M, Gucuk Ipek E, Chrispin J, Yang E, Fukumoto Ket al. Left atrial LGE and arrhythmia recurrence following pulmonary vein isolation for paroxysmal and persistent AF. JACC: Cardiovascular Imaging 2016;9:142–8. [DOI] [PMC free article] [PubMed] [Google Scholar]
- 19. Chubb H, Aziz S, Karim R, Sohns C, Razeghi O, Williams SEet al. Optimization of late gadolinium enhancement cardiovascular magnetic resonance imaging of post-ablation atrial scar: a cross-over study. J Cardiovasc Magn Reson 2018;20:30. [DOI] [PMC free article] [PubMed] [Google Scholar]
- 20. Kamali R, Schroeder J, DiBella E, Steinberg B, Han F, Dosdall DJet al. Reproducibility of clinical late gadolinium enhancement magnetic resonance imaging in detecting left atrial scar after atrial fibrillation ablation. J Cardiovasc Electrophysiol 2020;31:2824–32. [DOI] [PMC free article] [PubMed] [Google Scholar]
- 21. Corradi D, Callegari S, Benussi S, Nascimbene S, Pastori P, Calvi Set al. Regional left atrial interstitial remodeling in patients with chronic atrial fibrillation undergoing mitral-valve surgery. Virchows Arch 2004;445:498–505. [DOI] [PubMed] [Google Scholar]
- 22. Anderson RH, Cook AC.. The structure and components of the atrial chambers. Europace 2007;9:vi3–vi9. [DOI] [PubMed] [Google Scholar]
- 23. Chen J, Arentz T, Cochet H, Muller-Edenborn B, Kim S, Moreno-Weidmann Zet al. Extent and spatial distribution of left atrial arrhythmogenic sites, late gadolinium enhancement at magnetic resonance imaging, and low-voltage areas in patients with persistent atrial fibrillation: comparison of imaging vs. electrical parameters of fibrosis and arrhythmogenesis. Europace 2019;21:1484–93. [DOI] [PubMed] [Google Scholar]
Associated Data
This section collects any data citations, data availability statements, or supplementary materials included in this article.
Supplementary Materials
Data Availability Statement
The data underlying this article will be shared on reasonable request to the corresponding author.


