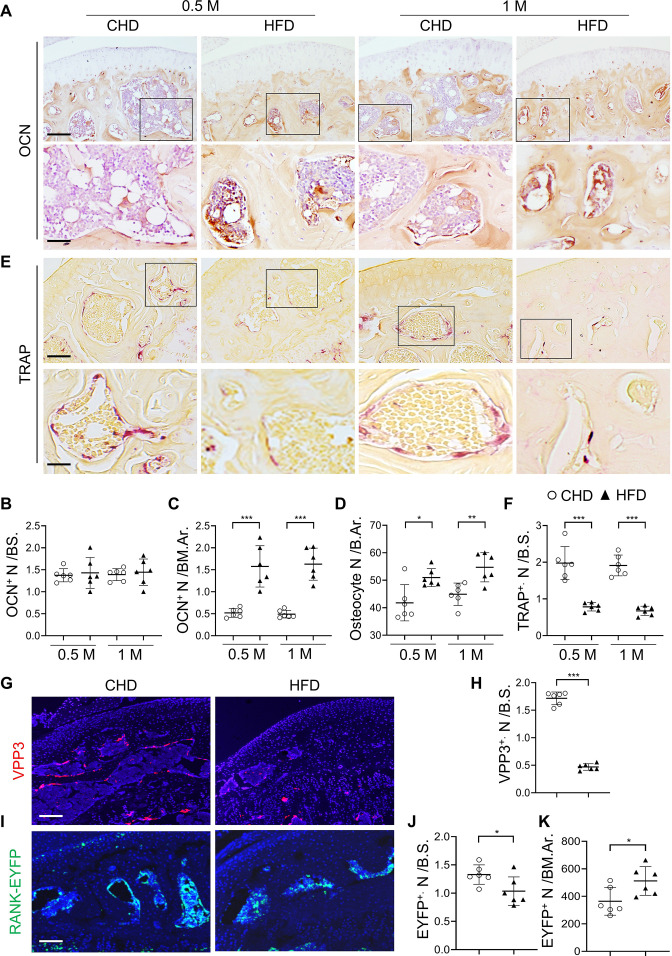
Figure 2. Subchondral osteoblast and osteoclast lineage cells change rapidly in response to a high-fat-diet (HFD) challenge.
(A–E) Three-month-old C57BL/6 mice were fed a standard chow-food diet (CHD) or HFD for 0.5 month or 1 month. n=6 mice per group. Immunohistochemical staining of knee joint tissue sections with antibody against osteocalcin (OCN) (A). Quantification of OCN+ cells within bone marrow (BM) cavity (B) and on bone surface (BS) (C). Calculation of the number of osteocytes embedded in bone matrix (D). Scale bar, 100 μm(up), 50 μm(down). TRAP staining (E) and quantification of TRAP+ cells at the bone surface (F). Scale bar, 100 μm(up), 50 μm(down). (G–K) Three-month-old Tnfrsf11aCre/+; ROSA26lsl-EYFP mice were fed with CHD or HFD for 1 month. Immunofluorescence staining of knee joint tissue sections with antibody against VPP3 (red) (G). Quantification of the number of VPP3+ cells at the bone surface (H). Scale bar, 100 μm. Immunofluorescence staining of knee joint tissue sections with antibody against GFP (green) (I). Quantification of the number of EYFP+ cells at the bone surface (J) or in the BM area (K). Scale bar, 100 μm. Ar, area; BM., bone marrow. B.S., bone surface. All data are shown as means ± standard deviations. *p<0.05, **p<0.01, and ***p<0.001. Statistical significance was determined by unpaired, two-tailed Student’s t-test.

