. 2022 Jul 25;11:e77352. doi: 10.7554/eLife.77352

Figure 2. SWR1 diffuses on extended dsDNA.

(A) Schematic representation of a C-Trap microfluidics imaging chamber with experimental workflow depicted therein: #1 catch beads, #2 catch DNA, #3 verify single tether, and #4 image SWR1 bound to DNA. (B) Schematic representation of confocal point scanning across the length of lambda DNA tethered between two optically trapped beads. This method is used to monitor the position of fluorescently labeled SWR1 bound to DNA. (C) Example kymograph with a side-by-side schematic aiding in the interpretation of the kymograph orientation. (D) Mean squared displacement (MSD) versus time for a random subset of SWR1 traces in which no ATP is added. An enlargement of the initial linear portion is shown to the left where colored dashed lines are linear fits to this portion. (E) Histogram of diffusion coefficients for dCas9 (left) and SWR1 in which no ATP is added (right). (F) Segmented traces of dCas9 (left) and SWR1 in which no ATP is added (right).

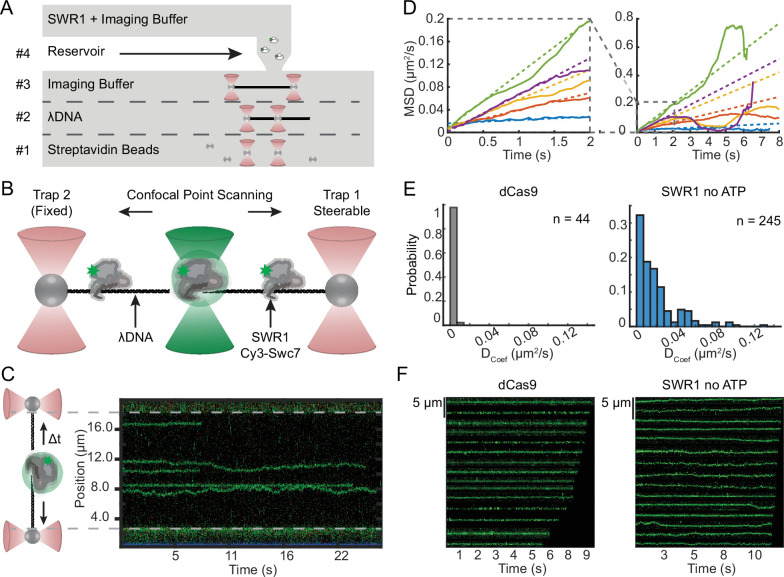
Figure 2—source data 1. Data underlying panels D and E.
Figure 2—source data 2. Uncropped kymograph Tiff image from panel C.

Figure 2.

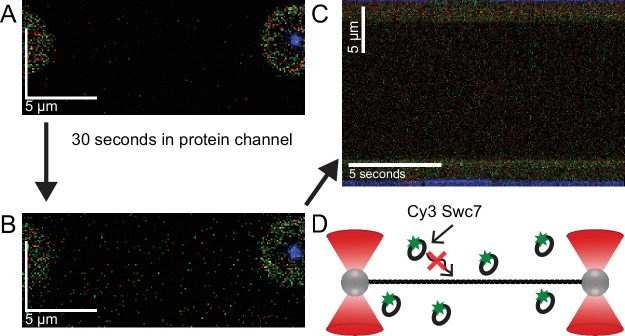
Figure 2—figure supplement 1. Cy3-Swc7 does not bind DNA without the SWR1 complex.

Figure 2—figure supplement 1.

(A) A scan of lambda DNA pulled to 5 pN of tension in the absence of Cy3-labeled Swc7 imaged with green excitation. (B) A scan of lambda DNA in Cy3-Swc7 protein channel. Protein solution was flowed briefly to refresh the protein solution in the channel before and while DNA is introduced into the channel. The amount of Cy3-labeled Swc7 is equimolar to what is used for SWR1 sliding experiments. Apart from increased background, there is no specific interaction of Cy3-Swc7 with the DNA alone. (C) A kymograph along the length of the lambda DNA at a time resolution of 0.05 s per line scan also shows no bound Cy3-Swc7. (D) Schematic summary: Cy3-Swc7 does not bind lambda DNA alone, even at the faster time resolution used to generate a kymograph.
Figure 2—figure supplement 1—source data 1. Raw scans and kymograph tiff files.