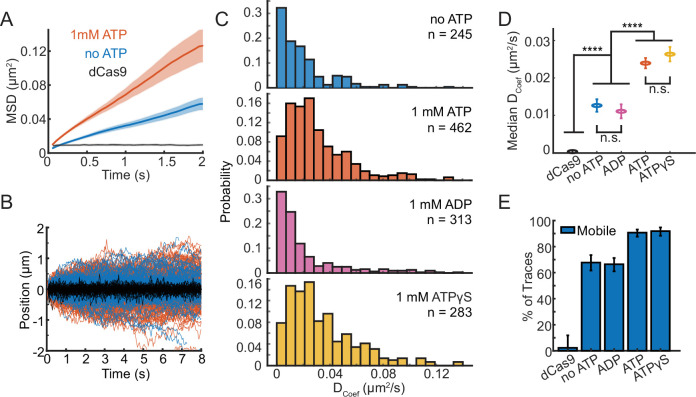
Figure 3. ATP binding modulates SWR1 diffusion.
(A) Mean squared displacement (MSD) versus time plotted for 1 mM ATP (orange, n = 124), no ATP (blue, n = 134), and dCas9 (black, n = 25) with shaded error bars standard error of the mean (SEM). (B) SWR1 trajectories aligned at their starts for 1 mM ATP (orange lines), no ATP (blue lines), and dCas9 as reference for immobility (black lines). All trajectories represented. (C) Histograms of diffusion coefficients extracted from individual trajectories for SWR1 diffusion in the presence of no ATP, 1 mM ATP, 1 mM ADP, and 1 mM ATPγS (from top to bottom). The number of molecules measured (n) for each condition is printed in each panel. (D) Median diffusion coefficients for SWR1 in varying nucleotide conditions. dCas9 is shown as a reference. Error bars are the uncertainty of the median. Statistical differences were determined via Student’s t-test, and asterisks indicate the level of significance (**** = p < 0.0001, n.s. = not significant). (E) Percentage of mobile traces in each condition, where immobility is defined as traces with similar diffusion coefficients to dCas9 (defined as diffusion coefficients smaller than 0.007 µm2/s). Error bars represent confidence intervals estimated using Matlab ‘bootci’ run with default settings and with a number of bootstrap samples = 5000, conditions with nonoverlapping error can be considered significantly different.

