Figure 5. dCas9 protein roadblocks confine SWR1 1D diffusion.
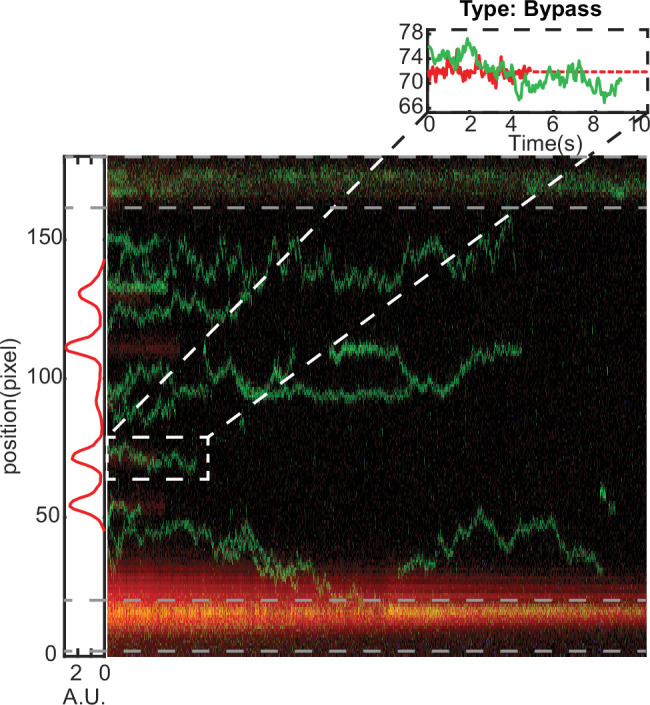
(A) Schematic of the experimental setup: five Cy5-labeled gRNA position dCas9 at five evenly spaced sites along lambda DNA. Note that diffusion is measured in the presence of 1 mM ATP and standard salt conditions (70 mM KCl). (B) Example kymograph with five bound dCas9 in red, and an example of a confined diffusion encounter. Schematic, and single-particle tracking trajectory printed above and below. (C) Pie chart of the three types of colocalization events with the total number of observations printed therein. (D) Example of SWR1 stuck to the dCas9 within limits of detection; schematic, cropped kymograph, and single-particle tracking trajectory shown. Example of a SWR1-dCas9 bypass event; schematic, cropped kymograph, and single-particle tracking trajectory shown. (B, D, E) In the example single-particle tracking trajectory, dCas9 is represented as a dashed red line after Cy5 has photobleached, however due to long binding lifetimes of dCas9 we continue to use its position for colocalization analysis.

Figure 5—figure supplement 1. SWR1 bypassing dCas9 was a rare event.