. 2022 Jul 25;11:e77352. doi: 10.7554/eLife.77352

Figure 6. Nucleosomes confine SWR1 1D diffusion.

(A) Schematic of the experimental setup, with experimental question depicted therein. Note that diffusion is measured in the presence of 1 mM ATP and standard salt conditions (70 mM KCl). (B) Example force–distance curve showing that at 15 pN nucleosomes begin to unwrap. Vertical red line shows the length of the nucleosome array 5 pN. (C) Example unwrapping events that result in characteristic lengthening of 25 nm at this force regime. (D) Lambda nucleosome arrays extension (unwrapping) and retraction curves, with a reference naked DNA force–distance curves. Black curves are unwrapping curves where the force is clamped at either 20, 25, or 30 pN to visualize individual unwrapping events; red curves are the collapse of the DNA after unwrapping nucleosomes; green curves are reference force extension plots of lambda DNA without nucleosomes. (E) Histogram of the number of nucleosomes per array determined from the length of the array at 5 pN and the compaction ratio. (F) Mean squared displacements (MSDs) are fit over the first 2 s to MSD = Dtα, the red lines represent the fits with 95% confidence interval shown as dashed lines. SWR1 diffusing on naked DNA (green curve), on lambda nucleosome arrays (blue), and for comparison dCas9 (black). (G) Representative SWR1 particles diffusing on the nucleosome arrays are cropped and arranged by the length of the trace.

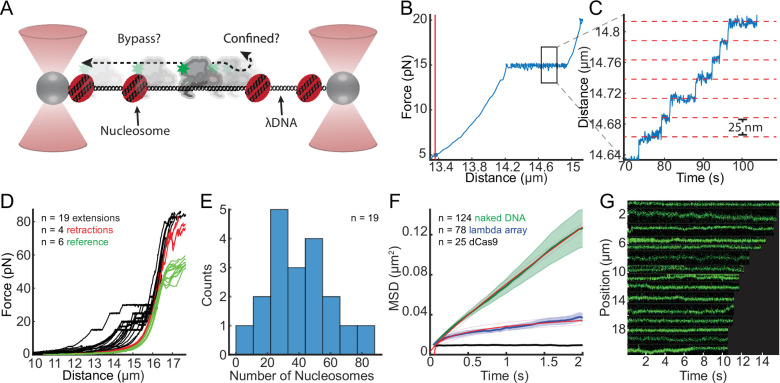
Figure 6—source data 1. Data underlying panels B, C, and E.

Figure 6.

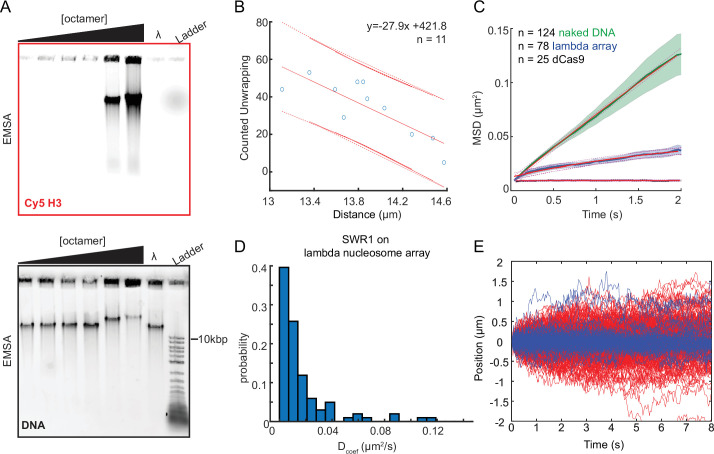
Figure 6—figure supplement 1. Primary lambda nucleosome array characterization.

Figure 6—figure supplement 1.

(A) Electrophoretic mobility shift assay (EMSA) analysis of Cy5-labeled H3 octamer (~20% labeling efficiency) reconstitution to nucleosomes onto lambda DNA via salt gradient dialysis. Typhoon imager scans (top Cy5 scan, bottom SYBR Gold scan). The octamer concentrations used are as follows reported as molar ratio of octamer to DNA, from left to right: 10:1, 50:1, 100:1, 200:1, 500:1, 700:1. Lambda DNA alone is shown for reference. The 700:1 condition was selected for use in experiments. (B) The length of the nucleosome array at 5 pN and the number of unwrapping events counted are linearly related. (C) Mean squared displacement (MSD) versus time fit to y = m*(1 − exp(−b*x)) + c. For SWR1 on the lambda nucleosome array (blue), the limit approached 0.054 µm2, whereas SWR1 diffusing on lambda DNA (green) produced a limit 1.1 µm2, and dCas9 (black) produced a limit of 0.009 µm2 which is within the limits of resolution. Fits and standard error of the mean (SEM) are overlayed. (D) Histograms of diffusion coefficients extracted from individual trajectories for SWR1 diffusion on the lambda nucleosome array and in the presence of 1 mM ATP (n = 101). (E) All trajectories for SWR1 (1 mM ATP) on naked DNA (red lines) or the nucleosome array (blue lines).
Figure 6—figure supplement 1—source data 1. Gel images (Coomassie and Cy3 scans).
Figure 6—figure supplement 1—source data 2. Data underlying panels B and D.
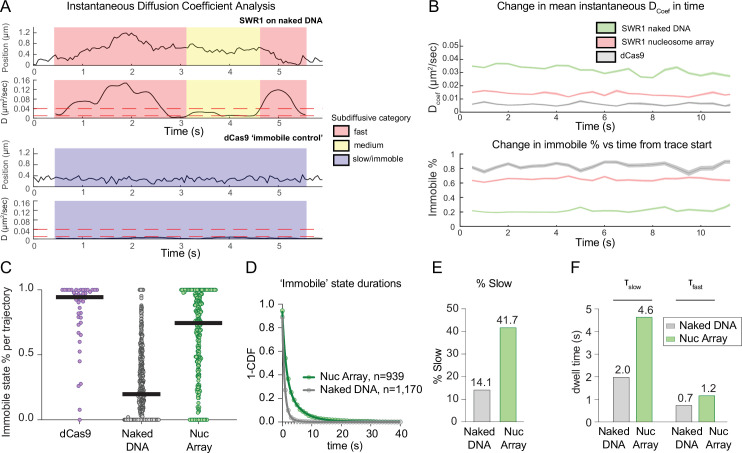
Figure 6—figure supplement 2. Instantaneous diffusion analysis of SWR1 diffusion on the lambda nucleosome array.

Figure 6—figure supplement 2.

(A) Examples illustrative of the instantaneous diffusion analysis pipeline. Briefly, trajectories are subdivided into rolling windows of roughly 0.8 s in length, and diffusion coefficients are calculated using MATLAB ‘MSD analyzer’ (Tinevez, 2022). Trajectory 1 (top) is an example of SWR1 diffusion on naked DNA, where SWR1 exhibits mostly high (diffusion coefficient >0.04 µm2/s) and medium diffusion (diffusion coefficient >0.01 and <0.04 µm2/s). Trajectory 2 (bottom) is an example of dCas9 which is used as an immobile control and exhibits mostly slow/immobile instantaneous diffusion (diffusion coefficient <0.01 µm2/s). To reduce spurious detections in high/medium/low diffusion transitions caused in part by background noise, trajectories were first smoothened and only states lasting longer than 10 frames (~0.4 s) were called as real transitions. (B) (Top plot) The instantaneous diffusion coefficient averaged for all trajectories is plotted as a function of time for SWR1 on naked DNA, on the nucleosome array and for dCas9 with standard error of the mean (standard error of the mean, SEM) shown for errors. (Bottom plot) For all trajectories aligned at their starts, the percentage of traces with instantaneous diffusion characterized as immobile is plotted as a function of time with SEM shown for errors. (C) The percentage of individual traces that is slow/immobile (dCas9 with low immobile percentages represent traces collected in the presence of high background such as those collected in the dCas9 protein channel (10 mM dCas9) or near leakage from the dCas9 protein channel). Black bars indicate a median value. (D) 1-CDF dwell-time analysis of SWR1 in the slow/immobile state. Data were best fit to a double exponential decay producing a slow and fast tau value. (E) Based on the double exponential fit, the percentage of immobile events best represented by the slow tau are plotted. (F) Slow and fast tau values for SWR1 on naked DNA versus the nucleosome array.