

Graphical abstract
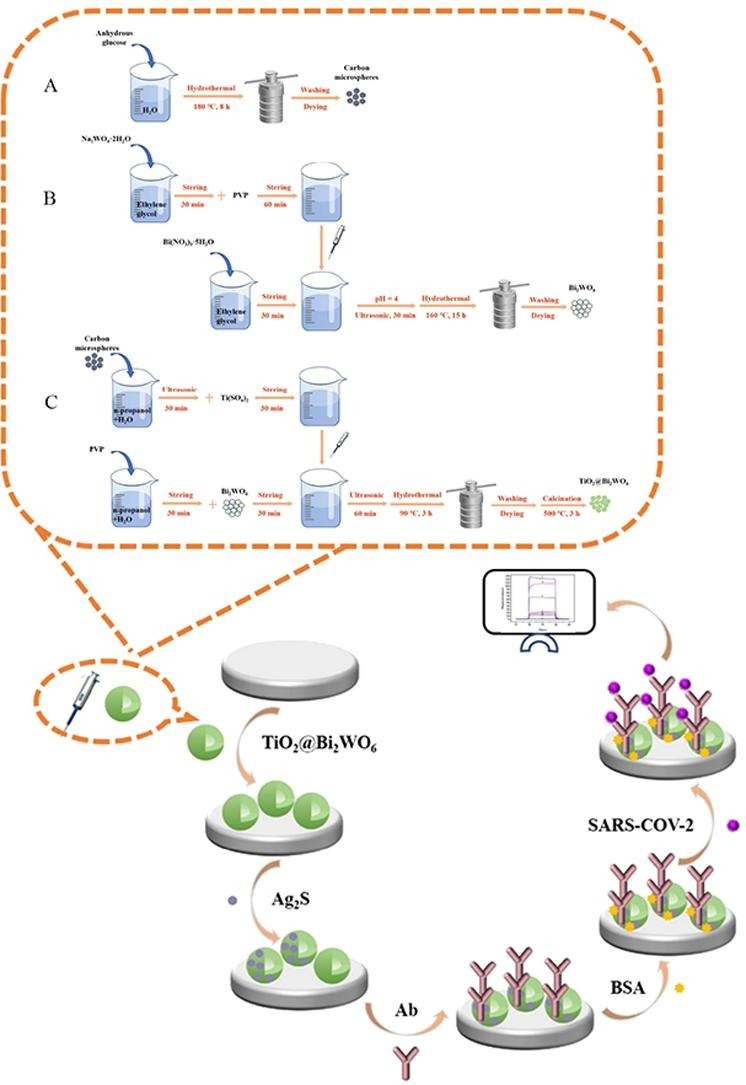
The synthesis of TiO2@Bi2WO6 hollow microspheres and schematic diagram of the label-free PEC immunosensor fabrication process. The electron-transfer mechanism of the PEC immunosensor: band gap matching of the substrate, the enhancement effect of TiO2@Bi2WO6 synthesized by the modification strategy, and the blocking effect of biological macromolecules inhibit the transfer of electrons.
Keywords: Nucleocapsid protein, TiO2@Bi2WO6 hollow microspheres, In-situ growth, PEC sensor
Abstract
Severe Acute Respiratory Syndrome Coronavirus 2 (SARS-COV-2) is a cluster of β coronaviruses. The 2019 coronavirus disease (COVID-19) caused by SARS-COV-2 is emerging as a global pandemic. Thus, early diagnosis of SARS-COV-2 is essential to prevent severe outbreaks of the disease. In this experiment, a novel label-free photoelectrochemical (PEC) immunosensor was obtained based on silver sulfide (Ag2S) sensitized titanium dioxide@bismuth tungstate (TiO2@Bi2WO6) nanocomposite for quantitative detection of SARS-COV-2 nucleocapsid protein. The constructed TiO2@Bi2WO6 hollow microspheres had large specific surface area and could produce high photocurrent intensity under visible light illumination. Ag2S was in-situ grown on the surface of thioglycolic acid (TGA) modified TiO2@Bi2WO6. In particular, TiO2@Bi2WO6 and Ag2S formed a good energy level match, which could effectively enhance the photocurrent conversion efficiency and strength the photocurrent response. Ascorbic acid (AA) acted as an effective electron donor to effectively eliminate photogenerated holes. Under optimal experimental conditions, the constructed immunosensor presented a supersensitive response to SARS-COV-2 nucleocapsid protein, with a desirable linear relationship ranged from 0.001 to 50 ng/mL for nucleocapsid protein and a lower detection limit of 0.38 pg/mL. The fabricated sensor exhibited a wide linear range, excellent selectivity, specificity and stability, which provided a valuable referential idea for the detection of SARS-COV-2.
1. Introduction
On March 11th, 2020, the novel coronavirus pneumonia (COVID-19) was declared a global pandemic by the World Health Organization [1]. COVID-19 is an infectious disease caused by the Severe Acute Respiratory Syndrome Coronavirus 2 (SARS-COV-2) virus, with significant morbidity and mortality [2]. This virus is new in terms of source of infection, mode of transmission and existence conditions, which makes it difficult for countries around the world to prevent and control [3]. Therefore, the early prevention and timely diagnosis played a key role in slowing the spread of this infectious disease [4]. SARS-COV-2 is a coronavirus with a diameter of 50 to 200 nm [5]. Its genome is composed of approximately 30,000 nucleotides encoding four structural proteins, including spike protein (SP), envelope protein (EP), membrane protein (MP) and nucleocapsid protein (NP) [6]. These proteins form an important part of the virus. Among them, NP participates in the transcription and replication of viral RNA and plays a key role in the viral life cycle [7]. At present, detection strategies for SARS-COV-2 are different. Current detection strategies could be divided into serological surveys, amplification-based detections, immunoassay detections and biosensing [8], [9]. Serological surveys methods include Rapid Diagnostic Test (RDT) [10], Enzyme-Linked Immunosorbent Assay (ELISA) [11], and Neutralization Assays (NA), which have low sensitivity and are not suitable for the early diagnosis of infection. Amplification-based technologies include Reverse Transcription Polymerase Chain Reaction (RT-PCR) [12], [13] and Nanopore Target Sequencing (NTS) [14], which have the disadvantages of long cycles, complex solutions, and the need for skilled technicians and expensive instruments. Immunological detection techniques mainly include Enzyme-Linked Immunosorbent Assay (ELISA) [15] and Lateral Flow Immunoassays (LFIA) [16], [17], all of which have the disadvantages of complex production processes of recombinant proteins and antibodies. Thus, scientists are in search of a cheap, reliable and facile method to detect SARS-COV-2 with high accuracy.
Photoelectrochemical (PEC) sensor is an emerging and rapidly evolving analytical method with the advantages of favourable selectivity, high sensitivity, simple equipment, easy miniaturization, etc. [18]. It had been used to detect immunoassays [19], nucleic acid analysis [20], enzyme biosensing [21], microorganisms [22], toxins [23] and so on. Guo et al. [24] constructed a 5G fluorescence sensor for on-line detection of SARS-COV-2 by using UCNP@mSiO2 as SP and NP quantitative probes. Lin et al. [25] proposed a sandwich/competitive immunosensor based on a lateral chromatography micro-interface for rapid and accurate quantitative detection of SARS-COV-2 neutralizing antibodies. Raziq et al. [26] had developed for the first time a portable electrochemical sensor that integrated a molecularly imprinted polymer (MIP) as a synthetic recognition element for the selective detection of SARS-COV-2 nucleoprotein. Under the current circumstances, biosensing is the most suitable technology for the facile and accurate detection of SARS-COV-2. Whereas, the research of PEC immunosensors for SARS-COV-2 NP detection have rarely been mentioned or explored to date.
The sensitivity of PEC immunosensor is affected by the photocurrent generated by the photoactive substance [27]. Hence, advanced photoactive materials with efficient photoelectric conversion can be found by improving the sensitivity of the sensor [28]. Titanium dioxide (TiO2) has been extensively investigated as a kind of typical semiconductor with broadband gap, low cost, non-toxic, and high stability [29]. However, TiO2 has a wide energy gap, which could only absorb ultraviolet light that absorbs ca. 4 % of solar energy, resulting in inefficient use of light [30]. Among the numerous TiO2 modification methods, one of the effective ways to improve the separation efficiency of photogenerated electron-hole pairs is to combine two semiconductors with different band gap widths [31]. Bismuth-based ternary oxides have good electrochemical and optical properties as a photoactive material of visible light semiconductors [32]. Bismuth tungstate (Bi2WO6) is a kind of avirulent and efficient Aurivillius-phase compounds, therefore, it caused wide attention in many research fields [32]. TiO2@Bi2WO6 hollow microspheres gained by conjugating TiO2 and Bi2WO6 can improve the absorption of visible light and the separation of electron-hole pairs with good stability [33]. In order to improve the utilization of visible light, it is an effective method to combine TiO2@Bi2WO6 with narrow bandgap semiconductors. Silver sulfide (Ag2S) is a narrow bandgap semiconductor (about 1 ev) [34] with low toxicity, excellent chemical stability and strong optical limiting properties, which contributes to the preparation of simple and stable sensors [34], [35], [36].
In this paper, a novel label-free PEC immunosensor for SARS-COV-2 NP in serum samples detection was successfully constructed based on Ag2S sensitized TiO2@Bi2WO6 nanocomposites. SARS-COV-2 NP was detected by layered strategy, using TiO2@Bi2WO6/Ag2S as the highly efficient photoactive material and SARS-COV-2 NP antibody as the recognition element. Ag2S were immobilized on the surface of TiO2@Bi2WO6 hollow microspheres through the strong coordination between the bismuth atom of TiO2@Bi2WO6 hollow microspheres and the thiol group of thioglycolic acid (TGA), which improved the photocurrent response and effectively improved the photochemical properties. In addition, the cascaded band-edge levels between TiO2 and Ag2S materials can facilitate the transfer of electrons and prevent the recombination of photoelectrically generated electron-hole pairs, resulting in a strong and stable photoelectric response [27]. Under the optimal experimental conditions, the PEC immunosensor detection of SARS-COV-2 NP shows excellent selectivity, stability, and specificity.
2. Experimental section
2.1. Reagents and solutions
All reagents were of analytical grade and used as received without further purification. Bismuth nitrate pentahydrate (Bi(NO3)3·5H2O), polyvinylpyrrolidone (PVP, MW58000, K29 ∼ 32), sodium sulfide (Na2S), N-Hydroxysuccinimide (NHS), potassium ferricyanide (K3[Fe(CN)6]), potassium ferrocyanide (K4[Fe(CN)6]·3H2O), TGA, bovine serum albumin (BSA) were obtained from Shanghai Aladdin Biochemical Technology Co., ltd. Sodium tungstate dihydrate (Na2WO4·2H2O), ethylene glycol (CH2OH)2, titanium sulfate (Ti(SO4)2), 1-Ethyl-(3-dimethylaminopropyl) carbodiimide hydrochloride (EDC) and ascorbic acid (AA) were produced by Shanghai Macklin Biochemistry Co., ltd. Silver nitrate (AgNO3), potassium chloride (KCL), n-propanol (C3H8O), anhydrous ethanol (C2H6O) and sodium hydroxide (NaOH) were purchased from Sinopharm Chemical Reagent Co., ltd. Carcinoembryonic antigen (CEA), prostate specific antigen (PSA), Insulin, cardiac troponin I (cTnI) were purchased from Shanghai Linc-Bio Science Co., ltd. COVID-19 recombinant antigen (MN908947.3) and mouse anti-human monoclonal capture antibody were obtained from Qingdao Shuojing Biological Technology Co., ltd. Indium tin oxide (ITO) glass with conductivity of 43.223 S/mm was produced by Zhuhai Kaiwo Photoelectric Technology Co., ltd. The ultrapure water (Milli-Q, Millipore) used in the experiments has a resistivity of 18.25 MΩ cm.
2.2. Apparatus
High-resolution transmission electron microscope (HRTEM) images were obtained using FEI Tecnai G2 F20 instrument (USA). Scanning electron microscope (SEM) images and energy dispersive spectroscopy (EDS) were obtained on Quanta250 (USA). UV–vis diffuse reflectance spectrum measurements were obtained using Shimadzu UV-3600 plus spectrometer (Japan). X-ray diffraction (XRD) patterns were obtained on the Bruker AXS equipment by using the D8 advanced focus diffractometer (Germany). All photocurrent measurements and Electrochemical impedance spectroscopy (EIS) analysis were performed on CHI760E electrochemical workstation (Shanghai, China) using the three-electrode system. The CEL-LED100-WL LED light source system was purchased from Beijing Zhongjiao Jinyuan Technology Co., ltd. Its spectral range is 400–780 nm, the light source intensity is measured by optical power meter, and the strongest light intensity is 120 MW/cm2. Modified ITO electrode (2.5 × 0.8 cm2) was used as the working electrode, with saturated calomel electrode as reference electrode and platinum wire as the counter electrode.
2.3. Synthesis of carbon microspheres
Carbon microspheres were synthesized with minor modifications according to the previous report [31]. 3.6 g of anhydrous glucose was dissolved in 40 mL ultrapure water, transferred to a 50 mL Teflon-lined stainless-steel autoclave and carried out at 180 °C for 8 h in an oven. The samples were naturally cooled to room temperature, centrifuged and washed with ultrapure water and absolute ethanol for several times. Then the precipitate was dried overnight in a vacuum drying oven at 60 °C, and finally the product was ground and collected for standby.
2.4. Synthesis of Bi2WO6
Bi2WO6 was synthesized with minor modifications [31]. 0.424 g Bi(NO3)3·5H2O was dispersed into 20 mL ethylene glycol and stirred for 30 min, marked as solution A. 0.144 g Na2WO4·2H2O was added to 20 mL ethylene glycol and stirred for 30 min, labeled solution B. 0.100 g PVP was dispersed to solution B and stirred for 1 h. After complete dissolution, solution B was slowly added into solution A, and an appropriate amount of NaOH solution was added to adjust the pH of the solution to 4. After ultrasonic treatment for 30 min, the mixture was transferred to Teflon-lined stainless-steel autoclave and reacted in an oven at 160 °C for 15 h. The obtained mixture was washed with ultrapure water and absolute ethanol for several times, dried in vacuum at 60 °C, ground and calcined in a muffle furnace at 450 °C for 3 h to obtain Bi2WO6 powder.
2.5. Synthesis of TiO2@Bi2WO6 hollow microspheres
TiO2@Bi2WO6 hollow microspheres were synthesized with minor modifications [31]. 0.10 g of carbon microspheres were added into a mixture of 40 mL of n-propanol and 40 mL of ultrapure water for 30 min ultrasound. 0.096 g of Ti(SO4)2 was dispersed to the above solution and stirred for 30 min, recorded as solution C. 0.20 g of PVP and 0.0064 g of Bi2WO6 were added into the mixed solution of 40 mL of n-propanol and 40 mL of ultrapure water, and stirred magnetically for 1 h, which was record as solution D. Solution C was gradually added into solution D, and dispersed it by ultrasonic for 60 min. The final mixture was transferred into a Teflon-lined stainless-steel autoclave and reacted in an oven at 90 °C for 3 h. The obtained mixture was washed with ultrapure water and absolute ethanol for several times, vacuum dried at 60 °C for 12 h, and calcined in muffle furnace at 500 °C for 3 h after grinding.
2.6. Fabrication of PEC immunosensor
The manufacturing process of the PEC immunosensor is exhibited in Scheme 1 . Before modification, the ITO glass was ultrasonically washed with acetone, absolute ethanol and ultrapure water for 30 min, and dried with high-purity nitrogen gas flow for later use. Next, TiO2@Bi2WO6 suspension (6 mg/mL, 10 µL) was dropped onto an ITO electrode and dried by infrared lamp. After calcination in 500 °C muffle furnace for 3 h, it was naturally cooled to room temperature for use. The deposition of Ag2S on TiO2@Bi2WO6 surface was obtained by continuous adsorption and some reactions of the ion layer: the TGA solution (0.1 mol/L, 3 μL) was dropped onto the TiO2@Bi2WO6 electrode surface and dried at room temperature for about 30 min, then washed with ultrapure water. AgNO3 (0.08 mol/L, 3 μL) solution was dropped onto above electrode surface at the room temperature under the dark, and then unbound AgNO3 was washed with ultrapure water after 30 min. Na2S solution (0.12 mol/L, 3 μL) was dropped on the surface of the electrode and dried naturally for 30 min without light to complete the in-situ growth of Ag2S. Then the excess Ag2S was moved with ultrapure water. In the end, the ideal ITO/TiO2@Bi2WO6/Ag2S electrode was obtained, and the sample changed from white to black, confirming the formation of a new substance Ag2S.
Scheme 1.

The synthesis process of TiO2@Bi2WO6 hollow microspheres and fabrication process of the label-free PEC immunosensor.
The TGA solution (3 mmol/L, 3 μL) was dropped onto the ITO/TiO2@Bi2WO6/Ag2S electrode and washed with ultrapure water avoiding light after 30 min at room temperature. 3 μL EDC/NHS mixed solution was dropped onto ITO/TiO2@Bi2WO6/Ag2S/TGA electrode to activate the carboxyl group, and the excess EDC/NHS was washed with ultrapure water after 30 min. SARS-COV-2 NP antibody (Ab) solution (10 µg/mL, 4 μL) was dropped onto ITO/TiO2@Bi2WO6/Ag2S/TGA/EDC/NHS, then dried at 4 °C and further washed with ultrapure water to remove the loosely bounded Ab. BSA solution (1 wt%, 4 μL) was dropped onto ITO/TiO2@Bi2WO6/Ag2S/TGA/EDC/NHS/Ab electrode to block non-specific binding sites. After incubation at room temperature for 30 min, the BSA physically adsorbed on the electrode was washed with ultrapure water. At last, different concentrations of SARS-COV-2 NP antigen (Ag, 5 μL) were placed on ITO/TiO2@Bi2WO6/Ag2S/TGA/EDC/NHS/Ab/BSA electrode for 30 min. After rinsing, the ITO/TiO2@Bi2WO6/Ag2S/TGA/EDC/NHS/Ab/BSA/Ag electrodes were successfully prepared and stored at 4 °C for standby, in case of further PEC measurement.
2.7. PEC detection
All photocurrent measurements were carried out at room temperature using phosphate buffered saline containing 0.1 mol/L AA (PBS: 1/15 mol/L KH2PO4 and 1/15 mol/L Na2HPO4, pH = 7.4) as electrolyte, with AA as an effective electron donor. PEC test used a 100 W LED lamp (white light) as the irradiation source, switched on and off every 10 s, and the applied potential of 0 V. The photocurrent was measured by current–time curve method in PEC workstation.
2.8. Detection mechanism
Under visible light irradiation, the photoinduced electrons and holes transfer mechanism of PEC sensor based on TiO2@Bi2WO6/Ag2S in the AA electrolyte environment is shown in Fig. 1 . For the TiO2@Bi2WO6/Ag2S assembled structure, TiO2, Bi2WO6 and Ag2S had different optimal absorption bands due to different energy gaps, making full use of the energy of the excitation light [37], [38]. Under visible light irradiation, TiO2, Bi2WO6 and Ag2S can all be excited to generate electrons and holes. The electron flow generated by the conduction band (CB) of Ag2S flowed to the CB of TiO2, and then transferred to the CB of Bi2WO6. Finally, the photoexcited electrons transferred to ITO electrode of external circuit through the CB of Bi2WO6. Meanwhile, the holes on the valence band (VB) of Bi2WO6 were transferred to the VB of Ag2S through TiO2. As an excellent electron donor, AA can transfer electrons to the holes in the narrow-bandgap semiconductor material VB and block the electron-hole recombination of the composite material during the charges transport process. In addition, the cascaded band-edge energy levels exhibited by TiO2, Bi2WO6, and Ag2S can facilitate the rapid charge transfer and effectively suppress the recombination of electron-hole pairs. Therefore, the photocurrent response of the immunosensor was significantly enhanced. The specific binding of SARS-COV-2 NP antibody to the antigen blocked the electron transfer of AA to the TiO2@Bi2WO6/Ag2S composite, resulting in the decrease of the photocurrent of the electrodes. With the increase of SARS-COV-2 NP antigen concentration, the photocurrent intensity decreased gradually. Thus, the assembled PEC immunosensor is able to quantitatively detect SARS-COV-2 NP.
Fig. 1.

The electron-transfer mechanism of PEC immunosensor based on TiO2@Bi2WO6/Ag2S in AA electrolyte.
3. Results and discussion
3.1. Characterization of carbon microspheres, TiO2, Bi2WO6, TiO2@Bi2WO6 and TiO2@Bi2WO6/Ag2S
SEM and HRTEM were used to characterize the morphology of nano-materials. As could be seen from Fig. 2 A and B, carbon microspheres had smooth surfaces and relatively regular spherical structures. As depicted in Fig. 2C, the SEM diagram of TiO2 microspheres synthesized by carbon microspheres. The sample was spherical with a slightly rough surface and aggregation occurred between different TiO2 microspheres. Fig. 2D showed the SEM image of Bi2WO6, which had a coarse surface and irregular morphology, small particle size and narrow particle size distribution. As exhibited in Fig. 2E, the SEM image of TiO2@Bi2WO6 hollow microsphere, which had a rough surface with a large number of Bi2WO6 particles attached to the TiO2 surface.
Fig. 2.

SEM images of carbon microspheres (A and B), TiO2 (C), Bi2WO6 (D), TiO2@Bi2WO6 (E), EDS images of Bi2WO6 (F), TiO2@Bi2WO6 (G) and TiO2@Bi2WO6/Ag2S (H).
The EDS test results of Bi2WO6, TiO2@Bi2WO6 and TiO2@Bi2WO6/Ag2S materials were depicted in Fig. 2. In the EDS image of Bi2WO6, the existence of Bi, W and O elements strongly confirmed the successful synthesis of Bi2WO6 (Fig. 2F). Ti, Bi, W and O were existed in TiO2@Bi2WO6 in the EDS image (Fig. 2G) illustrated that TiO2@Bi2WO6 hollow microspheres were successfully synthesized. The existence of Ag and S in the EDS image (Fig. 2H) of TiO2@Bi2WO6/Ag2S demonstrated that Ag2S effectively adhered to the surface of TiO2@Bi2WO6.
The HRTEM images showed the single crystal properties of the nanoparticles. Observation by HRTEM can certify the presence of heterojunctions. As illustrated in Fig. 3 A and B, TiO2 was a spherical particle with the lattice fringes of 0.32 and 0.36 nm, which respectively belonged to the (1 0 3) and (1 0 1) crystal planes of TiO2 (JCPDS#21–1272). In Fig. 3C and D, the nanosheet structure of Bi2WO6 was observed with d = 0.32 lattice spacing conforming to the typical (1 3 1) crystal planes of Bi2WO6 (JCPDS#39–0256). Fig. 3E and F displayed the HRTEM image of TiO2@Bi2WO6 hollow microsphere with Bi2WO6 particles attached on the surface, showing the distribution of Bi2WO6 on TiO2. Bi2WO6 allocated 0.35 nm lattice fringes, confirming the formation of TiO2@Bi2WO6 heterojunction.
Fig. 3.

HRTEM images of TiO2 (A and B), Bi2WO6 (C and D), TiO2@Bi2WO6 (E and F).
XRD analysis can further demonstrate the crystal structure and phase composition of samples [39]. Part of Fig. 4 showed the XRD patterns of TiO2, Bi2WO6, and TiO2@Bi2WO6 nanocomposite. According to the XRD pattern of TiO2 hollow microspheres, the diffraction peaks at 25.3°, 37.8°, 48.0°, 53.9°, 55.1°, 62.7° and 75.6° were respectively assigned to the (1 0 1), (0 0 4), (2 0 0), (1 0 5), (2 1 1), (2 0 4), (2 1 5) plans, which were indexed to the standard card (JCPDS#21–1272) [40], manifesting that TiO2 hollow microspheres were successfully obtained (Fig. 4A). Besides, Bi2WO6 was observed with the peaks at 28.3°, 32.8°, 47.2°, 55.8°, 58.6°, 68.7°, 76.1°, 78.4° singly related to (1 3 1), (0 0 2), (2 6 0)/(2 0 2), (1 3 3)/(3 3 1), (2 6 2), (4 0 0), (1 9 3)/(2 9 1), and (2 0 4)/(4 0 2) plans, without other interference diffraction peaks, which were corresponding to the standard card (JCPDS#39–0256) [41], indicating that Bi2WO6 was successfully gained (Fig. 4B). In the XRD spectrum of TiO2@Bi2WO6 hollow microspheres (Fig. 4C), all diffraction peaks were indexed by TiO2 and Bi2WO6, which indicated that the synthetic products were pure. It was worth mentioning that due to the lower content of Bi2WO6, the XRD patterns of TiO2@Bi2WO6 had fewer diffraction peaks.
Fig. 4.

(A) XRD images of TiO2, (B) XRD images of Bi2WO6, (C) XRD images of TiO2@Bi2WO6 hollow microspheres, (D) UV–vis diffuse reflectance spectra: (a) TiO2@Bi2WO6 and (b) TiO2@Bi2WO6/Ag2S.
The UV–visible diffuse reflectance spectra of TiO2@Bi2WO6 and TiO2@Bi2WO6/Ag2S were exhibited in Fig. 4D. TiO2@Bi2WO6 had high absorption in the ultraviolet region, but weak absorption in the visible light (curve a). The in-situ growth of Ag2S significantly increased the absorption area and visible light absorption, demonstrating excellent visible light activity of TiO2@Bi2WO6/Ag2S (curve b).
3.2. Characterization of the label-free immunosensor
In order to verify the successful construction of the label-free immunosensor, the electrode assembly process was monitored by the changes in photocurrent intensity at each step and EIS Nyquist plots of a series of electrodes.
As exhibited in Fig. 5 A, the blank ITO electrode was about 0 μA (curve a), with almost no photocurrent signal. When TiO2@Bi2WO6 was fixed on the electrode, the photocurrent value was about 10.78 μA (curve b). When Ag2S was fixed in the ITO/TiO2@Bi2WO6 electrode, the photocurrent signal increased significantly to 125.5 μA (curve c). Due to the sensitization effect of Ag2S, the photocurrent increased significantly and the photocurrent conversion efficiency was improved. The photocurrent of EDC/NHS (curve d, 104.6 μA), SARS-COV-2 NP antibody (curve e, 66.02 μA) and BSA (curve f, 20.92 μA) decreased gradually because of the large volume of biological macromolecules, which can generate steric hindrance, hinder the electron transfer between AA and Ag2S. In the end, SARS-COV-2 NP antigen (curve g) was immobilized on the electrode by specifically bound immune response, resulting in a significant reduction of the photocurrent to 14.62 μA. Each change in the photocurrent response indicated that the sensor had been successfully constructed.
Fig. 5.

(A) Photocurrent responses and (B) EIS Nyquist plots: (a) ITO, (b) ITO/TiO2@Bi2WO6, (c) ITO/TiO2@Bi2WO6/Ag2S, (d) ITO/TiO2@Bi2WO6/Ag2S/TGA/EDC-NHS, (e) ITO/TiO2@Bi2WO6/Ag2S/TGA/EDC-NHS/Ab, (f) ITO/TiO2@Bi2WO6/Ag2S/TGA/EDC-NHS/Ab/BSA, (g) ITO/TiO2@Bi2WO6/Ag2S/TGA/EDC-NHS/Ab/BSA/Ag.
EIS is an effective method to characterize the performance of electrode interfaces [42]. The EIS Nyquist plots of ITO electrode modified layer by layer were shown in Fig. 5B. The inset of Fig. 4B is Randles equivalent circuit, including the electrode transfer resistance (Ret), the resistance of solution (Rs), the double layer capacitance (Cdl), and the Warburg impedance (Zw) [43]. The Ret value is reflected by the semicircle diameter of the EIS Nyquist diagram, which changes with the continuous modification of the electrode [44]. Due to a certain conductivity, the Ret value (curve a) of exposed ITO electrode is very small and the corresponding semicircle diameter is low. The Ret values of TiO2@Bi2WO6 (curve b) and Ag2S (curve c) increased after successively modifying on the surface of bare ITO. Due to the obstruction of electrons, the diameter of the semicircles gradually increased, confirming the successful combination of TiO2@Bi2WO6 and Ag2S on the electrode. Using EDC/NHS organic insulating layer (curve d) as the linker, the –COOH of TGA modified Ag2S was aminated with SARS-COV-2 NP –NH2, and the Ret value was further increased. With the layer-by-layer modification of Ab (curve e), BSA (curve f), and Ag (curve g), the Ret values increased significantly, due to the protein molecules blocking electron transfer and acting as insulation. The result change of the Ret value at each step further indicated that the designed PEC immunosensor was award-winning and could be applied to the determination of SARS-COV-2 NP.
3.3. Optimization of the experimental conditions of the label-free immunosensor
In order to obtain the optimal sensor performance for SARS-COV-2 NP analysis, the concentration of TiO2@Bi2WO6 hollow microspheres, AgNO3, AA and the pH of PBS were optimized.
In order to optimize the concentration of TiO2@Bi2WO6 hollow microspheres, the influence of TiO2@Bi2WO6 suspensions with concentrations of 2 to 10 mg/mL was studied. As exhibited in Fig. 6 A, within the range of 2 to 6 mg/mL, the photocurrent signal gradually increased with the increase of the concentration of TiO2@Bi2WO6, whereas the photocurrent gradually decreased with the further increase of the concentration above 6 mg/mL. Therefore, the optimal concentration of TiO2@Bi2WO6 hollow microspheres was 6 mg/mL.
Fig. 6.

Effects of (A) concentration of TiO2@Bi2WO6 hollow microspheres, (B) concentration of the AgNO3 solution, (C) concentration of AA in the PBS buffer solution on the photocurrent response and (D) pH on the photocurrent response of ITO/TiO2@Bi2WO6 electrodes.
As could be seen from Fig. 6B, with the increase of AgNO3 solution concentration from 0.02 to 0.08 mol/L, the photocurrent signal of ITO/TiO2@Bi2WO6@Ag2S electrode increased. When the concentration of AgNO3 solution was 0.08 mol/L, the maximum photocurrent was about 127.8 μA. With the continuous increase of solution concentration, the photocurrent signal decreased significantly. In this experiment, Ag+ was completely converted into Ag2S precipitation by excess Na2S solution and deposited on the ITO/TiO2@Bi2WO6 electrode. When the concentration of AgNO3 solution exceeded 0.08 mol/L, a large amount of Ag2S was deposited on ITO/TiO2@Bi2WO6 electrode, which hindered the transmission of electrons. As a consequence, the optimal AgNO3 concentration was 0.08 mol/L.
AA was an excellent electron donor, which inhibited the e−/h+ recombination of TiO2@Bi2WO6/Ag2S composite particles. As shown in Fig. 6C, as the concentration of AA increased from 0.00 mol/L to 0.10 mol/L, the photocurrent response increased rapidly. However, the photocurrent response tended to be stable due to the saturation of electron donors. As a result, the optimal concentration of AA in PBS buffer solution was set as 0.1 mol/L.
Fig. 6D displayed the photocurrent response of the immunosensor in pH range from 5.5 to 8.4 in PBS solution. When the pH value was 7.4, the photocurrent intensity of PEC immunosensor reached its maximum value. At the same time, pH 7.4 was closer to the physiological environment of the protein. Thus, pH 7.4 was chosen as the optimal value for SARS-COV-2 measurements.
To sum up, the optimal experimental conditions had been determined. The final experimental conditions were 6 mg/mL TiO2@Bi2WO6 suspension, 0.08 mol/L AgNO3 solution, 0.1 mol/L AA and PBS solution with pH = 7.4.
3.4. Label-free PEC immunosensor determination of nucleocapsid protein
Under the optimal conditions, the developed PEC immunosensor were applied to detect different concentrations of nucleocapsid protein. As could be seen from Fig. 7 A, the photocurrent signal was highly correlated with nucleocapsid protein concentration. With the increase of nucleocapsid protein concentration, the photocurrent signal decreased regularly, indicating that the PEC immunosensor was suitable for the detection of SARS-COV-2 NP.
Fig. 7.

(A) Photocurrent response curve and (B) Logarithmic calibration curve for immunosensors for SARS-COV-2 NP (Ag) detection from 0.001 to 50 ng/mL. (C) Stability assessment of the immunosensor at 15 on/off irradiation cycles, cAg = 1 ng/mL. (D) Study on the reproduction of the immunosensor. Error bar = SD (n = 5). (E) Selectivity of the immunosensor to detect SARS-COV-2 NP: (a) Blank, (b) 100 ng/mL CEA, (c) 100 ng/mL PSA, (d) 100 ng/mL Insulin, (e) 100 ng/mL cTnI, (f) 1 ng/mL Ag, (g) 1 ng/mL Ag + 100 ng/mL CEA, (h) 1 ng/mL Ag + 100 ng/mL PSA, (i) 1 ng/mL Ag + 100 ng/mL Insulin, (j) 1 ng/mL Ag + 100 ng/mL cTnI.
Fig. 7B exhibited the linear relationship related to the logarithmic values of SARS-COV-2 NP antigen concentration from 0.001 ng/mL to 50 ng/mL with the low detection limit of 0.38 pg/mL. The linear equation was I = 14.52 – 1.98 lgc (c NP, ng/mL) with a correlation coefficient R2 = 0.9959, where I (μA) was the peak current of the immunosensor and c (ng/mL) was the concentration of NP antigen.
Compared with the previous methods on the sensor detection of NP in Table 1 , the prepared label-free immunosensor in this work has a wider linear range, a lower detection limit, and good sensitivity to the detection of SARS-COV-2 NP.
Table 1.
Comparison of the present SARS-COV-2 NP sensor detection with others reported recently.
| Entity | Analytical methods | Linear range | Detection limit | Reference |
|---|---|---|---|---|
| Screen-printed | Electrochemical sensor | 1 ng/mL to 1000 ng/mL | 0.8 pg/mL | [2] |
| Screen-printed | Miniaturized electrochemical immunosensor | 0.01 to 0.6 μg/mL | 8 ng/mL | [5] |
| UCNPs@mSiO2 | 5G-enabled fluorescence sensor | 2.2 ng/mL to 200 ng/mL | 2.2 ng/mL | [24] |
| Molecularly imprinted polymer | Electrochemical sensor | 2.22–111 fM | 15 fM | [26] |
| CRISPR/Cas12a system | Electrochemical aptamer sensor | 50 pg/mL to 100 ng/mL | 16.5 pg/mL | [45] |
| Nanodiamond assembled gold interdigitated | Biosensor | 1 fM to 100 pM | 0.389 fM | [46] |
| Plasmonic GNP | Biosensor | 150 ng/mL to 650 ng/mL | 150 ng/mL | [47] |
| Dual working screen-printed | Electrochemical immunosensor | 1 pg/mL to 10 ng/mL | 116 fg/mL and 150 fg/mL | [48] |
| Gold nanoparticle cluster | Colorimetric sensor | 0.3 ng/mL to 1,000 ng/mL | 0.038 ng/mL | [49] |
| TiO2@Bi2WO6/Ag2S | PEC | 0.001 ng/mL to 50 ng/mL | 0.38 pg/mL | This work |
3.5. Stability, reproducibility and selectivity
The stability of the immunosensor was evaluated by turning on/off 15 times of photocurrent changes. It could be seen from the results in Fig. 7C that the fabricated PEC immunosensor had no significant change in photocurrent, including 1 ng/mL NP antigen after 15 consecutive on/off irradiation cycles of 300 s, indicating that its photocurrent stability was remarkable.
In order to analyze the reproducibility of the PEC immunosensor, 5 ITO electrodes were detected by measuring 1 ng/mL NP antigen under the same conditions. As displayed in Fig. 7D, the detection data were 14.83 μA, 13.91 μA, 14.62 μA, 14.20 μA, and 14.91 μA, and the relative standard deviation (RSD) of the 5 electrodes were about 2.42 %. The results explained that the sensor had excellent reproducibility.
The assembled PEC immunosensor was selectively evaluated with CEA, PSA, Insulin and cTnI. 100 times the concentration of interfering substances (CEA, PSA, Insulin, cTnI) were added into 1 ng/mL NP antigen. As exhibited in Fig. 7E, no matter whether interfering substances were added or not, the intensity of photocurrent would not be affected, indicating the excellent selectivity and specificity of the PEC immunosensor for SARS-COV-2 NP.
3.6. Real sample analysis
In order to further evaluate the accuracy and feasibility of the sensor for actual sample analysis, the sensor was fabricated to detect the recovery rate of SARS-COV-2 NP in human serum sample by standard addition method. Healthy people serum was diluted 10 times with pH 7.4 PBS solution. As displayed in Table 2 , the concentration of SARS-COV-2 NP detected in human serum was 0 ng/mL. Under the optimum experimental conditions, the RSD was between 3.23 % and 4.95 % and the recovery rate was in the range from 99.6 % to 101.7 %. As a result, the prepared PEC illustrated a favourable application prospect in the clinical analysis and detection of SARS-COV-2.
Table 2.
The results of the SARS-COV-2 NP determination in human serum.
| SARS-COV-2 NP concentration (ng/mL) | Added NP (ng/mL) | Measured concentration (ng/mL, n = 5) | Relative standard deviation (%) | Recovery (%) |
|---|---|---|---|---|
| 0 | 0.1 | 0.0966, 0.0989, 0.108, 0.0989, 0.0955 | 4.95 | 99.6 |
| 2 | 2.08, 1.90, 2.03, 2.08, 2.06 | 3.72 | 101.5 | |
| 5 | 4.92, 5.09, 4.92, 5.28, 5.21 | 3.23 | 101.7 |
4. Conclusion
In this study, a PEC immunosensor was successfully fabricated for the first time based on TiO2@Bi2WO6@Ag2S composite material to detect SARS-COV-2 NP. In such a system, TiO2 and Bi2WO6 formed heterojunctions, which enhanced the absorption of visible light. In addition, Ag2S was used to sensitized TiO2@Bi2WO6 hollow microspheres, which could inhibit e−/h+ recombination and effectively improve the photocurrent response. The PEC immunosensor exhibited the linear range from 0.001 ng/mL to 50 ng/mL and a low detection limit of 0.38 pg/mL for SARS-COV-2 NP. This sensor proposed high sensitivity, good selectivity, reproducibility and stability, which not only provided a novel and feasible detection method for SARS-COV-2, but also offered a new idea for the design of other pathogens sensors.
CRediT authorship contribution statement
Huiqin Chang: Data curation, Investigation, Visualization, Writing – original draft. Meng Jiang: Formal analysis, Methodology. Qiying Zhu: Formal analysis, Methodology. Anqi Liu: Formal analysis, Methodology. Yuyin Wu: Formal analysis, Methodology. Canguo Li: Investigation, Validation. Xiangyue Ji: Investigation. Li Gong: Investigation. Shanshan Li: Investigation. Zhiwei Chen: Project administration, Resources. Ling Kong: Supervision, Writing – review & editing. Lei Han: Supervision, Writing – review & editing.
Declaration of Competing Interest
The authors declare that they have no known competing financial interests or personal relationships that could have appeared to influence the work reported in this paper.
Acknowledgments
This study was supported by Natural Science Foundation of Shandong Province (ZR2021MC113), Natural Science Foundation of Shandong Province (ZR2020KC030) and Youth Innovation Team Project for Talent Introduction and Cultivation in Universities of Shandong Province.
Data availability
Data will be made available on request.
References
- 1.Lugo-Morin D.R. Global food security in a pandemic: The case of the new coronavirus. COVID-19World. 2020;1:171–190. [Google Scholar]
- 2.Eissa S., Zourob M. Development of a low-cost cotton-tipped electrochemical immunosensor for the detection of SARS-COV-2. Anal Chem. 2021;93:1826–1833. doi: 10.1021/acs.analchem.0c04719. [DOI] [PubMed] [Google Scholar]
- 3.O World Health . World Health Organization; Geneva: 2020. Transmission of SARS-COV-2: implications for infection prevention precautions: scientific brief. [Google Scholar]
- 4.Ouassou H., Kharchoufa L., Bouhrim M., Daoudi N.E., Imtara H., Bencheikh N., ELbouzidi A., Bnouham M. The pathogenesis of coronavirus disease 2019 (COVID-19): evaluation and prevention. J Immunol Res. 2020;2020:1357983. doi: 10.1155/2020/1357983. [DOI] [PMC free article] [PubMed] [Google Scholar]
- 5.Fabiani L., Saroglia M., Galata G., Santis R.D., Fillo S., Luca V., Faggioni G., D'Amore N., Regalbuto E., Salvatori P., Terova G., Moscone D., Lista F., Arduini F. Magnetic beads combined with carbon black-based screen-printed electrodes for COVID-19: A reliable and miniaturized electrochemical immunosensor for SARS-COV-2 detection in saliva. Biosens Bioelectron. 2021;171 doi: 10.1016/j.bios.2020.112686. [DOI] [PMC free article] [PubMed] [Google Scholar]
- 6.Satarker S., Nampoothiri M. Structural proteins in severe acute respiratory syndrome coronavirus-2. Arch. Med. Res. 2020;51:482–491. doi: 10.1016/j.arcmed.2020.05.012. [DOI] [PMC free article] [PubMed] [Google Scholar]
- 7.Peng Y., Du N., Lei Y.Q., Dorje S., Qi J.X., Luo T.R., Gao G.F., Song H. Structures of the SARS-COV-2 nucleocapsid and their perspectives for drug design. EMBO J. 2020;39 doi: 10.15252/embj.2020105938. [DOI] [PMC free article] [PubMed] [Google Scholar]
- 8.Sengupta J., Hussain C.M. Graphene-based field-effect transistor biosensors for the rapid detection and analysis of viruses: A perspective in view of COVID-19. Carbon Trends. 2021;2 doi: 10.1016/j.cartre.2020.100011. [DOI] [PMC free article] [PubMed] [Google Scholar]
- 9.Kumar N., Shetti N.P., Jagannath S., Aminabhavi T.M. Electrochemical sensors for the detection of SARS-COV-2 virus. Chem Eng J. 2022;430 doi: 10.1016/j.cej.2021.132966. [DOI] [PMC free article] [PubMed] [Google Scholar]
- 10.Cubas-Atienzar A.I., Kontogianni K., Edwards T., Wooding D., Buist K., Thompson C.R., Williams C.T., Patterson E.I., Hughes G.L., Baldwin L., Escadafal C., Sacks J.A., Adams E.R. Limit of detection in different matrices of 19 commercially available rapid antigen tests for the detection of SARS-COV-2. Sci Rep. 2021;11:18313. doi: 10.1038/s41598-021-97489-9. [DOI] [PMC free article] [PubMed] [Google Scholar]
- 11.Rump A., Risti R., Kristal M.L., Reut J., Syritski V., Lookene A., Boudinot S.R. Dual ELISA using SARS-COV-2 nucleocapsid protein produced in E. coli and CHO cells reveals epitope masking by N-glycosylation. Biochem Biophys Res Commun. 2021;534:457–460. doi: 10.1016/j.bbrc.2020.11.060. [DOI] [PMC free article] [PubMed] [Google Scholar]
- 12.Chu D.K.W., Pan Y., Cheng S.M.S., Hui K.P.Y., Krishnan P., Liu Y., Ng D.Y.M., Wan C.K.C., Yang P., Wang Q.Y., Peiris M., Poon L.L.M. Molecular diagnosis of a novel coronavirus (2019-nCoV) Causing an outbreak of pneumonia. Clin Chem. 2020;66:549–555. doi: 10.1093/clinchem/hvaa029. [DOI] [PMC free article] [PubMed] [Google Scholar]
- 13.Won J., Lee S., Park M., Kim T.Y., Park M.G., Choi B.Y., Kim D., Chang H., Heo W.D., Kim V.N., Lee C.J. Development of a laboratory-safe and low-cost detection protocol for SARS-COV-2 of the coronavirus disease 2019 (COVID-19) Experimental Neurobiology. 2020;29 doi: 10.5607/en20009e1. [DOI] [PMC free article] [PubMed] [Google Scholar]
- 14.Liu W.B., Liu L., Kou G.M., Zheng Y.Q., Ding Y.J., Ni W.X., Wang Q.S., Tan L., Wu W.L., Tang S., Xiong Z., Zheng S.G., McAdam Alexander J. Evaluation of nucleocapsid and spike protein-based enzyme-linked immunosorbent assays for detecting antibodies against SARS-COV-2. J. Clin. Microbiol. 2020;58:e00461–00420. doi: 10.1128/JCM.00461-20. [DOI] [PMC free article] [PubMed] [Google Scholar]
- 15.Wang M., Fu A.S., Hu B., Tong Y.Q., Liu R., Liu Z., Gu J.S., Xiang B., Liu J.H., Jiang W., Shen G.G., Zhao W.X., Men D., Deng Z.X., Yu L.L., Wei W., Li Y., Liu T.G. Nanopore Targeted sequencing for the accurate and comprehensive detection of SARS-COV-2 and Other respiratory viruses. Small. 2020;16 doi: 10.1002/smll.202002169. [DOI] [PMC free article] [PubMed] [Google Scholar]
- 16.Cavalera S., Colitti B., Rosati S., Ferrara G., Bertolotti L., Nogarol C., Guiotto C., Cagnazzo C., Denina M., Fagioli F., Nardo F.D., Chiarello M., Baggiani C., Anfossi L. A multi-target lateral flow immunoassay enabling the specific and sensitive detection of total antibodies to SARS COV-2. Talanta. 2021;223 doi: 10.1016/j.talanta.2020.121737. [DOI] [PMC free article] [PubMed] [Google Scholar]
- 17.Li Z.T., Yi Y.X., Luo X.M., Xiong N., Liu Y., Li S.Q., Sun R.L., Wang Y.Q., Hu B.C., Chen W., Zhang Y.C., Wang J., Huang B.F., Lin Y., Yang J.S., Cai W.S., Wang X.F., Cheng J., Chen Z.Q., Sun K.J., Pan W.M., Zhan Z.F., Chen L.Y., Ye F. Development and clinical application of a rapid IgM-IgG combined antibody test for SARS-COV-2 infection diagnosis. J Med Virol. 2020;92:1518–1524. doi: 10.1002/jmv.25727. [DOI] [PMC free article] [PubMed] [Google Scholar]
- 18.Zhang Z.X., Zhao C.Z. Progress of photoelectrochemical analysis and sensors. Chin. J. Anal. Chem. 2013;41:436–444. doi: 10.1016/s1872-2040(13)60637-4. [DOI] [Google Scholar]
- 19.Zhu Q.Y., Li C.G., Chang H.Q., Jiang M., Sun X.K., Jing W., Huang H.W., Huang D., Kong L., Chen Z.W., Sang F., Zhang X.Z. A label-free photoelectrochemical immunosensor for prostate specific antigen detection based on Ag2S sensitized Ag/AgBr/BiOBr heterojunction by in-situ growth method. Bioelectrochemistry. 2021;142 doi: 10.1016/j.bioelechem.2021.107928. [DOI] [PubMed] [Google Scholar]
- 20.Wang X.Y., Rong X.J., Zhang Y., Luo F., Qiu B., Wang J., Lin Z.Y. Homogeneous photoelectrochemical aptasensors for tetracycline based on sulfur-doped g-c3n4/n-gan heterostructures formed through self-assembly. Anal. Chem. 2022;94:3735–3742. doi: 10.1021/acs.analchem.2c00118. [DOI] [PubMed] [Google Scholar]
- 21.Chen D.L., Wang X.H., Zhang K.X., Cao Y., Tu J.C., Xiao D., Wu Q. Glucose photoelectrochemical enzyme sensor based on competitive reaction of ascorbic acid. Biosens Bioelectron. 2020;166 doi: 10.1016/j.bios.2020.112466. [DOI] [PubMed] [Google Scholar]
- 22.Zhou X., Zhang P.B., Lv F.T., Liu L.B., Wang S. photoelectrochemical strategy for discrimination of microbial pathogens using conjugated polymers. Chem Asian J. 2018;13:3469–3473. doi: 10.1002/asia.201800783. [DOI] [PubMed] [Google Scholar]
- 23.Liu M.C., Ding X., Yang Q.W., Wang Y., Zhao G.H., Yang N.J. A pM leveled photoelectrochemical sensor for microcystin-LR based on surface molecularly imprinted TiO2@CNTs nanostructure. J. Hazard. Mater. 2017;331:309–320. doi: 10.1016/j.jhazmat.2017.02.031. [DOI] [PubMed] [Google Scholar]
- 24.Guo J.C., Chen S.Q., Tian S.L., Liu K., Ni J., Zhao M., Kang Y.J., Ma X., Guo J.H. 5G-enabled ultra-sensitive fluorescence sensor for proactive prognosis of COVID-19. Biosens. Bioelectron. 2021;181 doi: 10.1016/j.bios.2021.113160. [DOI] [PMC free article] [PubMed] [Google Scholar]
- 25.Lin Q.Y., Wu J.J., Liu L.L., Wu W.J., Fang X.E., Kong J.L. Sandwich/competitive immuno-sensors on micro-interface for SARS-COV-2 neutralizing antibodies. Anal. Chim. Acta. 2021;1187 doi: 10.1016/j.aca.2021.339144. [DOI] [PMC free article] [PubMed] [Google Scholar]
- 26.Raziq A., Kidakova A., Boroznjak R., Reut J., Opik A., Syritski V. Development of a portable MIP-based electrochemical sensor for detection of SARS-COV-2 antigen. Biosens Bioelectron. 2021;178 doi: 10.1016/j.bios.2021.113029. [DOI] [PMC free article] [PubMed] [Google Scholar]
- 27.Qian Y.R., Feng J.H., Fan D.W., Zhang Y., Kuang X., Wang H., Wei Q., Ju H.X. A sandwich-type photoelectrochemical immunosensor for NT-pro BNP detection based on F-Bi2WO6/Ag2S and GO/PDA for signal amplification. Biosens Bioelectron. 2019;131:299–306. doi: 10.1016/j.bios.2019.02.029. [DOI] [PubMed] [Google Scholar]
- 28.Zhu J.H., Gou H.W., Zhao T.J., Mei L.P., Wang A.J., Feng J.J. Ultrasensitive photoelectrochemical aptasensor for detecting telomerase activity based on Ag2S/Ag decorated ZnIn2S4/C3N4 3D/2D Z-scheme heterostructures and amplified by Au/Cu2+-boron-nitride nanozyme. Biosens. Bioelectron. 2022;203 doi: 10.1016/j.bios.2022.114048. [DOI] [PubMed] [Google Scholar]
- 29.Guo Q., Zhou C.Y., Ma Z.B., Yang X.M. Fundamentals of TiO2 Photocatalysis: Concepts. Mechanisms, and Challenges, Adv Mater. 2019;31 doi: 10.1002/adma.201901997. [DOI] [PubMed] [Google Scholar]
- 30.Wang B., Liu Z.F., Han J.H., Hong T.T., Zhang J., Li Y.J., Cui T. Hierarchical graphene/CdS/Ag2S sandwiched nanofilms for photoelectrochemical water splitting. Electrochim. Acta. 2015;176:334–343. doi: 10.1016/j.electacta.2015.07.021. [DOI] [Google Scholar]
- 31.Song X.L., Wang R., Wang J., Huang Z.L., Ye S.Y., Dionysiou D.D. Construction of TiO2@Bi2WO6 hollow microspheres by template method for enhanced degradation of ethylene under visible light. Opt. Mater. 2021;113 doi: 10.1016/j.optmat.2021.110839. [DOI] [Google Scholar]
- 32.Hou Y.X., Zhu L.L., Hao H.S., Zhang Z.W., Ding C., Zhang G.L., Bi J.R., Yan S., Liu G.S., Hou H.M. A novel photoelectrochemical aptamer sensor based on rare-earth doped Bi2WO6 and Ag2S for the rapid detection of Vibrio parahaemolyticus. Microchem. J. 2021;165 doi: 10.1016/j.microc.2021.106132. [DOI] [Google Scholar]
- 33.Shaheer A.R.M., Thangavel N., Rajan R., Abraham D.A., Vinoth R., Devi K.R.S., Shankar M.V., Neppolian B. Sonochemical assisted impregnation of Bi2WO6 on TiO2 nanorod to form Z-scheme heterojunction for enhanced photocatalytic H2 production. Adv. Powder Technol. 2021;32:4734–4743. doi: 10.1016/j.apt.2021.10.022. [DOI] [Google Scholar]
- 34.Tang R.F., Su H.F., Sun Y.W., Zhang X.X., Li L., Liu C.H., Wang B.Q., Zeng S.Y., Sun D.Z. Facile fabrication of bi2wo6/ag2s heterostructure with enhanced visible-light-driven photocatalytic performances. Nanoscale Res Lett. 2016;11:126. doi: 10.1186/s11671-016-1319-7. [DOI] [PMC free article] [PubMed] [Google Scholar]
- 35.Neves M.C., Nogueira J.M.F., Trindade T., Mendonça M.H., Pereira M.I., Monteiro O.C. Photosensitization of TiO2 by Ag2S and its catalytic activity on phenol photodegradation. J. Photochem. Photobiol., A. 2009;204:168–173. doi: 10.1016/j.jphotochem.2009.03.014. [DOI] [Google Scholar]
- 36.Fan D.W., Wang H.Y., Khan M.S., Bao C.Z., Wang H., Wu D., Wei Q., Du B. An ultrasensitive photoelectrochemical immunosensor for insulin detection based on BiOBr/Ag2S composite by in-situ growth method with high visible-light activity. Biosens Bioelectron. 2017;97:253–259. doi: 10.1016/j.bios.2017.05.044. [DOI] [PubMed] [Google Scholar]
- 37.Hu X.L., Li Y.Y., Tian J., Yang H.R., Cui H.Z. Highly efficient full solar spectrum (UV-vis-NIR) photocatalytic performance of Ag2S quantum dot/TiO2 nanobelt heterostructures. J. Ind. Eng. Chem. 2017;45:189–196. doi: 10.1016/j.jiec.2016.09.022. [DOI] [Google Scholar]
- 38.Feng J.H., Li Y.Y., Gao Z.Q., Lv H., Zhang X.B., Fan D.W., Wei Q. Visible-light driven label-free photoelectrochemical immunosensor based on TiO2/S-BiVO4@Ag2S nanocomposites for sensitive detection OTA. Biosens. Bioelectron. 2018;99:14–20. doi: 10.1016/j.bios.2017.07.029. [DOI] [PubMed] [Google Scholar]
- 39.Chen Y.P., Lin S.Y., Sun R.M., Wang A.J., Zhang L., Ma X.H., Feng J.J. FeCo/FeCoP encapsulated in N, Mn-codoped three-dimensional fluffy porous carbon nanostructures as highly efficient bifunctional electrocatalyst with multi-components synergistic catalysis for ultra-stable rechargeable Zn-air batteries. J Colloid Interface Sci. 2022;605:451–462. doi: 10.1016/j.jcis.2021.07.082. [DOI] [PubMed] [Google Scholar]
- 40.Hafeez H.Y., Lakhera S.K., Karthik P., Anpo M., Neppolian B. Facile construction of ternary CuFe2O4-TiO2 nanocomposite supported reduced graphene oxide (rGO) photocatalysts for the efficient hydrogen production. Appl. Surf. Sci. 2018;449:772–779. doi: 10.1016/j.apsusc.2018.01.282. [DOI] [Google Scholar]
- 41.Lu Q., Dong C.C., Wei F., Li J.D., Wang Z., Mu W., Han X.J. Rational fabrication of Bi2WO6 decorated TiO2 nanotube arrays for photocatalytic degradation of organic pollutants. Mater. Res. Bull. 2022;145 doi: 10.1016/j.materresbull.2021.111563. [DOI] [Google Scholar]
- 42.Yang L., Zhu W.J., Ren X., Khan M.S., Zhang Y., Du B., Wei Q. Macroporous graphene capped Fe3O4 for amplified electrochemiluminescence immunosensing of carcinoembryonic antigen detection based on CeO2@TiO2. Biosens Bioelectron. 2017;91:842–848. doi: 10.1016/j.bios.2017.01.055. [DOI] [PubMed] [Google Scholar]
- 43.Pang X.H., Cui C., Su M.H., Wang Y.G., Wei Q., Tan W.H. Construction of self-powered cytosensing device based on ZnO nanodisks@g-C3N4 quantum dots and application in the detection of CCRF-CEM cells. Nano Energy. 2018;46:101–109. doi: 10.1016/j.nanoen.2018.01.018. [DOI] [PMC free article] [PubMed] [Google Scholar]
- 44.Hu T., Zheng Y.N., Li M.J., Liang W.B., Chai Y.Q., Yuan R. A highly sensitive photoelectrochemical assay with donor-acceptor-type material as photoactive material and polyaniline as signal enhancer. Anal Chem. 2018;90:6096–6101. doi: 10.1021/acs.analchem.8b00093. [DOI] [PubMed] [Google Scholar]
- 45.Han C., Li W.J., Li Q., Xing W.P., Luo H., Ji H.S., Fang X.N., Luo Z.F., Zhang L.Y. CRISPR/Cas12a-Derived electrochemical aptasensor for ultrasensitive detection of COVID-19 nucleocapsid protein. Biosens Bioelectron. 2022;200 doi: 10.1016/j.bios.2021.113922. [DOI] [PubMed] [Google Scholar]
- 46.Ramanathan S., Gopinath S.C.B., Ismail Z.H., Arshad M.K.M., Poopalan P. Aptasensing nucleocapsid protein on nanodiamond assembled gold interdigitated electrodes for impedimetric SARS-COV-2 infectious disease assessment. Biosens Bioelectron. 2022;197 doi: 10.1016/j.bios.2021.113735. [DOI] [PMC free article] [PubMed] [Google Scholar]
- 47.Behrouzi K., Lin L.W. Gold nanoparticle based plasmonic sensing for the detection of SARS-COV-2 nucleocapsid proteins. Biosens Bioelectron. 2022;195 doi: 10.1016/j.bios.2021.113669. [DOI] [PMC free article] [PubMed] [Google Scholar]
- 48.Salahandish R., Haghayegh F., Ayala-Charca G., Hyun J.E., Khalghollah M., Zare A., Far B., Berenger B.M., Niu Y.D., Ghafar-Zadeh E., Sanati-Nezhad A. Bi-ECDAQ: An electrochemical dual-immuno-biosensor accompanied by a customized bi-potentiostat for clinical detection of SARS-COV-2 Nucleocapsid proteins. Biosens Bioelectron. 2022;203 doi: 10.1016/j.bios.2022.114018. [DOI] [PMC free article] [PubMed] [Google Scholar]
- 49.Oh H.K., Kim K., Park J., Im H., Maher S., Kim M.G. Plasmon color-preserved gold nanoparticle clusters for high sensitivity detection of SARS-COV-2 based on lateral flow immunoassay. Biosens Bioelectron. 2022;205 doi: 10.1016/j.bios.2022.114094. [DOI] [PMC free article] [PubMed] [Google Scholar]
Associated Data
This section collects any data citations, data availability statements, or supplementary materials included in this article.
Data Availability Statement
Data will be made available on request.