

Abstract
Background
The link between oral diseases and mortality remains under-explored. We aimed to evaluate the associations between tooth count, untreated caries and risk of all-cause and cause-specific mortality.
Methods
Data on 24 029 adults from the National Health and Nutrition Examination Survey 1988–94/1999–2010, with mortality linkage to the National Death Index to 31 December 2015, were analysed. Baseline total number of permanent teeth and any untreated caries were assessed by trained dental professionals.
Results
During up to 27 years of follow-up, 5270 deaths occurred. Fewer permanent teeth were associated with higher all-cause mortality, including heart disease and cancer mortality (all P <0.05 for trend) but not cerebrovascular disease mortality. For every 10 teeth missing, the multivariable-adjusted hazard ratios (HRs) were 1.13 (95% CI: 1.08 to 1.18) for all-cause, 1.16 (95% CI: 1.05, 1.29) for heart disease and 1.19 (95% CI: 1.09, 1.29) for cancer mortality. Untreated caries was associated with increased all-cause (HR: 1.26, 95% CI: 1.15, 1.39) and heart disease mortality (HR: 1.48, 95% CI: 1.17, 1.88) but not cerebrovascular disease/cancer mortality, after adjusting for tooth count, periodontitis and sociodemographic/lifestyle factors. Compared with those without untreated caries and with 25–28 teeth, individuals with untreated caries and 1–16 teeth had a 53% increased risk of all-cause mortality (HR: 1.53, 95% CI: 1.27, 1.85) and 96 % increased risk of heart disease mortality (HR: 1.96, 95% CI: 1.28, 3.01).
Conclusions
In nationally representative cohorts, fewer permanent teeth and untreated caries were associated with all-cause and heart disease mortality. Fewer teeth were also associated with higher cancer mortality.
Keywords: Oral health, caries, mortality
Key Messages.
In US nationally representative cohorts, every 10 teeth missing was associated with 13% higher risk of all-cause mortality, 16% higher risk of heart disease mortality and 19% higher risk of cancer mortality.
Untreated caries were associated with 26% increased risk of all-cause mortality and 48% increased risk of heart disease mortality, independent of tooth count and periodontitis.
These associations were largely consistent within strata of age, sex, race/ethnicity, poverty level, dental insurance, smoking status and consumption of added sugar.
Our findings serve as a significant step in connecting oral health, including common oral disease, with mortality and extends the previous call for integrating oral and general health.
Introduction
Oral diseases, primarily dental decay, periodontal disease and subsequent tooth loss, affected more than 3.5 billion people worldwide in 2015.1 Despite declines in children, oral diseases remain prevalent in US adults with stark, persistent socioeconomic disparities.2,3
Oral diseases share risk factors such as sugar, alcohol and tobacco consumption with systemic diseases.4,5 Besides, oral pathogens, their products or pathogen-induced oral inflammatory mediators can trigger host inflammatory responses either locally or at distant body sites.6–8 Periodontal disease, which often involves specific pathogenic bacteria,8 has long been associated with cardiovascular disease (CVD)9,10 and emerges as a risk factor for diabetes11 and cancers.12 Tooth loss, an endpoint that captures the cumulative lifetime history of caries and periodontal disease, has been linked with increased all-cause mortality whereas findings on CVD mortality were mixed.13–16 Further, the association of tooth loss with cancer mortality remains under-explored.
Given the modifiable nature of oral diseases, understanding the link between the full spectrum of oral diseases and major chronic diseases/premature mortality is an unmet public health priority.5 Of particular interest is untreated caries, where overabundant cariogenic bacteria can induce transient bacteremia and subsequent inflammatory injury.7,17 Caries is a chronic, progressive condition that tracks across the lifespan.18 Research reporting positive associations between caries and CVD risk has just begun to emerge.19,20 In a large prospective study from Korea, individuals with untreated caries had up to 22% increased risk of major cardiovascular events including cardiac death, myocardial infarction, stroke and heart failure.19 Yet, studies in Western populations are limited and have not examined the link between untreated caries and CVD and other cause-specific mortality. The collective influence of tooth loss and untreated caries also remains unknown.
To address these knowledge gaps, we examined the associations between tooth count, untreated caries and risk of all-cause and cause-specific mortality among nationally representative samples of US adults, with comprehensive adjustment of potential confounders.
Methods
Study population
The National Health and Nutrition Examination Survey (NHANES)21 surveys a nationally representative sample of the civilian non-institutionalized US population using a complex, stratified, multistage probability sampling design. The NHANES comprises household interviews and physical examinations at a mobile examination centre (MEC), conducted periodically before 1994 and continuously in biennial cycles since 1999. Within each cycle, a subset of participants completed an oral health examination at an MEC and the information collected was used to estimate US prevalence of tooth retention/loss and untreated caries.22,23 All NHANES protocols were approved by the National Center for Health Statistics Research Ethics Review Board and all participants provided written informed consent.
We restricted the sample to adults aged 30 years or older, who completed tooth count or coronal caries examination in NHANES 1988–94 (NHANES III) and 1999–2010. According to analytical guidelines from NHANES24,25 and prior analyses on the trends of oral health,22 we separated analyses for NHANES 1988–94 from 1999–2010. We excluded: individuals with self-reported heart disease (excluding angina), cerebrovascular disease or cancer at baseline; without linked mortality data; deaths due to accidents; body mass index (BMI) <18.5 due to potential severe underlying health problems;26and missing data for covariates except dental insurance and periodontitis. Finally, 24 029 participants (8829 from 1988–94 and 15 200 from 1999–2010) were included (Supplementary Figure S1, available as Supplementary data at IJE online).
Assessment of tooth count and untreated caries
Numbers of permanent teeth and untreated caries were evaluated during the dental examination performed by trained dentists (1988–94 and 1999–2004),22,27,28 health technologists (2005–08)29 or dental hygienists (2009–10)30 using a disposable dental mirror. The number of permanent teeth, including root fragments, was determined by assessing each tooth position of the mouth with a maximum number of 28 (excluding third molars). Since prophylactic extraction of third molars/wisdom teeth is much more common among individuals with high socioeconomic status31 and wisdom teeth do not represent poor oral health nor have been linked with chronic health outcomes,32 we did not account for wisdom teeth while deriving the total tooth count. We further categorized continuous tooth count into four pre-defined groups [25–28, 17–24, 1–16 and 0 (edentulism)] based on prior publications.22,33,34 Untreated caries was defined as the presence of at least one tooth with an untreated coronal carious lesion in 1988–94 and 1999–2008. In 2009–10, untreated caries was determined by examiner’s recommendation for care due to the presence of decayed teeth.35 Reports on quality assurance showed high examiner reliability for the measurement of both tooth count and untreated caries.27–30
Ascertainment of death
Mortality status was ascertained based on data constructed by the National Center for Health Statistics via probabilistic matching to the National Health Death Index through 31 December 2015.36 Deaths were classified by the 10th revision of International Classification of Diseases (ICD-10). Our primary outcome of interest is all-cause mortality, with heart disease (I00-I09, I11, I13 and I20-I51), cerebrovascular disease (I60-I69), cancer (C00-C97) and other mortality (the rest of the ICD-10 codes) as secondary outcomes.37
Assessment of covariates
Age, sex, race/ethnicity, family poverty income ratio (PIR; the ratio of family income to poverty guidelines), education, health and dental insurance, leisure-time physical activity and smoking status were self-reported from baseline questionnaires. ‘Ever smoker’ included those who had smoked 100 cigarettes in their life and ‘never smoker’ was defined as those who had not. Pack-years were calculated as the number of cigarettes smoked per day divided by 20 and multiplied by the number of years of smoking. Weight status was determined by BMI based on anthropometric examination. Information on total energy intake, alcohol consumption, calories from added sugar/carbohydrate and Healthy Eating Index38 (HEI 1994–96 for 1988–94 and HEI-2010 for 1999–2010) were derived from 24-h dietary recalls.26 History of diabetes, hypertension, high cholesterol and angina was defined using self-reported diagnosis, symptoms39 or treatment. Hypertension was also determined by blood pressure examination, and high cholesterol was determined by laboratory test of total cholesterol.40 Missing indicators for dental insurance were used over 2005–10 due to lack of data. The severity of periodontitis was determined by the Centers of Disease Control and Prevention-American Academy of Periodontology (CDC-AAP) definition based on pocket depth and attachment loss at two interproximal sites (mesio- and mid-facial) for each fully erupted tooth (excluding third molars) in two randomly chosen quadrants (one in the maxillary and one in the mandibular).41
Statistical analysis
Sample weights, clustering and stratification were applied to all analyses to account for the complex sampling design of NHANES.24,25,37,42 Characteristics of the study population were described according to the numbers of permanent teeth and untreated caries. Prevalence of tooth count and untreated caries by selected characteristics was directly standardized to age distribution (in 10-year age groups) of the US 2000 Census population.43 For mortality analyses, person-years accrued from the examination date to the date of death or the end of follow-up (31 December 2015), whichever came first. Cox proportional hazard models were used to calculate hazard ratios (HRs) and 95% confidence intervals (CIs) between the numbers of permanent teeth and untreated caries, respectively, with mortality outcomes of interest. P-values for trend were estimated using tooth count as a continuous variable.
The multivariable model for tooth count was adjusted for: age (years), sex (female/male), race/ethnicity (non-Hispanic White, non-Hispanic Black, Hispanic or others), family PIR (0–1.30, 1.31–3.50 or ≥3.51),25 education (<high school, high school or >high school), health insurance (private, non-private or none) and dental insurance (yes, no or missing), personal history of diabetes, hypertension, high cholesterol and angina (yes/no), weight status (normal, BMI: 18.5–24.9; overweight, BMI: 25–29.9; obese, BMI ≥30), leisure-time physical activity (yes/no),42 smoking status (never, past smoker with <20 pack-years, past smoker with ≥20 pack-years, current smoker with <20 pack-years or current smoker with ≥20 pack-years), alcohol consumption (none, moderate,or excessive),44 daily energy intake (kcal), calories from added sugar (<5%, 5%–<10%, 10%–<25% or ≥25%),26 calories from carbohydrate (<45%, 45%–65% or >65%),45 and Healthy Eating Index (quintile) and survey cycle (continuous).
As pathogenic bacteria associated with untreated caries are different from periodontal diseases, and most tooth losses are due to periodontal diseases,7,8 we hypothesized that untreated caries affects systemic diseases through different biological pathways from the other two oral conditions. Therefore, for analyses of untreated caries among dentate (≥1 tooth) individuals, periodontitis (none, mild, moderate, severe or missing)41 and number of permanent teeth were additionally adjusted for to delineate the associations independent of periodontitis and tooth count. Sensitivity analyses that removed hypertension/diabetes from the models were also performed. Proportional hazards assumptions were tested using Schoenfeld residuals, and age (5-year intervals) and sex (female/male) were used as stratum variables. Age- and multivariable-adjusted HRs in each cohort (1988–94 and 1999–2010) were pooled using a fixed-effects model assuming the same true effect, as these two cohorts both represented the US population.46 Sensitivity analysis using a random-effects model was also conducted. E-values, which quantify the minimum effect required for an unmeasured confounder on both exposure and outcome to nullify the observed exposure-outcome associations, were calculated to evaluate the impact of unmeasured confounding.47,48
Joint analyses of untreated caries and tooth count were performed. Stratified analyses for all-cause mortality, according to age, sex, race/ethnicity, family PIR, dental insurance, smoking status and calories from added sugar, were also conducted. Due to possible type I errors induced by multiple comparisons, results of secondary outcome/subgroup analyses were interpreted as exploratory.
SAS V9.4 (SAS Institute, NC, USA) and Stata 15.1 (StataCorp, TX, USA) were used for data management and statistical analyses. Two-sided tests with a significance threshold of P<0.05 were applied to all statistical tests.
Results
Characteristics of the participants
A total of 24 029 participants were included in the analyses. Older participants tended to have lower numbers of permanent teeth but similar untreated caries compared with younger adults (Table 1; and Supplementary Table S1, available as Supplementary data at IJE online). Participants with fewer teeth were more likely to have lower family PIR, lower levels of education and no private health insurance or dental insurance. They were also more likely to have diabetes, hypertension or angina, to be obese, physically inactive, past or current heavy smokers or non-drinkers, and to consume a low-quality diet. These patterns were similar for participants with untreated caries. In addition, the prevalence of untreated caries was substantially higher among men, non-Hispanic Blacks and Hispanics, individuals with periodontitis and those with higher added sugar intake. Compared with adults in 1988–94, US adults retained more teeth, with 7.1% edentulous and 9.3% with 1–16 permanent teeth, in 1999–2010 (Supplementary Table S2, available as Supplementary data at IJE online). The prevalence of untreated caries has declined from 25.3% to 21.0% during the same period, primarily driven by improvement in the older population (Supplementary Table S3, available as Supplementary data at IJE online).
Table 1.
Characteristics of study participants, NHANES 1988–94 and 1999–2010a
| Number of permanent teeth, no. (weighted %) |
Untreated Caries, No. (Weighted %)b |
|||||||
|---|---|---|---|---|---|---|---|---|
| Characteristics | NHANES 1988–94 |
NHANES 1999–2010 |
NHANES 1988-1994 |
NHANES 1999-2010 |
||||
| 25–28 | 0 | 25–28 | 0 | No | Yes | No | Yes | |
| No. of participants | 3694 | 1075 | 8175 | 1186 | 5019 | 2735 | 10 183 | 3802 |
| Weighted no. of participants | 50 553 727 | 10 455 924 | 67 002 119 | 6 374 506 | 67 393 526 | 23 104 745 | 80 787 375 | 22 314 271 |
| Age, mean (SE), y | 42.8 (0.4) | 63 (0.6) | 45.5 (0.2) | 63.9 (0.5) | 46.9 (0.4) | 46.3 (0.5) | 48.8 (0.2) | 46.7 (0.3) |
| Follow-up duration, mean (SE), y | 22.7 (0.3) | 15.8 (0.4) | 10.5 (0.1) | 9.6 (0.2) | 22 (0.2) | 20.7 (0.3) | 10.5 (0.1) | 10.4 (0.1) |
| Female | 1926 (49.2) | 597 (56.1) | 4036 (49.4) | 649 (56.2) | 2765 (53.7) | 1367 (45.3) | 5445 (53.2) | 1721 (44.7) |
| Racec | ||||||||
| Non-Hispanic White | 1663 (82.1) | 669 (85.6) | 4278 (75.0) | 671 (76.9) | 2514 (82.1) | 778 (67.8) | 5621 (77.1) | 1339 (58.5) |
| Non-Hispanic Black | 751 (6.8) | 259 (8.8) | 1262 (8.2) | 249 (10.9) | 1093 (7.1) | 1069 (18.4) | 1614 (7.8) | 1043 (18.1) |
| Hispanic | 1154 (5.1) | 109 (1.2) | 2306 (12.2) | 224 (7.5) | 1198 (3.8) | 798 (6.0) | 2538 (10.3) | 1286 (17.9) |
| Other | 126 (6.1) | 38 (4.5) | 329 (4.7) | 42 (4.8) | 214 (7.0) | 90 (7.8) | 410 (4.7) | 134 (5.5) |
| Family poverty income ratio | ||||||||
| 0–1.30 | 883 (10.5) | 392 (28.9) | 1704 (12.3) | 503 (33.7) | 951 (8.9) | 1143 (24.7) | 1907 (11.2) | 1512 (29.9) |
| 1.31–3.50 | 1554 (39.4) | 542 (51.8) | 2865 (31.6) | 507 (44.0) | 2214 (40.2) | 1203 (50.8) | 3681 (31.8) | 1582 (44.0) |
| ≥3.51 | 1257 (50.1) | 141 (19.2) | 3606 (56.1) | 176 (22.3) | 1854 (50.9) | 389 (24.5) | 4595 (57.1) | 708 (26.1) |
| Education | ||||||||
| <High school | 994 (11.7) | 680 (51.9) | 1686 (11.6) | 627 (42.7) | 1380 (14.0) | 1300 (31.5) | 2135 (12.0) | 1570 (29.0) |
| High school | 1125 (30.7) | 262 (32.8) | 1682 (21.3) | 329 (34.1) | 1592 (31.9) | 886 (40.2) | 2200 (22.1) | 989 (31.6) |
| >High school | 1575 (57.6) | 133 (15.2) | 4807 (67.0) | 230 (23.3) | 2047 (54.1) | 549 (28.3) | 5848 (65.9) | 1243 (39.4) |
| Health insurance | ||||||||
| Private | 2787 (86.3) | 716 (74.8) | 5497 (76.8) | 510 (50.0) | 4043 (88.7) | 1638 (70.4) | 7018 (78.2) | 1651 (51.8) |
| Non-private | 312 (5.3) | 289 (18.2) | 1012 (9.0) | 522 (35.3) | 464 (5.2) | 500 (12.5) | 1621 (10.6) | 843 (17.5) |
| None | 595 (8.4) | 70 (7.0) | 1666 (14.2) | 154 (14.7) | 512 (6.1) | 597 (17.2) | 1544 (11.3) | 1308 (30.7) |
| Dental insuranced | 1829 (63.3) | 255 (35.0) | 2017 (72.4) | 218 (46.0) | 2503 (60.7) | 878 (49.2) | 2576 (70.1) | 706 (63.7) |
| Diabetese | 168 (3.1) | 159 (11.0) | 516 (4.8) | 253 (16.6) | 319 (4.2) | 249 (6.7) | 902 (6.0) | 434 (8.8) |
| Hypertensione | 1062 (25.6) | 672 (53.5) | 2543 (28.7) | 728 (53.9) | 1803 (30.0) | 1119 (37.0) | 3798 (32.9) | 1508 (36.1) |
| High cholesterole | 1078 (31.6) | 468 (47.3) | 2933 (36.3) | 557 (47.1) | 1701 (34.4) | 772 (32.2) | 4168 (39.8) | 1329 (35.5) |
| Anginae | 217 (4.7) | 93 (9.6) | 49 (0.5) | 34 (2.7) | 288 (4.9) | 223 (7.3) | 97 (0.7) | 45 (0.9) |
| Periodontitisf | ||||||||
| None | 3036 (91.4) | NA | 2947 (95.6) | NA | 3940 (89.6) | 1758 (73.2) | 3605 (93.9) | 1218 (84.6) |
| Mild | 121 (2.7) | NA | 81 (1.7) | NA | 131 (2.0) | 114 (5.4) | 73 (1.3) | 56 (3.2) |
| Moderate | 280 (5.1) | NA | 126 (2.4) | NA | 487 (7.2) | 513 (17.3) | 262 (4.3) | 193 (10.4) |
| Severe | 41 (0.8) | NA | 16 (0.3) | NA | 89 (1.1) | 129 (4.0) | 35 (0.6) | 28 (1.9) |
| Weight statusg | ||||||||
| Normal | 1347 (43.3) | 381 (33.3) | 2215 (29.8) | 347 (27.9) | 1795 (41.9) | 849 (35.5) | 2784 (30.4) | 916 (26.1) |
| Overweight | 1376 (35.1) | 384 (35.8) | 3039 (36.7) | 427 (36.0) | 1892 (35.7) | 1030 (35.3) | 3838 (36.8) | 1336 (33.2) |
| Obese | 971 (21.7) | 310 (30.8) | 2921 (33.4) | 412 (36.1) | 1332 (22.4) | 856 (29.1) | 3561 (32.8) | 1550 (40.7) |
| Leisure-time physical activityh | 3104 (89.9) | 750 (74.5) | 4927 (67.0) | 390 (38.2) | 4251 (90.2) | 2057 (81.2) | 6048 (66.2) | 1625 (47.3) |
| Smoking statusi | ||||||||
| Ever smoker | 1733 (48.0) | 630 (66.4) | 3122 (38.9) | 759 (68.5) | 2418 (49.7) | 1507 (61.1) | 4077 (40.4) | 1956 (54.8) |
| Pack-years among ever smokers, mean (SE) | 6.6 (0.3) | 22.2 (1.3) | 4.9 (0.2) | 21.3 (1.2) | 8.7 (0.2) | 12.2 (0.6) | 6.6 (0.2) | 9.3 (0.4) |
| Alcohol consumptionj | ||||||||
| None | 2737 (70.5) | 955 (86.3) | 5395 (63.2) | 974 (81.1) | 3843 (73.1) | 2186 (77.5) | 6859 (63.9) | 2768 (70.3) |
| Moderate | 374 (10.7) | 57 (6.4) | 1585 (20.4) | 127 (9.9) | 477 (9.7) | 203 (8.5) | 1959 (20.2) | 517 (14.5) |
| Excessive | 583 (18.8) | 63 (7.3) | 1195 (16.4) | 85 (8.9) | 699 (17.2) | 346 (14.0) | 1365 (15.9) | 517 (15.2) |
| Healthy Eating Index (HEI), mean (SE)k | 64.8 (0.4) | 63.7 (0.6) | 51.5 (0.3) | 48.1 (0.5) | 65.7 (0.4) | 61.1 (0.4) | 52.2 (0.3) | 46.5 (0.3) |
| Daily energy intake, mean (SE), kcal | 2302 (27.3) | 1818 (38.3) | 2198 (13.2) | 1771 (32.1) | 2176 (26.4) | 2227 (34.0) | 2115 (11.4) | 2150 (26.3) |
| Calories from added sugar, mean (SE), kcal | 315 (9.0) | 253 (15.9) | 298 (4.2) | 263 (10.8) | 291 (6.9) | 347 (8.3) | 280 (4.1) | 339 (7.2) |
| Calories from carbohydrate, mean (SE), kcal | 1103 (15.5) | 901 (24.2) | 1056 (6.8) | 876 (15.9) | 1049 (13.0) | 1072 (15.7) | 1021 (6.1) | 1038 (13.2) |
NHANES, National Health and Nutrition Examination Survey; SE, standard error.
Sample weights, clustering and stratification were applied to all analyses to account for the complex sampling design of NHANES.
Analyses for untreated caries were conducted among the dentate population.
‘Other’ included race/ethnicity other than non-Hispanic White, non-Hispanic Black or Hispanic, including multiracial.
Percentage was calculated among participants without missing values. Missing indicator for dental insurance was used between 2005–10 due to lack of data.
Diabetes was defined as self-report of diagnosis or currently taking medication for treatment. Hypertension was defined as systolic blood pressure ≥140 mmHg or diastolic blood pressure ≥90 mmHg among at least three consecutive determinations or self-report of diagnosis. High cholesterol was defined as blood total cholesterol ≥6.2 mmol/L or self-report of diagnosis. Angina was defined as self-report of symptoms (NHANES 1988–94) or diagnosis (NHANES 1999–2010).
Percentage was calculated among participants without missing values. ‘NA’ represents no observation in this category. As periodontal assessment was not available for 2005–08 and changed substantially in 2009–10, missing indicator for periodontitis was used for 2005–10.
Weight status was defined by body mass index, calculated as weight in kilograms divided by height in metres squared. Standard cutoffs (normal weight, 18.5–24.9; overweight, 25–29.9; obese, ≥30) were used.
Leisure-time physical activity was defined by engaging any moderate or vigorous recreational physical activity over the past 30 days (1988–94 and 1999–2006) or in a typical week (2006–10) (yes/no).
Ever smoker was defined as individuals who smoked ≥100 cigarettes in life. Pack-years among ever smokers was calculated as the number of cigarettes smoked per day divided by 20 and multiply the number of years of smoking.
Alcohol consumption was defined by total intake of alcohol during the 24-hour period prior to the NHANES dietary interview (none: 0 g/d, moderate: 0.1-≤28 g/d for men/0.1-≤14 g/d for women, or excessive: >28 g/d for men/>14 g/d for women).
Healthy Eating Index (HEI) 1994-1996 was used for NHANES 1988-1994; HEI-2010 was used for NHANES 1999-2010.
Tooth count and mortality
During up to 27 years of follow-up (173 402 person-years from NHANES 1988–94 and 151 216 from NHANES 1999–2010), 5270 deaths occurred, including 1080 from heart disease, 315 from cerebrovascular disease, 1207 from cancer and 2634 from other causes. We first examined the association between tooth count and mortality. Inverse dose-response associations between the number of permanent teeth and all-cause mortality were observed, driven by deaths from heart disease, cancer and other causes but not from cerebrovascular disease (Table 2; and Supplementary Table S4, available as Supplementary data at IJE online). Compared with individuals with 25–28 teeth, the pooled multivariable-adjusted HRs for all-cause mortality were 1.19 (95% CI: 1.07 to 1.33) for 17 to 24 teeth, 1.30 (95% CI: 1.15 to 1.46) for 1 to 16 teeth, and 1.43 (95% CI: 1.26 to 1.63) for edentulism (P <0.001 for trend). For every 10 teeth missing, the HRs were 1.13 (95% CI: 1.08 to 1.18) for all-cause mortality, 1.16 (95% CI: 1.05 to 1.29) for heart disease mortality, 1.19 (95% CI: 1.09 to 1.29) for cancer mortality and 1.10 (95% CI: 1.04 to 1.17) for other mortality.
Table 2.
Association of number of permanent teeth with risk of all-cause and cause-specific mortalitya
| Cause of Death | Number of permanent teeth |
Per 10 teeth missing | P-value for trendc | |||
|---|---|---|---|---|---|---|
| 25–28 | 17–24 | 1–16 | 0 | |||
| All-cause | ||||||
| No. of deaths | 1229 | 1459 | 1297 | 1285 | ||
| Age-adjusted HR (95% CI) | 1 [Reference] | 1.41 (1.27–1.56) | 1.81 (1.61–2.04) | 2.26 (2.00–2.55) | 1.34 (1.28–1.40) | <0.001 |
| Multivariable-adjusted HR (95% CI)b | 1 [Reference] | 1.19 (1.07–1.33) | 1.30 (1.15–1.46) | 1.43 (1.26–1.63) | 1.13 (1.08–1.18) | <0.001 |
| Heart disease | ||||||
| No. of deaths | 226 | 283 | 294 | 277 | ||
| Age-adjusted HR (95%CI) | 1 [Reference] | 1.29 (1.02–1.63) | 1.94 (1.47–2.55) | 2.29 (1.72–3.04) | 1.38 (1.25–1.52) | <0.001 |
| Multivariable-adjusted HR (95%CI)b | 1 [Reference] | 1.05 (0.82-1.35) | 1.32 (1.00-1.74) | 1.43 (1.06-1.94) | 1.16 (1.05-1.29) | 0.004 |
| Cerebrovascular disease | ||||||
| No. of deaths | 64 | 93 | 72 | 86 | ||
| Age-adjusted HR (95% CI) | 1 [Reference] | 1.73 (1.15–2.61) | 1.39 (0.88–2.22) | 1.46 (0.90–2.37) | 1.08 (0.95–1.23) | 0.26 |
| Multivariable-adjusted HR (95% CI)b | 1 [Reference] | 1.58 (1.01–2.48) | 1.13 (0.72–1.79) | 1.06 (0.62–1.83) | 0.96 (0.82–1.12) | 0.58 |
| Cancer | ||||||
| No. of deaths | 310 | 333 | 259 | 305 | ||
| Age-adjusted HR (95% CI) | 1 [Reference] | 1.27 (1.00–1.62) | 1.72 (1.35–2.19) | 2.60 (2.04–3.30) | 1.41 (1.30–1.52) | <0.001 |
| Multivariable-adjusted HR (95% CI)b | 1 [Reference] | 1.04 (0.81–1.32) | 1.18 (0.92–1.51) | 1.60 (1.24–2.07) | 1.19 (1.09–1.29) | <0.001 |
| Other | ||||||
| No. of deaths | 621 | 742 | 664 | 607 | ||
| Age-adjusted HR (95% CI) | 1 [Reference] | 1.49 (1.28–1.72) | 1.88 (1.60–2.21) | 2.05 (1.75–2.42) | 1.29 (1.22–1.36) | <0.001 |
| Multivariable-adjusted HR (95% CI)b | 1 [Reference] | 1.29 (1.11–1.50) | 1.36 (1.15–1.62) | 1.35 (1.13–1.62) | 1.10 (1.04–1.17) | 0.001 |
NHANES, National Health and Nutrition Examination Survey; HR, hazard ratio; CI, confidence interval; BMI, body mass index; d, day.
All analyses were stratified by age (5-year group) and sex.
Multivariable-adjusted HR (95% CI) was adjusted for age (year), sex (female/male), race/ethnicity (non-Hispanic White, non-Hispanic Black, Hispanic or others), family poverty income ratio (0–1.30, 1.31–3.50 or ≥3.51), education (<high school, high school, or >high school), health insurance (private, non-private or none), dental insurance (yes, no or missing), history of diabetes, hypertension, high cholesterol and angina (for each disease, yes/no), weight status (normal, BMI: 18.5–24.9; overweight, BMI: 25–29.9; obese, BMI ≥30), leisure-time physical activity (yes/no), smoking status (never, past smoker with <20 pack-years, past smoker with ≥20 pack-years, current smoker with <20 pack-years or current smoker with ≥20 pack-years), alcohol consumption (none: 0 g/d, moderate: 0.1–≤28 g/d for men/0.1–≤14 g/d for women, excessive: >28 g/d for men/>14 g/d for women), daily energy intake (kcal), calories from added sugar (<5%, 5–<10%, 10–<25% or ≥25%), calories from carbohydrate (<45%, 45–65% or >65%), Healthy Eating Index (quintile), and survey cycle (continuous). Results from NHANES 1988–94 and NHANES 1999–2010 with follow-up to 2015 were combined using a fixed-effects model.
P-value for trend was calculated using number of permanent teeth as a continuous variable.
The inverse associations between the numbers of permanent teeth and all-cause mortality were similar regardless of baseline age (<70 vs ≥70), sex (male vs female), race/ethnicity (non-Hispanic White vs non-Hispanic Black/Hispanic), family PIR (≤1.30 vs >1.30), dental insurance (no vs yes), smoking status (never smoker vs ever smoker) and calories from added sugar (<10% vs ≥10%) (Supplementary Table S5 and Supplementary Figure S2, available as Supplementary data at IJE online).
Untreated caries and mortality
Among dentate adults, we also examined the association between untreated caries and mortality. Untreated caries was associated with an increased risk of all-cause mortality after adjusting for the same set of covariates as for tooth count (Table 3; and Supplementary Table S6, available as Supplementary data at IJE online). Of note, these estimates were similar after additionally adjusting for periodontitis and tooth count. Compared with participants without untreated caries, individuals with untreated caries had a 26% increased risk of all-cause mortality (HR: 1.26, 95% CI: 1.15 to 1.39), driven by a higher risk of death from heart disease (HR: 1.48, 95% CI: 1.17 to 1.88) and other causes (HR: 1.22, 95% CI: 1.07 to 1.39) but not from cerebrovascular disease (HR: 1.18, 95% CI: 0.85 to 1.65) and cancer (HR: 1.18, 95% CI: 0.98 to 1.42). The positive associations between untreated caries and all-cause mortality were similarly observed within subgroups of age, sex, race/ethnicity, family PIR, dental insurance, smoking status and calories from added sugar (Figure 1; and Supplementary Table S7, available as Supplementary data at IJE online).
Table 3.
Association of untreated caries with risk of all-cause and cause-specific mortality among dentate participantsa
| Cause of death | Untreated caries |
|
|---|---|---|
| No | Yes | |
| All-cause | ||
| No. of deaths | 2478 | 1504 |
| Age-adjusted HR (95% CI) | 1 [Reference] | 1.81 (1.65–1.99) |
| Multivariable-adjusted HR (95% CI)b | 1 [Reference] | 1.30 (1.18–1.44) |
| Multivariable-adjusted HR (95% CI)c | 1 [Reference] | 1.26 (1.15–1.39) |
| Heart disease | ||
| No. of deaths | 477 | 325 |
| Age-adjusted HR (95% CI) | 1 [Reference] | 2.21 (1.81–2.70) |
| Multivariable-adjusted HR (95% CI)b | 1 [Reference] | 1.53 (1.21–1.95) |
| Multivariable-adjusted HR (95% CI)c | 1 [Reference] | 1.48 (1.17–1.88) |
| Cerebrovascular disease | ||
| No. of deaths | 143 | 86 |
| Age-adjusted HR (95% CI) | 1 [Reference] | 1.45 (1.04–2.03) |
| Multivariable-adjusted HR (95% CI)b | 1 [Reference] | 1.22 (0.87–1.70) |
| Multivariable-adjusted HR (95%C I)c | 1 [Reference] | 1.18 (0.85–1.65) |
| Cancer | ||
| No. of deaths | 566 | 336 |
| Age-adjusted HR (95% CI) | 1 [Reference] | 1.64 (1.38–1.93) |
| Multivariable-adjusted HR (95% CI)b | 1 [Reference] | 1.19 (0.99–1.44) |
| Multivariable-adjusted HR (95% CI)c | 1 [Reference] | 1.18 (0.98–1.42) |
| Other | ||
| No. of deaths | 1281 | 744 |
| Age-adjusted HR (95% CI) | 1 [Reference] | 1.77 (1.57–1.99) |
| Multivariable-adjusted HR (95% CI)b | 1 [Reference] | 1.27 (1.11–1.45) |
| Multivariable-adjusted HR (95% CI)c | 1 [Reference] | 1.22 (1.07–1.39) |
NHANES, National Health and Nutrition Examination Survey; HR, hazard ratio; CI, confidence interval; BMI, body mass index; d, day.
All analyses were stratified by age (5-year group) and sex.
Multivariable–adjusted HR (95% CI) was adjusted for age (year), sex (female/male), race/ethnicity (non–Hispanic White, non–Hispanic Black, Hispanic or others), family poverty income ratio (0–1.30, 1.31–3.50 or ≥3.51), education (<high school, high school, or >high school), health insurance (private, non–private or none), dental insurance (yes, no or missing), history of diabetes, hypertension, high cholesterol and angina (for each disease, yes/no), weight status (normal, BMI: 18.5–24.9; overweight, BMI: 25–29.9; obese, BMI ≥30), leisure–time physical activity (yes/no), smoking status (never, past smoker with <20 pack–years, past smoker with ≥20 pack–years, current smoker with <20 pack–years or current smoker with ≥20 pack–years), alcohol consumption (none: 0 g/d, moderate: 0.1–≤28 g/d for men/0.1–≤14 g/d for women, excessive: >28 g/d for men/>14 g/d for women), daily energy intake (kcal), calories from added sugar (<5%, 5%–<10%, 10%–<25% or ≥25%), calories from carbohydrate (<45%, 45%–65%,or >65%), Healthy Eating Index (quintile), and survey cycle (continuous). Results from NHANES 1988–94 and NHANES 1999–2010 with follow-up to 2015 were combined using a fixed-effects model.
Additionally adjusted for periodontitis (none, mild, moderate, severe or missing) and number of permanent teeth (0, 1–16, 17–24 or 25–28).
Figure 1.
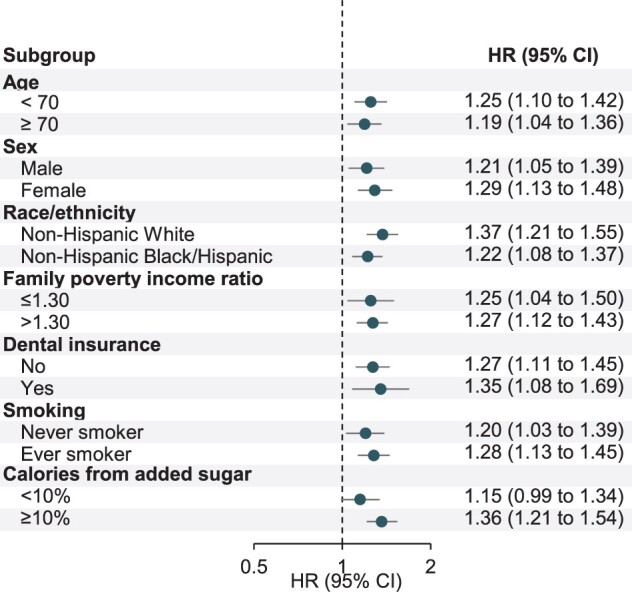
Stratified analyses for untreated caries with risk of all-cause mortality among dentate participants. NHANES, National Health and Nutrition Examination Survey; HR, hazard ratio; CI, confidence interval. Weighted prevalence was directly standardized to age distribution (in 10-year age group) of the 2000 Census population. Multivariable-adjusted HR (95% CI) was adjusted for age (year), sex (female/male), race/ethnicity (non-Hispanic White, non-Hispanic Black, Hispanic or others), family poverty income ratio (0–1.30, 1.31–3.50 or ≥3.51), education (<high school, high school or >high school), health insurance (private, non-private or none), dental insurance (yes, no or missing), history of diabetes, hypertension, high cholesterol and angina (for each disease, yes/no), weight status (normal, BMI: 18.5–24.9; overweight, BMI: 25–29.9; obese, BMI ≥30), leisure-time physical activity (yes/no), smoking status (never, past smoker with <20 pack-years, past smoker with ≥20 pack-years, current smoker with <20 pack-years or current smoker with ≥20 pack-years), alcohol consumption (none: 0 g/day, moderate: 0.1–≤28 g/day for men/0.1–≤14 g/day for women, excessive: >28 g/day for men/>14 g/day for women), daily energy intake (kcal), calories from added sugar (<5%, 5%–<10%, 10%–<25% or ≥25%), calories from carbohydrate (<45%, 45–65% or >65%), Healthy Eating Index (quintile), and survey cycle (continuous), and additionally adjusted for periodontitis (none, mild, moderate, severe or missing) and number of permanent teeth (0, 1–16, 17–24 or 25–28). Stratification factors were also adjusted within specific strata as appropriate to minimize confounding. For stratification by family poverty income ratio, its continuous variable was adjusted for instead. For stratification by smoking, smoking status (never, past or current) and smoking intensity (pack-years) were adjusted for instead. All analyses were stratified by age (5-year group) and sex. Results from NHANES 1988–94 and NHANES 1999–2010 with follow-up to 2015 were combined using a fixed-effects model. Error bars show 95% CI.
Joint analyses of tooth count and untreated carries with mortality
In joint analyses of untreated caries and tooth count, individuals with untreated caries had an elevated risk of all-cause, heart disease and other mortality compared with those without untreated caries within each tooth count stratum (Figure 2; and Supplementary Table S8, available as Supplementary data at IJE online). Compared with participants without untreated caries and with 25–28 teeth, individuals with untreated caries and 1–16 teeth had a 53% increased risk of all-cause mortality (HR: 1.53, 95% CI: 1.27 to 1.85), 96% increased risk of heart disease mortality (HR: 1.96, 95% CI: 1.28 to 3.01) and 48% increased risk of other mortality (HR: 1.48, 95% CI: 1.16 to 1.90).
Figure 2.
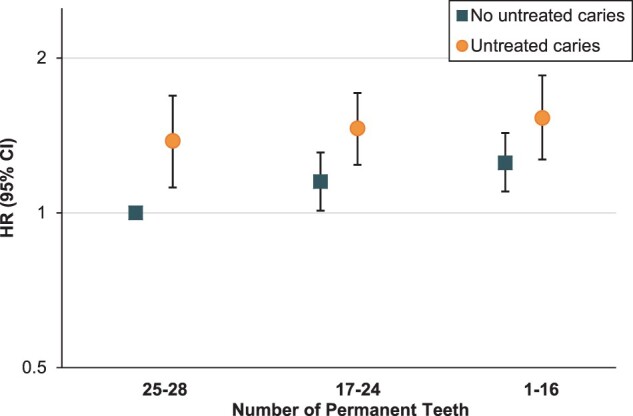
Joint associations for untreated caries and number of permanent teeth with risk of all-cause mortality. NHANES, National Health and Nutrition Examination Survey; HR, hazard ratio; CI, confidence interval. Multivariable hazard ratios for joint associations between untreated caries, number of permanent teeth and risk of all-cause mortality were conducted among dentate participants and adjusted for age (year), sex (female/male), race/ethnicity (non-Hispanic White, non-Hispanic Black, Hispanic or others), family poverty income ratio (0–1.30, 1.31–3.50 or ≥3.51), education (<high school, high school or >high school), health insurance (private, non-private or none), dental insurance (yes, no or missing), history of diabetes, hypertension, high cholesterol and angina (for each disease, yes/no), weight status (normal, BMI: 18.5–24.9; overweight, BMI: 25–29.9; obese, BMI ≥30), leisure-time physical activity (yes/no), smoking status (never, past smoker with <20 pack-years, past smoker with ≥20 pack-years, current smoker with <20 pack-years or current smoker with ≥20 pack-years), alcohol consumption (none: 0 g/day, moderate: 0.1–≤28 g/day for men/0.1–≤14 g/day for women, excessive: >28 g/day for men/>14 g/day for women), daily energy intake (kcal), calories from added sugar (<5%, 5–<10%, 10–<25% or ≥25%), calories from carbohydrate (<45%, 45–65% or >65%), Healthy Eating Index (quintile) and survey cycle (continuous). All analyses were stratified by age (5-year group) and sex. Results from NHANES 1988–94 and NHANES 1999–2010 with follow-up to 2015 were combined using a fixed-effects model. Error bars show 95% CI.
Sensitivity analyses
Results from the random-effects model were largely consistent with estimates from the fixed-effect model (Supplementary Table S4 and Supplementary Table S6). An unmeasured confounder needs to be associated with both tooth count and all-cause mortality with an HR of at least 1.30 to nullify this association. The least HR for an unmeasured confounder to nullify the association between untreated caries and all-cause mortality is 1.44. Since we have adjusted for a wide range of confounders in our analyses, unmeasured confounders were less likely to have associations with both the exposure and the mortality endpoints that exceed the corresponding E-values (Supplementary Table S9, available as Supplementary data at IJE online).
Discussion
In this large, prospective study representing US adults, having fewer permanent teeth was associated with increased risk of all-cause mortality, after considering a wide range of sociodemographic and lifestyle factors. This positive association was driven by deaths from heart disease, cancer and other causes. Untreated caries was also associated with increased risks of all-cause, heart disease and other mortality, independent of tooth count and periodontitis. These associations were largely consistent within strata of age, sex, race/ethnicity, poverty level, dental insurance, smoking status and consumption of added sugar.
A meta-analysis suggests that losses of 10, 20 and 32 teeth were associated with 15%, 33% and 57% increased risk of all-cause mortality, respectively.16 However, evidence was mixed for CVD mortality, which may be in part attributable to incomplete adjustment for confounders such as socioeconomic factors49 and smoking.50 Our robust findings after adjusting for a list of confounding factors and similar findings within each stratum collectively lend strong support to the observed association between lower tooth count and increased risks of both total and heart disease mortality, whereas the lack of association with cerebrovascular disease mortality requires further validations. In line with our findings on cancer mortality, a recent analysis in NHANES 1988–94 found a 50% higher mortality from cancer when comparing edentulous adults with a dentate population without periodontal disease.34 Our study expands these evaluations by additionally integrating NHANES 1999–2010 to elucidate the dose-response relationship between fewer teeth and increased risk of cancer mortality, in the context of mortality from other causes.
The association between untreated caries and mortality was not well studied. In an Iranian cohort, DMFT index, a score capturing decayed (D), missing (M) and filled (F) teeth (T), was associated with an increased risk of all-cause and cancer mortality, but not CVD mortality.14 However, DMFT captures both tooth loss and caries, without differentiating untreated caries. Indeed, untreated caries has been used by the US Centers for Disease Control and Prevention as a population-level indicator for oral health burden.3 In line with our observed positive association between untreated caries and heart disease mortality, a recent large prospective study in Korea found that untreated caries was associated with a 7–22% increased risk of major cardiovascular events including cardiac death, myocardial infarction, stroke and heart failure.19 Instead of using a composite endpoint, our findings extend the scope of Park et al. by looking through various endpoints and observing a positive association between untreated caries and all-cause mortality, driven by deaths from heart disease and other causes but not cerebrovascular disease and cancers, independent of a range of potential confounders. More importantly, the positive association remained similar after adjusting for both tooth count and periodontitis and was similarly observed within each stratum of tooth count. Collectively, these findings provide preliminary but compelling evidence that untreated caries may operate through a pathway independent of periodontitis/tooth loss to increase risk of premature death.
Our findings linking untreated caries and all-cause and heart disease mortality are biologically plausible. Streptococcus mutans, a major cariogenic species in dental caries,18 was also found to be the dominant species in atherosclerotic plaque.51 Interestingly in the same patient, its abundance in atherosclerotic plaques correlated with that in oral cavities.17 It has been postulated that Streptococcus mutans and its products may spread to the bloodstream and promote plaque formation through directly invading vascular endothelium or inducing systemic immune response, thereby increasing the risk of heart disease.7 Throughout the progression of periodontitis, the oral microbiota was modified and many highly pathogenic bacteria, including Porphyromonas gingivalis, Treponema denticola and Tannerella forsythia, were over-represented.8 In addition to CVD,9,10 these bacterial species could also potentially facilitate the development of oral, oesophageal, lung, pancreas, colon/rectum, breast, prostate and haematological cancers,12 with provoking chronic systemic inflammation as the leading putative mechanism.8,12 Tooth loss as an endpoint of periodontitis might further promote CVD and cancer by harbouring a more disturbed oral microbiota. It is also likely that oral diseases are predictors of poor health behaviours and perceptions. Shared risk factors between oral diseases and mortality, such as socioeconomic factors,49 smoking50 and diet,26 might be the underlying causal factors. The strength of associations between tooth loss, untreated caries and mortality were attenuated after adjusting for potential confounders, particularly family PIR, dental insurance, smoking and added sugar consumption. However, stratified analyses within strata of these confounders suggest that our observed associations cannot be fully explained by measured confounding, although unmeasured confounding could not be ruled out. Information on potential unmeasured confounders, like oral hygiene and dental visits, need to be included in future studies.19
Our findings reflect a significant step in connecting oral health and mortality. Indeed, oral health has been largely neglected in both high-income and low/middle-income countries.4 According to our analyses and prior studies, in the USA untreated caries is common, with minimal improvement among adults especially younger adults aged 20–64 over the past two decades.3,22 Moreover, about half of adults are at higher risk of tooth loss due to periodontal disease.2 Low-income, uninsured and racial/ethnic minority populations suffer from higher burden of oral diseases throughout the life course,2,3 due to limited access to dental care and disproportionate exposures to an array of individual, social and commercial determinants.4,52 However, oral health disparities have not yet been recognized as contributing to the disproportional burden of mortality among these groups. Joint efforts from public and private sectors are needed immediately to expand oral health-related educational/outreach programmes, improve equal access to dental care5,52 and integrate dental care into general health practices.4
Our study has a few notable strengths. First, our study maximally utilized the oral health examination data as well as mortality linkage from the NHANES since 1988, to assess the association between oral health and mortality prospectively. Second, the oral health information was assessed using standardized protocols within each survey cycle with high examiner reliability,27–30 which minimized the measurement errors. Third, our comprehensive adjustment for potential confounders and subgroup-specific analyses minimized the influence of confounding. Finally, the use of nationally representative samples ensured the generalizability of our findings to the US population.
Our study also has limitations. First, in the NHANES, untreated caries was assessed with a disposable mirror by various dental professionals and slightly differently in 2009–10. However, the protocols have been standardized and these data were used to estimate the prevalence and temporal trends of untreated caries in the USA.22,23 Further, such non-differential misclassification, if any, would likely bias the association towards the null. Second, partial-mouth periodontal examination might underestimate the prevalence of periodontitis.22,27,28 Although including tooth count in the models for untreated caries could allow us to adjust for most effects of periodontitis, data from full-mouth examination at six sites are warranted in future study. Third, the NHANES has not collected updated information on tooth loss, untreated caries and periodontal diseases during follow-up period. With only baseline measurement, we might have misclassified people who developed oral diseases later on as unexposed. Such non-differential misclassification may bias the associations towards the null. Studies with updated oral health exposures and other covariates are warranted. Also, the lack of information on reasons for teeth missing (including wisdom teeth) and the severity of untreated caries limited our ability to further differentiate the effects of exposures. Additionally, we have limited power to look into details of mortality from specific cancer types and other causes which include respiratory diseases, Alzheimer’s disease, diabetes and so forth. Finally, the role of time-varying and unmeasured confounding could not be ruled out.
Conclusions
In nationally representative cohorts of US adults, fewer permanent teeth were associated with all-cause mortality including heart disease and cancer mortality, with dose-response relationships. Untreated dental caries, a previously under-appreciated benign oral disease, was linked with increased risks of all-cause, heart disease and other mortality. The general public should be informed and encouraged to protect their oral health proactively. Health professionals should be aware of the link between oral and general health and should integrate dental care into general health practices. Larger prospective studies with detailed and time-dependent assessments of exposures and covariates are warranted for validating our findings.
Ethics approval
All NHANES protocols were approved by the National Center for Health Statistics Research Ethics Review Board, and all participants provided documented consent: detailed information at [https://www.cdc.gov/nchs/nhanes/irba98.htm].
Supplementary Material
Contributor Information
Jie Liu, Division of Public Health Sciences, Department of Surgery, Washington University School of Medicine, St Louis, MO, USA.
Xiaoyu Zong, Division of Public Health Sciences, Department of Surgery, Washington University School of Medicine, St Louis, MO, USA.
Emily Vogtmann, Division of Cancer Epidemiology and Genetics, National Cancer Institute, National Institutes of Health, Bethesda, MD, USA.
Chao Cao, Program in Physical Therapy, Washington University School of Medicine, St Louis, MO, USA.
Aimee S James, Division of Public Health Sciences, Department of Surgery, Washington University School of Medicine, St Louis, MO, USA; Alvin J. Siteman Cancer Center, Washington University School of Medicine, St Louis, MO, USA.
Andrew T Chan, Clinical and Translational Epidemiology Unit, Massachusetts General Hospital and Harvard Medical School, Boston, MA, USA; Division of Gastroenterology, Massachusetts General Hospital and Harvard Medical School, Boston, MA, USA.
Eric B Rimm, Department of Nutrition, Harvard T.H. Chan School of Public Health, Boston, MA, USA; Department of Medicine, Brigham and Women's Hospital, Channing Division of Network Medicine, Boston, MA, USA.
Richard B Hayes, Division of Epidemiology, New York University School of Medicine, New York, NY, USA.
Graham A Colditz, Division of Public Health Sciences, Department of Surgery, Washington University School of Medicine, St Louis, MO, USA; Alvin J. Siteman Cancer Center, Washington University School of Medicine, St Louis, MO, USA.
Dominique S Michaud, Department of Public Health and Community Medicine, Tufts University School of Medicine, Boston, MA, USA.
Kaumudi J Joshipura, Center for Clinical Research and Health Promotion, Medical Sciences Campus, University of Puerto Rico, San Juan, Puerto Rico, USA; Department of Epidemiology, Harvard T.H. Chan School of Public Health, Harvard University, Boston, MA, USA.
Christian C Abnet, Division of Cancer Epidemiology and Genetics, National Cancer Institute, National Institutes of Health, Bethesda, MD, USA.
Yin Cao, Division of Public Health Sciences, Department of Surgery, Washington University School of Medicine, St Louis, MO, USA; Alvin J. Siteman Cancer Center, Washington University School of Medicine, St Louis, MO, USA; Division of Gastroenterology, John T. Milliken Department of Medicine, Washington University School of Medicine, St Louis, MO, USA.
Data Availability
Data, documentation and codebook of the National Health and Nutrition Examination Survey are available for download at [https://www.cdc.gov/nchs/nhanes/index.htm]. Statistical code for this study is available upon request from YC [yin.cao@wustl.edu].
Supplementary data
Supplementary data are available at IJE online.
Author contributions
J.L. and Y.C. had full access to all the data in the study and take responsibility for the integrity of the data and the accuracy of the data analysis. J.L. and Y.C. were involved in study concept and design. All authors were involved in acquisition, analysis or interpretation of data. J.L., C.C.A. and Y.C. drafted the manuscript. All authors drafted critical revisions of the manuscript for important intellectual content. J.L., X.Z. and Y.C. performed the statistical analysis. Y.C. supervised the study and provided administrative, technical and material support. C.C.A. and Y.C. contributed equally.
Funding
This work was supported by the U.S. National Institutes of Health (NIH) grant P30 CA091842. Y.C. is supported by the Siteman Investment Program, Washington University. E.V. and C.C.A. were supported by the Intramural Research Program of the National Cancer Institute. A.T.C. is a Stuart and Suzanne Steele Massachusetts General Hospital (MGH) Research Scholar. The funders had no role in the design and conduct of the study; collection, management, analysis and interpretation of the data; preparation, review and approval of the manuscript.
Conflict of interest
None declared.
References
- 1. Kassebaum NJ, Smith AGC, Bernabe E. et al. ; GBD 2015 Oral Health Collaborators. Global, regional, and national prevalence, incidence, and disability-adjusted life years for oral conditions for 195 countries, 1990-2015: a systematic analysis for the global burden of diseases, injuries, and risk factors. J Dent Res 2017;96:380–87. [DOI] [PMC free article] [PubMed] [Google Scholar]
- 2. Eke PI, Thornton-Evans GO, Wei L, Borgnakke WS, Dye BA, Genco RJ.. Periodontitis in US Adults: National Health and Nutrition Examination Survey 2009-2014. J Am Dent Assoc 2018;149:576–88.e6. [DOI] [PMC free article] [PubMed] [Google Scholar]
- 3.Centers for Disease Control and Prevention. Oral Health Surveillance Report: Trends in Dental Caries and Sealants, Tooth Retention, and Edentulism, United States, 1999–2004 to 2011–2016. Atlanta, GA: Centers for Disease Control and Prevention, US Dept of Health and Human Services, 2019. [Google Scholar]
- 4. Watt RG, Daly B, Allison P. et al. Ending the neglect of global oral health: time for radical action. Lancet 2019;394:261–72. [DOI] [PubMed] [Google Scholar]
- 5.U.S. Department of Health and Human Services. Oral Health in America: A Report of the Surgeon General. Rockville, MD: U.S. Department of Health and Human Services, National Institute of Dental and Craniofacial Research, National Institutes of Health, 2000. [Google Scholar]
- 6. Costalonga M, Herzberg MC.. The oral microbiome and the immunobiology of periodontal disease and caries. Immunol Lett 2014;162:22–38. [DOI] [PMC free article] [PubMed] [Google Scholar]
- 7. Aarabi G, Heydecke G, Seedorf U.. Roles of oral infections in the pathomechanism of atherosclerosis. Int J Mol Sci 2018;19:1978. [DOI] [PMC free article] [PubMed] [Google Scholar]
- 8. Bourgeois D, Inquimbert C, Ottolenghi L, Carrouel F.. Periodontal pathogens as risk factors of cardiovascular diseases, diabetes, rheumatoid arthritis, cancer, and chronic obstructive pulmonary disease: is there cause for consideration? Microorganisms 2019;7:424. [DOI] [PMC free article] [PubMed] [Google Scholar]
- 9. Lafon A, Pereira B, Dufour T. et al. Periodontal disease and stroke: a meta-analysis of cohort studies. Eur J Neurol 2014;21:1155–61.e66–67. [DOI] [PubMed] [Google Scholar]
- 10. Leng WD, Zeng XT, Kwong JS, Hua XP.. Periodontal disease and risk of coronary heart disease: an updated meta-analysis of prospective cohort studies. Int J Cardiol 2015;201:469–72. [DOI] [PubMed] [Google Scholar]
- 11. Graziani F, Gennai S, Solini A, Petrini M.. A systematic review and meta-analysis of epidemiologic observational evidence on the effect of periodontitis on diabetes an update of the EFP-AAP review. J Clin Periodontol 2018;45:167–87. [DOI] [PubMed] [Google Scholar]
- 12. Nwizu N, Wactawski-Wende J, Genco RJ.. Periodontal disease and cancer: epidemiologic studies and possible mechanisms. Periodontol 2000 2020;83:213–33. [DOI] [PMC free article] [PubMed] [Google Scholar]
- 13. Adolph M, Darnaud C, Thomas F. et al. Oral health in relation to all-cause mortality: the IPC cohort study. Sci Rep 2017;7:44604. [DOI] [PMC free article] [PubMed] [Google Scholar]
- 14. Vogtmann E, Etemadi A, Kamangar F. et al. Oral health and mortality in the Golestan Cohort Study. Int J Epidemiol 2017;46:2028–35. [DOI] [PMC free article] [PubMed] [Google Scholar]
- 15. Koka S, Gupta A.. Association between missing tooth count and mortality: a systematic review. J Prosthodont Res 2018;62:134–51. [DOI] [PubMed] [Google Scholar]
- 16. Peng J, Song J, Han J. et al. The relationship between tooth loss and mortality from all causes, cardiovascular diseases, and coronary heart disease in the general population: systematic review and dose-response meta-analysis of prospective cohort studies. Biosci Rep 2019;39:BSR20181773. [DOI] [PMC free article] [PubMed] [Google Scholar]
- 17. Koren O, Spor A, Felin J. et al. Human oral, gut, and plaque microbiota in patients with atherosclerosis. Proc Natl Acad Sci U S A 2011;108(Suppl 1):4592–98. [DOI] [PMC free article] [PubMed] [Google Scholar]
- 18. Selwitz RH, Ismail AI, Pitts NB.. Dental caries. Lancet 2007;369:51–59. [DOI] [PubMed] [Google Scholar]
- 19. Park SY, Kim SH, Kang SH. et al. Improved oral hygiene care attenuates the cardiovascular risk of oral health disease: a population-based study from Korea. Eur Heart J 2019;40:1138–45. [DOI] [PubMed] [Google Scholar]
- 20. Kim K, Choi S, Chang J. et al. Severity of dental caries and risk of coronary heart disease in middle-aged men and women: a population-based cohort study of Korean adults. Sci Rep 2019;9:2002–13. [DOI] [PMC free article] [PubMed] [Google Scholar]
- 21.Centers for Disease Control and Prevention. About the National Health and Nutrition Examination Survey, 2017. https://www.cdc.gov/nchs/nhanes/about_nhanes.htm (1 April 2022, date last accessed).
- 22. Dye BA, Tan S, Smith V. et al. Trends in oral health status: United States, 1988-1994 and 1999-2004. Vital Health Stat 11 2007;248:1–92. [PubMed] [Google Scholar]
- 23. Dye BA, Li X, Beltrán-Aguilar ED.. Selected Oral Health Indicators in the United States, 2005–2008 . NCHS Data Brief, No. 96. Hyattsville, MD: National Center for Health Statistics, 2012. [PubMed] [Google Scholar]
- 24.National Center for Health Statistics and Centers for Disease Control and Prevention. Analytic and Reporting Guidelines: The Third National Health and Nutrition Examination Survey, NHANES III (1988–94). Hyattsville, MD: Centers for Disease Control and Prevention, 1996. [Google Scholar]
- 25. Johnson CL, Paulose-Ram R, Ogden CL. et al. National health and nutrition examination survey: analytic guidelines, 1999-2010. Vital Health Stat 2 2013;161:1–24. [PubMed] [Google Scholar]
- 26. Yang Q, Zhang Z, Gregg EW, Flanders WD, Merritt R, Hu FB.. Added sugar intake and cardiovascular diseases mortality among US adults. JAMA Intern Med 2014;174:516–24. [DOI] [PMC free article] [PubMed] [Google Scholar]
- 27. Dye BA, Barker LK, Selwitz RH. et al. Overview and quality assurance for the National Health and Nutrition Examination Survey (NHANES) oral health component, 1999-2002. Community Dent Oral Epidemiol 2007;35:140–51. [DOI] [PubMed] [Google Scholar]
- 28. Dye BA, Nowjack-Raymer R, Barker LK. et al. Overview and quality assurance for the oral health component of the National Health and Nutrition Examination Survey (NHANES), 2003-04. J Public Health Dent 2008;68:218–26. [DOI] [PubMed] [Google Scholar]
- 29. Dye BA, Barker LK, Li X, Lewis BG, Beltran-Aguilar ED.. Overview and quality assurance for the oral health component of the National Health and Nutrition Examination Survey (NHANES), 2005-08. J Public Health Dent 2011;71:54–61. [DOI] [PubMed] [Google Scholar]
- 30. Dye BA, Li X, Lewis BG, Iafolla T, Beltran-Aguilar ED, Eke PI.. Overview and quality assurance for the oral health component of the National Health and Nutrition Examination Survey (NHANES), 2009-2010. J Public Health Dent 2014;74:248–56. [DOI] [PubMed] [Google Scholar]
- 31. Magraw CB, Moss KL, Fisher EL, Offenbacher S, White RP Jr.. Prevalence of visible third molars in the United States population: how many individuals have third molars? J Oral Maxillofac Surg 2016;74:13–17. [DOI] [PubMed] [Google Scholar]
- 32. Friedman JW. The prophylactic extraction of third molars: a public health hazard. Am J Public Health 2007;97:1554–59. [DOI] [PMC free article] [PubMed] [Google Scholar]
- 33. Michaud DS, Liu Y, Meyer M, Giovannucci E, Joshipura K.. Periodontal disease, tooth loss, and cancer risk in male health professionals: a prospective cohort study. Lancet Oncol 2008;9:550–58. [DOI] [PMC free article] [PubMed] [Google Scholar]
- 34. Huang Y, Michaud DS, Lu J, Platz EA.. The association of clinically determined periodontal disease and edentulism with total cancer mortality: the National Health and Nutrition Examination Survey III. Int J Cancer 2020;147:1587–96. [DOI] [PMC free article] [PubMed] [Google Scholar]
- 35.Centers for Disease Control and Prevention. National Health and Nutrition Examination Survey (NHANES) Oral Health Examiners Manual. Atlanta, GA: Centers for Disease Control and Prevention, US Dept of Health and Human Services, 2009. [Google Scholar]
- 36.National Center for Health Statistics. 2015 Public-Use Linked Mortality Files, 2019. https://www.cdc.gov/nchs/data-linkage/mortality-public.htm# (1 April 2022, date last accessed).
- 37. Chen C, Ye Y, Zhang Y, Pan XF, Pan A.. Weight change across adulthood in relation to all cause and cause specific mortality: prospective cohort study. BMJ 2019;367:l5584. [DOI] [PMC free article] [PubMed] [Google Scholar]
- 38.U.S. Department of Agriculture. Healthy Eating Index Resources, 2019. https://www.fns.usda.gov/cnpp/hei-resources (1 April 2022, date last accessed).
- 39. Ford ES, Giles WH.. Serum vitamins, carotenoids, and angina pectoris: findings from the National Health and Nutrition Examination Survey III. Ann Epidemiol 2000;10:106–16. [DOI] [PubMed] [Google Scholar]
- 40. Gregg EW, Cheng YJ, Cadwell BL. et al. Secular trends in cardiovascular disease risk factors according to body mass index in US adults. JAMA 2005;293:1868–74. [DOI] [PubMed] [Google Scholar]
- 41. Eke PI, Page RC, Wei L, Thornton-Evans G, Genco RJ.. Update of the case definitions for population-based surveillance of periodontitis. J Periodontol 2012;83:1449–54. [DOI] [PMC free article] [PubMed] [Google Scholar]
- 42. Yang L, Cao C, Kantor ED. et al. Trends in sedentary behavior among the US population, 2001-2016. JAMA 2019;321:1587–97. [DOI] [PMC free article] [PubMed] [Google Scholar]
- 43. Hales CM, Fryar CD, Carroll MD, Freedman DS, Aoki Y, Ogden CL.. Differences in obesity prevalence by demographic characteristics and urbanization level among adults in the United States, 2013-2016. JAMA 2018;319:2419–29. [DOI] [PMC free article] [PubMed] [Google Scholar]
- 44.US Department of Health and Human Services, US Department of Agriculture. 2015 – 2020 Dietary Guidelines for Americans. 8th Edition. 2015. https://health.gov/dietaryguidelines/2015/guidelines/ (1 April 2022, date last accessed).
- 45. Trumbo P, Schlicker S, Yates AA, Poos M.. Food, Nutrition Board of the Institute of Medicine TNA. Dietary reference intakes for energy, carbohydrate, fiber, fat, fatty acids, cholesterol, protein and amino acids. J Am Diet Assoc 2002;102:1621–30. [DOI] [PubMed] [Google Scholar]
- 46. Borenstein M, Hedges LV, Higgins JP, Rothstein HR.. A basic introduction to fixed-effect and random-effects models for meta-analysis. Res Synth Methods 2010;1:97–111. [DOI] [PubMed] [Google Scholar]
- 47. Haneuse S, VanderWeele TJ, Arterburn D.. Using the E-value to assess the potential effect of unmeasured confounding in observational studies. JAMA 2019;321:602–03. [DOI] [PubMed] [Google Scholar]
- 48. Mathur MB, Ding P, Riddell CA, VanderWeele TJ.. Web site and R package for computing e-values. Epidemiology 2018;29:e45–47. [DOI] [PMC free article] [PubMed] [Google Scholar]
- 49. Matsuyama Y, Aida J, Tsuboya T. et al. Are lowered socioeconomic circumstances causally related to tooth loss? A natural experiment involving the 2011 great east Japan earthquake. Am J Epidemiol 2017;186:54–62. [DOI] [PMC free article] [PubMed] [Google Scholar]
- 50. Dietrich T, Walter C, Oluwagbemigun K. et al. Smoking, smoking cessation, and risk of tooth loss: the EPIC-Potsdam study. J Dent Res 2015;94:1369–75. [DOI] [PubMed] [Google Scholar]
- 51. Chhibber-Goel J, Singhal V, Bhowmik D. et al. Linkages between oral commensal bacteria and atherosclerotic plaques in coronary artery disease patients. NPJ Biofilms Microbiomes 2016;2:7. [DOI] [PMC free article] [PubMed] [Google Scholar]
- 52. Northridge ME, Kumar A, Kaur R.. Disparities in access to oral health care. Annu Rev Public Health 2020;41:513–35. [DOI] [PMC free article] [PubMed] [Google Scholar]
Associated Data
This section collects any data citations, data availability statements, or supplementary materials included in this article.
Supplementary Materials
Data Availability Statement
Data, documentation and codebook of the National Health and Nutrition Examination Survey are available for download at [https://www.cdc.gov/nchs/nhanes/index.htm]. Statistical code for this study is available upon request from YC [yin.cao@wustl.edu].