

Abstract
It has been proposed that neuroinflammatory response plays an important role in the neurovascular remodeling in the brain after stress. The goal of the present study was to characterize changes in the gene expression profiles associated with neuroinflammation, neuronal function, metabolism and stress in mouse brain tissue. Ten-week old male C57BL/6 mice were launched to the International Space Station (ISS) on SpaceX-12 for a 35-day mission. Within 38 ± 4 h of splashdown, mice were returned to Earth alive. Brain tissues were collected for analysis. A novel digital color-coded barcode counting technology (NanoStringTM) was used to evaluate gene expression profiles in the spaceflight mouse brain. A set of 54 differently expressed genes (p < 0.05) significantly segregates the habitat ground control (GC) group from flight (FLT) group. Many pathways associated with cellular stress, inflammation, apoptosis, and metabolism were significantly altered by flight conditions. A decrease in the expression of genes important for oligodendrocyte differentiation and myelin sheath maintenance was observed. Moreover, mRNA expression of many genes related to anti-viral signaling, reactive oxygen species (ROS) generation, and bacterial immune response were significantly downregulated. Here we report that significantly altered immune reactions may be closely associated with spaceflight-induced stress responses and have an impact on the neuronal function.
Subject terms: Neuroscience, Chronic inflammation
Introduction
The spaceflight environment is characterized mainly by ultraviolet and ionizing radiation, microgravity, and physiological/psychological stressors. These conditions present a significant hazard to spaceflight crews during the course of mission activities. The susceptibility of the central nervous system (CNS) to spaceflight-induced changes can be particularly devastating to the health, mission performance, and quality of life of the spaceflight crew both acutely and chronically. The health risk from spaceflight-induced neuronal damage and potential adverse neurovascular effects are a chief concern, examples are intracranial fluid redistribution results in alteration of brain perfusion, neurovestibular problems, and cognitive alterations in astronauts1,2 caused by microgravity and/or strong gravitational changes during ascent and re-entry. Long-duration spaceflights reportedly induce immune dysregulation, which is considered a risk to astronaut safety and mission success3. Studies to date have demonstrated the altered distribution of peripheral leukocytes, a diminished function of specific leukocyte subpopulations, and skewed cytokine profiles in many astronauts3. Many biomarkers associated with neuroinflammation following space radiation and space stressors in rodents and humans have been identified4–8. However, the precise nature of immune dysregulation during spaceflight is not well understood. Evidence suggests that acute exposure to galactic cosmic rays (GCRs) induce detrimental CNS changes including an increased level of neuroinflammation, neuronal damage and cognitive deficits similar to accelerated aging9–12. Ionizing radiation has been shown to elicit neuroinflammation through direct activation of microglia cells13 and through the increased infiltration of immune and inflammatory cells through the damaged blood-brain barrier (BBB)14. Study also showed that both microgravity encountered by astronauts in space and simulated microgravity on earth induce changes in brain structure and function15. Microgravity induces a tremendous shift in body fluids, an increase in brain fluid and alterations in tissue perfusion16. Space microgravity modulates the expression of cellular molecules, and alters pro-inflammation cytokine secretion17. Neuroinflammation is also a central pathological feature of several acute and chronic brain diseases, including Alzheimer’s disease (AD), Parkinson disease, amyotrophic lateral sclerosis, and multiple sclerosis18.
The CNS is sensitive to oxidative injury due to its high oxygen consumption19, the content of oxidizable unsaturated lipids20 and low levels of anti-oxidant defenses21. Oxidative injury has been implicated as a causative or contributory factor in a number of neurodegenerative conditions, including aging, and ischemic, traumatic damage22–26. Our preliminary studies have shown that spaceflight and ionizing radiation cause prolonged oxidative stress and endothelial dysfunction that may lead to chronic inflammation and adverse remodeling27–30. However, our knowledge about the mechanism and consequences of spaceflight condition-induced neuroinflammation is very limited. Because of the complexity of the processes and pathways that lead to neuroinflammation, an in-depth “omics” approach will potentially provide insight to understanding the impact of environmental insults on the CNS and the immune function that may have a long-lasting impact.
The goal of this study was to characterize changes in gene expression using a neuroinflammatory assay panel to investigate inflammation, neuronal function, growth, metabolism, and stress in mouse brain tissue after spaceflight.
Results
Changes of gene expression in neuroinflammation panel
A set of 54 differently expressed genes (DEG) significantly (p < 0.05) by one-way analysis of variance (ANOVA) and Tukey’s HSD (honestly significant difference) test segregates the ground control (GC) group from the flight (FLT) group (Table 1). Clusters of genes related to neuronal function, neuronal cell support, immune function, and cellular growth and stress were significantly altered and organized based on their protein’s role. SIN3A (https://www.ncbi.nlm.nih.gov/gene/?term=NM_001110350), SLC2A5 (https://www.ncbi.nlm.nih.gov/gene/?term=NM_019741), MERTK (https://www.ncbi.nlm.nih.gov/gene/?term=NM_008587), TREM2 (https://www.ncbi.nlm.nih.gov/gene/?term=NM_025864), RIPK1 (https://www.ncbi.nlm.nih.gov/gene/?term=NM_009068) are listed in multiple tables as they are found to play various roles.
Table 1.
Summary of the 54 differentially expressed genes in flight (FLT) mice brains relative to habitat ground controls (GC).
| Gene name (mRNA) | Functions | Log2 fold Δ | LC limit (log2) | UC limit (log2) | p value |
|---|---|---|---|---|---|
| Optn | Autophagy, cell cycle, microglia function | −0.435 | −0.547 | −0.324 | 1.72E−05 |
| Mertk | Autophagy, microglia function | −0.368 | −0.499 | −0.237 | 0.000256 |
| Cd74 | Adaptive immune response, inflammatory signaling | −1 | −1.45 | −0.548 | 0.00146 |
| Plp1 | Oligodendrocyte function | −0.363 | −0.54 | −0.187 | 0.00238 |
| Sox4 | Microglia function, Wnt | 0.314 | 0.156 | 0.473 | 0.00304 |
| H2-T23 | Adaptive immune response, astrocyte function, inflammatory signaling, innate immune response, matrix remodeling | 0.357 | 0.165 | 0.548 | 0.00447 |
| Irf7 | Apoptosis, inflammatory signaling, innate immune response | −1.06 | −1.63 | −0.487 | 0.00544 |
| Reln | Growth factor signaling, matrix remodeling | −0.535 | −0.836 | −0.235 | 0.00583 |
| Prkar2b | Apoptosis, cell cycle, growth factor signaling | −0.32 | −0.503 | −0.137 | 0.00641 |
| Agt | Astrocyte function | 0.432 | 0.184 | 0.679 | 0.00657 |
| Aldh1l1 | Astrocyte function | −0.345 | −0.542 | −0.147 | 0.00659 |
| Brd2 | Epigenetic regulation | −0.182 | −0.286 | −0.0773 | 0.00667 |
| Ccng2 | Cell cycle, DNA damage | 0.292 | 0.119 | 0.465 | 0.00785 |
| Hspb1 | Angiogenesis, astrocyte function, cellular stress, growth factor | 0.706 | 0.284 | 1.13 | 0.00825 |
| Dlg4 | Adaptive immune response, angiogenesis, cytokine signaling, growth factor signaling, neurons and neurotransmission | −0.279 | −0.45 | −0.108 | 0.00947 |
| Cd6 | Matrix remodeling | −0.972 | −1.56 | −0.388 | 0.00978 |
| Csk | Adaptive immune response, angiogenesis, growth factor | −0.236 | −0.384 | −0.0878 | 0.0108 |
| F3 | Microglia function | −0.304 | −0.496 | −0.113 | 0.011 |
| Csf1r | Cytokine signaling, growth factor signaling, microglia function | −0.209 | −0.341 | −0.0771 | 0.0111 |
| Uty | Epigenetic regulation | 0.308 | 0.113 | 0.502 | 0.0112 |
| Kcnd1 | Microglia function, neurons and neurotransmission | −0.893 | −1.45 | −0.337 | 0.0117 |
| Cyp27a1 | Inflammatory signaling | −0.805 | −1.32 | −0.292 | 0.0132 |
| Slc2a5 | Microglia function | −0.623 | −1.02 | −0.226 | 0.0132 |
| Sin3a | Epigenetic regulation | −0.43 | −0.715 | −0.146 | 0.0142 |
| E2f1 | Apoptosis, cell cycle, cellular stress, notch | −0.709 | −1.17 | −0.25 | 0.0143 |
| Egfr | Adaptive immune response, angiogenesis, astrocyte function | −0.509 | −0.841 | −0.177 | 0.0149 |
| Tmem206 | Microglia function | −0.239 | −0.407 | −0.0701 | 0.0196 |
| C5ar1 | Inflammatory signaling, neurons and neurotransmission | −0.851 | −1.44 | −0.259 | 0.0201 |
| Opalin | Oligodendrocyte function | −0.546 | −0.935 | −0.157 | 0.0205 |
| Ncf1 | Adaptive immune response, angiogenesis, cellular stress | −0.539 | −0.918 | −0.159 | 0.0214 |
| Mre11a | DNA damage | −0.383 | −0.665 | −0.1 | 0.0241 |
| Ikbkg | Adaptive immune response, apoptosis, inflammatory signaling | −0.27 | −0.47 | −0.0697 | 0.0246 |
| Prkaca | Adaptive immune response, angiogenesis, apoptosis, Wnt | −0.144 | −0.251 | −0.0371 | 0.0248 |
| Apoe | Astrocyte function, cellular stress, lipid metabolism, microglia | 0.296 | 0.072 | 0.521 | 0.027 |
| St8sia6 | Microglia function | −0.479 | −0.835 | −0.123 | 0.0272 |
| Gpr62 | Oligodendrocyte function | −0.418 | −0.736 | −0.1 | 0.0276 |
| Hpgds | Lipid metabolism | −0.527 | −0.922 | −0.132 | 0.0282 |
| Sesn1 | DNA damage | 0.226 | 0.0509 | 0.4 | 0.0298 |
| Cdc25a | Cell cycle, DNA damage | 0.218 | 0.0481 | 0.389 | 0.0307 |
| Lmna | Apoptosis, cell cycle, microglia function | −0.284 | −0.507 | −0.0596 | 0.0324 |
| Map2k4 | Adaptive immune response, apoptosis, cellular stress | −0.2 | −0.359 | −0.041 | 0.0334 |
| Irf8 | Inflammatory signaling, microglia function | −0.51 | −0.914 | −0.106 | 0.0352 |
| Trem2 | Adaptive immune response, inflammatory signaling, microglia | −0.461 | −0.833 | −0.088 | 0.0359 |
| Mpeg1 | Inflammatory signaling | −0.292 | −0.528 | −0.0551 | 0.0363 |
| Rhoa | Angiogenesis, autophagy, growth factor signaling, Wnt | 0.196 | 0.0351 | 0.357 | 0.0381 |
| Tarbp2 | Epigenetic regulation | 0.195 | 0.0346 | 0.355 | 0.0384 |
| Ripk1 | Apoptosis, innate immune response, NF-kB | −0.63 | −1.14 | −0.119 | 0.0389 |
| Gadd45g | Cell cycle, DNA damage, growth factor signaling | 0.392 | 0.0686 | 0.716 | 0.0389 |
| Brd3 | Epigenetic regulation | −0.305 | −0.557 | −0.0526 | 0.0394 |
| Nrgn | Neurons and neurotransmission | −0.16 | −0.295 | −0.0261 | 0.0413 |
| Nlgn2 | Matrix remodeling, neurons and neurotransmission | −0.306 | −0.562 | −0.0486 | 0.042 |
| Bbc3 | Apoptosis, DNA damage | −0.538 | −0.987 | −0.0897 | 0.0432 |
| Rgl1 | Growth factor signaling, microglia function | 0.105 | 0.0146 | 0.196 | 0.0462 |
| Creb1 | Adaptive immune response, carbohydrate metabolism, DNA damage, innate immune response, notch | 0.235 | 0.0291 | 0.44 | 0.0493 |
LC lower confidence, UC upper confidence.
Changes of gene expression associated with neuronal function
Genes directly involved with neuronal function were universally downregulated and are summarized in Table 2 and Fig. 1. Overall, a picture of decreased neuron plasticity and signaling dysfunction is painted. Those genes that are involved in neuron support cell function were also found to be broadly downregulated and are summarized in Table 3 and Fig. 2. Microglial cell and oligodendrocyte dysfunction were most pronounced along with the inhibition of myelin sheath maintenance. Levels of immune and inflammation related gene expression were grossly downregulated except for two upregulated genes, H2-T23 (https://www.ncbi.nlm.nih.gov/gene/?term=NM_010398) and SOX4 (https://www.ncbi.nlm.nih.gov/gene/?term=NM_009238). The summary is presented in Table 4 and Fig. 3. Generally, we see the impairment of genes related to microbial defense with generalized dysfunction of immunity and disinhibition of inappropriate inflammation. And finally, genes with roles in cellular stress and growth are shown in Fig. 4 with downregulation in all genes with exception of HSPB1 (https://www.ncbi.nlm.nih.gov/gene/?term=NM_013560), GADD45G (https://www.ncbi.nlm.nih.gov/gene/?term=NM_011817), CCNG2 (https://www.ncbi.nlm.nih.gov/gene/?term=NM_007635), SESN1 (https://www.ncbi.nlm.nih.gov/gene/?term=NM_001013370), and CDC25A (https://www.ncbi.nlm.nih.gov/gene/?term=NM_007658) which were significantly upregulated. In general, we see an increased cellular stress response, growth arrest, and a possible trend toward more inflammatory-associated cell death.
Table 2.
Summary of significantly altered gene expressions by spaceflight related to neuronal function.
| Gene | p value | Log2 fold Δ | Related molecule function |
|---|---|---|---|
| NRGN | 0.0413 | −0.16 | A Ca2+ dependent intracellular charge transducer. |
| DLG4 | 0.00947 | −0.279 | Postsynaptic density protein associated with glutamatergic receptor signaling. |
| NLGN2 | 0.042 | −0.306 | Postsynaptic cell adhesion molecule mediating inhibitory synapses. |
| SIN3A | 0.0142 | −0.43 | Involved in cortical neuron differentiation and callosal axon elongation. |
| RELN | 0.00583 | −0.535 | Regulates microtubule function in neurons and neuronal migration. |
| SLC2A5 | 0.0132 | −0.623 | Fructose transporter found in Purkinje cells and the blood-brain barrier. |
| KCND1 | 0.0117 | −0.893 | K+ voltage-gated channel involved in neurotransmitter release. |
Fig. 1. Spaceflight-induced changes of gene expression related to neuronal function.
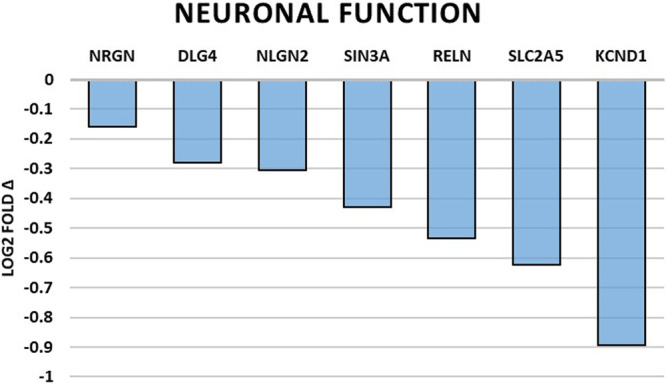
Bar graph summarizing log2 fold-changes of significantly differentially expressed genes (DEG) (p < 0.05) in the flight (FLT) group compared to the ground control (GC) group in genes directly related to neuronal function. N = 6/group. p values are calculated using one-way analysis of variance (ANOVA) and Tukey’s HSD (honestly significant difference) test. Source data are provided as a Source Data file.
Table 3.
Summary of significantly altered gene expressions by spaceflight related to neuronal support cell function.
| Gene | p value | Log2 fold Δ | Related molecule function |
|---|---|---|---|
| CSF1R | 0.0111 | −0.209 | Cell-surface receptor regulating development, proliferation and differentiation. |
| PLP1 | 0.00283 | −0.363 | Major myelin protein in the CNS. |
| MERTK | 0.000256 | −0.368 | Signaling protein in innate immune cells mediating engulfment of apoptotic cells. |
| TREM2 | 0.0359 | −0.461 | Regulates microglial chemotaxis and phagocytosis of apoptotic neurons. |
| NCF1 | 0.0214 | −0.539 | Subunit of NADPH oxidase required for superoxidase production. |
| OPALIN | 0.0205 | −0.546 | Regulator of oligodendrocyte cytoskeletal remolding and morphology. |
| SLC2A5 | 0.0132 | −0.623 | Fructose transporter found in microglial cells. |
Fig. 2. Spaceflight-induced changes of gene expression related to neuronal support cell function.
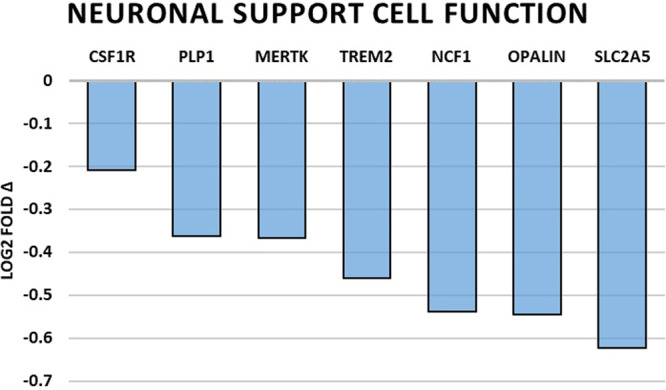
Bar graph summarizing log2 fold-changes of significantly differentially expressed genes (DEG) (p < 0.05) in the flight (FLT) group compared to the ground control (GC) group in genes directly related to neuronal supporting cell function. N = 6/group. P values are calculated using one-way analysis of variance (ANOVA) and Tukey’s HSD (honestly significant difference) test. Source data are provided as a Source Data file.
Table 4.
Summary of significantly altered gene expressions by spaceflight related to immune function and inflammation.
| Gene | p value | Log2 fold Δ | Related molecular function |
|---|---|---|---|
| H2-T23 | 0.00447 | 0.357 | Immune regulation and protection through NK and T-cell suppression. |
| SOX4 | 0.00304 | 0.314 | Transcription factor regulating key genes in Thelper17 cells. |
| CSK | 0.0108 | −0.236 | Negative regulator of T-cell receptor signaling. |
| IKBKG | 0.0246 | −0.27 | Subunit of IKK complex with cardinal role in stimulating NF-κB regulation. |
| MPEG1 | 0.0363 | −0.292 | Pore-forming bactericidal effector molecule of the innate immune system. |
| MERTK | 0.000256 | −0.368 | Signaling protein in innate immunity for a negative regulator of inflammation. |
| OPTN | 0.0000172 | −0.435 | Ubiquitin-binding protein important for bacterial autophagic clearance. |
| TREM2 | 0.0359 | −0.461 | Inhibitor of neuroinflammation via suppression of NF-kB signaling. |
| ST8SIA6 | 0.0272 | −0.479 | A sialyltransferase important for immune suppression and modulation. |
| IRF8 | 0.0352 | −0.51 | Transcription factor for anti-viral dendritic cells and IFN-inducible genes. |
| HPGDS | 0.0282 | −0.527 | Enzymatic mediator of prostaglandin D2 creation. |
| RIPK1 | 0.0389 | −0.63 | Promotor of survival, apoptotic and inflammatory signaling pathways. |
| CYP27A1 | 0.0132 | −0.805 | Cytochrome P450 enzyme important in the metabolism of cholestrol. |
| C5AR1 | 0.0201 | −0.852 | Receptor for the chemotactic and inflammatory anaphylatoxin, C5a. |
| CD6 | 0.00978 | −0.972 | Stimulatory molecule promoting T-cell activation, proliferation, and adhesion. |
| CD74 | 0.00146 | −1 | Chaperone protein involved with MHC class II antigen presentation. |
| IRF7 | 0.00544 | −1.06 | Transcriptional regulator of type I interferon dependent immune responses. |
Fig. 3. Spaceflight-induced changes of gene expression related to immune function and inflammation.

Bar graph summarizing log2 fold-changes of significantly differentially expressed genes (DEG) (p < 0.05) in the flight (FLT) group compared to the ground control (GC) group in genes directly related to immune function and inflammation. N = 6/group. p values are calculated using one-way analysis of variance (ANOVA) and Tukey’s HSD (honestly significant difference) test. Source data are provided as a Source Data file.
Fig. 4. Spaceflight-induced changes of gene expression related to cellular stress and growth function.

Bar graph summarizing log2 fold-changes of significantly differentially expressed genes (DEG) (p < 0.05) in the flight (FLT) group relative to the ground control (GC) group in genes directly related to cellular stress and growth function. N = 6/group. p values are calculated using one-way analysis of variance (ANOVA) and Tukey’s HSD (honestly significant difference) test. Source data are provided as a Source Data file.
Spaceflight-induced changes of pathways
Many pathways associated with cellular stress, inflammation, apoptosis, and metabolism were altered by flight condition using DEG identified by Nanostring’s Advanced Analysis module pathway scoring through correlation-guided gene subsetting, which functionally annotated groups of genes followed by unsupervised clustering of samples31. Higher scores compared to normalized gene expression general means upregulation while lower scores represent downregulation. Figure 5 summarized pathway results in a plot of all pathway scores compared to GC controls. Among these pathways, scores for angiogenesis, cytokine signaling, epigenetic regulation, and notch signaling were significantly increased which may indicate upregulation of the pathway (p < 0.05), while scores for innate immune response and oligodendrocyte function were greatly reduced in the flight group compared to the controls which may indicate downregulation of the pathways (p < 0.05) by one-way ANOVA and Tukey’s HSD test (Fig. 6a–f). The score for microglia function was also decreased but with trending significance (p = 0.07) (Fig. 6g).
Fig. 5. Spaceflight-induced changes of pathway scores.

Summarized pathway scores in flight (FLT) group vs. ground control (GC). *Significantly upregulated pathways (p < 0.05), include:  cytokine signaling,
  Angiogenesis,
  Epigenetic regulation, and
  Notch. **Significantly (p < 0.05) or strong trend (p = 0.07) downregulated pathways, include:
  Oligodendrocyte function,
  Innate immune response, and
  Microglia function. p values are by one-way ANOVA and Tukey’s post hoc test. Source data are provided as a Source Data file.
Fig. 6. Spaceflight-induced changes in nueroinflammation pathway scores among flight (FLT) and ground controls (GC) groups.

Boxplots depict pathway scores on the y-axis and the experimental conditions on the x-axis. N = 5–6 /group. p values are calculated using one-way analysis of variance (ANOVA) and Tukey’s HSD (honestly significant difference) test. a Oligodendrocyte function score p < 0.05, b cytokine signaling score p < 0.05, c innate immune response score p < 0.05, d angiogenesis score p < 0.05, e epigenetic regulation score p < 0.05, f notch score p < 0.01, and g Microglia function score p = 0.07. Boxes are the range between first (25%) and the third (75%) quartile, the center line is the median, the whiskers include the variability those quartiles. Source data are provided as a Source Data file.
Discussion
Our data showed robust changes in gene expression profiles after spaceflight. Genes supporting neuronal synaptic signaling and migration were significantly downregulated. Decreased expression of genes important for oligodendrocyte differentiation and myelin sheath maintenance was observed. Downregulation of microglial gene expression that is important for apoptotic cell clearance, phagocytosis, and proliferation were evident. Genes supporting innate immune responses were also downregulated regarding anti-viral signaling, reactive oxygen species (ROS) generation, and bacterial immune response. Expression of genes that are correlated with DNA damage and cellular stress were upregulated. Many of these observed changes are in line with our previous findings in the brains exposed to simulated spaceflight condition. Following combined exposure of simulated microgravity and radiation, pathways involved in neurogenesis, neuroplasticity, the regulation of neuropeptides, neuronal structure, stress, and cellular signaling are significantly altered29. Gene expression in the brain that was analyzed after 90 days of simulated microgravity showed many genes related to catalytic and oxidoreductase activities were downregulated32. However, in contrary to our findings, many genes related to stress, immune response, metabolic process, and/or inflammatory response were significantly upregulated in their study. Duration of environmental stress may play a role in different response of gene expression profiles and pathway regulation.
We saw uniform downregulation of gene expression in our mouse brain samples directly related to neuron function. NRGN (https://www.ncbi.nlm.nih.gov/gene/?term=NM_022029) coding for a postsynaptic kinase called neurogranin was found to be significantly reduced in expression. When neurogranin binds calmodulin, the concentration of calcium needed to transduce a signal is increased33. Given the downregulation of NRGN (https://www.ncbi.nlm.nih.gov/gene/?term=NM_022029) and possible decrease in availability of neurogranin, neurons may become more sensitive to firing. KCND1(https://www.ncbi.nlm.nih.gov/gene/?term=NM_008423) codes for a potassium voltage-gated channel involved in neurotransmitter release which has been shown to be inhibited by some types of ROS generating treatments34–36. Environmental stressor-induced ROS may be provoking the down regulation of KCND1(https://www.ncbi.nlm.nih.gov/gene/?term=NM_008423). DLG4 (https://www.ncbi.nlm.nih.gov/gene/?term=NM_001109752) is transcribed into a protein associated with glutamatergic receptor signaling while also potentially participating in dendritogenesis37. Its downregulation observed in our assay has the potential to affect glutamatergic neuron signaling, and affect dendritic morphology leading to further dysfunction. NLGN2 (https://www.ncbi.nlm.nih.gov/gene/?term=NM_198862) codes for a molecule which selectively mediates inhibitory synapses38. Its downregulation may contribute to dysfunction at inhibitory neuron synapses. Previous study has shown that inflammation induced loss of inhibitory nerve terminals or a redistribution of presynaptic machinery in inhibitory neurons may increase risk for developing neurological disease and psychiatric illness, including seizures and schizophrenia39.
Regarding genes involved in neuron function and plasticity, we continue to see universal downregulation in the flight tissue compared to GC controls. The gene SIN3A (https://www.ncbi.nlm.nih.gov/gene/?term=NM_001110350) behaves as a transcriptional repressor involved in cortical neuron differentiation40. In past studies the silencing of this gene in mice has shown decreased memory consolidation41. It is possible that downregulation may have similar, albeit reduced effects on mice in spaceflight. RELN (https://www.ncbi.nlm.nih.gov/gene/?term=NM_011261) codes for an extracellular matrix serine protease that regulates microtubule function and plays a role in the layering of neurons in the cerebral cortex, among other structures42. Its enzymatic activity that is important for cell adhesion and reduced transcription, as seen in our flight mice, could lead to further reduction of nervous system plasticity. SLC2A5 (https://www.ncbi.nlm.nih.gov/gene/?term=NM_019741) in a gene responsible for the GLUT5 (https://www.ncbi.nlm.nih.gov/gene/2700445) fructose transporter that has been found in numerous areas including the BBB, and the hippocampus43,44. The downregulation of this gene suggests the decreased ability of cells to utilize fructose as a potential energy source.
Level of gene expression related to neuron support cells, like microglial cells and oligodendrocytes were also seen universally downregulated. Microglia are the resident phagocytes of the innate immune system in the brain and play an important role in cytokine production45. Their activation is closely associated with environmental stress and microglial dysfunction is implicated in many neurological disorders and diseases46. CSF1R (https://www.ncbi.nlm.nih.gov/gene/?term=NM_001037859) is a gene coding for a cell-surface receptor which binds to colony stimulating factor-1 (CSF1) (https://www.ncbi.nlm.nih.gov/gene/?term=NM_001113529) and interleukin-34 (IL-34) (https://www.ncbi.nlm.nih.gov/gene/?term=NM_001135100)47. CSF1R null mice have been shown to have fewer phagocytic cells and reduced survival48. Given these findings we suggest that flight mice may have a reduced capacity to generate microglial cells in the nervous system. MERTK (https://www.ncbi.nlm.nih.gov/gene/?term=NM_008587) creates a kinase protein in innate immune cells which mediates engulfment of apoptotic cells and acts as a negative regulator of inflammation49–51. Downregulation of this gene may contribute to immune dysregulation in our flight mice. TREM2 (https://www.ncbi.nlm.nih.gov/gene/?term=NM_031254) codes for a regulator of microglial chemotaxis and phagocytosis of apoptotic52,53. In previous in vivo studies with microglial lacking TREM2, decreased migration to areas of apoptotic neurons was shown54. NCF1 (https://www.ncbi.nlm.nih.gov/gene/?term=NM_001286037) codes for a key subunit of the phagocyte NADPH oxidase system55,56. Downregulation suggests a reduced capacity for microglial cells to generate an effective microbial defense. SLC2A5 codes for the GLUT5 fructose transporter, as described previously43. With reduced activity, microglial cells may have less capacity to utilize fructose as an energy source and may be more prone to suffer from metabolic related dysfunction.
Oligodendrocytes are the myelin-forming cells of the CNS. It plays critical roles in axonal metabolic support, myelination, and providing nutritional support to neurons57,58. A couple of key genes involved in the oligodendrocyte function have been significantly downregulated in the flight mice. PLP1 (https://www.ncbi.nlm.nih.gov/gene/?term=NM_011123) codes for a major myelin protein that plays an important role in its formation and maintenance59. The implication of significantly downregulated PLP1 indicates impaired neuron axonal function with the possibility of long-term neurodegeneration. OPALIN (https://www.ncbi.nlm.nih.gov/gene/?term=NM_153520) plays a role in oligodendrocyte cytoskeletal remolding and morphology. Downregulation of this gene observed in our study may be an indication of decreased activity of oligodendrocytes. These findings are further reinforced by a significantly decreased oligodendrocyte function pathway score (Fig. 6a).
In terms of gene expression that associated with general immune functions and inflammation, only two genes were found to be significantly upregulated in our flight mice population, H2-T23 (https://www.ncbi.nlm.nih.gov/gene/?term=NM_010398) and SOX4 (https://www.ncbi.nlm.nih.gov/gene/?term=NM_009238). H2-T23 expression is essential for immunological protection and regulation60. HT-T23 dependent T-cell inhibitory interactions aid in preventing expansion of autoreactive CD4 T-cells and collateral autoimmune diseases61. Upregulation of this gene may be a protective response to generalized inflammation in the flight mice. SOX4 directly regulates Innate-like γδ T-cell (Tγδ17), a major source of interleukin-17 (IL-17) (https://www.ncbi.nlm.nih.gov/gene/?term=NM_010552). Increased SOX4 expression may lead to an increase of this cytokine expression in the flight mice62.
The gene RIPK1 (https://www.ncbi.nlm.nih.gov/gene/?term=NM_009068) has been shown to be a promotor of survival, apoptotic and inflammatory signaling pathways63,64. However, mice deficient in RIPK1 demonstrated loss of inhibition of a necroptosis pathway which promoted the release of necroptotic damage-associated molecular patterns65. Downregulation of RIPK1 observed in our study may lead to a similar reduction of appropriate apoptosis and an increase in necroptosis resulting in undesirable inflammation. Overall, taking these findings in conjunction with a significantly increased cytokine signaling pathway score (Fig. 6b), inflammatory signaling appears to be significantly dysregulated in our spaceflight mice.
Immune dysfunction is further illustrated via the downregulation of two genes important for antimicrobial defense. MPEG1 (https://www.ncbi.nlm.nih.gov/gene/?term=NM_010821) is a pore-forming bactericidal molecule of the innate immune system. It has been shown to be required for the activity of ROS and nitric oxide and their antibacterial effects66,67. OPTN (https://www.ncbi.nlm.nih.gov/gene/?term=NM_181848) codes for a protein that plays a key role in bacterial autophagic clearance. Deficient mice have also been shown to have impaired interferon regulatory factors (https://www.ncbi.nlm.nih.gov/gene/?term=NM_001159393) signaling and reduced response to toll-like receptor stimulation68. In summary, these results imply the impaired antibacterial capabilities and increased viral susceptibility in the flight mouse brain compared to GC group.
Our data indicate that the regulation of innate immune response was impaired following spaceflight. The pathway score for the innate immune response was significantly reduced in the flight group compared to GCs (Fig. 6c). The cell type score for exhausted CD8 cells is also greatly reduced for the flight group compared to controls and may indicate a dysfunctional phenotype in CD8 T-cell response. T-cell exhaustion represents an adaptive response to conditions of chronic antigen stimulation and inflammation69, as well as promoting tissue repair following an inflammatory injury70. Functionally exhausted CD8+ cells may result in a severely compromised innate immune response71.
Cytochrome P450 27A1 (CYP27A1) (https://www.ncbi.nlm.nih.gov/gene/?term=NM_024264) plays an important role in the metabolism of cholesterol and cholesterol-related compounds72. In humans, complete CYP27A1 deficiency leads to nodule formation in the brain which may lead to dementia, cerebellar ataxia, and spinal cord paresis73. This altered cholesterol metabolism closely associates with inflammatory responses involved in the pathogenesis of AD progression74. In deficient mice, a significant increase in cholestanol in the brain is observed75. Downregulation of CYP27A1, as seen in our flight mice, may lead to neurodegeneration and inflammation in more chronic settings or to a milder degree.
Fourteen genes that were significantly altered in the flight mice compared to GCs were found to have direct roles in cellular growth, proliferation, and stress response. Two upregulated genes play an important part in cell cycle arrest during times of cellular stress. GADD45G (https://www.ncbi.nlm.nih.gov/gene/?term=NM_011817) has been found to play a role in activating checkpoints in the cell cycle following exposure of cells to irradiation76. CCNG2 (https://www.ncbi.nlm.nih.gov/gene/?term=NM_007635) contributes to cell cycle arrest during DNA damage and is upregulated in response to diverse stimuli, including hypoxia77. Additionally, expression of CCNG2 is found to be significantly increased in cell cycle-arrested and terminally differentiated cells78. Upregulation of these genes may be due to exposure to irradiation, among other stressors, during spaceflight.
The downregulation of genes involved in promoting transcription and cell cycle progression was also seen. BRD2 (https://www.ncbi.nlm.nih.gov/gene/?term=NM_010238) codes for a nuclear kinase involved in regulating the expression of cell cycle genes via binding to multiple E2Fs, a family of transcription factors79. E2F1 (https://www.ncbi.nlm.nih.gov/gene/?term=NM_007891) regulates activation of DNA replication and G1/S transition when interacting with BRD280. BRD2 also interacts with BRD3, a chromatin reader with roles in regulating transcription81. BRD3 (https://www.ncbi.nlm.nih.gov/gene/?term=NM_001113573) further regulates transcription by promoting the binding of the transcription factors to their targets82. SIN3A (https://www.ncbi.nlm.nih.gov/gene/?term=NM_001110350) codes for a transcription factor which regulates cell cycle progression by repressing gene expression for cell cycle inhibitor40. It has been linked to functional cellular changes in proliferation, cell cycle, and stem cell function in mice models83. Downregulation of these genes involved in the promotion of cellular proliferation may further amplify the upregulation of genes with roles in cell cycle arrest. These changes are similarly reinforced by a significantly increased epigenetic regulation pathway score (Fig. 6e) indicating that there may be an increased level of modulating and checks being implemented during transcription, due to spaceflight. A recent study has shown that cell cycle regulation is closely linked to hippocampal neurogenesis which plays critical roles in memory and learning84. Neurogenesis is a dynamic process that involves proliferation and differentiation of stem and progenitor cells, or survival and maturation of newborn neurons84. Environmental stressors have been shown to modulate cell cycle progression, particular in the G1 phase85. These observed changes of gene expression related to the cell cycle in our study may indicate altered regulation of neurogenesis.
Many downregulated genes were known to be involved in cellular stress responses. MAP2K4 (https://www.ncbi.nlm.nih.gov/gene/?term=NM_009157) is a kinase involved with responses to cellular stress including apoptosis, inflammation, cellular proliferation, and neurodegeneration. A deficiency of MAP2K4 has been shown to result in cellular susceptibility to stress-induced apoptosis and growth inhibition86. However, it has been demonstrated that disruption of both MAP2K4 and MAP2K7 (https://www.ncbi.nlm.nih.gov/gene/?term=NM_001042557) genes was required to thoroughly block cellular growth caused by environmental stressors87. MRE11A (https://www.ncbi.nlm.nih.gov/gene/?term=NM_018736), a part of an exonuclease complex central to the cellular DNA damage response was downregulated. The MRE11 complex is essential to vertebrates and defects lead to sensitivity to DNA damage and cell cycle checkpoints deficiency88. Its downregulation may point to a certain level of dysfunction leading to an impaired response to cellular stress leaving the flight mice more vulnerable to DNA damage.
Different brain regions have different vulnerability to environmental stressors due to structural and biological heterogeneity of the regions, cell types and molecular networks89. Regional differences of protein biomarkers in response to stressors were observed in a previous flight study41. Given this finding, gene expression profiles in specific regions of the brain in response to spaceflight will be investigated in future studies. More recently, single-cell sequencing technologies, including transcriptomics, are available by directly measuring multiple molecular signatures in specific brain cells, providing robust molecular identity of specific cell types90.
Brain tissues were dissected and prepared for analysis within 60 h after landing. It is possible that observed changes in gene expression profiles in neuroinflammation are a compensatory acute response to the acceleration and intense noise of launch or reflect changes to the combined response of spaceflight environment and the landing. In order to evaluate the immune response to spaceflight environment, in the further study, mice will be euthanized in the orbit and brain tissues will be immediately preserved for analysis on the ground. Furthermore, in order to test the hypothesis that neuroinflammation plays an important role in developing spaceflight-induced stress response in the brain, an anti-oxidant or anti-inflammatory compound will be injected to mouse before or during the flight to determine the protective effect against oxidative damage in the brain.
It is noted from our study that among those genes which expression were significantly altered by spaceflight, markedly more gene expressions are being downregulated than upregulated. It is speculated that many genes may be upregulated during spaceflight and the early phase after landing as an adaptation response. During re-adaptation, the expression of these previous upregulated genes could be then downregulated as a compensatory response, or when protein synthesis from upregulated genes has been completed, these genes expression may be downregulated32.
Collectively, changes noted in our study indicate that exposure to the spaceflight environment induces significant changes in gene expression and signaling pathways related to neuronal function, immune regulation, growth and metabolic function. Study showed that chronically dysfunctional and deregulated pathways, including cytokine signaling (Fig. 6b), epigenetic regulation (Fig. 6e), and notch signaling (Fig. 6f) play important roles in disease development91, and have been associated with several progressive neurodegenerative diseases92. Our observed changes of a dysregulated inflammatory response, downregulated T-cell response, and reduced microglia signaling (Fig. 6g) might also have an impact on brain structure and function, and further lead to chronic neuroinflammation. It has been shown that here are strong correlations between neuroinflammatory biomarkers, brain morphology and behavioral outcomes93. It may be hypothesized that chronical changes of observed gene expression profiles could have long-term effects on brain morphology and organism behavior.
Materials and methods
Flight and ground control conditions
Ten-weeks-old male C57BL/6 mice (Jackson Laboratories, Inc. Bar Harbor, ME) at the time of launch, were flown for NASA’s ninth Rodent Research experiment (RR-9) on SpaceX-12 for a 35-day mission and lived in NASA’s Rodent Habitats aboard the International Space Station. All FLT mice were maintained at an ambient temperature of 26–28 °C with a 12-h light/dark cycle during the flight. Habitat GC mice were kept under similar housing conditions, including temperature, humidity and carbon dioxide (CO2) levels using 48-h delayed telemetry data from the FLT group. Water and food bar diet specifically designed by NASA were provided ad libitum to FLT and GC groups. All mice received the same access to food and water. NASA-Ames Research Center and KSC Institutional Animal Care and Use Committees approved this flight study. The study has been done in strict accordance with the recommendations in the Guide for the Care and Use of Laboratory Animals of the National Institute of Health.
Mouse brain dissection after spaceflight
Within 38 ± 4 h of splashdown, the FLT mice were rapidly euthanized in 100% CO2. The GC mice were euthanized with the same method after 38 days of GC housing. Shortly after euthanasia, brains were removed and bisected along the midline and coronally within the half hemispheres. The right caudal half hemisphere of the brain (containing mid- and hindbrain) from each mouse (n = 5–6 per group) was placed in a sterile cryovial, snap frozen in liquid nitrogen and kept at −80 °C prior to use.
RNA isolation and gene expression profiling
Isolation of total RNA from the brain tissues was performed using DNA/RNA/miRNA Universal Kit (Qiagen, # 80224) according to the manufacturer’s instruction. Briefly, tissue homogenization was performed using 1.5 mm beads (Benchmark, # 1032-15) on Minilys homogenizer (Bertin Technologies) in RLT Plus buffer. The purity and concentration of the eluted RNA were measured using Nanodrop 2000 (Thermo Fisher Scientific, Waltham, MA) and stored at −80 °C until further analysis. RNA samples (20 ng/ul) were then shipped to Nanostring (Technologies Seattle, WA) and gene expression profiling of brain tissues was conducted using the nCounter® neuroflammation pathways panel. The panel includes 757 genes covering the core pathways and processes that define neuroimmune interactions and 13 potential housekeeping genes for normalization. RNA samples (100 ng each) on 2 cartridges were used for the Gene Expression Assay with Mouse Neuroinflammation panel performed on the nCounter MAX system (https://nanostring.com/wp-content/uploads/MAN-C0035_nCounter_Analysis_System_MAX_FLEX.pdf), a multi-channel epifluorescence scanner with Nanostring Advanced Analysis Module plugin for QC, normalization, and differential expression analysis (DE). Data files generated from nCounter system were analyzed using nSolver 4.0 software with the Advanced Analysis module for QC (quality control), normalization, DE analysis, and gene-set enrichment analysis. Data normalization included 2 steps: Positive control normalization to correct platform-associated variation and Codeset content normalization using the housekeeping (HK) genes to correct variability of input samples. Geometric means of selected HK probes were used to normalize counts of the samples and DEGs were generated from the normalized counts.
Statistical analysis
Gene expression profiling data were analyzed using nSolver analysis and the advanced analysis module software. Advanced analysis module software uses open-source R program for pathway scoring and gene-set enrichment analysis. Using the Reactome pathway database annotations, pathway scores are derived by calculating the first principle component of pathway genes’ normalized expression86 and data are summarized from changes of a gene set within a given pathway into a single score. To further analyze the associated pathways of the DEGs, Kyoto Encyclopedia of Genes and Genomes (KEGG) pathways analysis was performed using biological process database to identify the annotated sets of genes based on the biological processes in which they participate. Significantly differential expression genes were presented in the tables with individual genes using log10 (p value) andlog2 fold change compared to the GC group. Pathview module was used to display upregulated genes or downregulated genes overlaid on KEGG pathways. For DEG and pathway analysis, p < 0.05 was considered statistically significant between FLT and GC groups by one-way ANOVA and Tukey’s HSD test.
Reporting summary
Further information on research design is available in the Nature Research Reporting Summary linked to this article.
Supplementary information
Acknowledgements
This study was supported by NASA Space Biology grant # NNX15AB41G and the LLU Department of Basic Sciences. Sungshin Choi, Dennis Leveson, and Rebecca Klotz contributed significantly to the success of our study and we greatly appreciate their support. The authors would also like to thank the assistance of the entire Biospecimen Sharing Program group for their great assistance. The open access publication fee is supported by Loma Linda University Basic Sciences.
Author contributions
X.W.M. designed research. X.W.M., S.S. and J.M.H. carried out the main laboratory experiments. J.M.H. and X.W.M. wrote the main manuscript. M.D., M.J.P. and J.S.W. reviewed the manuscript.
Data availability
The authors declare that source data supporting the findings of this study with the figures of the article are provided with this paper.
Code availability
All of the significant gene data obtained in this study were deposited in the NCBI’s GEO, and are accessible through GEO accession number GSE186278.
Competing interests
The authors declare no competing interests.
Footnotes
Publisher’s note Springer Nature remains neutral with regard to jurisdictional claims in published maps and institutional affiliations.
Supplementary information
The online version contains supplementary material available at 10.1038/s41526-022-00217-4.
References
- 1.Van Ombergen A, et al. The effect of spaceflight and microgravity on the human brain. J. Neurol. 2017;264:18–22. doi: 10.1007/s00415-017-8427-x. [DOI] [PMC free article] [PubMed] [Google Scholar]
- 2.Lee JK, et al. Spaceflight-associated brain white matter microstructural changes and intracranial fluid redistribution. JAMA Neurol. 2019;76:412–419. doi: 10.1001/jamaneurol.2018.4882. [DOI] [PMC free article] [PubMed] [Google Scholar]
- 3.Crucian BE, et al. Immune system dysregulation during spaceflight: potential countermeasures for deep space exploration missions. Front Immunol. 2018;9:1437. doi: 10.3389/fimmu.2018.01437. [DOI] [PMC free article] [PubMed] [Google Scholar]
- 4.Janelidze S, et al. CSF biomarkers of neuroinflammation and cerebrovascular dysfunction in early Alzheimer disease. Neurology. 2018;91:e867–e877. doi: 10.1212/WNL.0000000000006082. [DOI] [PMC free article] [PubMed] [Google Scholar]
- 5.Raber J, et al. Effects of (56)Fe radiation on hippocampal function in mice deficient in chemokine receptor 2 (CCR2) Behav. Brain Res. 2013;246:69–75. doi: 10.1016/j.bbr.2013.03.003. [DOI] [PubMed] [Google Scholar]
- 6.Aid S, Bosetti F. Targeting cyclooxygenases-1 and -2 in neuroinflammation: therapeutic implications. Biochimie. 2011;93:46–51. doi: 10.1016/j.biochi.2010.09.009. [DOI] [PMC free article] [PubMed] [Google Scholar]
- 7.Derecki NC, et al. Regulation of learning and memory by meningeal immunity: a key role for IL-4. J. Exp. Med. 2010;207:1067–1080. doi: 10.1084/jem.20091419. [DOI] [PMC free article] [PubMed] [Google Scholar]
- 8.Gueguinou N, et al. Stress response and humoral immune system alterations related to chronic hypergravity in mice. Psychoneuroendocrinology. 2012;37:137–147. doi: 10.1016/j.psyneuen.2011.05.015. [DOI] [PubMed] [Google Scholar]
- 9.Minnier J, et al. Associations between lipids in selected brain regions, plasma miRNA, and behavioral and cognitive measures following (28)Si ion irradiation. Sci. Rep. 2021;11:14899. doi: 10.1038/s41598-021-93869-3. [DOI] [PMC free article] [PubMed] [Google Scholar]
- 10.Shaler T, et al. Particle radiation-induced dysregulation of protein homeostasis in primary human and mouse neuronal cells. Life Sci. Space Res. 2020;25:9–17. doi: 10.1016/j.lssr.2020.02.003. [DOI] [PubMed] [Google Scholar]
- 11.Pariset, E., Malkani, S., Cekanaviciute, E. & Costes, S.V. Ionizing radiation-induced risks to the central nervous system and countermeasures in cellular and rodent models. Int. J. Radiat. Biol. 97, 1–19 (2020). [DOI] [PubMed]
- 12.Cekanaviciute E, Rosi S, Costes SV. Central nervous system responses to simulated galactic cosmic rays. Int J. Mol. Sci. 2018;19:3669. doi: 10.3390/ijms19113669. [DOI] [PMC free article] [PubMed] [Google Scholar]
- 13.Allen BD, et al. Mitigation of helium irradiation-induced brain injury by microglia depletion. J. Neuroinflammation. 2020;17:159. doi: 10.1186/s12974-020-01790-9. [DOI] [PMC free article] [PubMed] [Google Scholar]
- 14.Lumniczky K, Szatmari T, Safrany G. Ionizing radiation-induced immune and inflammatory reactions in the brain. Front Immunol. 2017;8:517. doi: 10.3389/fimmu.2017.00517. [DOI] [PMC free article] [PubMed] [Google Scholar]
- 15.Sajdel-Sulkowska EM, Nguon K, Sulkowski ZL, Lipinski B. Potential role of oxidative stress in mediating the effect of altered gravity on the developing rat cerebellum. Adv. Space Res. 2007;40:1414–1420. doi: 10.1016/j.asr.2007.08.004. [DOI] [PMC free article] [PubMed] [Google Scholar]
- 16.Sanford GL, et al. Influence of changes in gravity on the response of lung and vascular cells to ischemia/reperfusion in vitro. J. Gravit. Physiol. 1999;6:P27–P28. [PubMed] [Google Scholar]
- 17.Li N, et al. Microgravity-induced alterations of inflammation-related mechanotransduction in endothelial cells on board SJ-10 satellite. Front. Physiol. 2018;9:1025. doi: 10.3389/fphys.2018.01025. [DOI] [PMC free article] [PubMed] [Google Scholar]
- 18.Seo DY, Heo JW, Ko JR, Kwak HB. Exercise and neuroinflammation in health and disease. Int. Neurourol. J. 2019;23:S82–S92. doi: 10.5213/inj.1938214.107. [DOI] [PMC free article] [PubMed] [Google Scholar]
- 19.Khuntia D, Brown P, Li J, Mehta MP. Whole-brain radiotherapy in the management of brain metastasis. J. Clin. Oncol. 2006;24:1295–1304. doi: 10.1200/JCO.2005.04.6185. [DOI] [PubMed] [Google Scholar]
- 20.Smith KJ, Kapoor R, Felts PA. Demyelination: the role of reactive oxygen and nitrogen species. Brain Pathol. 1999;9:69–92. doi: 10.1111/j.1750-3639.1999.tb00212.x. [DOI] [PMC free article] [PubMed] [Google Scholar]
- 21.Peuchen S, et al. Interrelationships between astrocyte function, oxidative stress and antioxidant status within the central nervous system. Prog. Neurobiol. 1997;52:261–281. doi: 10.1016/S0301-0082(97)00010-5. [DOI] [PubMed] [Google Scholar]
- 22.Lin MT, Beal MF. Mitochondrial dysfunction and oxidative stress in neurodegenerative diseases. Nature. 2006;443:787–795. doi: 10.1038/nature05292. [DOI] [PubMed] [Google Scholar]
- 23.Forster MJ, et al. Age-related losses of cognitive function and motor skills in mice are associated with oxidative protein damage in the brain. Proc. Natl Acad. Sci. USA. 1996;93:4765–4769. doi: 10.1073/pnas.93.10.4765. [DOI] [PMC free article] [PubMed] [Google Scholar]
- 24.Juurlink BH, Paterson PG. Review of oxidative stress in brain and spinal cord injury: suggestions for pharmacological and nutritional management strategies. J. Spinal Cord. Med. 1998;21:309–334. doi: 10.1080/10790268.1998.11719540. [DOI] [PubMed] [Google Scholar]
- 25.Love S. Oxidative stress in brain ischemia. Brain Pathol. 1999;9:119–131. doi: 10.1111/j.1750-3639.1999.tb00214.x. [DOI] [PMC free article] [PubMed] [Google Scholar]
- 26.Schnell L, Fearn S, Klassen H, Schwab ME, Perry VH. Acute inflammatory responses to mechanical lesions in the CNS: differences between brain and spinal cord. Eur. J. Neurosci. 1999;11:3648–3658. doi: 10.1046/j.1460-9568.1999.00792.x. [DOI] [PubMed] [Google Scholar]
- 27.Mao XW, et al. Spaceflight induces oxidative damage to blood-brain barrier integrity in a mouse model. FASEB J. 2020;34:15516–15530. doi: 10.1096/fj.202001754R. [DOI] [PMC free article] [PubMed] [Google Scholar]
- 28.Mao XW, et al. Simulated microgravity and low-dose/low-dose-rate radiation induces oxidative damage in the mouse brain. Radiat. Res. 2016;185:647–657. doi: 10.1667/RR14267.1. [DOI] [PubMed] [Google Scholar]
- 29.Overbey EG, et al. Mice exposed to combined chronic low-dose irradiation and modeled microgravity develop long-term neurological sequelae. Int J. Mol. Sci. 2019;20:4094. doi: 10.3390/ijms20174094. [DOI] [PMC free article] [PubMed] [Google Scholar]
- 30.Mao XW, et al. High-LET radiation-induced response of microvessels in the hippocampus. Radiat. Res. 2010;173:486–493. doi: 10.1667/RR1728.1. [DOI] [PubMed] [Google Scholar]
- 31.Kwong LN, et al. Biological validation of RNA sequencing data from formalin-fixed paraffin-embedded primary melanomas. JCO Precis Oncol. 2018;2018:1–19. doi: 10.1200/PO.17.00259. [DOI] [PMC free article] [PubMed] [Google Scholar]
- 32.Santucci D, et al. Evaluation of gene, protein and neurotrophin expression in the brain of mice exposed to space environment for 91 days. PLoS ONE. 2012;7:e40112. doi: 10.1371/journal.pone.0040112. [DOI] [PMC free article] [PubMed] [Google Scholar]
- 33.Hoffman L, Chandrasekar A, Wang X, Putkey JA, Waxham MN. Neurogranin alters the structure and calcium binding properties of calmodulin. J. Biol. Chem. 2014;289:14644–14655. doi: 10.1074/jbc.M114.560656. [DOI] [PMC free article] [PubMed] [Google Scholar]
- 34.Isbrandt D, et al. Gene structures and expression profiles of three human KCND (Kv4) potassium channels mediating A-type currents I(TO) and I(SA) Genomics. 2000;64:144–154. doi: 10.1006/geno.2000.6117. [DOI] [PubMed] [Google Scholar]
- 35.Jerng HH, Shahidullah M, Covarrubias M. Inactivation gating of Kv4 potassium channels: molecular interactions involving the inner vestibule of the pore. J. Gen. Physiol. 1999;113:641–660. doi: 10.1085/jgp.113.5.641. [DOI] [PMC free article] [PubMed] [Google Scholar]
- 36.Duprat F, et al. Susceptibility of cloned K+ channels to reactive oxygen species. Proc. Natl Acad. Sci. USA. 1995;92:11796–11800. doi: 10.1073/pnas.92.25.11796. [DOI] [PMC free article] [PubMed] [Google Scholar]
- 37.Moutton S, et al. Truncating variants of the DLG4 gene are responsible for intellectual disability with marfanoid features. Clin. Genet. 2018;93:1172–1178. doi: 10.1111/cge.13243. [DOI] [PubMed] [Google Scholar]
- 38.Nguyen QA, Horn ME, Nicoll RA. Distinct roles for extracellular and intracellular domains in neuroligin function at inhibitory synapses. Elife. 2016;5:19236. doi: 10.7554/eLife.19236. [DOI] [PMC free article] [PubMed] [Google Scholar]
- 39.Carrillo GL, et al. Toxoplasma infection induces microglia-neuron contact and the loss of perisomatic inhibitory synapses. Glia. 2020;68:1968–1986. doi: 10.1002/glia.23816. [DOI] [PMC free article] [PubMed] [Google Scholar]
- 40.Yang X, Zhang F, Kudlow JE. Recruitment of O-GlcNAc transferase to promoters by corepressor Msin3a: coupling protein O-Glcnacylation to transcriptional repression. Cell. 2002;110:69–80. doi: 10.1016/S0092-8674(02)00810-3. [DOI] [PubMed] [Google Scholar]
- 41.Witteveen JS, et al. Haploinsufficiency of Mecp2-interacting transcriptional co-repressor Sin3a causes mild intellectual disability by affecting the development of cortical integrity. Nat. Genet. 2016;48:877–887. doi: 10.1038/ng.3619. [DOI] [PubMed] [Google Scholar]
- 42.Yip JW, Yip YP, Nakajima K, Capriotti C. Reelin controls position of autonomic neurons in the spinal cord. Proc. Natl Acad. Sci. USA. 2000;97:8612–8616. doi: 10.1073/pnas.150040497. [DOI] [PMC free article] [PubMed] [Google Scholar]
- 43.Douard V, Ferraris RP. Regulation of the fructose transporter Glut5 in health and disease. Am. J. Physiol. Endocrinol. Metab. 2008;295:E227–E237. doi: 10.1152/ajpendo.90245.2008. [DOI] [PMC free article] [PubMed] [Google Scholar]
- 44.Funari VA, Herrera VL, Freeman D, Tolan DR. Genes required for fructose metabolism are expressed in Purkinje cells in the cerebellum. Brain Res. Mol. Brain Res. 2005;142:115–122. doi: 10.1016/j.molbrainres.2005.09.019. [DOI] [PubMed] [Google Scholar]
- 45.Madore, C., Yin, Z., Leibowitz, J. & Butovsky, O. Microglia, Lifestyle stress, and neurodegeneration. Immunity18, 222–240 (2020). [DOI] [PMC free article] [PubMed]
- 46.Bisht K, Sharma K, Tremblay MÈ. Chronic stress as a risk factor for Alzheimer’s disease: roles of microglia-mediated synaptic remodeling, inflammation, and oxidative stress. Neurobiol. 2018;9:9–21. doi: 10.1016/j.ynstr.2018.05.003. [DOI] [PMC free article] [PubMed] [Google Scholar]
- 47.Sampaio NG, et al. Phosphorylation of Csf-1r Y721 mediates its association with Pi3k to regulate macrophage motility and enhancement of tumor cell invasion. J. Cell Sci. 2011;124:2021–2031. doi: 10.1242/jcs.075309. [DOI] [PMC free article] [PubMed] [Google Scholar]
- 48.Wei S, et al. Functional overlap but differential expression of Csf-1 And Il-34 in Their Csf-1 receptor-mediated regulation of myeloid cells. J. Leukoc. Biol. 2010;88:495–505. doi: 10.1189/jlb.1209822. [DOI] [PMC free article] [PubMed] [Google Scholar]
- 49.Behrens EM, et al. The Mer receptor tyrosine kinase: expression and function suggest a role in innate immunity. Eur. J. Immunol. 2003;33:2160–2167. doi: 10.1002/eji.200324076. [DOI] [PubMed] [Google Scholar]
- 50.Khan TN, Wong EB, Soni C, Rahman ZS. Prolonged apoptotic cell accumulation in germinal centers of Mer-deficient mice causes elevated B cell and Cd4+ Th cell responses leading to autoantibody production. J. Immunol. 2013;190:1433–1446. doi: 10.4049/jimmunol.1200824. [DOI] [PMC free article] [PubMed] [Google Scholar]
- 51.Tibrewal N, et al. Autophosphorylation docking site Tyr-867 in Mer receptor tyrosine kinase allows for dissociation of multiple signaling pathways for phagocytosis of apoptotic cells and down-modulation of lipopolysaccharide-inducible Nf-Kappab transcriptional activation. J. Biol. Chem. 2008;283:3618–3627. doi: 10.1074/jbc.M706906200. [DOI] [PubMed] [Google Scholar]
- 52.Kleinberger G, et al. TREM2 mutations implicated in neurodegeneration impair cell surface transport and phagocytosis. Sci. Transl. Med. 2014;6:243ra86. doi: 10.1126/scitranslmed.3009093. [DOI] [PubMed] [Google Scholar]
- 53.Sayed FA, et al. Differential effects of partial and complete loss of Trem2 on microglial injury response and tauopathy. Proc. Natl Acad. Sci. USA. 2018;115:10172–10177. doi: 10.1073/pnas.1811411115. [DOI] [PMC free article] [PubMed] [Google Scholar]
- 54.Mazaheri F, et al. Trem2 deficiency impairs chemotaxis and microglial responses to neuronal injury. EMBO Rep. 2017;18:1186–1189. doi: 10.15252/embr.201743922. [DOI] [PMC free article] [PubMed] [Google Scholar]
- 55.DeSilva U, et al. Molecular characterization of the mouse P47-Phox (Ncf1) gene and comparative analysis of the mouse P47-Phox (Ncf1) gene to the human Ncf1 gene. Mol. Cell Biol. Res Commun. 2000;3:224–230. doi: 10.1006/mcbr.2000.0214. [DOI] [PubMed] [Google Scholar]
- 56.Liu W, et al. Park7 interacts with P47(Phox) to direct nadph oxidase-dependent Ros production and protect against sepsis. Cell Res. 2015;25:691–706. doi: 10.1038/cr.2015.63. [DOI] [PMC free article] [PubMed] [Google Scholar]
- 57.Kipp M. Oligodendrocyte physiology and pathology function. Cells. 2020;9:2078. doi: 10.3390/cells9092078. [DOI] [PMC free article] [PubMed] [Google Scholar]
- 58.Moore, S. et al. A role of oligodendrocytes in information processing. Nat. Commun. 11, 5497 (2020). [DOI] [PMC free article] [PubMed]
- 59.Werner HB, et al. Proteolipid protein is required for transport of Sirtuin 2 into Cns myelin. J. Neurosci. 2007;27:7717–7730. doi: 10.1523/JNEUROSCI.1254-07.2007. [DOI] [PMC free article] [PubMed] [Google Scholar]
- 60.Xu HC, et al. Lymphocytes negatively regulate NK cell activity via Qa-1b following viral infection. Cell Rep. 2017;21:2528–2540. doi: 10.1016/j.celrep.2017.11.001. [DOI] [PubMed] [Google Scholar]
- 61.Hu D, et al. Analysis of regulatory Cd8 T cells in Qa-1-deficient mice. Nat. Immunol. 2004;5:516–523. doi: 10.1038/ni1063. [DOI] [PubMed] [Google Scholar]
- 62.Malhotra N, et al. A network of high-mobility group box transcription factors programs innate interleukin-17 production. Immunity. 2013;38:681–693. doi: 10.1016/j.immuni.2013.01.010. [DOI] [PMC free article] [PubMed] [Google Scholar]
- 63.Tao P, et al. A dominant autoinflammatory disease caused by non-cleavable variants of Ripk1. Nature. 2020;577:109–114. doi: 10.1038/s41586-019-1830-y. [DOI] [PubMed] [Google Scholar]
- 64.Lalaoui N, et al. Mutations that prevent caspase cleavage of Ripk1 cause autoinflammatory disease. Nature. 2020;577:103–108. doi: 10.1038/s41586-019-1828-5. [DOI] [PMC free article] [PubMed] [Google Scholar]
- 65.Rickard JA, et al. RIPK1 regulates Ripk3-Mlkl-driven systemic inflammation and emergency hematopoiesis. Cell. 2014;157:1175–1188. doi: 10.1016/j.cell.2014.04.019. [DOI] [PubMed] [Google Scholar]
- 66.McCormack RM, et al. Perforin-2 is essential for intracellular defense of parenchymal cells and phagocytes against pathogenic bacteria. Elife. 2015;4:e06508. doi: 10.7554/eLife.06508. [DOI] [PMC free article] [PubMed] [Google Scholar]
- 67.Bai F, et al. Perforin-2 breaches the envelope of phagocytosed bacteria allowing antimicrobial effectors access to intracellular targets. J. Immunol. 2018;201:2710–2720. doi: 10.4049/jimmunol.1800365. [DOI] [PMC free article] [PubMed] [Google Scholar]
- 68.Slowicka K, et al. Optineurin deficiency in mice is associated with increased sensitivity to salmonella but does not affect proinflammatory Nf-Kappab signaling. Eur. J. Immunol. 2016;46:971–980. doi: 10.1002/eji.201545863. [DOI] [PubMed] [Google Scholar]
- 69.Miller BC, et al. Subsets of exhausted CD8(+) T cells differentially mediate tumor control and respond to checkpoint blockade. Nat. Immunol. 2019;20:326–336. doi: 10.1038/s41590-019-0312-6. [DOI] [PMC free article] [PubMed] [Google Scholar]
- 70.Bannoud N, et al. Hypoxia supports differentiation of terminally exhausted CD8 T cells. Front Immunol. 2021;12:660944. doi: 10.3389/fimmu.2021.660944. [DOI] [PMC free article] [PubMed] [Google Scholar]
- 71.Yaqinuddin A, Kashir J. Innate immunity in COVID-19 patients mediated by NKG2A receptors, and potential treatment using monalizumab, cholroquine, and antiviral agents. Med. Hypotheses. 2020;140:109777. doi: 10.1016/j.mehy.2020.109777. [DOI] [PMC free article] [PubMed] [Google Scholar]
- 72.Omarova S, et al. Abnormal vascularization in mouse retina with dysregulated retinal cholesterol homeostasis. J. Clin. Invest. 2012;122:3012–3023. doi: 10.1172/JCI63816. [DOI] [PMC free article] [PubMed] [Google Scholar]
- 73.Bavner A, et al. On the mechanism of accumulation of cholestanol in the brain of mice with a disruption of sterol 27-hydroxylase. J. Lipid Res. 2010;51:2722–2730. doi: 10.1194/jlr.M008326. [DOI] [PMC free article] [PubMed] [Google Scholar]
- 74.Testa G, et al. Changes in brain oxysterols at different stages of Alzheimer’s disease: their involvement in neuroinflammation. Redox Biol. 2016;10:24–33. doi: 10.1016/j.redox.2016.09.001. [DOI] [PMC free article] [PubMed] [Google Scholar]
- 75.Mast N, et al. Cytochrome P450 27A1 deficiency and regional differences in brain sterol metabolism cause preferential cholestanol accumulation in the cerebellum. J. Biol. Chem. 2017;292:4913–4924. doi: 10.1074/jbc.M116.774760. [DOI] [PMC free article] [PubMed] [Google Scholar]
- 76.Vairapandi M, Balliet AG, Hoffman B, Liebermann DA. GADD45b and GADD45g are cdc2/cyclinB1 Kinase inhibitors with a role in S and G2/M cell cycle checkpoints induced by genotoxic stress. J. Cell Physiol. 2002;192:327–338. doi: 10.1002/jcp.10140. [DOI] [PubMed] [Google Scholar]
- 77.Ohno S, et al. Comprehensive phenotypic analysis of knockout mice deficient in cyclin G1 and cyclin G2. Sci. Rep. 2016;6:39091. doi: 10.1038/srep39091. [DOI] [PMC free article] [PubMed] [Google Scholar]
- 78.Zhao C, et al. Cyclin G2 suppresses glomerulosclerosis by regulating canonical Wnt signalling. Biomed. Res. Int. 2018;2018:6938482. doi: 10.1155/2018/6938482. [DOI] [PMC free article] [PubMed] [Google Scholar]
- 79.Gyuris A, et al. The chromatin-targeting protein Brd2 is required for neural tube closure and embryogenesis. Biochim Biophys. Acta. 2009;1789:413–421. doi: 10.1016/j.bbagrm.2009.03.005. [DOI] [PMC free article] [PubMed] [Google Scholar]
- 80.Nevins JR. The Rb/E2F pathway and cancer. Hum. Mol. Genet. 2001;10:699–703. doi: 10.1093/hmg/10.7.699. [DOI] [PubMed] [Google Scholar]
- 81.Shang E, Wang X, Wen D, Greenberg DA, Wolgemuth DJ. Double bromodomain-containing gene Brd2 is essential for embryonic development in mouse. Dev. Dyn. 2009;238:908–917. doi: 10.1002/dvdy.21911. [DOI] [PMC free article] [PubMed] [Google Scholar]
- 82.Lamonica JM, et al. Bromodomain protein Brd3 associates with acetylated Gata1 to promote its chromatin occupancy at erythroid target genes. Proc. Natl Acad. Sci. USA. 2011;108:E159–E168. doi: 10.1073/pnas.1102140108. [DOI] [PMC free article] [PubMed] [Google Scholar]
- 83.Biddlestone J, Batie M, Bandarra D, Munoz I, Rocha S. SINHCAF/FAM60A and SIN3A specifically repress HIF-2alpha expression. Biochem. J. 2018;475:2073–2090. doi: 10.1042/BCJ20170945. [DOI] [PMC free article] [PubMed] [Google Scholar]
- 84.Urbach A, Witte OW. Divide or commit—revisiting the role of cell cycle regulators in adult hippocampal neurogenesis. Front. Cell Dev. Biol. 2019;7:55. doi: 10.3389/fcell.2019.00055. [DOI] [PMC free article] [PubMed] [Google Scholar]
- 85.Blomen VA, Boonstra J. Cell fate determination during G1 phase progression. Cell Mol. Life Sci. 2007;64:3084–3104. doi: 10.1007/s00018-007-7271-z. [DOI] [PMC free article] [PubMed] [Google Scholar]
- 86.Wang X, Destrument A, Tournier C. Physiological roles of MKK4 and MKK7: insights from animal models. Biochim Biophys. Acta. 2007;1773:1349–1357. doi: 10.1016/j.bbamcr.2006.10.016. [DOI] [PubMed] [Google Scholar]
- 87.Tournier C, et al. MKK7 is an essential component of the Jnk signal transduction pathway activated by proinflammatory cytokines. Genes Dev. 2001;15:1419–1426. doi: 10.1101/gad.888501. [DOI] [PMC free article] [PubMed] [Google Scholar]
- 88.Dmitrieva NI, Bulavin DV, Burg MB. High NaCl causes Mre11 to leave the nucleus, disrupting DNA damage signaling and repair. Am. J. Physiol. Ren. Physiol. 2003;285:F266–F274. doi: 10.1152/ajprenal.00060.2003. [DOI] [PubMed] [Google Scholar]
- 89.Wang M, et al. Integrative network analysis of nineteen brain regions identifies molecular signatures and networks underlying selective regional vulnerability to Alzheimer’s disease. Genome Med. 2016;8:104. doi: 10.1186/s13073-016-0355-3. [DOI] [PMC free article] [PubMed] [Google Scholar]
- 90.Armand EJ, Li J, Xie F, Luo C, Mukamel EA. Single-cell sequencing of brain cell transcriptomes and epigenomes. Neuron. 2021;109:11–26. doi: 10.1016/j.neuron.2020.12.010. [DOI] [PMC free article] [PubMed] [Google Scholar]
- 91.Zhang R, Engler A, Taylor, Notch V. An interactive player in neurogenesis and disease. Cell Tissue Res. 2018;371:73–89. doi: 10.1007/s00441-017-2641-9. [DOI] [PubMed] [Google Scholar]
- 92.Ho DM, Artavanis-Tsakonas S, Louvi A. The notch pathway in CNS homeostasis and neurodegeneration. Wiley Interdiscip. Rev. Dev. Biol. 2020;9:e358. doi: 10.1002/wdev.358. [DOI] [PubMed] [Google Scholar]
- 93.Green C, et al. Structural brain correlates of serum and epigenetic markers of inflammation in major depressive disorder. Brain Behav. Immun. 2021;92:39–48. doi: 10.1016/j.bbi.2020.11.024. [DOI] [PMC free article] [PubMed] [Google Scholar]
Associated Data
This section collects any data citations, data availability statements, or supplementary materials included in this article.
Supplementary Materials
Data Availability Statement
The authors declare that source data supporting the findings of this study with the figures of the article are provided with this paper.
All of the significant gene data obtained in this study were deposited in the NCBI’s GEO, and are accessible through GEO accession number GSE186278.