

Abstract
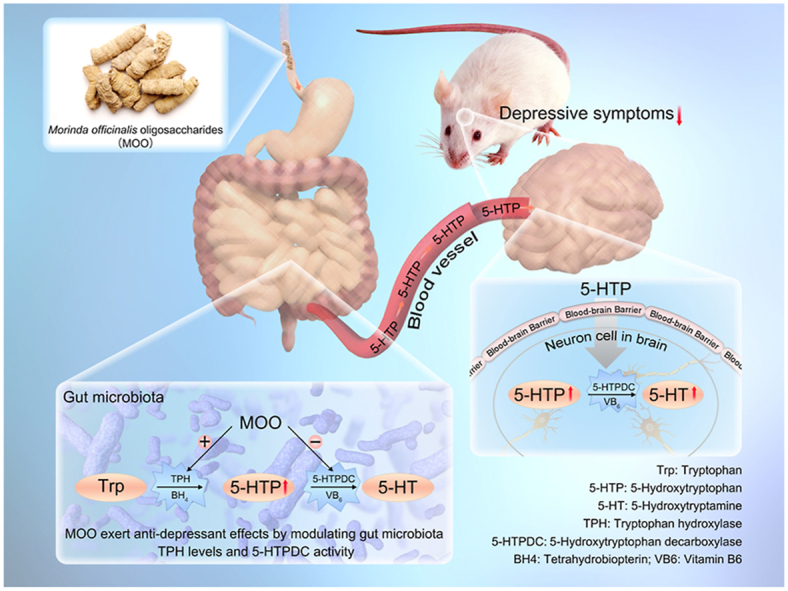
Morinda officinalis oligosaccharides (MOO) are an oral drug approved in China for the treatment of depression in China. However, MOO is hardly absorbed so that their anti-depressant mechanism has not been elucidated. Here, we show that oral MOO acted on tryptophan → 5-hydroxytryptophan (5-HTP) → serotonin (5-HT) metabolic pathway in the gut microbiota. MOO could increase tryptophan hydroxylase levels in the gut microbiota which accelerated 5-HTP production from tryptophan; meanwhile, MOO inhibited 5-hydroxytryptophan decarboxylase activity, thus reduced 5-HT generation, and accumulated 5-HTP. The raised 5-HTP from the gut microbiota was absorbed to the blood, and then passed across the blood–brain barrier to improve 5-HT levels in the brain. Additionally, pentasaccharide, as one of the main components in MOO, exerted the significant anti-depressant effect through a mechanism identical to that of MOO. This study reveals for the first time that MOO can alleviate depression via increasing 5-HTP in the gut microbiota.
KEY WORDS: Depression, Morinda officinalis oligosaccharides, Gut microbiota, Tryptophan hydroxylase, 5-Hydroxytryptophan decarboxylase, 5-Hydroxytryptophan, Serotonin, Drug metabolism
Graphical abstract
Up-regulating gut microbiota tryptophan hydroxylase levels and down-regulating 5-hydroxytryptophan decarboxylase activity is the molecular mechanism of action of the anti-depressant drug Morinda officinalis oligosaccharides.
1. Introduction
Depression, a common mental illness, affects more than 264 million people worldwide1. However, current treatment for depression is unsatisfactory for various reasons, for example, the lack of effective therapeutic agents; thus, discovery of good alternative treatment is highly desirable.
Serotonin (5-HT) is a monoamine neurotransmitter closely related to depression. Its synthetic pathway is the following: tryptophan (Trp) is used to synthesize 5-hydroxytryptophan (5-HTP) through tryptophan hydroxylase (TPH), then 5-HTP can generate 5-HT through 5-hydroxytryptophan decarboxylase (5-HTPDC)2. 5-HTP could effectively enhance the synthesis of 5-HT in central nerve system, and 5-HT levels is associated with its activity against depression3.
It has been reported recently that gut microbiota might affect host psychology through production of characteristic metabolites4. It might adjust the basic neurodevelopmental processes that affect the blood–brain barrier4, myelin sheath, nerve formation and microglia maturation5, and regulate various behaviors in animals6, such as food intake and social behavior7. Because of its influence on the development and function of the nervous system and its ability to influence host behavior8, the gut microbiota has received increasing attention in the context of depression. In 2015, the gut microbiota was shown to participate in the biosynthesis of serotonin (5-HT)9, thus, the “gut–brain axis” hypothesis was for the first time demonstrated with clear chemical evidence. However, this study showed that spore-forming bacteria from the mice or human microbiota promote the biosynthesis of 5-HT in the colonic enterochromaffin cells (EC), not the gut microbiota themselves.
Morinda officinalis (MO) is one of the four famous Southern Chinese herbs. The roots of MO, a member of the Rubiaceae family and one of the most well-known herbs in southern China10, are used as an herb in Chinese medicine. M. officinalis oligosaccharides (MOO, Fig. 1A) are the active ingredients extracted from the roots of MO11. MOO, a mixture of oligosaccharides ranging from trisaccharides to nonasaccharides and mainly consisting of seven oligosaccharides12, have shown pharmacological activities on anti-depressant, anti-dementia and memory-enhancing effects13,14. MOO has been approved to be a prescription drug against depressant in China in 201215 (NMPA approval number: Z20120013), making them a clinical traditional Chinese medicine (TCM) for the treatment of depression. The results of Phase I clinical trial in China16 showed that after taking MOO capsules, all healthy volunteers in the study showed good tolerance, in groups either administered with MOO as a single dose (50–1000 mg) or continuously administration for 7 days (800 mg/day). The only minor adverse effects observed were sleepiness, fatigue and dry mouth. Phases II–III clinical trial results showed that there was no statistically difference in the incidence of adverse reactions between the drug treatment group and placebo group at the treatment doses (300 or 600 mg/day). In addition, MOO capsules were not less effective than fluoxetine for depression17,18.
Figure 1.

MOO can increase the levels of 5-HTP by gut microbiota and decrease the production of 5-HT in vitro. (A) The chemical structures of the oligosaccharides in MOO (n = 1: trisaccharide; n = 2: tetrasaccharide; n = 3: pentasaccharide; n = 4: hexasaccharide; n = 5: heptasaccharide; n = 6: octasaccharide; n = 7: nonasaccharide). (B) The levels of 5-HT in the gut microbiota cultures in vitro after incubation with MOO (5, 10 or 50 μg/mL) for 6 and 12 h were determined by LC–MS/MS to identify possible metabolic pathways. (C) The levels of 5-HTP in the gut microbiota cultures in vitro after incubation with MOO (50 or 100 μg/mL) for 6 and 12 h were determined by LC–MS/MS. (D) The levels of 5-HT in the gut microbiota cultures in vitro after incubation with MOO (50 or 100 μg/mL) for 6 and 12 h were determined by LC–MS/MS for further verification. (B)–(D): ∗P < 0.05, ∗∗P < 0.01; n = 5.
Mechanism studies for MOO have demonstrated some of its activities in brain, such as enhancing 5-HT neurotransmission, increasing the expression of neurotrophic factor and changing glucose metabolism19,20. A clinical study showed a significant therapeutic efficacy of MOO capsules in 1384 individuals with mild to moderate depression, and the improvement was not less than that of conventional antidepressants such as fluoxetine hydrochloride and escitalopram15. However, based on previous studies, MOO had poor absorption in oral administration21; thus MOO's concentration in blood or brain might be very low. Many studies reported on gut microbiota interacting with drugs and affecting drug absorption22,23. A recent study showed a close relationship between the antidepressant effect of MOO and gut microbiota, although the molecular mechanism was absent24. These results provoked our interest to explore the mode of action of MOO.
In the past many years, we have explored the molecular mechanism of antidepressants through investigating gut microbiota25,26. What presented below is the molecular mechanism of MOO in ameliorating depressant symptom. It might provide a new mechanism example for the “gut–brain dialogue” with chemical link of 5-THP and be of general interest for natural medicinal agents that are difficult to be absorb in the intestine.
2. Materials and methods
2.1. Chemicals and reagents
MOO and oligosaccharides ranging from trisaccharides to nonasaccharides were provided by National Engineering Research Center for the Emergence Drugs. Benzylamine (the internal standards), Trp, 5-HTP, 5-HT and benserazide hydrochloride and anaerobic medium (dry powder) were supplied by Beijing Solarbio Science & Technology Co., Ltd. (Beijing, China). PCPA was supplied by Sigma–Aldrich (Shanghai, China). The purity of the above standards was greater than 98%. Chromatography-grade ethanol and acetonitrile were purchased from Thermo Fisher Scientific Co., Ltd. (Shanghai, China). Other chromatographic reagents were obtained from Chinese reagent companies. Nitric oxide (NO) kits (nitrate reductase method) were purchased from Nanjing Jiancheng Bioengineering Institute (Nanjing, China). TPH ELISA kits for detecting content were purchased from Nanjing Jiancheng Bioengineering Institute (Nanjing, China). 5-HTPDC ELISA kit and TPH ELISA kits for detecting activity were purchased from Shanghai Shuangyin Biotechnology Co., Ltd. (Shanghai, China). BH4 and VB6 ELISA kits were purchased from Shanghai Jianglai Biotechnology Co., Ltd. (Shanghai, China).
2.2. Gut microbiota culture, MOO treatment, and sample pre-treatment
Male Sprague–Dawley rats (SD rats, 8 weeks, 180–200 g) were provided by the Institute of Laboratory Animal Science, Chinese Academy of Medical Sciences (Beijing, China). The animals were housed in an environment with a temperature of 22–24 °C and a humidity of 45% with a 12 h day and night cycle (lighting time, 08:00–20:00). The rats were kept for 3 days before performing experiments and were provided as a normal diet of feed. The experiments were carried out in strict accordance with the ethical guidelines for experimental animals and was approved by the Animal Ethics Committee of the Experimental Animal Institute of the Chinese Academy of Medical Sciences and Peking Union Medical College (Beijing, China).
To prepare gut microbiota cultures, the anaerobic medium was configured according to the instructions and sterilized at high temperature27. Meanwhile, the rats were fasted for 12 h before the experiment and provided free access to drinking water throughout the experiment. After that, the rats were sacrificed by cervical dislocation. Under anaerobic conditions, their abdomens were incised, their colons were removed, and the levels of the colons were mixed with the anaerobic medium at a ratio of 1 (g) to 20 (mL). After thorough mixing, the gut microbiota cultures were filtrated by two layers of sterile gauze and preincubated at 37 °C for 1 h28. Under 100% N2 conditions, 10 μL of a solution of MOO (10 mg/mL or 5 mg/mL and the solvent was water) was added to the cultures (990 μL). Meanwhile, 10 μL of water was added to the cultures (990 μL) as a blank control. All of them were incubated at 37 °C for 6 or 12 h.
Then, the samples (100 μL) were moved to a 1.5 mL EP tube to which 300 μL of acetonitrile was added. After vortexing for 10 s, the mixture was centrifuged at 14,000 × g for 5 min at 4 °C. One hundred microliters of supernatant was transferred to a centrifuge tube and centrifuged at 14,000 × g for 5 min. 1 μL of the filtrate was used for LC–MS/MS analysis to determine the levels of Trp, 5-HT, 5-HTP and dopamine (see the method below). An NO kit (nitrate reductase method, see above) was used to analyze these samples.
2.3. LC–MS/MS analysis of Trp, 5-HT, 5-HTP and dopamine
High performance liquid chromatography (HPLC)-triple quadrupole mass spectrometry (HPLC–MS/MS, 8050, Shimadzu, Kyoto, Japan) was used to quantitatively analyze Trp, 5-HT, and 5-HTP. An Alltima TM C18 column (5 μm, 4.6 mm × 150 mm) was used to perform the chromatography analysis with a column temperature of 40 °C. The linear gradient elution flow rate was 0.6 mL/min. Water and acetic acid (99.975:0.025, v/v) were used as mobile phase A, and acetonitrile was used as mobile phase B. The elution gradient was as follows: 0.00–1.00 min (80% A and 20% B), 1.00–2.00 min (40% A and 60% B), 2.00–4.00 min (30% A and 70% B), 4.00–5.00 min (12% A and 88% B), 5.00–6.00 min (5% A and 95% B), 6.00–6.01 min (5% A and 95% B), 6.01–8.00 min (80% A and 20% B) and 10.01 min (stop). The autosampler temperature was set to 4 °C. The mass spectrometer was operated in multiple reaction monitoring (MRM) mode. The following product ion precursors were monitored: Trp (m/z), 205.15 [M+H]+ → 118.15; 5-HT (m/z), 177.15 [M+H]+ → 115.10; and 5-HTP, 221.35 [M+H]+ → 134.30. The atomizing gas flow rate was 3.0 L/min, the drying gas flow rate was 10 L/min, and the heating gas flow rate was 10 L/min.
HPLC–triple quadrupole mass spectrometry (HPLC–MS/MS, 8050, Shimadzu) was used to quantify dopamine. An Alltima TM C18 column (5 μm, 4.6 mm × 150 mm) was used to perform the chromatography analysis with a column temperature of 40 °C. The linear gradient elution flow rate was 0.8 mL/min. Water and acetic acid (99.975:0.025, v/v) were used as mobile phase A, and acetonitrile was used as mobile phase B. The gradient elution was as follows: 0.00 min (90% A and 10% B) for 2 min (90% A and 10% B), 8 min (90% A and 10% B), and 8.01 min (stop). The autosampler temperature was set to 4 °C. The mass spectrometer was operated in MRM mode. The following product ion precursor was monitored: dopamine (m/z), 154.20 [M+H]+ → 137.05. The atomizing gas flow rate was 3.0 L/min, the drying gas flow rate was 10 L/min, and the heating gas flow rate was 10 L/min. The concentrations used for the standard curve were as follows: 1, 5, 10, 50, 100, and 1000 ng/mL.
2.4. Model establishment of CUMS rat and MOO treatment
Fifty SD rats were randomly divided into 5 groups: Untreated group, CUMS group, MOO-L group (treated with 50 mg/kg), MOO-H group (treated with 100 mg/kg) and Pseudo-germ-free (PGF)-MOO-H group (treated with 100 mg/kg). Ten rats were randomly assigned to each group. To establish the CUMS model, the rats in each group, except those in the Untreated group, were randomly exposed to 2 of the following stimuli every day for 56 days: behavioral restraint (stuck into a 500 mL bottle for 1 h), ice water swimming for 5 min, electric shock (2 mA for 4 s, interval 10 s, repeat 2 times), 4 °C cold stimulation for 20 min, clamping the tail with a clip for 5 min, wetting the bedding for 1 day, rat cage tilting for 12 h, water deprivation, and fasting29. After that, the SPT25 was carried out. In addition, PGF model rats were created by oral administration of antibiotics based on previously described methods28.
Then MOO-L group (50 mg/kg), MOO-H group (100 mg/kg) and PGF-MOO-H group (100 mg/kg) were given oral administration of MOO while all the groups were still randomly exposed to 2 of the above stimuli every day. The SPT was carried out 2 weeks to determine whether the rats exhibited reduced depressive behavior. Then, rat faeces were collected, prepared, and analyzed by 16S rRNA gene sequencing technology of Allwegene Technology Co., Ltd. Plasma and brain were taken for further analysis. Concentrations of 5-HTP and 5-HT in the plasma, brain and faeces in the rats were detected by LC–MS/MS method described in Section 2.2.
2.5. MOO and PSA in treating depression mice induced by reserpine
Sixty ICR mice were randomly divided into 6 groups (n = 10 for each group) to perform the depression model induced by reserpine, including (1) Untreated group, (2) Model group (induced by reserpine), (3) MOO-L group (treated with 50 mg/kg), (4) MOO-H group (treated with 100 mg/kg), (5) PSA-H group (treated with 100 mg/kg), (6) PGF-MOO-H group (treated with 100 mg/kg)14. Firstly, PGF model mice were created by oral administration of antibiotics based on previously described methods25. After that, MOO and PSA were orally administrated as described above for 10 consecutive days and water were orally administrated to the groups (1) and (2). Meanwhile, groups from (2) to (6) were injected intraperitoneally with 0.5 mg/kg reserpine30 and group (1) was injected intraperitoneally with normal saline. After the final drug administration, the behavioral experiments were tested to evaluate the efficacy of MOO and PSA. And the fresh faeces, serum, brain tissue were collected to determine the activity of TPH and 5-HTPDC and the levels of 5-HTP, and 5-HT. The behavioral experiments were described as follows:
Forced swim test (FST): The day before the test, all mice were forced to swim for 15 min during training. The next day after the administration, the ICR mice were forced to swim for 5 min at the same time as yesterday, and the last 3 min of immobility were recorded25.
Tail-suspension test (TST): After the final drug administration, tail suspension test was performed and the immobility time was determined during the last 4 min of the 6-min test30.
2.6. Test of 5-HTP/TPH and 5-HT/5-HTPDC in the gut microbiota incubated with MOO (with or without inhibitors)
MOO (final concentration of 50 or 100 μg/mL) with or without PCPA (a TPH inhibitor, final concentration of 100 μmol/L) were incubated with gut microbiota cultures of the rats in sterile EP tube for 6 or 12 h at 37 °C and the 5-HTP levels were measured by LC–MS/MS. A TPH ELISA kit was used to determine the change in TPH levels at 6 h and 12 h to deduce the TPH levels.
MOO (final concentration of 50 or 100 μg/mL) with or without benserazide (a 5-HTPDC inhibitor, final concentration of 100 μmol/L) were incubated with the gut microbiota cultures of the rats in sterile EP tube for 6 or 12 h, and the 5-HT levels were measured by the methods described in Section 2.2. Meanwhile, the gut microbiota cultures (200 μL) were moved to a 1.5 mL EP tube and centrifuged at 14,000 × g for 5 min. Then the supernatant was collected. A 5-HTPDC ELISA kit was used to determine the change in 5-HTPDC activity at 6 and 12 h.
2.7. Test of BH4 and VB6 in the gut microbiota incubated with MOO or PSA
MOO (final concentration of 50 or 100 μg/mL) and PSA (final concentration of 50 or 100 μg/mL) were incubated with the gut microbiota cultures of the rats in sterile EP tube for 12 h at 37 °C. Then, the gut microbiota cultures were centrifuged at 14,000 × g for 5 min and the supernatant was collected. A BH4 ELISA kit and VB6 ELISA kit were used to determine the change in BH4 and VB6 levels at 12 h.
2.8. TPH levels and 5-HTPDC activity in the gut microbiota treated with single oligosaccharides from MOO in vitro
After incubating single oligosaccharides (from trisaccharides to nonasaccharides, separately) from MOO (final concentration of 100 μg/mL) with gut microbiota cultures for 12 h, the levels of TPH and the activities of 5-HTPDC were measured by the methods described in Section 2.5.
2.9. Determination of PSA and MOO in five batches of MOO capsules
Determination of MOO and PSA was performed in HPLC system with differential refractive index detector 2414 and separations module P600 (Waters, USA). Separations were carried out on a Shimadzu Inertsil amino column (4.6 mm × 250 mm, i.d., 4.6 μm). The column temperature was set at 30 °C. The mobile phase was consisted of water (70%) and acetonitrile (30%) with isocratic elution. The flow rate was 1.5 mL/min, the sample concentration was 50 mg/mL, and the injection volume was 100 μL. Quantitative determination of PSA and MOO in five batches of MOO capsules were calculated based on PSA reference compound.
2.10. Molecular virtual docking simulation of PSA with TPH and 5-HTPDC
Discovery Studio Client software (v16.1.0.15350) was used to perform molecular virtual docking simulations of PSA with TPH and 5-HTPDC. The crystal structures of TPH (PDB: 3HF6) and 5-HTPDC (PDB: 4OBV) from human were obtained from the Protein Data Bank. Docking simulations between PSA and TPH or 5-HTPDC were performed by CDOCKER to analyze the conjugation between the ligand and the protein. The parameters were set to the default values.
2.11. Enzymatic reaction of TPH and 5-HTPDC derived from gut microbiota
The full-length DNA sequences encoding TPH from Enterobacter cloacae and HTPDC from Ruminococcus gnavus were synthesized by Genscript Corp. (Nanjing, China), and cloned into pET28a (Novagen). The recombinant plasmids were transformed into an E. coli BL21 (DE3) star expression strain (Invitrogen), respectively. Bacterial cells were grown to mid-log phase in LB media at 37 °C in the presence of 50 mg/mL kanamycin. Induction of protein expression was initiated by adding isopropyl-1-thio-β-d-galactopyranoside to the culture to a final concentration of 0.4 mmol/L, and the cells were grown at 16 °C. The cells were pelleted after 20 h by centrifugation at 6000 × g for 10 min at 4 °C. The cell pellet was resuspended in a buffer containing 20 mmol/L HEPES (pH 7.2), 1 mol/L NaCl, 2 mmol/L β-mercaptoethanol and 1 mmol/L PMSF, and lysed by ultrasonification on ice. The cell debris and membranes were pelleted by centrifugation at 20,000 × g for 60 min at 4 °C. The soluble N-terminally hexahistidine-tagged protein was purified by affinity chromatography with nickel-nitrilotriacetic acid resin (Bio-Rad, USA). The protein was further purified by gel filtration (Superdex™ 200, GE Healthcare, USA) equilibrated in a buffer containing 20 mmol/L HEPES (pH 7.2), 100 mmol/L NaCl and 2 mmol/L DTT using an ÄKTA Purifier System (GE Healthcare, USA). Highly purified protein fractions were pooled and concentrated. Protein concentrations were determined using the Bio-Rad protein assay kit and crystallization trials were performed by ultrafiltration in an Amicon cell (Millipore, USA).
For the enzymatic reaction of TPH, two reaction systems were set up, as follows: The final concentrations of l-Trp in the first reaction system were divided into 7 different concentrations, including 0, 10, 50, 100, 500, 750, and 1000 μmol/L. The reaction time was 60 min. Next, the reaction time points in the second reaction system were divided into 5 different points, including 0, 10, 20, 30, and 60 min. The final concentration of l-Trp was 500 μmol/L. All the reaction system included TPH (0.06 mg/mL), Na HEPES (40 mmol/L), catalase (0.05 mg/mL), ferrous ammonium sulfate (10 μmol/L), BH4 (200 μmol/L) and DTT (2 mmol/L)31. The reaction was started by adding TPH. The sample was precipitated in 900 μL methanol (0 °C) to stop after the reaction. After diluting 10 times with methanol (0 °C), the samples were used to analyze the content of 5-HTP by LC–MS/MS (8060, Shimadzu).
For the enzymatic reaction of 5-HTPDC, two reaction systems were set up as follows: The final concentrations of 5-HTP in the first reaction system were divided into 7 different concentrations, including 0, 10, 50, 100, 500, 750, and 1000 μmol/L. The reaction time was 60 min. Next, the reaction time points in the second reaction system were divided into 5 different points, including 0, 10, 20, 30, and 60 min. The final concentration of 5-HTP was 500 μmol/L. The reaction system includes 5-HTPDC (0.055 mg/mL), sodium phosphate buffer (50 mmol/L, pH 6.5), NaCl (300 mmol/L) and pyridoxal 5′-phosphatemonohydrate (40 μmol/L)32. The reaction was started by adding 5-HTPDC. The sample was precipitated in 900 μL methanol (0 °C) to stop after the reaction. After diluting 10 times with methanol (0 °C), the samples were used to analyze the content of 5-HTP by LC–MS/MS (8060, Shimadzu).
2.12. Measurement of TPH/BH4 and 5-HTPDC/VB6 in brain homogenate with or without MOO and PSA in vitro
To prepare the brain homogenate, the whole brains were collected from the SD rats mentioned above. Then, the whole brains and the normal saline were thoroughly mixed (1 g:5 mL). After that, MOO (final concentration of 50 or 100 μg/mL) and PSA (final concentration of 50 or 100 μg/mL) were added to culture in the brain homogenate for 4 or 6 h to measure the changes in the levels of TPH, BH4 and VB6 and the activity of 5-HTPDC.
2.13. Measurement of the 5-HT, 5-HTP, TPH and 5-HTPDC activity in the gut microbiota with or without MOO and PSA in vitro
To measure the levels of 5-HT and 5-HTP, MOO (final concentration of 100, 200 or 400 μg/mL) and PSA (final concentration of 100, 200 or 400 μg/mL) were incubated with the gut microbiota cultures of the normal SD rats for 6 and 12 h, respectively. The analytical method of LC–MS/MS was the same as described in Sections 2.2, 2.5. The changes in TPH levels and 5-HTPDC activity were determined after incubation for 12 h.
2.14. Gut microbial diversity analysis
The gut microbiota of all rat groups (Untreated, model, 50 mg/kg MOO treatment, 100 mg/kg MOO treatment and PGF 100 mg/kg MOO treatment groups) was analyzed by 16S rRNA gene sequencing from Allwegene Technology Co., Ltd. These methods were identical to those used in our previous study33. Sequences with equal or higher similarity values were assigned to the same OTU.
2.15. 10 single strains treated with MOO and test of 5-HTP/5-HT in the incubation
Enterococcus faecalis, Bifidobacterium longum, Bifidobacterium breve, Lactobacillus casei, Lactobacillus acidophilus, Clostridium butyricum, Lactobacillus reuteri, Lactococcus lactis, Lactobacillus plantarum and Streptococcus thermophilus were purchased from Nanjingbianzhen Biotechnology Co., Ltd. and stored at −80 °C. One sample of each of these 10 strains were removed from the −80 °C freezer and quantified after activation in their corresponding culture systems, and the number of single bacterial cells of each strain was controlled to ensure the same number of cells from each strain were used. MOO solutions (5 and 10 mg/mL) were prepared in water, and 5 μL of MOO solution was added to 500 μL of culture such that the final concentration of the MOO was 50 or 100 μg/mL. After incubation at 37 °C for 12 h, 300 μL of acetonitrile-precipitated protein was added to 100 μL of the bacterial solution, and the 5-HTP and 5-HT levels were analyzed by LC–MS/MS as described in Section 2.2.
2.16. Plasma pharmacokinetics of PSA after oral administration of MOO in SD rats
Male SD rats (8 weeks, 180–200 g) were provided by the National Institutes for Food and Drug Control (Beijing, China). The animals were house in an environment with a temperature of 22–24 °C and a humidity of 45% with a 12-h day and night cycle (lighting time, 08:00–20:00). The rats were kept for 3 days before performing experiments and were provided as a normal diet of feed. The experiments were carried out in strict accordance with the ethical guidelines for experimental animals and was approved by the Animal Ethics Committee of the Experimental Animal Institute of the Chinese Academy of Medical Sciences and Peking Union Medical College.
Six SD rats were randomly divided into 2 groups (n = 3 for each group), including the untreated group as Group 1 and MOO group (treated with 1 g/kg) as Group 2. A single dose of MOO (1 g/kg) aqueous solution was administrated to SD rats in MOO group while untreated group were given the same volume of water orally. After that, the whole blood sample (200 μL) were obtained from the retro-orbital venous plexus with capillary glass tubes at 0.25, 1, 2, 6, and 12 h and transferred to heparinized tubes. After centrifuging at 5000 × g for 5 min at 4 °C, the plasma was collected to determine the levels of PSA.
HPLC-triple quadrupole mass spectrometry (HPLC–MS/MS, 8050, Shimadzu) was used to quantitatively analyze PSA. An Alltima HP HILIC column (3 μm, 2.1 mm × 150 mm) was used to perform the chromatography analysis with a column temperature of 40 °C. The linear gradient elution flow rate was 0.4 mL/min. Water were used as mobile phase A, and acetonitrile was used as mobile phase B. The elution gradient was as follows: 0.01 min (10% A and 90% B), 2.00 min (20% A and 80% B), 3.00 min (40% A and 60% B), 5.00 min (60% A and 40% B), 6.00 min (95% A and 5% B), 7.01 min (10% A and 90% B) and 9.00 min (stop). The autosampler temperature was set to 4 °C. The mass spectrometer was operated in multiple reaction monitoring mode. The following product ion precursors were monitored: 851.35 [M+Na]+ → 689.25. The atomizing gas flow rate was 3.0 L/min, the drying gas flow rate was 10 L/min, and the heating gas flow rate was 10 L/min.
2.17. Measurement of Trp, 5-HTP, 5-HT in the rat small intestine homogenate with or without MOO in vitro
To prepare the small intestine homogenate, the small intestines were collected from the SD rats mentioned above. Then, the small intestines and the normal saline were thoroughly mixed (1 g:3 mL). After that, MOO (final concentration of 50 or 100 μg/mL) were added to culture in the small intestine homogenate for 6 or 12 h to measure the changes in the levels of Trp, 5-HTP, 5-HT by LC–MS as described in Section 2.2.
2.18. Measurement of Trp, 5-HTP, 5-HT in the rat adrenal pheochromocytoma PC12 cells with or without MOO in vitro
The MOO solution of 40 mg/mL was prepared in DMSO (Sigma, USA) and stored at 4 °C. When adding in cells, the MOO solution was diluted 400 times and 800 times to form working solutions of 100 μg/mL and 50 μg/mL by using serum-free DMEM/F12 medium, which are prepared and used now.
Rat adrenal pheochromocytoma PC12 cells (Institute of Basic Medical Sciences, Chinese Academy of Medical Science, Beijing, China) in logarithmic growth phase were removed, the culture medium was discarded, and cells were digested with 0.25% Trypsin containing EDTA (Beijing Quanshijin Gene Co., Ltd., China) to prepare the cell suspension. After the cell density was adjusted to 30,000 cells/mL with DMEM/F12 medium (containing 10% FBS, 1% double antibody, Gibco, USA), the cell suspension was inoculated to 6-well plate (2 mL/well) and the number of cells per well was about 60,000. The plate was placed at 37 °C, and cultured in a 5% CO2 cell incubator for 24 h. After 24 h, the cell culture medium was discarded, the cells were washed once with PBS solution, and replaced with working solutions containing different concentrations of drugs to continue incubation for 6 and 12 h, respectively. The levels of 5-HTP and 5-HT were measured by the methods described in Section 2.2.
2.19. Statistical analysis
Two-way ANOVA and Student's t-test were performed by GraphPad Prism version 5 (GraphPad Software, CA, USA). Data are expressed as the mean ± standard deviation (SD), and a P value of less than 0.05 was used to indicate statistical significance.
3. Results
3.1. MOO increased 5-HTP levels and reduced 5-HT levels in the gut microbiota in vitro
First, we reproduced the relative pharmacokinetic results of MOO and verified that the blood exposure of MOO was very low after oral administration (Supporting Information Fig. S1). Neurotransmitters such as 5-HT, dopamine34 and NO35 are closely related to depression, thus we used the HPLC–MS/MS method to determine the levels of 5-HT and dopamine, and the NO assay kit (nitrate reductase method) to test the levels of NO. After incubating MOO with the gut microbiota of the SD rats for 6 h, MOO at 50 μg/mL significantly reduced the 5-HT levels in the gut microbiota cultures by 11.3% (P < 0.05); after 12 h incubation, MOO at 10 or 50 μg/mL decreased 5-HT by −21.1% (P < 0.01) or −33.5% (P < 0.05) respectively (Fig. 1B). The results demonstrate a dose- and time-dependent manner of MOO in its action on 5-HT. In contrast, MOO did not change the production of dopamine in the gut microbiota after 12 and 24 h co-incubation (Supporting Information Fig. S2A). In addition, MOO had no significant effect on the nitric oxide (NO) levels in the gut microbiota (Supporting Information Table S1). These results suggest that MOO exerted an anti-depressant effect by regulating the synthesis of 5-HT in the gut microbiota.
Next, to further examine the effect of MOO on 5-HT synthesis, we established a method for the determination of the tryptophan (Trp, a 5-HTP precursor), 5-hydroxytryptophan (5-HTP, a 5-HT precursor) and 5-HT levels in the gut microbiota cultures (Fig. S2B and S2C). MOO significantly up-regulated the 5-HTP (Fig. 1C) but down-regulated the biosynthesis of 5-HT (Fig. 1D) in vitro at 12 h in a dose-dependent manner. The results further suggest that the molecular mechanism of MOO involves the regulation of the Trp → 5-HTP → 5-HT metabolic pathway in the gut microbiota.
To investigate whether MOO could affect the metabolic pathway of Trp → 5-HTP → 5-HT in the peripheral systems, MOO (50 or 100 μg/mL) were incubated with the rat small intestine homogenate or the rat adrenal pheochromocytoma PC12 cells, and the levels of 5-HTP, 5-HT were measured after 6 and 12 h incubation. As shown in Supporting Information Fig. S3, MOO at 50 or 100 μg/mL significantly increased the 5-HTP levels (Fig. S3A and S3C) and reduced the levels of 5-HT (Fig. S3B and S3D) after 6- or 12-h incubation (P < 0.05, P < 0.01, and P < 0.001). These results demonstrate that MOO can affect the metabolic pathway of Trp → 5-HTP → 5-HT in the peripheral systems if it enters the circulatory system to interact with the peripheral systems. However, MOO had poor absorption in oral administration after interacting with the gut microbiota. Thus, MOO's concentration in blood or brain could be very low, which prevented it from interacting with other systems in the body, including the peripheral systems.
3.2. MOO improved depressive behaviors and increased brain 5-HTP and 5-HT levels in chronic unpredictable mild stress (CUMS) rats and depression mice induced by reserpine
To evaluate whether MOO treatment could improve depressive behaviors and the crucial role of the gut microbiota for this effect, we established a chronic unpredictable mild stress (CUMS) model (commonly used to assess depression) with SD rats. The sucrose preference test (SPT) was used to assess pleasure-seeking behavior, which is decreased in model rats with depression36. We found that the sucrose preference of CUMS model rats was significantly lower than that of untreated rats (Untreated vs. CUMS model: 73.8% vs. 45.8%, P < 0.001, Fig. 2A), indicating that the CUMS model had been successfully established. PGF model rats were created by oral administration of antibiotics based on previously described methods28 before MOO treatment. After 2 weeks of MOO treatment, the sucrose preference of the MOO-Low (L) and MOO-High (H) groups were significantly increased as compared to that of the CUMS group (Fig. 2B). Moreover, the sucrose preference of the PGF-MOO-H group was significantly lower than that of the MOO-H groups (P < 0.05). In addition, we established the ICR mouse depression model induced by reserpine to confirm the efficacy of MOO on the antidepressant behavior. We found that both in the forced swim test (Fig. 2C) and the tail suspension test (Fig. 2D), the immobility time of the model group significantly increased compared with the untreated group (P < 0.001). However, the immobility time was significantly reduced after 10 days of oral administration of MOO or PSA (P < 0.05, P < 0.01, and P < 0.001). Meanwhile, the immobility behavior of the PGF-MOO-H group was similar to that of the model group after 10 days of oral administration of MOO, and the immobility time did not decrease significantly. This suggests that the gut microbiota is an important factor in MOO-mediated amelioration of depressive behaviors.
Figure 2.

MOO treatment improves depressive behaviors and changes 5-HTP and 5-HT levels in the faeces, blood, and brain of the CUMS rats and the reserpine-induced mice. (A) SPT results after 8 weeks of CUMS modeling. ∗∗∗P < 0.001. Untreated: n = 10, CUMS: n = 40. (B) SPT results after 2 weeks of treatment with MOO (50 or 100 mg/kg). All groups were exposed to CUMS modeling for 8 weeks prior to the 2 weeks of MOO treatment. (C) The immobility time of the forced swim test in each group (n = 10). (D) The immobility time of the tail-suspension test in mice of each group (n = 10). (E) The levels of 5-HTP in the faeces of rats in each group were determined by LC–MS/MS. (F) The levels of 5-HT in the faeces of rats in each group were determined by LC–MS/MS. (G) The levels of 5-HTP in the plasma of rats in each group were determined by LC–MS/MS. (H) The levels of 5-HT in the plasma of rats in each group were determined by LC–MS/MS. (I) The levels of 5-HTP in the brains of rats in each group were determined by LC–MS/MS. (J) The levels of 5-HT in the brains of rats in each group were determined by LC–MS/MS. ∗∗∗P < 0.001, ∗∗P < 0.01, ∗P < 0.05; n = 10. (E)–(J): Data are shown as mean ± SD.
Next, we investigated whether the 5-HTP levels in the faeces was associated with the brain 5-HTP in MOO-treated CUMS rats. After 2 weeks of MOO treatment, the 5-HTP levels were higher and the 5-HT levels were lower in the faeces of the MOO-treated CUMS rats, as compared to the CUMS group (Fig. 2E, F, and Supporting Information Fig. S4). In addition, the 5-HT was lower in the faeces in PGF-MOO-H group compared to the MOO-H groups, suggesting that MOO might increase the synthesis of 5-HTP in the gut microbiota. Notably, the differences in 5-HTP and 5-HT levels followed the same trends in the blood (Fig. 2G and H): 5-HTP levels increased, and 5-HT decreased in the MOO-treated CUMS rats as compared with the CUMS group. The 5-HTP levels were also lower in PGF-MOO-H group as compared with the MOO-H groups. In accordance with the observation that 5-HTP, but not 5-HT, can cross the blood–brain barrier37, the 5-HTP levels in the brain increased (Fig. 2I and J), which subsequently caused an increase of 5-HT in the brain in MOO-treated CUMS rats, because a large amount of 5-HTP decarboxylase (5-HTPDC), which converts 5-HTP to 5-HT, located in the brain.
Moreover, to further prove the above results, we re-established the PGF model of ICR mice (Supporting Information Fig. S5) and the ICR mouse depression model induced by reserpine (Supporting Information Fig. S6). Similarly, the 5-HTP level was higher and the 5-HT level was lower in the faeces of the MOO-treated mice, as compared to the model group (P < 0.05, P < 0.01, and P < 0.001, Fig. S6A and S6D). Then the 5-HTP of the MOO-treated mice significantly increased in the blood (P < 0.05, P < 0.01, and P < 0.001, Fig. S6B and S6E). Since 5-HT but 5-HTP in the blood cannot cross the blood–brain barrier to enter the brain, the increased 5-HTP in the blood may have entered the brain and further promoted the production of 5-HT to exert an anti-depressant effect (P < 0.05, P < 0.01, and P < 0.001, Fig. S6C and S6F). These results indicate that MOO increased the 5-HT levels in the brain and is an important factor for the improvement of brain function and depressive behaviors.
3.3. Increased TPH levels and decreased 5-HTPDC activity might cause the increase of 5-HTP by MOO in the gut microbiota
To clarify how MOO increased the levels of 5-HTP in the gut microbiota, we further investigated two important enzymes, TPH and 5-HTPDC, in the 5-HT synthesis pathway38,39 (Supporting Information Scheme S1). MOO (50 or 100 μg/mL) was added into the rat gut microbiota culture system in vitro, and para-chlorophenylalanine (PCPA; 100 μmol/L), an inhibitor of TPH, or benserazide (100 μmol/L), an inhibitor of 5-HTPDC, was added. After 6 and 12 h of incubation, MOO (50 or 100 μg/mL) significantly increased the 5-HTP/Trp ratio (P < 0.01, P < 0.001; Fig. 3A), while significantly reducing the ratio of 5-HT/5-HTP (P < 0.01, P < 0.001; Fig. 3B) with time and dose. However, after adding PCPA into the system, the ratio of 5-HTP/Trp decreased significantly (P < 0.001, Fig. 3A). Similarly, after adding benserazide (100 μmol/L) into the system, the ratio of 5-HT/5-HTP also decreased significantly (P < 0.01, P < 0.001; Fig. 3B).
Figure 3.

MOO changes TPH, BH4, VB6 levels and 5-HTPDC activity in vitro. (A) The ratio of 5-HTP/Trp in the gut microbiota cultures while culturing with MOO (50 or 100 μg/mL with or without PCPA at 100 μmol/L) at 6 and 12 h in vitro were determined by LC–MS/MS. ∗∗P < 0.01, ∗∗∗P < 0.001; n = 6. (B) The ratio of 5-HT/5-HTP in the gut microbiota cultures while culturing with MOO (50 or 100 μg/mL with or without benserazide at 100 μmol/L) at 6 and 12 h in vitro were determined by LC–MS/MS. ∗∗P < 0.01, ∗∗∗P < 0.001; n = 6. (C) The levels of TPH in the gut microbiota cultures while culturing with or without MOO (100 μg/mL with or without PCPA at 100 μmol/L) at 12 h in vitro were determined by ELISA. ∗∗∗P < 0.001; n = 10. (D) The activity of 5-HTPDC in the gut microbiota cultures while culturing with or without MOO (100 μg/mL with or without benserazide at 100 μmol/L) at 12 h in vitro were determined by ELISA. ∗∗P < 0.01, ∗P < 0.05; n = 10. (E) The BH4 levels in the gut microbiota cultures while culturing with or without MOO (50 or 100 μg/mL) at 12 h in vitro were determined by ELISA. ∗∗∗P < 0.001; n = 5. (F) The VB6 levels in the gut microbiota cultures while culturing with or without MOO (50 or 100 μg/mL) at 12 h in vitro were determined by ELISA. ∗P < 0.05; n = 5. (G) The levels of TPH in the brain homogenate cultures while culturing with or without MOO (50 or 100 μg/mL) at 4 and 6 h in vitro were determined by ELISA. ∗∗P < 0.01, ∗P < 0.05; n = 6. (H) The levels of BH4 in the brain homogenate cultures while culturing with or without MOO (50 or 100 μg/mL) at 4 and 6 h in vitro were determined by ELISA. ∗∗P < 0.01, ∗P < 0.05; n = 6. (I) The activity of 5-HTPDC in the brain homogenate cultures while culturing with or without MOO (50 or 100 μg/mL) at 4 and 6 h in vitro were determined by ELISA. ∗∗P < 0.01; n = 6. (J) The levels of VB6 in the brain homogenate cultures while culturing with or without MOO (50 or 100 μg/mL) at 4 and 6 h in vitro were determined by ELISA. ∗∗P < 0.01; n = 6. (E)–(H): Data are shown as mean ± SD.
To further verify that TPH and 5-HTPDC were involved in the effect of MOO on 5-HTP and 5-HT production in the gut microbiota, the levels of TPH and activity of 5-HTPDC were measured in this system. The results show that as compared with TPH levels in untreated culture, MOO treatment (100 μg/mL) increased TPH levels by 69% (P < 0.001), while PCPA treatment (100 μmol/L) reduced TPH levels by 81% with respect to that in MOO-treated culture (P < 0.001, Fig. 3C), suggesting that MOO might be an agonist of TPH. Meanwhile, the activity of 5-HTPDC in gut microbiota was significantly inhibited by MOO (100 μg/mL) in 30% (P < 0.01), and benserazide treatment (100 μmol/L) further promoted the MOO-mediated inhibition of 5-HTPDC activity (P < 0.05, Fig. 3D). In addition, we re-established the ICR mice model of depression induced by reserpine to further prove the above results (Supporting Information Fig. S7). The activity of 5-HTPDC in the faeces of model group significantly increased compared with the untreated group while the activity of 5-HTPDC significantly decreased after 10 days of oral administration of MOO or PSA, and the activity of 5-HTPDC in the PGF-MOO-H group was higher than the MOO-H group (P < 0.05, P < 0.01, and P < 0.001, Fig. S7A). Meanwhile, the activity of TPH in mice faeces showed the opposite result (P < 0.05, P < 0.01, and P < 0.001, Fig. S7D). However, the activity of TPH and 5-HTPDC showed no significance in plasma (Fig. S7B and S7E) and brain (Fig. S7C and S7F). These results indicate that MOO increased the activity of TPH and decreased the activity of 5-HTPDC in the gut microbiota. Based on our previous research, MOO is difficult to absorb after oral administration, and the content in blood is close to zero. The decreased 5-HTPDC activity didn't exist in plasma or brain because of no MOO level both in plasma and brain.
To further evaluate the role of TPH and 5-HTPDC in the mode of action of MOO, the levels of tetrahydrobiopterin (BH4) and vitamin B6 (VB6), coenzymes of TPH and 5-HTPDC, respectively38, were also measured by enzyme linked immunosorbent assay (ELISA). The BH4 levels were significantly increased by MOO treatment in a dose-dependent manner (P < 0.001, Fig. 3E), consistent with the finding that BH4 might be an important factor for TPH levels enhancement38. Meanwhile, MOO reduced the VB6 levels in the gut microbiota (P < 0.05, Fig. 3F), thereby suggesting that MOO might inhibit the activity of 5-HTPDC and increase the 5-HTP levels40.
Then, we evaluate whether, or not, MOO could also influence TPH and 5-HTPDC in the brain. MOO (50 or 100 μg/mL) were incubated with the brain homogenate in culture, and the levels of TPH, BH4 and VB6, as well as the activity of 5-HTPDC, were measured after 4 and 6 h incubation. The results show that MOO also increased the levels of TPH (P < 0.05, P < 0.01; Fig. 3G) and BH4 (P < 0.05, P < 0.01; Fig. 3H) and decreased the activity of 5-HTPDC (P < 0.01, Fig. 3I) and the levels of VB6 (P < 0.01, Fig. 3J) in the brain homogenate in vitro, confirming that MOO could also activate the metabolic pathway of Trp → 5-HTP → 5-HT in the brain, with a mode of action similar to that in gut microbiota in terms of its effect on the key enzymes TPH and 5-HTPDC. As MOO is difficult to be absorbed into the blood, the mechanism underlying the increase of 5-HT in the brain by MOO might be mainly associated with the activation of TPH and inhibition of 5-HTPDC in the gut microbiota, not in plasm or brain. As 5-HTP was able to cross the blood–brain barrier (but not 5-HT), the MOO caused synthesis of 5-HTP in the gut microbiota provided a new supply to synthesize 5-HT in brain.
3.4. Pentasaccharides (PSA), an active component in MOO, have an anti-depressant effect
At present, the reported antidepressant activity of MOO was associated with the mixture of oligosaccharides, ranging from trisaccharides to nonasaccharides41. To further investigate the anti-depressant effects of the oligosaccharides components in MOO, the levels of TPH and the activity of 5-HTPDC were measured in the in vitro gut microbiota culture system, in the presence or absence of each oligosaccharide components ranging from trisaccharides to nonasaccharides (Fig. 1A). The PSA significantly increased the levels of TPH by 120% (P < 0.05, Fig. 4A) and decreased the activity of 5-HTPDC by 22% (P < 0.05, Fig. 4B). However, trisaccharides, tetrasaccharides, hexasaccharides, heptasaccharides, octasaccharides, and nonasaccharides did not significantly change the levels of TPH and the activity of 5-HTPDC. Then, PSA content in MOO were determined with high-performance liquid chromatography (HPLC), showing a range from 12.96 ± 0.23 to 14.32 ± 0.22 (%, w/w), indicating that PSA was one of the main active components of MOO (Supporting Information Table S2).
Figure 4.

Screening of antidepressant effects of MOO ranging from trisaccharides to nonasaccharides in vitro and enzyme function verification of TPH and 5-HTPDC derived from gut microbiota. (A) Comparison of the effect of MOO ranging from trisaccharides to nonasaccharides on TPH levels were determined by ELISA. (B) Comparison of the effect of MOO ranging from trisaccharides to nonasaccharides on 5-HTPDC activity was determined were determined by ELISA. (C) Molecular docking of PSA with TPH. (D) Molecular docking of PSA with 5-HTPDC. (E) The rate of promoting 5-HTP under the enzymatic reaction system of TPH in 1 h in vitro. (F) The promotion of 5-HTP with Trp (500 μmol/L) or Trp (500 μmol/L)+PCPA (100 μmol/L) under the enzymatic reaction system of TPH in vitro. (G) The rate of promoting 5-HT under the enzymatic reaction system of 5-HTPDC in 1 h in vitro. (H) The promotion of 5-HT with 5-HTP (500 μmol/L) or HTP (500 μmol/L)+benserazide (100 μmol/L) under the enzymatic reaction system of TPH in vitro. ∗∗∗P < 0.001, ∗P < 0.05, n = 6. (E)–(H): Data represent as mean ± SD.
Next, we used molecular docking simulations to examine whether PSA can interact with the two 5-HT synthesis enzymes. PSA could stably bind TPH (PDB: 3HF6, Fig. 4C) and 5-HTPDC (PDB: 4OBV, Fig. 4D) with binding free energies of −59.6987 kJ/mol (Supporting Information Fig. S8A) and −67.6403 kJ/mol (Fig. S8B), respectively.
In addition, we obtained TPH and 5-HTPDC from stains in the gut microbiota and their activity was verified through enzymatic reaction. Within 1 h, as the concentration of Trp (the substrate of TPH) increased, the rate of 5-HTP production was also increasing, and approached the highest when Trp was 1000 μmol/L (Fig. 4E). When Trp was 500 μmol/L, with the increase of the reaction time, the cumulative production of 5-HTP also increased, and reached the highest at 60 min. However, after adding PCPA (an inhibitor of TPH) to the reaction system, the cumulative production of 5-HTP decreased significantly (P < 0.001, Fig. 4F). In addition, the activity of 5-HTPDC has also been verified. Within 1 h, as the concentration of 5-HTP (the substrate of 5-HTPDC) increased, the rate of 5-HT production was also increasing, and approached the highest when 5-HTP was 1000 μmol/L (Fig. 4G). When 5-HTP was 500 μmol/L, with the increase of the reaction time, the cumulative amount of 5-HT also increased, and reached the highest at 60 min. However, after adding benserazide (an inhibitor of 5-HTPDC) to the reaction system, the cumulative production of 5-HT decreased significantly (P < 0.001, Fig. 4H).
To further confirm whether PSA could be the main active ingredient of MOO as an antidepressant, we simultaneously compared the inhibitory effects of MOO and PSA on 5-HT synthesis by measuring the 5-HT levels in the gut microbiota in SD rats. MOO and PSA at different concentrations (100, 200, and 400 μg/mL) were incubated with the gut microbiota cultures from SD rats. Either MOO or PSA treatment significantly increased the 5-HTP (Fig. 5A and B) and reduced the 5-HT levels (Fig. 5C and D), respectively. Additionally, MOO (200 and 400 μg/mL) or PSA (100, 200 and 400 μg/mL) significantly increased TPH levels (P < 0.05, Fig. 5E and F) and decreased 5-HTPDC activity (P < 0.05, P < 0.01; Fig. 5G and H) dose-dependently. Interestingly, the BH4 levels were significantly increased (Fig. 5I) and the VB6 levels were slightly decreased (Fig. 5J) by PSA treatment in the gut microbiota, respectively.
Figure 5.

PSA showed the similar effect compared with MOO in the gut microbiota in vitro. (A) The levels of 5-HTP in the gut microbiota cultures in vitro after incubation with PSA (100, 200 or 400 μg/mL) for 6 and 12 h were determined by LC–MS/MS. (B) The levels of 5-HTP in the gut microbiota cultures in vitro after incubation with MOO (100, 200 or 400 μg/mL) for 6 and 12 h were determined by LC–MS/MS. (C) The levels of 5-HT in the gut microbiota cultures in vitro after incubation with PSA (100, 200 or 400 μg/mL) for 6 and 12 h were determined by LC–MS/MS. (D) The levels of 5-HT in the gut microbiota cultures in vitro after incubation with MOO (100, 200 or 400 μg/mL) for 6 and 12 h were determined by LC–MS/MS. (E) The levels of TPH in the gut microbiota cultures in vitro after incubation with PSA (100, 200 or 400 μg/mL) for 12 h was determined by ELISA. (F) The levels of TPH in the gut microbiota cultures in vitro after incubation with MOO (100, 200 or 400 μg/mL) for 12 h was determined by ELISA. (G) The activity of 5-HTPDC in the gut microbiota cultures in vitro after incubation with PSA (100, 200 or 400 μg/mL) for 12 h were determined by ELISA. (H) The activity of 5-HTPDC in the gut microbiota cultures in vitro after incubation with MOO (100, 200 or 400 μg/mL) for 12 h were determined by ELISA. (I) The levels of BH4 in the gut microbiota cultures while culturing with or without PSA (50 or 100 μg/mL) at 12 h in vitro were determined by ELISA. (J) The levels of VB6 in the gut microbiota cultures while culturing with or without PSA (50 or 100 μg/mL) at 12 h in vitro were determined by ELISA. ∗∗P < 0.01, ∗P < 0.05, n = 6. (E)–(H): Data are shown as mean ± SD.
Similarly, to evaluate whether PSA was able to influence TPH and 5-HTPDC in the brain, PSA (50 or 100 μg/mL) were incubated with the brain homogenate cultures, and the levels of TPH, BH4 and VB6 and the activity of 5-HTPDC, were measured after 4 and 6 h incubation. The results show that PSA increased the levels of TPH and BH4 and reduced the activity of 5-HTPDC and the levels of VB6 in the brain homogenate in vitro, agreeing with the effect of MOO (Supporting Information Fig. S9). These results suggest that PSA may be the major anti-depressant components in MOO.
3.5. MOO regulated particular strains of the gut microbiota in treating depression
To investigate which bacteria might be involved in the anti-depression mechanisms of MOO, the faecal samples of rats in all of the above groups were analyzed by 16S rRNA sequencing (Fig. 6A). As compared with the CUMS group, relative abundance of 5 genera (Atopostipes, Facklamia, Prevotellaceae_UCG−001, Jeotgalicoccus, and Prevotella_9) were increased and relative abundance of 12 genera (Olivella, Sporosarcina, Lachnospiraceae_UCG−005, Erysipelotrichaceae UCG−003, Paenalcaligenes, Clostridium_sensu_stricto_1, Turicibacter, Marvinbryantia, Ruminiclostridium_9, Blautia, Bacteroides and Parabaceteroides) were decreased in the untreated group (Supporting Information Table S3). However, the abundance of the above-mentioned genera in the MOO groups (50 and 100 mg/kg) returned to their normal abundance after two weeks on treatment. Among the genera whose abundances were altered by MOO, Clostridium_sensu_stricto_1, Turicibacter, Blautia, Prevotella_9, and Lachnospiraceae UCG−005 have been reported to be associated with depression42, 43, 44. The abundance of these bacteria was significantly reduced in the MOO treatment group, in comparison with the CUMS group. Meanwhile, Prevotellaceae_UCG−001 and Prevotella_9 belong to Prevotellaceae, which was widely known as a probiotic for superior SCFA production capacity.
Figure 6.

Possible association between MOO and particular strains of the gut microbiota in depression. (A) The heat map (n = 6 in each group) shows the top 50 bacterial genera with the most substantial differences in abundance among the treatment groups. The color of each box corresponds to the normalized and log-transformed relative abundance of the genus (as shown below the heat map). The genera presented in red font (to the right of the heat map) are related to depression and were increased in abundance by MOO treatment. The bacteria presented in blue font are related to depression and were decreased in abundance by MOO treatment. (B) Determination of 5-HTP levels in 10 standard strains of bacteria after incubation with MOO (100 μg/mL) for 12 h. (C) Determination of 5-HT levels in 10 standard strains of bacteria after incubation with MOO (100 μg/mL) for 12 h were determined by LC–MS/MS. (B) and (C): ∗P < 0.05, n = 6.
Based on these, 10 strains of probiotics that are widely existed in the gut microbiota of rat and human (B. longum, B. breve, L. casei, L. acidophilus, Clostridium butyricum, L. reuteri, L. lactis, L. plantarum and S. thermophilus, E. faecalis) were individually incubated with MOO for 12 h in vitro. The results show that these strains can produce 5-HTP and 5-HT. With MOO treatment, C. butyricum significantly increased the 5-HTP (P < 0.05, Fig. 6B) and decreased the 5-HT (P < 0.05, Fig. 6C), suggesting that it is an important strain in the increase of 5-HTP levels and decrease of 5-HT levels by MOO. Interestingly, C. butyricum, a kind of probiotic, could also produce butyric acid and acetic acid. According to reports, C. butyricum could attenuates chronic unpredictable mild stress-induced depressive-like behavior in mice45. The above results indicate that the anti-depressant effect of MOO seen in CUMS rats may be due to a change in the composition of the gut microbiota, specifically a decrease in the abundance of bacteria associated with depression, as their abundance was altered upon MOO treatment. Moreover, at least C. butyricum might be the important bacteria involved in the increase of 5-HTP levels and decrease of 5-HT levels in the gut microbiota, after oral administration of MOO.
4. Discussion
Although MOO is poorly absorbed into the bloodstream after their oral administration, they have been used as a safe and effective form of TCM for depression treatment in clinic. For many years the molecular mechanism of MOO effect has been a puzzle. This study showed for the first time that MOO regulated the 5-HT synthesis pathway (Trp → 5-HTP → 5-HT) in the gut microbiota, in which MOO increased TPH levels and decreased 5-HTPDC activity in the gut microbiota. Moreover, PSA were found to be the main active component underlying the effect of MOO against depression. Animal experiments further demonstrated that MOO might exert anti-depressant effects through the gut microbiota. The 16S rRNA gene sequencing showed that the oral administration of MOO significantly altered the gut microbiota structure in SD rats, of which the abundance of depression related bacterial strains decreased. Of the bacterial strains tested, C. butyricum appeared to be important for the action of MOO, as MOO induced increase of 5-HTP and decrease of 5-HT were observed in the two strains.
TCM has long been derived from natural products with various structural types (such as alkaloids, flavonoids, saponins, polysaccharides, etc.), which generally have the characteristics of reliable curative effect while low oral bioavailability, such as berberine46, paeoniflorin, etc. Studies have shown that whether rats47, 48, beagle dogs49, or healthy volunteers50, the oral bioavailability of berberine after oral administration (or gavage) was about 1%. The concentration of berberine in blood was low, and the Cmax was about 0.3–40 ng/mL in different species without significant accumulation46, 47, 48, 49, 50. Similarly, the oral bioavailability of paeoniflorin was only 5.4%51, and it couldn't cross the blood–brain barrier. However, they have produced significant drug effects in different diseases. Meanwhile, the gut microbiota was rich in metabolic enzymes, which might explain their unique role in the metabolism of such drugs52.
There have been many reports on the interaction between the gut microbiota and the brain53, 54, 55, 56: On the one hand, physiological and psychological stress factors may affect the composition and metabolic activity of the gut microbiota; on the other hand, the gut microbiota can also affect brain function through neural and humoral mechanisms57, which may be the chemical basis of the “gut–brain” axis. Our previous studies have found that berberine was beneficial to stimulate gut microbiota to produce active metabolites, such as SCFA, etc., thereby exerting a lipid-lowering effect28. Moreover, berberine can produce dihydroberberine by nitroreductase (NR) in the gut microbiota of Parkinson's disease model mice. This process provided hydrogen free radicals and promoted the production of dihydrobiopterin to tetrahydrobiopterin. Because tetrahydrobiopterin could enhance the activity of tyrosine hydroxylase, thereby accelerating the production of levodopa by the gut microbiota. The levodopa produced by the gut microbiota entered the brain through the circulatory system and was converted into dopamine, which improved the main pathological manifestations of dopamine deficiency in Parkinson's disease26. These studies demonstrate the new pharmaceutical concept that TCM acts through the gut microbiota without entering the blood circulation.
Natural carbohydrate drugs, especially polysaccharide and oligosaccharide drugs derived from TCM, have always been the most potential treasure of carbohydrate drugs. Several carbohydrate drugs have been successfully used in clinical practice for many years, such as low molecular weight heparin, alginic acid, and hyaluronic acid58, 59, 60. In addition, many natural carbohydrate drugs are now in the stage of drug development and research. For instance, polysaccharides from Lycium barbarum and Agaricus blazei Murrill were at the critical stage of studying their anti-tumor, antioxidant, and immunomodulatory activities61,62. However, the development of most natural polysacch-arides has encountered a “bottleneck” problem in mechanism exploration and other aspects, which hindered their wide application. This study is the first to clearly provide a new understanding of the biological activity of oligosaccharides and their in vivo mechanism of action through the interaction of gut microbiota, indicating that the exploration of saccharides has entered a new era.
5. Conclusions
In summary, MOO exert the anti-depressant effect by regulating 5-HT synthesis in the gut microbiota. MOO firstly increased the levels of TPH, thereby promoting the conversion of Trp to 5-HTP; secondly, MOO decreased the activity of 5-HTPDC in the gut microbiota, resulting in the inhibition of the translation of 5-HTP to 5-HT. As a result, the synthesis of 5-HTP was increased and the metabolism of 5-HT was decreased in the gut microbiota, which significantly increased the amount of 5-HTP absorbed into the blood. Since 5-HT but 5-HTP in the blood cannot cross the blood–brain barrier to enter the brain37,63, the increased 5-HTP in the blood may enter the brain and further promoted the production of 5-HT to exert the anti-depressant effect.
Acknowledgments
This project was supported by Key Project of Beijing Natural Science Foundation (No. 7181007, China), the CAMS Innovation Fund for Medical Sciences (CIFMS; Nos. 2016-I2M-3-011, 2021-1-I2M-007, 2021-I2M-1-027, and 2021-I2M-1-028, China), National Natural Science Foundation of China (Nos. 81973290 and 82173888), and Beijing Key Laboratory of Non-Clinical Drug Metabolism and PK/PD study (Z141102004414062, China). We would like to thank Shimadzu (China) Co., Ltd. for technological support.
Footnotes
Peer review under responsibility of Chinese Pharmaceutical Association and Institute of Materia Medica, Chinese Academy of Medical Sciences.
Supporting data to this article can be found online at https://doi.org/10.1016/j.apsb.2022.02.032.
Contributor Information
Song Li, Email: lis.lisong@gmail.com.
Yan Wang, Email: wangyan@imm.ac.cn.
Jian-Dong Jiang, Email: jiang.jdong@163.com.
Wu Zhong, Email: zhongwu@bmi.ac.cn.
Author contributions
Wu Zhong, Yan Wang, Jian-Dong Jiang, and Song Li: conceptualization and methodology. Zheng-Wei Zhang, Yan Wang, and Wu Zhong: writing-original draft preparation, writing-reviewing and editing. Chun-Sheng Gao, Heng Zhang, Yu-Hui Dong, Hai-Bin Luo, Xin-Bo Zhou, and Yu-Li Wang: resources. Chun-Sheng Gao, and Heng Zhang: investigation. Zheng-Wei Zhang, Li-Bin Pan, Hang Yu, Zhen-Xiong Zhao, Chi-Yu He, Jie Fu, and Pei Han: validation. Zheng-Wei Zhang and Yan Wang: formal analysis. Gang Wang, Jian Yang, and Ya-Ping Wang: supervision.
Conflicts of interest
The authors declare no conflicts of interest.
Appendix A. Supplementary data
The following is the Supplementary data to this article:
References
- 1.James S.L., Abate D., Abate K.H., Abay S.M., Abbafati C., Abbasi N., et al. Global, regional, and national incidence, prevalence, and years lived with disability for 354 diseases and injuries for 195 countries and territories, 1990–2017: a systematic analysis for the Global Burden of Disease Study 2017. Lancet. 2018;392:1789–1858. doi: 10.1016/S0140-6736(18)32279-7. [DOI] [PMC free article] [PubMed] [Google Scholar]
- 2.van Donkelaar E.L., Blokland A., Ferrington L., Kelly P.A.T., Steinbusch H.W.M., Prickaerts J. Mechanism of acute tryptophan depletion: is it only serotonin?. Mol Psychiatry. 2011;16:695–713. doi: 10.1038/mp.2011.9. [DOI] [PubMed] [Google Scholar]
- 3.Jans L.A.W., Riedel W.J., Markus C.R., Blokland A. Serotonergic vulnerability and depression: assumptions, experimental evidence and implications. Mol Psychiatry. 2007;12:522–543. doi: 10.1038/sj.mp.4001920. [DOI] [PubMed] [Google Scholar]
- 4.Collins S.L., Patterson A.D. The gut microbiome: an orchestrator of xenobiotic metabolism. Acta Pharm Sin B. 2020;10:19–32. doi: 10.1016/j.apsb.2019.12.001. [DOI] [PMC free article] [PubMed] [Google Scholar]
- 5.Yang X., Yu D., Xue L., Li H., Du J. Probiotics modulate the microbiota–gut–brain axis and improve memory deficits in aged SAMP8 mice. Acta Pharm Sin B. 2020;10:475–487. doi: 10.1016/j.apsb.2019.07.001. [DOI] [PMC free article] [PubMed] [Google Scholar]
- 6.Sampson T.R., Debelius J.W., Thron T., Janssen S., Shastri G.G., Ilhan Z.E., et al. Gut microbiota regulate motor deficits and neuroinflammation in a model of Parkinson's disease. Cell. 2016;167 doi: 10.1016/j.cell.2016.11.018. 1469–80.e12. [DOI] [PMC free article] [PubMed] [Google Scholar]
- 7.Cryan J.F., O'Riordan K.J., Cowan C.S.M., Sandhu K.V., Bastiaanssen T.F.S., Boehme M., et al. The microbiota–gut–brain axis. Physiol Rev. 2019;99:1877–2013. doi: 10.1152/physrev.00018.2018. [DOI] [PubMed] [Google Scholar]
- 8.Vuong H.E., Yano J.M., Fung T.C., Hsiao E.Y. The microbiome and host behavior. Annu Rev Neurosci. 2017;40:21–49. doi: 10.1146/annurev-neuro-072116-031347. [DOI] [PMC free article] [PubMed] [Google Scholar]
- 9.Yano J.M., Yu K., Donaldson G.P., Shastri G.G., Ann P., Ma L., et al. Indigenous bacteria from the gut microbiota regulate host serotonin biosynthesis. Cell. 2015;161:264–276. doi: 10.1016/j.cell.2015.02.047. [DOI] [PMC free article] [PubMed] [Google Scholar]
- 10.Zhang J., Xin H., Xu Y., Shen Y., He Y.Q., Hsien-Yeh, et al. Morinda officinalis How.—a comprehensive review of traditional uses, phytochemistry and pharmacology. J Ethnopharmacol. 2018;213:230–255. doi: 10.1016/j.jep.2017.10.028. [DOI] [PubMed] [Google Scholar]
- 11.Li Y.F., Yuan L., Xu Y.K., Yang M., Zhao Y.M., Luo Z.P. Antistress effect of oligosaccharides extracted from Morinda officinalis in mice and rats. Acta Pharmacol Sin. 2001;22:1084–1088. [PubMed] [Google Scholar]
- 12.Feng F., Wang L.L., Lai X.P., Li Y.B., Cao Z.M., Zhou Y.J. Study on oligosaccharides from Morinda officinalis. J Chin Med Mater. 2012;35:1259–1262. [PubMed] [Google Scholar]
- 13.Zhang Z.Q., Yuan L., Yang M., Luo Z.P., Zhao Y.M. The effect of Morinda officinalis How, a Chinese traditional medicinal plant, on the DRL 72-s schedule in rats and the forced swimming test in mice. Pharmacol Biochem Behav. 2002;72:39–43. doi: 10.1016/s0091-3057(01)00730-4. [DOI] [PubMed] [Google Scholar]
- 14.Yang X., Chen D., Yang D., Liu T., Hu G.Y., Liang H.L., et al. Effects of oligosaccharides from Morinda officinalis on gut microbiota and metabolome of APP/PS1 transgenic mice. Front Neurol. 2018;9:412. doi: 10.3389/fneur.2018.00412. [DOI] [PMC free article] [PubMed] [Google Scholar]
- 15.Du Y., Zheng Q., Ou Z.H., Cao Y.J., Su X.P., Li C., et al. Efficacy and safety of Morinda officinalis oligosaccharide capsules for depressive disorder: a systematic review and meta-analysis. Braz J Psychiatry. 2021;43:306–313. doi: 10.1590/1516-4446-2020-0945. [DOI] [PMC free article] [PubMed] [Google Scholar]
- 16.Si T.M., Liu Y., Shu L., Sun L.L., Zhang H.Y. Tolerance of bajitian oligosaccharide capsule in Chinese healthy volunteers. Chin J New Drug. 2009;1:53–56. [Google Scholar]
- 17.Wang X., Zhang H., Shu L., Du B., Jiao F., Han Z., et al. Efficacy and safety of Morinda officinalis oligose capsule in the treatment of mild or moderate depression. Chin J New Drug. 2009;18:802–843. [Google Scholar]
- 18.Kong Q., Shu L., Zhang H., Jiao F., Han Z., Wang J., et al. Efficacy and safety of Morinda officinalis oligose capsule in the treatment of depression. Chin J Clin Pharmacol. 2011;27:170–173. [Google Scholar]
- 19.Zou L., Zhang H. Research advance of Morinda officinalis oligosaccharides in treatment of depression. Chin J New Drug. 2012;21:1889–1945. [Google Scholar]
- 20.Zhu J., Peng Q., Xu Y., Xu H., Wan Y., Li Z., et al. Morinda officinalis oligosaccharides ameliorate depressive-like behaviors in poststroke rats through upregulating GLUT3 to improve synaptic activity. FASEB J. 2020;34:13376–13395. doi: 10.1096/fj.201902546RR. [DOI] [PubMed] [Google Scholar]
- 21.Chi L., Chen L., Zhang J., Zhao J., Li S., Zheng Y. Development and application of bio-sample quantification to evaluate stability and pharmacokinetics of inulin-type fructo-oligosaccharides from Morinda officinalis. J Pharm Biomed Anal. 2018;156:125–132. doi: 10.1016/j.jpba.2018.04.028. [DOI] [PubMed] [Google Scholar]
- 22.Shang J.M., Ma S.R., Zang C.X., Bao X.Q., Wang Y., Zhang D. Gut microbiota mediates the absorption of FLZ, a new drug for Parkinson's disease treatment. Acta Pharm Sin B. 2021;11:1213–1226. doi: 10.1016/j.apsb.2021.01.009. [DOI] [PMC free article] [PubMed] [Google Scholar]
- 23.Zhang X.T., Han Y., Huang W., Jin M.J., Gao Z.G. The influence of the gut microbiota on the bioavailability of oral drugs. Acta Pharm Sin B. 2021;11:1789–1812. doi: 10.1016/j.apsb.2020.09.013. [DOI] [PMC free article] [PubMed] [Google Scholar]
- 24.Chi L., Khan I., Lin Z., Zhang J., Lee M.Y.S., Leong W., et al. Fructo-oligosaccharides from Morinda officinalis remodeled gut microbiota and alleviated depression features in a stress rat model. Phytomedicine. 2020;67:153157. doi: 10.1016/j.phymed.2019.153157. [DOI] [PubMed] [Google Scholar]
- 25.Zhao Z.X., Fu J., Ma S.R., Peng R., Yu J.B., Cong L., et al. Gut–brain axis metabolic pathway regulates antidepressant efficacy of albiflorin. Theranostics. 2018;8:5945–5959. doi: 10.7150/thno.28068. [DOI] [PMC free article] [PubMed] [Google Scholar]
- 26.Wang Y., Tong Q., Ma S.R., Zhao Z.X., Pan L.B., Cong L., et al. Oral berberine improves brain dopa/dopamine levels to ameliorate Parkinson's disease by regulating gut microbiota. Signal Transduct Target Ther. 2021;6:77. doi: 10.1038/s41392-020-00456-5. [DOI] [PMC free article] [PubMed] [Google Scholar]
- 27.Wang Y., Tong Q., Shou J.W., Zhao Z.X., Li X.Y., Zhang X.F., et al. Gut microbiota-mediated personalized treatment of hyperlipidemia using berberine. Theranostics. 2017;7:2443–2451. doi: 10.7150/thno.18290. [DOI] [PMC free article] [PubMed] [Google Scholar]
- 28.Feng R., Shou J.W., Zhao Z.X., He C.Y., Ma C., Huang M., et al. Transforming berberine into its intestine-absorbable form by the gut microbiota. Sci Rep. 2015;5:12155. doi: 10.1038/srep12155. [DOI] [PMC free article] [PubMed] [Google Scholar]
- 29.Papp M. Models of affective illness: chronic mild stress in the rat. Curr Protoc Pharmacol. 2012;57:5–9. doi: 10.1002/0471141755.ph0509s57. [DOI] [PubMed] [Google Scholar]
- 30.Park B.K., Kim Y.R., Kim Y.H., Yang C., Seo C.S., Jung I.C., et al. Antidepressant-like effects of Gyejibokryeong-hwan in a mouse model of reserpine-induced depression. Biomed Res Int. 2018;2018:5845491. doi: 10.1155/2018/5845491. [DOI] [PMC free article] [PubMed] [Google Scholar]
- 31.Betari N., Sahlholm K., Morató X., Godoy-Marín H., Jáuregui O., Teigen K., et al. Inhibition of tryptophan hydroxylases and monoamine oxidase-A by the proton pump inhibitor, omeprazole—in vitro and in vivo investigations. Front Pharmacol. 2020;11:593416. doi: 10.3389/fphar.2020.593416. [DOI] [PMC free article] [PubMed] [Google Scholar]
- 32.Williams B.B., Benschoten A.H.V., Cimermancic P., Donia M.S., Zimmermann M., Taketani M., et al. Discovery and characterization of gut microbiota decarboxylases that can produce the neurotransmitter tryptamine. Cell Host Microbe. 2014;16:495–503. doi: 10.1016/j.chom.2014.09.001. [DOI] [PMC free article] [PubMed] [Google Scholar]
- 33.Wang Y., Shou J.W., Li X.Y., Zhao Z.X., Fu J., He C.Y., et al. Berberine-induced bioactive metabolites of the gut microbiota improve energy metabolism. Metabolism. 2017;70:72–84. doi: 10.1016/j.metabol.2017.02.003. [DOI] [PubMed] [Google Scholar]
- 34.Grace A.A. Dysregulation of the dopamine system in the pathophysiology of schizophrenia and depression. Nat Rev Neurosci. 2016;17:524–532. doi: 10.1038/nrn.2016.57. [DOI] [PMC free article] [PubMed] [Google Scholar]
- 35.van Amsterdam J.G.C., Opperhuizen A. Nitric oxide and biopterin in depression and stress. Psychiatry Res. 1999;85:33–38. doi: 10.1016/s0165-1781(98)00140-1. [DOI] [PubMed] [Google Scholar]
- 36.He L., Zeng L., Tian N., Li Y., He T., Tan D., et al. Optimization of food deprivation and sucrose preference test in SD rat model undergoing chronic unpredictable mild stress. Anim Models Exp Med. 2020;3:69–78. doi: 10.1002/ame2.12107. [DOI] [PMC free article] [PubMed] [Google Scholar]
- 37.Nakatani Y., Sato-Suzuki I., Tsujino N., Nakasato A., Seki Y., Fumoto M., et al. Augmented brain 5-HT crosses the blood–brain barrier through the 5-HT transporter in rat: blood–brain barrier and 5-HT. Eur J Neurosci. 2008;27:2466–2472. doi: 10.1111/j.1460-9568.2008.06201.x. [DOI] [PubMed] [Google Scholar]
- 38.Martínez A., Knappskog P.M., Haavik J. A structural approach into human tryptophan hydroxylase and its implications for the regulation of serotonin biosynthesis. Curr Med Chem. 2001;8:1077–1091. doi: 10.2174/0929867013372616. [DOI] [PubMed] [Google Scholar]
- 39.Turner E.H., Loftis J.M., Blackwell A.D. Serotonin a la carte: supplementation with the serotonin precursor 5-hydroxytryptophan. Pharmacol Ther. 2006;109:325–338. doi: 10.1016/j.pharmthera.2005.06.004. [DOI] [PubMed] [Google Scholar]
- 40.Allen G.F.G., Neergheen V., Oppenheim M., Fitzgerald J.C., Footitt E., Hyland K., et al. Pyridoxal 5′-phosphate deficiency causes a loss of aromatic l-amino acid decarboxylase in patients and human neuroblastoma cells, implications for aromatic l-amino acid decarboxylase and vitamin B6 deficiency states. J Neurochem. 2010;114:87–96. doi: 10.1111/j.1471-4159.2010.06742.x. [DOI] [PubMed] [Google Scholar]
- 41.Cui C.B., Yang M., Yao Z.W., Cao B., Luo Z.P., Xu Y.K., et al. Studies on the antidepressant active constituents in the roots of Morinda officinalis How. China J Chin Mater Med. 1995;20:62–63. [PubMed] [Google Scholar]
- 42.Naseribafrouei A., Hestad K., Avershina E., Sekelja M., Linløkken A., Wilson R., et al. Correlation between the human fecal microbiota and depression. Neurogastroenterol Motil. 2014;26:1155–1162. doi: 10.1111/nmo.12378. [DOI] [PubMed] [Google Scholar]
- 43.Cheung S.G., Goldenthal A.R., Uhlemann A.C., Mann J.J., Miller J.M., Sublette M.E. Systematic review of gut microbiota and major depression. Front Psychiatry. 2019;10:34. doi: 10.3389/fpsyt.2019.00034. [DOI] [PMC free article] [PubMed] [Google Scholar]
- 44.Getachew B., Aubee J.I., Schottenfeld R.S., Csoka A.B., Thompson K.M., Tizabi Y. Ketamine interactions with gut-microbiota in rats: relevance to its antidepressant and anti-inflammatory properties. BMC Microbiol. 2018;18:222. doi: 10.1186/s12866-018-1373-7. [DOI] [PMC free article] [PubMed] [Google Scholar]
- 45.Sun J., Wang F.Y., Hu X.Z., Yang C.W., Xu H.L., Yao Y., et al. Clostridium butyricum attenuates chronic unpredictable mild stress-induced depressive-like behavior in mice via the gut–brain axis. J Agric Food Chem. 2018;66:8415–8421. doi: 10.1021/acs.jafc.8b02462. [DOI] [PubMed] [Google Scholar]
- 46.Ma X., Zhang T., Luo Z., Li X., Lin M., Li R., et al. Functional nano-vector boost anti-atherosclerosis efficacy of berberine in Apoe−/− mice. Acta Pharm Sin B. 2020;10:1769–1783. doi: 10.1016/j.apsb.2020.03.005. [DOI] [PMC free article] [PubMed] [Google Scholar]
- 47.Liu Y.T., Hao H.P., Xie H.G., Lai L., Wang Q., Liu C.X., et al. Extensive intestinal first-pass elimination and predominant hepatic distribution of berberine explain its low plasma levels in rats. Drug Metab Dispos. 2010;38:1779–1784. doi: 10.1124/dmd.110.033936. [DOI] [PubMed] [Google Scholar]
- 48.Tan X.S., Ma J.Y., Feng R., Ma C., Chen W.J., Sun Y.P., et al. Tissue distribution of berberine and its metabolites after oral administration in rats. PLoS One. 2013;8 doi: 10.1371/journal.pone.0077969. [DOI] [PMC free article] [PubMed] [Google Scholar]
- 49.Feng R., Zhao Z.X., Ma S.R., Guo F., Wang Y., Jiang J.D. Gut microbiota-regulated pharmacokinetics of berberine and active metabolites in beagle dogs after oral administration. Front Pharmacol. 2018;9:214. doi: 10.3389/fphar.2018.00214. [DOI] [PMC free article] [PubMed] [Google Scholar]
- 50.Hua W., Ding L., Chen Y., Gong B., He J., Xu G. Determination of berberine in human plasma by liquid chromatography–electrospray ionization–mass spectrometry. J Pharm Biomed Anal. 2007;44:931–937. doi: 10.1016/j.jpba.2007.03.022. [DOI] [PubMed] [Google Scholar]
- 51.Huang X., Su S., Cui W., Liu P., Duan J., Guo J., et al. Simultaneous determination of paeoniflorin, albiflorin, ferulic acid, tetrahydropalmatine, protopine, typhaneoside, senkyunolide I in Beagle dogs plasma by UPLC–MS/MS and its application to a pharmacokinetic study after oral administration of shaofu zhuyu decoction. J Chromatogr B Analyt Technol Biomed Life Sci. 2014;962:75–81. doi: 10.1016/j.jchromb.2014.05.032. [DOI] [PubMed] [Google Scholar]
- 52.Swanson H.I. Drug metabolism by the host and gut microbiota: a partnership or rivalry?. Drug Metab Dispos. 2015;43:1499–1504. doi: 10.1124/dmd.115.065714. [DOI] [PMC free article] [PubMed] [Google Scholar]
- 53.Critchfield J.W., van Hemert S., Ash M., Mulder L., Ashwood P. The potential role of probiotics in the management of childhood autism spectrum disorders. Gastroenterol Res Pract. 2011;2011:161358. doi: 10.1155/2011/161358. [DOI] [PMC free article] [PubMed] [Google Scholar]
- 54.DellaGioia N., Hannestad J. A critical review of human endotoxin administration as an experimental paradigm of depression. Neurosci Biobehav Rev. 2010;34:130–143. doi: 10.1016/j.neubiorev.2009.07.014. [DOI] [PMC free article] [PubMed] [Google Scholar]
- 55.Forsythe P., Sudo N., Dinan T., Taylor V.H., Bienenstock J. Mood and gut feelings. Brain Behav Immun. 2010;24:9–16. doi: 10.1016/j.bbi.2009.05.058. [DOI] [PubMed] [Google Scholar]
- 56.Grenham S., Clarke G., Cryan J.F., Dinan T.G. Brain–gut–microbe communication in health and disease. Front Physiol. 2011;2:94. doi: 10.3389/fphys.2011.00094. [DOI] [PMC free article] [PubMed] [Google Scholar]
- 57.Dash S., Clarke G., Berk M., Jacka F.N. The gut microbiome and diet in psychiatry: focus on depression. Curr Opin Psychiatry. 2015;28:1–6. doi: 10.1097/YCO.0000000000000117. [DOI] [PubMed] [Google Scholar]
- 58.Holzheimer R.G. Low-molecular-weight heparin (LMWH) Eur J Med Res. 2004;2004:150–170. [PubMed] [Google Scholar]
- 59.Nicolau J.C., Cohen M., Montalescot G. Differences among low-molecular-weight heparins: evidence in patients with acute coronary syndromes. J Cardiovasc Pharmacol. 2009;53:440–445. doi: 10.1097/FJC.0b013e3181a59abc. [DOI] [PubMed] [Google Scholar]
- 60.Vogel R., Crockett R.S., Oden N., Laliberte T.W., Molina L. Demonstration of efficacy in the treatment of dry eye disease with 0.18% sodium hyaluronate ophthalmic solution (Vismed, Rejena) Am J Ophthalmol. 2010;149:594–601. doi: 10.1016/j.ajo.2009.09.023. [DOI] [PubMed] [Google Scholar]
- 61.Cui L., Sun Y., Xu H., Xu H., Cong H., Liu J. A polysaccharide isolated from Agaricus blazei Murill (ABP-AW1) as a potential Th1 immunity-stimulating adjuvant. Oncol Lett. 2013;6:1039–1044. doi: 10.3892/ol.2013.1484. [DOI] [PMC free article] [PubMed] [Google Scholar]
- 62.Li X., Zhao X., Wang H., Han J., Liu L. A polysaccharide from the fruiting bodies of Agaricus blazei Murill induces caspase-dependent apoptosis in human leukemia HL-60 cells. Tumor Biol. 2014;35:8963–8968. doi: 10.1007/s13277-014-2137-0. [DOI] [PubMed] [Google Scholar]
- 63.Young S.N. How to increase serotonin in the human brain without drugs. J Psychiatry Neurosci. 2007;32:394–399. [PMC free article] [PubMed] [Google Scholar]
Associated Data
This section collects any data citations, data availability statements, or supplementary materials included in this article.