

Abstract
American policymakers have long focused on work as a key means to improve economic wellbeing. Yet, work has become increasingly precarious and polarized. This precarity is manifest in low wages, but also in unstable and unpredictable work schedules that often vary significantly week-to-week with little advance notice. We draw on new survey data from The Shift Project on 37,263 hourly retail and food service workers in the United States. We assess the association between routine unpredictability in work schedules and household material hardship. Using both cross-sectional models and panel models, we find that workers who receive shorter advanced notice, those who work on-call, those who experience last minute shift cancellation and timing changes, and those with more volatile work hours are more likely to experience hunger, residential, medical, and utility hardships as well as more overall hardship. Just-in-time work schedules afford employers a great deal of flexibility, but at a heavy cost to workers’ economic security.
Introduction
Over the past forty years, the nature of work in the United States has fundamentally transformed, as jobs at the bottom of the labor market have become substantially more precarious (Kalleberg, 2009). This precarity is manifest in jobs with low-pay and few fringe benefits (Osterman and Shulman, 2013). Recent research also highlights another dimension of precarity that appears common in front-line service sector positions and has important and independent effects on worker health and wellbeing – temporal precarity (Schneider and Harknett, 2019a).
Large shares of workers in retail and food service occupations grapple with routine work schedule uncertainty and instability in which their employers vary their work schedules from day to day and week to week, often with little advance notice (Lambert et al., 2014; Schneider and Harknett, 2019a). Prior research has documented associations between precarious scheduling and work-life conflict (Henly and Lambert, 2014) and workers’ sleep quality and psychological distress (Schneider and Harknett, 2019a; Williams et al., 2019). Such temporal precarity also seems likely to cause material hardship in working families by, among other pathways, increasing income volatility or interfering with benefits eligibility. Yet, research on this association is limited.
The consequences of temporal precarity for material hardship are a pressing concern because material hardships are direct indicators of an inability to meet basic needs, the concept undergirding official poverty statistics, but which these statistics capture only indirectly and crudely (Sen, 1979; Beverly, 2001). Material hardship also warrants research attention because of its implications for mental health (Heflin and Iceland, 2009; McCarthy et al, 2019), self-rated health (Li Donni, 2019), and an increased risk of mortality (Tucker-Seeley et al. 2009).
While a series of detailed ethnographies of the working poor consistently shows that work schedule unpredictability reduces economic security (i.e. Edin and Shaefer, 2015; Edin and Lein, 1997), data limitations have precluded a quantitative analysis of how work schedule unpredictability shapes household material hardship.
We draw on a new source of survey data from The Shift Project that contains detailed measures of work schedule unpredictability, material hardship, and a rich set of controls for a cross-section of 37,263 hourly workers employed at 127 of the largest firms in retail and food service in the U.S. We find that household material hardship is common among hourly workers at the nation’s largest retail and food service firms. We show that among these workers, those with more unpredictable schedules - little advance notice, on-call shifts, cancelled shifts, last minute schedule changes, and work-hour volatility - are significantly more likely to experience hunger, residential, medical, and utility hardship as well as at least one form of any hardship. These associations are substantively large and robust to extensive controls and alternative model specifications. In an era of precarious employment, work is not a panacea for economic security, and we show that schedule unpredictability is associated with significant household material hardship.
Background
Temporal Precarity
For many workers, job quality in the United States has declined over the past fifty years (Kalleberg, 2009). This is manifest in low wages, few fringe benefits, but also in unstable and unpredictable work schedules (Kalleberg, 2013). Particularly in the service sector, workers can no longer count on a regular day shift, or even a regular night or evening shift. Instead, work schedules are often set by employers on short notice and the hours assigned to workers vary from day-to-day and the days worked vary from week-to-week (Lambert 2008). This problem is widespread. For instance, 54% of all hourly workers and 65% of service sector workers receive less than two-weeks’ notice of their work schedules (Lambert, Fugiel, and Henly, 2014). Workers with unstable schedules are likely to be subject to a kind of “routine unpredictability” (Clawson and Gerstel 2015) in which it is a near certainty that their schedule will vary, but a near unknown of what form that change will take. For these workers, such scheduling practices are a key source of precarity - they introduce uncertainty, instability, and insecurity (Kalleberg and Vallas, 2018).
Work schedule instability is part of a broad trend toward greater economic precarity that has been characterized as the “Great Risk Shift,” because employers have transferred more risk onto individual employees (Hacker 2006; Kalleberg and Vallas, 20018). This risk shift involves an erosion of guaranteed benefits like pensions and an increase in employee cost sharing or an elimination of benefits altogether. This risk shift has also played out in work time and work schedules. Here, employers have increasingly relied upon so-called just-in-time scheduling practices to closely align staffing with consumer demand and thereby keep labor costs to an absolute minimum. Employers rely heavily on part-time workers who have an economic imperative to pick up shifts offered at the last minute (McCrate et al., 2019). Employers also use on-call scheduling in which they keep employees on hold in case they are needed, and typically offer no compensation when the workers are told they are not needed (Fugiel and Lambert, 2019). Workers may also report for a shift only to be sent home because business is slow or asked to stay late if needed, typically with no compensation for their time and trouble (Golden, 2015).
With the absence of Federal regulation of unpredictable and unstable schedules, many retail and food service employers engage in short-term optimization on labor costs by having the access to a flexible workforce and the ability to staff-up when needed, without the expense that would come from guaranteeing a set number of hours per week or honoring work schedules once assigned (Lambert, 2008; Alexander et al., 2015). These practices translate to a great deal of flexibility for employers. However, these practices come at the expense of predictability and stability of time and consistency and sufficiency of earnings for workers. This routine unpredictability in schedules could then plausibly also affect workers’ risk of experiencing material hardship.
Why Would Unpredictable Schedules Affect Material Hardship?
Although a great deal of research documents the prevalence of material hardship, the literature on the causes of material hardship is not well developed (Heflin, 2016) and has focused on trigger events related to disability and health, but also income shocks and household dynamics. We draw on this literature directly concerned with hardship as well as the broader literature related to precarious work to theorize that schedule unpredictability is likely to increase household material hardship through a set of inter-related mechanisms. We do not see these as competing or even necessarily as separable processes, and we do not test or compare particular mechanisms. Instead, we review these mechanisms to make the case that schedule instability could plausibly have an important influence on material hardship.
Income Volatility
Recent research shows that income volatility from year to year is both prevalent and on the rise (Dynan et al. 2012; Gottschalk and Moffitt 2009; Hardy and Ziliak, 2014; Hardey, 2017), and has sparked further explorations into the extent of income fluctuations from month-to-month. The more granular data on monthly income variation is valuable because many large household expenses, such as rent or utilities, are paid on a monthly basis.
The limited research to date on intra-year income volatility suggests that month-to-month income volatility is quite high. According to recent data from the SHED survey, one-third of all U.S. households report that their income varies from month-to-month (Federal Reserve 2016). High rates of month-to-month income volatility are also found in analyses financial diaries data (Morduch and Schneider 2014; Hannagan and Morduch 2015; Murdoch and Siwicki, 2017) and in big data analyses of Chase banking customers (Farrell and Grieg 2016). These multiple data sources and studies reveal that month-to-month fluctuations in income are common and sizable.
Low-income households are particularly vulnerable to experiencing intra-year income volatility (Morris et al. 2015; Farrell and Grieg 2016). Using SIPP data, Bania and Leete (2006) find that intra-month income volatility is higher for low-income households than higher income households, and Morris et al (2015) find that the coefficient of variation on income for households with children in the bottom decile of income is three times that of those in the top decile. According to the Chase banking data, 74 percent of households in the bottom quintile experienced income fluctuations of 30 percent or more from month-to-month (Farrell and Grieg 2016).
Recent research shows that a large component of overall income volatility is fluctuations in labor market earnings within the same job (Morris et al. 2015; Murdoch and Siwicki 2017). Inconsistent work hours are a major driver of this within-job variation in earned income over time (Farrell and Grieg 2016; Federal Reserve 2016). Some evidence for the link between irregular work hours and income volatility comes from research on the Great Recession, which shows that the growth in variable work hours during the recession (LaBriola and Schneider, 2019) accounts for a significant share of the growth in income volatility over the same period (Finnigan, 2018). Further, in recent research from the SHED survey, among respondents who reported income volatility, “irregular work schedules” were the most common reason given for this volatility.
Further, previous research finds that income volatility has consequences for household economic security, food insecurity, and economic hardship (Bania and Leete, 2007; Federal Reserve, 2016; Leete and Bania, 2010; McCarthy et al., 2018) and negative income shocks predict housing hardship (Finnigan and Meagher, 2018).
Benefits Eligibility
Unpredictable work schedules may also lead to material hardship by interfering with eligibility for benefits (Hill and Ybarra, 2014). A number of safety net programs such as TANF, SNAP, and child care subsidies link eligibility to earnings and work hours and require frequent recertification (Ben-Ishai, 2015). These eligibility rules have consequences for maintaining benefits eligibility. Higher earnings variability reduces participation in SNAP for low-income households (Moffitt and Ribar, 2009) and workers with unpredictable schedules were significantly more likely to leave a child care subsidy program (Henly et al., 2017).
The difficulties posed by unstable and unpredictable schedules for benefits eligibility are consequential if these benefits reduce hardship. Here, the literature is mixed, likely because the most financially fragile households are most likely to access benefits, suppressing or even reversing the association in observational studies (Pilkauskas et al., 2012; Gundersen and Ziliak, 2014). However, several studies that use exogenous shocks from the Great Recession and payment errors find evidence that SNAP benefits reduce food hardship (Pilkauskas et al. 2012; Mykerezi and Mills 2010). In a recent comprehensive examination of safety net benefits and hardship, McKernan et al. (2018) find significant reductions on food hardship and overall hardship with TANF, SNAP, and Medicaid participation.
Household Instability
Another pathway by which precarious work may lead to hardship is by destabilizing household relationships. A large body of research documents a relationship between economic security and entry into marriage and marital stability (Burstein 2007; Ellwood and Jencks 2004). This literature has shown that men’s steady employment and earnings are associated with marriage formation and stability and that women’s earning and employment have come to function in the same way (Sweeney 2002; Gibson-Davis, Edin, and McLanahan 2005; Xie et al 2003). For hourly workers, temporal precarity translates mechanically into economic precarity. Further, temporal instability in employment may also serve as a symbolic barrier to marriage, a clear sign of not having achieved the “white picket fence dream” of a steady job, some savings, and even homeownership that many low-income couples see as the pre-requisite to marriage (Edin and Kefalas, 2004). Therefore, temporal precarity may operate as a barrier to marriage. Some evidence for this relationship comes from recent research drawing on data from the NLSY97, which shows that irregular work schedules are negatively associated with entry into marriage (Schneider, Harknett, and Stimpson, 2019).
If precarious work schedules interfere with family formation, they may also undermine the ability to pool and smooth income with a partner and to share household expenses. Therefore, there is good reason to expect that unstable work schedules could lead to material hardship via the effect on household relationships. However, recent research using panel data from the SIPP is mixed. Heflin (2016) did not find evidence that household transitions affected reports of hardship, but Western et al. (2016) found that divorce is associated with an increase in children’s experience of material hardship.
Over-taxed informal networks
A large theoretical and empirical literature argues that reciprocity is essential for maintaining exchange relationships (Blau 1986; Desmond 2012; Dominguez and Watkins 2003; Harknett and Hartnett 2011; Menjivar, 2000; Nelson, 2000). Qualitative research describes the process by which individuals strategically select persons to ask for support so as not to generate fatigue or resentment on the part of the supportive social tie and how social ties become over-taxed and unwilling to help if called upon too frequently (Dominguez and Watkins, 2003; Menjivar, 2000; Nelson, 2000).
Among working parents, unstable work schedules create needs for just-in-time care providers, and informal network ties are the most flexible and common source of child care support (Harknett, Schneider, and Luhr, 2020). Parents working in retail commonly rely on grandparents, other relatives, and friends to provide care at the last minute. But in-depth interviews with these parents demonstrate that these repeated last-minute requests can be a burden and can lead to tension and frayed relationships (Carrillo et al., 2017; Scott, London, and Hurst, 2005; Henly and Lyons, 2000).
More generally, chronically uncertain and changing schedules may interfere with the maintenance of social ties by making it difficult to spend time with family and friends. This is consequential because supportive social ties are a key strategy for dealing with volatile incomes and for buffering against material hardship by providing instrumental supports such as a place to live, a small loan, or child care (Edin and Lein, 1997; Harknett 2006; Henly, Danziger and Offer, 2005). The lack of these types of supportive relationships is likely to increase the risk of material hardships.
Ability to plan ahead
Unstable and unpredictable work schedules are also likely to affect a person’s ability to engage in planning for the future. In their book, Scarcity, Mullainathan and Shafir (2013) focus on the effects of shortages of money among those who are poor and shortages of time among highly educated professionals. However, service sector workers face both of these types of scarcity in that their economic resources are scarce but so too is their time. These workers often have the misfortune of underemployment without the upside benefit of predictable free time that could be productively spent. Instead, because many workers have to keep their schedules open and available for work, even when they are not working or getting paid, the challenges of low earnings are compounded by a scarcity of time (Lambert, 2008; Golden, 2015). As Halpin and Smith (2017) describe, one result is that service sector workers must dedicate substantial cognitive effort to the precise management of time, “to engage in continual calculation, planning, and negotiating” (p. 350).
The cognitive toll of scarcity and its effects on decision-making may lead to greater risk of material hardship if it leads to increased reliance on payday loans and other high cost alternative financial services (Apaam et al., 2018) and to a range of other decisions that privilege short-term imperatives over longer-range benefits (Gennetian and Shafir, 2015).
Prior Empirical Research
While the reality of unstable and unpredictable work schedules is clear in qualitative and ethnographic accounts of low-wage work (i.e. Williams, 2006; Henly et al., 2006; Halpin, 2015), these studies are focused on the workplace and do not generally connect schedule instability to household or family processes. In contrast, ethnographies of the working poor capture household processes related to hardship and, while providing a multi-dimensional account of the detriments, again and again highlight the role of unpredictable scheduling in household economic wellbeing.
The issue of schedule unpredictability and hardship surfaces in Edin and Lein’s 1997 Making Ends Meet, where research participants describe unpredictable hours at fast food firms, including being sent home early from shifts. This unpredictability led to both income volatility and to difficulty qualifying for public benefits (p. 68). Twenty years later, Edin and co-authors document similar unpredictability for service workers in It’s Not Like I’m Poor (2015) in which respondents talk about how schedule unpredictability “made financial planning a challenge” (p. 33) and continued to interfere with benefits eligibility (p. 49). Workers in Austin, TX report similar intersections between unpredictability and hardship, with Caitlyn Collins (2019) describing how one respondent, “Raven,” often learned “of her shifts with only a few hours’ notice,” and was “dangerously close to broke at the end of every month” (p. 116). Ehrenreich (2001) similarly highlights how last-minute shift changes and unpredictable schedules make it difficult to make ends meet, specifically by interfering with the ability to hold a second job. Most recently, in $2.00 a Day, Edin and Shaefer (2015) show how work schedule unpredictability and hours volatility are a serious constraint on household economic wellbeing.
This evidence connecting temporal precarity with household material hardship aligns with a broader literature that describes the difficulties that many families face in budgeting and making ends meet. The families in Halpern-Meekin et al’s It’s Not Like I’m Poor (2015), navigate perilously close to the financial edge, where every economic dip from volatile earnings or unexpected expenses carries the very real risk of material hardship (p. 47). These findings resonate with the earlier work of Hayes (2003) and Edin and Lein (1997) who describe how working poor families constantly contend with household budgets on the margin between making ends meet and financial emergency. Survey data also reveal the thin margins of many families in America. For instance, 41% of Americans report that they would not be able to pay for a $400 emergency expense without borrowing or selling something or at all - a share that rises to nearly three-quarters of households making less than $25,000 a year (Chen, 2019).
However, existing large-scale data sets that capture measures of material hardship such as the Fragile Families study and the SIPP do not contain detailed measures of unpredictable scheduling.1 While the NLSY97 and GSS contain some measures of unpredictable scheduling, these are not extensive and these surveys do not also gauge material hardship.2 The lack of existing data has constrained our ability to investigate how the temporal dimension of precarious work shapes material hardship.
Data and Methods
Cross-Sectional Data.
We use Shift Project survey data collected between 2017 and 2019 for a cross-sectional sample of 37,263 hourly workers employed at one of 127 of the largest retail or food service companies. We perform multiple imputation for those who completed the survey but had item non-response.
To recruit the cross-sectional survey sample, The Shift Project uses advertisements on Facebook, targeted to service-sector workers employed at particular food service or retail employers. Facebook is the leading social media platform (Perrin, 2015), with over 80% saturation of the working-aged population in the U.S. (Greenwood et al., 2016), and houses an extensive database of information on broad populations. The Shift Project uses this infrastructure to target survey recruitment messages to Facebook users between 18 and 65 years old who reside in the United States and list one of 127 large retail or food companies as their employer. We selected these firms from among the top 100 retailers by sales and the top restaurant chains by sales in the United States.
Advertisements placed on the Facebook platform appear in users’ Facebook desktop newsfeed, mobile newsfeed, or on Instagram. Users who click on the link in the advertisement are redirected to an online survey hosted through the Qualtrics platform and offered a lottery incentive to complete the survey. Further details on this data collection approach are included in the Supplemental Appendix.
This approach to survey data collection departs from traditional probability sampling methods, raising concerns about potential sample bias owing to the sampling frame or non-response bias (Groves, 2011; Smith, 2013). However, recent estimates show that approximately 80% of Americans age 18–50 are active on Facebook (Greenwood et al., 2016), making this sampling frame on par with coverage of telephone-based methods (Christian et al., 2010).
Further, an emerging body of work has demonstrated that non-probability samples drawn from non-traditional platforms, in combination with statistical adjustment, yield similar distributions of outcomes and estimates of relationships as probability-based samples. This work has drawn data from Xbox users (Wang et al., 2015), Mechanical Turk (Mullinix et al., 2015), and Pollfish (Goel et al., 2015). Compared with these platforms, Facebook is the most commonly and widely used by the public (Perrin, 2015). Zhang et al. (2017) compare respondents drawn from Facebook with those from the American Community Survey and find a high degree of similarity. Using Shift Project data, Schneider and Harknett (2019b) report on an extensive set of data validity checks, including results from benchmarking against probability samples that show similar univariate distributions and bivariate relationships in the Shift data, the CPS, and NLSY97.
Panel Data.
The panel data began with a subsample of 4,311 workers who were interviewed in Spring 2017 and resided in the 30 largest U.S. cities. These 4,311 workers had complete data and provided contact information. These respondents were re-contacted in Fall 2017 using email and text message invitations to complete a follow-up survey. Respondents were offered escalating incentives, starting at $5 and rising to $15, to complete the survey. 2,039 (47%) of eligible respondents completed this reinterview. A third wave of data was collected in the Spring of 2018 using the same procedures and yielding a final sample of 1,000 respondents who completed all three waves. There is evidence of modest bias in attrition by gender and education but no significant differences by age, race, marital-status, work scheduling characteristics, job tenure, managerial status, or hourly wage (Choper, Schneider, and Harknett, 2019).
Key Variables
Material Hardship
Our dependent variables include four key dimensions of material hardship - hunger, housing, medical, and utilities – and a fifth, composite measure. We selected these four measures because they have been identified in previous literature as distinctive dimensions of material hardship (Heflin, Sandberg, and Rafail, 2009), and are consequential for health outcomes (Heflin and Iceland, 2009; McCarthy et al., 2019).
First, we code respondents as experiencing hunger hardship if they reported either “receiving free food or meals because didn’t have enough money” or “being hungry, but didn’t eat because couldn’t afford enough food?” in the prior 12 months. Second, we code respondents as experiencing residential hardship if they reported either “moving in with other people even for a little while because of financial problems” or “staying in a shelter, abandoned building, car, or any other place not meant for regular housing, even for one night” in the prior 12 months. Third, we code respondents as experiencing medical hardship if they reported “there was someone in your household who needed to see a doctor or go to the hospital but couldn’t go because of the cost?.” Fourth, respondents who report that there was a time when they “did not pay the full amount of gas, oil, or electricity bill because you didn’t have enough money?” are coded as experiencing utility hardship. Finally, we construct a fifth measure of exposure to any of those hardships or reporting needing financial assistance from family or friends.
As shown in Table 1, we find that 30% of the sample experienced hunger hardship in the past year, 16% report residential hardships, 25% experienced a medical hardship, and 33% had a time when they couldn’t afford to pay a utility bill. Overall, 40% of the sample did not experience any hardship, 18% experienced one hardship, and 15% experienced two. The remaining 25% of respondents experienced at least three hardships, with about 5% experiencing five or more hardships.
Table 1.
Descriptive Statistics - Measures of Hardship
| Material Hardships | |
| Hunger Hardship | 30% |
| Receive Free Food/Meals Because Lack Money | 10% |
| Hungry, But Not Eat Because Lack Money | 26% |
| Residential Hardship | 16% |
| Double-up Because Financial Problems | 15% |
| Stay in Shelter or Other Non-Regular Housing | 3% |
| Medical Hardship | 25% |
| Utility Hardships | 31% |
| Any Hardship | 59% |
| Number of Hardships | |
| 0 | 41% |
| 1 | 18% |
| 2 | 15% |
| 3 | 12% |
| 4 | 8% |
| 5 | 4% |
| 6+ | 2% |
| N | 37,263 |
In the panel data, we measure material hardship at both baseline and at wave 3, which allows us to also observe variation in material hardship over time. While 58% of respondents report no hunger hardship at baseline or follow-up, 17% report hardship at both points in time, 15% experienced hunger hardship at baseline but not at follow-up, and 10% did not experience hunger hardship at baseline, but did experience it at follow-up. The shares for residential hardship are 75%, 8%, 10%, and 7%.
Schedule Unpredictability
First, respondents report on the amount of advance notice that they have of their work schedules (0–2 days, 3–6 days, 1–2 weeks, or 2 weeks or more). Second, respondents report whether they were required to be “on-call” for work shifts in the prior month. “On call” shifts mean that employees must be available for a work shift, but may not be called-in. Third, we asked respondents whether one of their work shifts had ever been cancelled in the prior month. Fourth, respondents report whether they had the timing of their shift changed at the last minute in the prior month. Aside from advance notice, each of these measures is coded dichotomously.
We also gauge work hour volatility. Respondents report, over the prior month, the number of hours they worked in the week they worked the most hours and the number in the week in they worked the fewest hours. We calculate the percentage variation in weekly work hours over the prior month as the most hours minus the fewest divided by the most hours.
Finally, we tally the number of types of schedule instability that a worker experiences in an additive scale. A score of 0 on the instability scale means that the worker has at least two weeks advance notice of his/her work schedule; does not work on-call shifts; has not experienced cancelled shifts, and has not experiencing changes in timing. A score of 4 on the instability scale means that a worker has less than two weeks advance notice of his/her schedule; works on-call shifts; and has experienced shift cancellations and timing changes.
Other Aspects of Job Quality
We adjust for a number of other dimensions of job quality that could also affect household material hardship and might be correlated with schedule unpredictability. First, we control for both hourly wage and for household income (categorized as <$15,000, $15K–$25K, $25K–$35K, $35K–$50K, $50K–$75K, $75K–$100K, and $100K or more) to capture the level of resources in the household. Second, we control for a dichotomous measure of involuntary part-time work, coded 1 if the respondent usually works fewer than 35 hours per week and reports a desire to work more hours, and 0 otherwise.
We also adjust for worker control over scheduling. Respondents are coded as lacking control (=1) if they indicate that starting and ending times for work are “decided by my employer and I cannot change them on my own.” and 0 otherwise. We also adjust for two measures of non-standard work hours, working on weekends and working night, evening, or early morning shifts. Finally, we adjust for respondents’ reports of being managers, being members of a labor union, and for years of tenure at their current job. Means for these variables are shown in Table 2.
Table 2.
Descriptive Statistics - Control Variables
| Household Income | |
|---|---|
| Less than $15K | 19% |
| $15K – $25K | 22% |
| $25K – $35K | 17% |
| $35K – $50K | 16% |
| $50K–$75K | 13% |
| $75K – $100K | 8% |
| $100K –$150K | 5% |
| $150K or more | 2% |
| Hourly Wage | |
| Mean | $11.96 |
| Median | $11 |
| Second Job | |
| No Second Job | 87% |
| 1–9 Usual Hours at 2nd Job | 3% |
| 10–19 Usual Hours at 2nd Job | 4% |
| 20–29 Usual Hours at 2nd Job | 3% |
| 30–39 Usual Hours at 2nd Job | 2% |
| 40+ Usual Hours at 2nd Job | 2% |
| Involuntary Part Time Work | |
| Involuntary Part-Time | 34% |
| Schedule Control | |
| Schedule Set by Employer without Worker Input | 48% |
| Non-Standard Schedules | |
| Often Works Weekend Shifts | 95% |
| Often Works Non-Day Shifts | 70% |
| Manager | |
| Is a Manager | 21% |
| Covered by/Member of Union | |
| Union | 6% |
| Job Tenure | |
| Less than 1 year | 21% |
| 1 Year | 15% |
| 2 Years | 16% |
| 3 Years | 11% |
| 4 Years | 7% |
| 5 Years | 5% |
| 6 Years or more | 24% |
| Age | |
| Mean | 33 |
| Median | 27 |
| Gender | |
| Female | 73% |
| Race/Ethnicity | |
| White, non-Hispanic | 77% |
| Black, non-Hispanic | 4% |
| Hispanic | 11% |
| Asian/Other/Multiple | 8% |
| Educational Attainment | |
| Less than HS | 6% |
| HS or GED | 33% |
| Some College | 40% |
| Associate’s Degree | 11% |
| Bachelors Degree | 10% |
| Advanced Degree | 1% |
| School Enrollment | |
| Enrolled | 30% |
| Partnership Status | |
| Married/Cohabiting | 46% |
| Single | 54% |
| Speaks Language Other than English at Home | |
| Yes | 12% |
| Children in Household | |
| Children 0–4 | 10% |
| Children 5–9 | 9% |
| Children 10–14 | 9% |
| N | 37,263 |
Demographic Controls.
We adjust for age, gender, race/ethnicity, educational attainment, school enrollment, marital status, whether a language other than English is spoken at home, and the presence of children in the household. We also adjust for working a second job, with categories of working a second job with weekly hours of 1–9, 10–19, 20–29 hours, 30–39 hours, or 40 hours or more, or not working a second job. We control for these characteristics in all of our regression models. We provide means for these variables in Table 2.
Analytical Approach
We estimate the association between work schedule unpredictability and material hardship using linear probability models that take, in turn, each measure of hardship as the dependent variable and each measure of schedule unpredictability, one at a time, as the key independent variable. We thus estimate 25 models (5 dependent variables × 5 independent variables) and in each model we adjust for the full set of job and demographic controls. Then, we estimate an additional model of the association between the schedule unpredictability scale and each of the measures of hardship. Finally, we compare the relative “effect” size of our measures of work schedule unpredictability on material hardship against the “effect” size of both hourly wages and household income.
We test the sensitivity of our results to alternative model specifications and sample restrictions. First, we include employer-fixed effects to control for all time-invariant attributes of employers that may act as confounders. Next, we restrict the sample to those employed at least one year at their current job, to align job conditions with the twelve-month time period captured by the hardship measures. Finally, we estimate models that control for perceptions of supervisor fairness to addresses potential selectivity arising from managers’ preferential treatment toward particular workers. In each case, the results were consistent with those presented. More details on the rationale for each of these tests and the results are provided in the Supplemental Appendix.
Panel Models
We next focus on the panel data and estimate two different models. First, with the panel data, we are better able to address the problem of temporal ordering discussed above. We estimate the following model:
We take material hardship as measured at wave 3 as the dependent variable. β1 is the coefficient on the schedule unpredictability scale measured at the prior wave t2, after adjusting for demographic and work characteristics measured at baseline t1 and other schedule characteristics - nights, day, involuntary part time, and control at the same time as unpredictability.
Finally, we estimate a lagged dependent variable model:
Where we simply adapt the prior model to also include a measure of material hardship captured at baseline. Unfortunately, material hardship was not measured at wave 2 and so we are unable to estimate an individual fixed-effects model.
Results
Descriptive Statistics
Figure 1 shows the extent of exposure to schedule unpredictability. More than 15% of workers in the sample report less than 72 hours advance notice of their schedules and a similar share report just 3–6 days notice. Just a third of respondents report at least two weeks’ advance notice of their work schedules.
Figure 1:
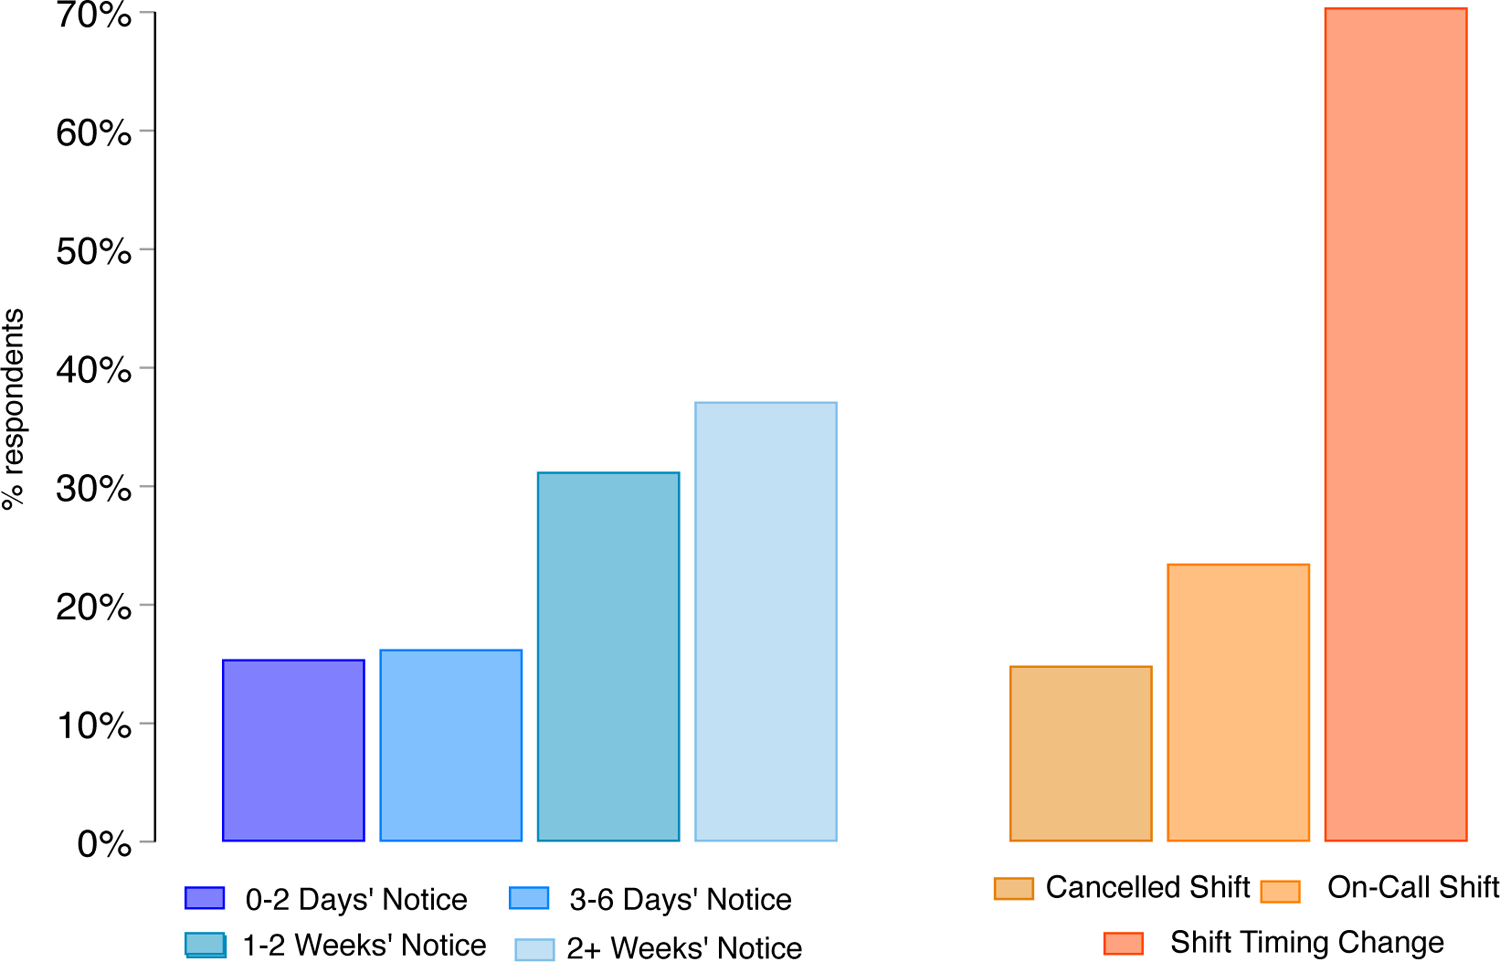
Schedule Unpredictability
Fifteen percent of respondents report having a cancelled shift in the prior month and nearly 1 in 4 report an on-call shift. Last minute changes to schedule timing are far more common with more than two-thirds of respondents reporting such a change in the last month. We also find high levels of work hour volatility. The average worker experiences a 36% swing in weekly work hours between the week in the last month with the most and the fewest hours.
As shown in Figure 2, 20% of service sector workers enjoy a regular and predictable schedule with 0 types of instability and 37% experience just 1 source of instability. But, 40% of workers experience 2 or 3 sources of instability and a highly exposed minority - about 3% - experience 4 types of schedule instability.
Figure 2:

Schedule Unpredictability Scale
Regression Results
Table 3 presents the first set of regression results from the linear probability models. We see that respondents who report receiving greater advance notice of their work schedules report significantly less hunger hardship. We see similar associations between notice and housing hardship, medical hardship, utility hardship, and overall hardship. In each case, we observe a fairly monotonic relationship, though the coefficients are not constrained to be so. We similarly find that respondents who had a cancelled shift are more likely to report each type of hardship, as are those who work an on-call shift or have timing change. Comparing these coefficients, cancellation has a stronger association with hardship than on-call shifts and changes in shift timing. While we cannot assess it directly, this would accord with a model in which shift cancellation was more likely to lead to income volatility than on-call shifts or changes in shift timing. In the final row of the table, we see that workers with more volatile work hours are also significantly more likely to report hunger, housing, and utility hardships, though not medical hardships.
Table 3:
Schedule Unpredictability and Material Hardships
| (1) | (2) | (3) | (4) | (5) | |
|---|---|---|---|---|---|
| Hunger Hardship | Housing Hardship | Medical Hardship | Utility Hardship | Any Hardship | |
| Amount of Notice | |||||
| 0–2 days | 0.00 | 0.00 | 0.00 | 0.00 | 0.00 |
| 3–6 days | −0.03*** | −0.04*** | −0.03*** | −0.02** | −0.02** |
| 1–2 wks | −0.05*** | −0.04*** | −0.05*** | −0.03*** | −0.04*** |
| 2 wks or more | −0.07*** | −0.05*** | −0.06*** | −0.04*** | −0.06*** |
| Cancelled Shift | |||||
| No | 0.00 | 0.00 | 0.00 | 0.00 | 0.00 |
| Yes | 0.12*** | 0.07*** | 0.10*** | 0.08*** | 0.10*** |
| On-Call Shift | |||||
| No | 0.00 | 0.00 | 0.00 | 0.00 | 0.00 |
| Yes | 0.08*** | 0.04*** | 0.07*** | 0.07*** | 0.06*** |
| Change to Timing of Shift | |||||
| No | 0.00 | 0.00 | 0.00 | 0.00 | 0.00 |
| Yes | 0.08*** | 0.04*** | 0.08*** | 0.08*** | 0.10*** |
| Hours Variation | 0.06*** | 0.03** | 0.02 | 0.05*** | 0.05*** |
| Observations | 37,263 | 37,263 | 37,263 | 37,263 | 37,263 |
We next present the results for models that include our unpredictability scale in place of the individual measures. Here too, we see strong and fairly monotonically increasing positive coefficients on the scale measure though, as before, the model is not constrained to show a linear relationship. In Figure 3, we plot predicted shares of respondents experiencing each type of material hardship across the values of the unpredictability scale, adjusting for the full set of control variables. We find that 23% of workers who experience no unpredictability (a fifth of the sample) report hunger hardship, but this share rises significantly with increased exposure, reaching 40% of those who experience three sources of unpredictability (12% of the sample) and as high as 50% of respondents in the 3% of workers experiencing the most unpredictability. Though residential hardship is less common than hunger hardship, here too we find substantively large effects. The share experiencing residential hardship increases from 12% of those with the least unpredictability to nearly twice the level - 28% - of those experiencing the most. Similarly, the share experiencing medical hardship rises from 18% among those with predictability to 42% among those with the most unpredictability and the share experiencing utility hardship rises from 24% to 44%.
Figure 3:

Predicted Material Hardships by Schedule Unpredictability Scale
Turning to experiences of any hardship, even among those with the most predictability, half experienced some material hardship. However, this share is much higher - at 70–75% of those who experience three or four sources of unpredictability.
Wages, Income, and Schedules
We next compare the substantive size of the associations between exposure to precarious work schedules and material hardship with associations between both household income and wages and material hardship. To make this comparison, we estimate the same model as above and then plot predicted values of hunger hardship by (1) schedule unpredictability, (2) hourly wage, and (3) household income.
The far-left panel of Figure 4 duplicates the estimates for hunger hardship from Figure 3. We see that while 23% of respondents with the most stable schedules report hunger hardship, the share is essentially twice as large for those with the most schedule unpredictability. In the middle panel, we see that while hourly wage is a significant predictor of hunger hardship, the substantive size of the association is much smaller. Where 32% of respondents who earn just $8 an hour experience hunger hardship, 28% of those earning $16 report hunger hardship. This gap is significant, but is much smaller than the schedule predictability gap. In contrast, the household income gap is large and significant. For instance, while 42% of respondents in households with less than $15,000 in income per year report hunger hardship, there is a large and steady decline in hunger such that just 11% of respondents in households making at least $100,000 a year report such a hardship.
Figure 4:

Predicted Hunger Hardship by Schedule Unpredictability Scale, Hourly Wage, and Household Income
Panel Regression Results
We next focus on the panel data from respondents interviewed across three waves. In Table 5, we present three sets of model results for each of the five hardship outcomes. The first model in each set reproduces the coefficients on the instability scale from the cross-sectional models shown in Table 4. The next model in each set is run on the panel data and allows for the hypothesized time ordering such that unpredictable scheduling exposures precede hardship reports.
Table 5:
Panel Estimates
| (1) | (2) | (3) | |
|---|---|---|---|
| Cross-Sectional | Panel Lag IV | Panel Lag DV | |
| Hunger Hardship | |||
| 0 | 0.00 | 0.00 | 0.00 |
| 1 | 0.04*** | 0.09* | 0.10** |
| 2 | 0.10*** | 0.10* | 0.08+ |
| 3 | 0.16*** | 0.16** | 0.13* |
| 4 | 0.26*** | 0.33* | 0.31** |
| Obs. | 37,263 | 903 | 902 |
| Residential Hardship | |||
| 0 | 0.00 | 0.00 | 0.00 |
| 1 | 0.01** | 0.05+ | 0.05+ |
| 2 | 0.05*** | 0.01 | 0.02 |
| 3 | 0.09*** | 0.07 | 0.06 |
| 4 | 0.16*** | 0.22* | 0.20* |
| Obs. | 37,263 | 901 | 901 |
| Medical Hardship | |||
| 0 | 0.00 | 0.00 | 0.00 |
| 1 | 0.04*** | 0.04 | 0.03 |
| 2 | 0.09*** | 0.04 | 0.05 |
| 3 | 0.15*** | 0.16** | 0.13* |
| 4 | 0.23*** | 0.05 | 0.08 |
| Obs. | 37,263 | 902 | 902 |
| Utility Hardship | |||
| 0 | 0.00 | 0.00 | 0.00 |
| 1 | 0.04* | 0.06 | 0.05 |
| 2 | 0.08*** | 0.06 | 0.06 |
| 3 | 0.14*** | 0.08 | 0.06 |
| 4 | 0.20*** | 0.30* | 0.32** |
| Obs. | 37,263 | 904 | 904 |
| Any Hardship | |||
| 0 | 0.00 | 0.00 | 0.00 |
| 1 | 0.06*** | 0.13** | 0.12** |
| 2 | 0.11*** | 0.12* | 0.12* |
| 3 | 0.16*** | 0.19** | 0.14* |
| 4 | 0.22*** | 0.06 | 0.08 |
| Obs. | 37,263 | 911 | 911 |
Table 4:
Unpredictability Scale and Hardship
| (1) | (2) | (3) | (4) | (5) | |
|---|---|---|---|---|---|
| Hunger Hardship | Housing Hardship | Medical Hardship | Utility Hardship | Any Hardship | |
| Unpredictability Scale | |||||
| 0 | 0.00 | 0.00 | 0.00 | 0.00 | 0.00 |
| 1 | 0.04*** | 0.01** | 0.04*** | 0.04*** | 0.06*** |
| 2 | 0.10*** | 0.05*** | 0.09*** | 0.08*** | 0.11*** |
| 3 | 0.16*** | 0.09*** | 0.15*** | 0.14*** | 0.16*** |
| 4 | 0.26*** | 0.16*** | 0.23*** | 0.20*** | 0.22*** |
| Observations | 37263 | 37263 | 37263 | 37263 | 37263 |
For hunger hardship, we see consistent coefficients between M1 (pooled data) and M2 (panel data). The estimates are quite stable across the two models even after allowing for correct causal ordering and after restricting the sample to a substantially different population. Comparing Models 1 and 2, for housing hardship, we find somewhat less consistency. While we find that those with the most exposure are similarly at risk for housing hardship (beta1 = 0.16 (p < 0.001) vs. beta1 =0.22 (p < 0.05)), the estimated coefficients are smaller for those with 2 or 3 exposures and less precisely estimated. For both medical and utility hardship, the estimated coefficients on 1 or 2 exposures are of a similar magnitudes across the models, but are not significant in the panel data. For medical hardship, three exposures is significantly associated with medical hardship and for utility hardship, we see a significant association for four exposures. In contrast, for any hardship we find similar estimates, if larger, for the panel models for those with 1, 2, or 3 exposures, but we find a much smaller association between the highest level of exposure (4) and experiencing any hardship in the panel model as compared to the pooled model.
Finally, we present the results from the lagged dependent variable models. For hunger hardship, the results are entirely consistent. For housing hardship, medical hardship, and utility hardship the LDV models align with the results in the lagged panel models. The same holds true when we model any hardship - including the LDV does not change the association over the simpler panel models.
Discussion
The COVID-19 pandemic has wreaked havoc on the lives of millions of service sector workers in the United States. Workers in fast food, casual dining, and retail found themselves quickly laid off, furloughed, or with their work hours radically reduced. Workers in grocery, pharmacy, big box stores, and delivery/fulfillment found themselves on the front-lines of the pandemic response, often without adequate protective equipment or paid sick leave. The pandemic has drawn attention to the importance of service sector work for the economy, and to the precarious conditions these workers face.
However, even when, by traditional metrics, the economy was in good shape, service sector workers were already facing difficult job conditions. In this paper, we use new data from The Shift Project to examine the experience of hunger, housing, medical, and utility material hardships among a sample of over 37,000 workers employed in the service sector. Well over half of these workers reported experiencing a material hardship in the prior year.
As the public and policymakers reckon with how to remake the American economy, our results point to the importance of work schedule instability and unpredictability in the lives of service sector workers. Notably, material hardship varied in proportion to the amount of temporal precarity workers experienced from their jobs. Workers with the most unpredictable and unstable work schedules were twice as likely to report material hardship compared with their counterparts with the most predictable and stable schedules. This strong association was not simply an artifact of struggling workers sorting into jobs with the worst schedules. We see the same strong association between schedule instability and material hardship within employer as we do between employers. This strong association also does not appear to be driven by struggling workers being treated worse by their managers. The association persists among workers who report that their manager treats them fairly. Using longitudinal data, we also rule out the possibility that this is simply a reverse causal relationship in which hardship leads desperate workers to accept jobs with the most unstable schedules, by estimating models in which schedule instability precedes reports of material hardship. On balance, all evidence points to schedule instability as an important driver of material hardship, particularly hunger hardship.
Although an examination of potential causal pathways linking schedules with hardship was beyond the scope of the present analysis, there are several mechanisms through which schedules may be connected with material hardship. Unstable work schedules are associated with income volatility, household instability, and frayed social network ties. Unstable work schedules also interfere with continuity of eligibility for safety net benefits, and more generally act as an impediment to medium and long-range planning. Each of these consequences of schedule instability could help explain the strong relationship with material hardship. While we draw on this related literature to motivate our inquiry, we were unable to test these hypothesized pathways. A valuable contribution of future work would be to test the relative importance of these potential mediating factors in explaining the association between schedule instability and material hardship.
For workers with scarce resources, the consequences of unstable schedules may be especially severe. Workers with savings or other assets, or who pool resources with spouses, partners, or other household members, may be insulated from the hardship toll of unstable work schedules if they can smooth income with savings or through risk-sharing with family and household members. Workers with access to credit may be better able to cope with negative income shocks associated with schedule volatility. And, those with access to safety net programs may also be protected against material hardship, though work-schedule instability can itself be an impediment to accessing benefits (Hill and Ybarra, 2014). An examination of the moderating influence of personal, social, and safety net resources in the relationship between temporal precarity on the job and experience of material hardship represents another fruitful direction for future research.
The Shift Project data is not a probability sample of workers in the service sector, and we cannot be sure that the sample is representative of the broader population of service sector workers. However, as part of the data collection and validation process, Schneider and Harknett (2019b) provide show that key relationships of interest do not significantly vary for paired samples of workers who were purposively recruited so as to differ on an unobserved attribute such as overworked/underworked, job satisfaction/dissatisfaction, or get along with manager/do not get along with manager. Further, comparisons of The Shift Project data with data from the Current Population Survey and National Longitudinal Survey of Youth 1997 show that The Shift Project sample resembles these probability samples in estimated relationships between job tenure and wages and that The Shift Project data is more similar to these two probability samples than they are to one another (Schneider and Harknett 2019b).
While The Shift Project data provide the most detailed available measures of temporal precarity in retail and food service work, these measures do not capture the full range of worker experiences. One important limitation in particular is that respondents report on only if they experienced “at least one” scheduling practice such as shift cancellation, on-call shift, or timing change. The data do not allow us to distinguish between a worker who might have experienced, for example, one shift cancellation from a worker who experienced five. Certainly the more frequent exposure could have especially dire consequences of household economic insecurity. Future work could adapt question design to distinguish between the “extensive” and “intensive” margin of schedule instability or could usefully draw on administrative data from scheduling software matched to worker reports of hardship and other outcomes.
A limitation of our methodological approach is that omitted variables could confound the relationship between schedule stability and hardship. Although we took several measures to address potential confounding - employer fixed effects, controls for supervisor fairness, longitudinal analyses with lagged measures of schedule instability, and lagged dependent variable models - we cannot completely eliminate the possibility that unobserved characteristics bias the estimated relationship between schedule instability and hardship. However, given the magnitude of this relationship as well as the robustness of this relationship to stringent controls and alternative model specifications, it would be surprising if the relationship was entirely driven by omitted variables. The weight of the evidence certainly suggests that schedule instability contributes to the experience of material hardship.
Policy proposals to improve economic conditions for low-wage workers often center around campaigns for a living wage or expansions of the Earned Income Tax Credit. This emphasis is natural given that increasing wages or earnings should intuitively alleviate economic deprivation. Yet, for many low-wage workers, their earnings are a product of both wages and time. To date, wages have received far more attention in research and policy debates than the temporal dimension of low-wage work. However, the past five years have seen a growth in attention and legislative action focused on work schedule instability. Seven cities or states have passed “secure scheduling” legislation, designed to make work schedules more stable and predictable, and several other localities are considering similar legislation (Wolfe, Jones, and Cooper, 2018). If these laws are effective in increasing schedule notice, and in reducing on-call work and shift cancellations and changes, our results suggest that we might also expect these laws to reduce the experience of material hardship. A valuable direction for future work is to assess the efficacy of such laws in making schedules more stable and predictable and so potentially reducing hardship.
Our research has revealed the prominent role of temporal precarity as a driver of material hardship for low-wage workers. Future research and policymaking concerned with the material hardship of low-wage workers should look beyond wages and also be attentive to schedule instability and unpredictability.
Supplementary Material
Acknowledgments
We received excellent research assistance from Carmen Brick, Josh Choper, Paul Chung, Megan Collins, Veronique Irwin, and Adam Storer. We received helpful feedback from seminar audiences at the University of Maryland, the Goldman School at UC Berkeley, and Brown University. We gratefully acknowledge grant support from the National Institutes of Child Health and Human Development (R21HD091578), the William T. Grant Foundation (Award 188043), The Bill and Melinda Gates Foundation (Award 002665), the Russell Sage Foundation (Award 77-18-05), the Robert Wood Johnson Foundation (Award No. 74528), the Washington Center for Equitable Growth (Award No. 39092), the Ford Foundation (Award 0000000834), the Institute for Research on Labor and Employment, and the Berkeley Population Center.
Biographies
Daniel Schneider is Professor of Public Policy and of Sociology at Harvard University and co-director of The Shift Project. His research focuses on inequality, the family, and precarious work. His prior research has appeared in the American Sociological Review, the American Journal of Sociology, Demography, and other outlets.
Kristen Harknett is an Associate Professor in the Department of Social and Behavioral Sciences at the University of California, San Francisco, and co-director of The Shift Project. She is a sociologist and demographer with research interests in the areas low-wage work, population health, family formation and stability, social support, and policy evaluation. Her work has been published in the American Sociological Review, Demography, Social Problems, and other outlets.
Footnotes
The SIPP only captures schedule type and if respondents’ report that their usual work hours vary. The Fragile Families Study asks about schedule type: weekdays, evenings, nights, weekends, and “different times each week.” However, there are no items on unpredictability per se.
The GSS asks about material hardship in 2004, but about a limited set of scheduling items only in 2014 and 2016.
Contributor Information
Daniel Schneider, Harvard University.
Kristen Harknett, UCSF.
References
- Alexander Charlotte, Haley-Lock Anna, and Ruan Nantiya. 2015. “Stabilizing Low-Wage Work” Harvard Civil Rights-Civil Liberties Law Review. 50(1): 1–48. [Google Scholar]
- Apaam Gerald, Burhouse Susan, Chu Karyen, Ernst Keith, Fritzdixon Kathryn, Goodstein Ryan, Lloro Alicia, Opoku Charles, Oksaki Yazmin, Sharma Dhruv, and Weinstein Jeffrey. 2018. FDIC National Survey of Unbanked and Underbanked Households Federal Deposit Insurance Corporation report. [Google Scholar]
- Bania Neil, and Leete Laura. 2007. “Income Volatility and Food Insufficiency in US LowIncome Households, 1992–2003.” Institute for Research on Poverty. [Google Scholar]
- Ben-Ishai Liz. 2015. Volatile Job Schedules and Access to Public Benefits. CLASP. [Google Scholar]
- Beverly Sondra G. 2001. “Measures of Material Hardship.” Journal of Poverty 5(1):23–41. [Google Scholar]
- Bureau of Labor Statistics. 2016. A Profile of the Working Poor. BLS Reports. Bureau of Labor Statistics. Washington, DC. [Google Scholar]
- Brauner Sarah and Loprest Pamela. 1999. Where are They Now? What States’ Studies of People Who Left Welfare Tell Us. New Federalism Issues and Options for States, Series A, No. A-32. The Urban Institute. [Google Scholar]
- Burhouse S, Chu K, Goodstein R, Northwood J, Osaki Y, and Sharma D (2014). 2013 FDIC National Survey of Unbanked and Underbanked. Washington, DC: Federal Deposit Insurance Corporation. [Google Scholar]
- Collins Caitlyn. 2019. Making Motherhood Work: How Women Manage Careers and Caregiving. Princeton: Princeton University Press. [Google Scholar]
- CBO. 2018. The Distribution of Household Income, 2014 Washington, DC: Congressional Budget Office report. [Google Scholar]
- Chatman Jennifer A. 1989. “Improving interactional organizational research: A model of person-organization fit” Academy of Management Review 14(3): 333–349. [Google Scholar]
- Chen Anqi. 2019. “Why Are so Many Households Unable to Cover a $400 Unexpected Expense?” Center for Retirement Research, Boston College. [Google Scholar]
- Choper Joshua, Schneider Daniel, and Harknett Kristen. 2019. “Uncertain Time: Precarious Schedules and Job Turnover in the U.S. Service Sector.” Paper to be presented at 2019 Meetings of the American Sociological Association. [Google Scholar]
- Christian Leah, Keeter Scott, Purcell Kristen, and Smith Aaron. 2010. “Assessing the Cell Phone Challenge.” Washington, DC: Pew Research Center. [Google Scholar]
- Clawson Dan and Gerstel Naomi. 2015. Unequal Time: Gender, Class, and Family in Employment Schedules. New York: Russell Sage Foundation. [Google Scholar]
- Collins Caitlyn. 2015. “Raven: ‘The Difference Between a Cocktail Waitress and a Stripper? Two Weeks’ ” In Invisible in Austin: Life and Labor in an American City Ed. Auyero Javier. Austin: University of Texas Press. [Google Scholar]
- Dominguez Silvia, and Watkins Celeste. 2003. “Creating Networks for Survival and Mobility: Social Capital among African-American and Latin-American Low-Income Mothers” Social Problems 50(1): 111–135. [Google Scholar]
- Dynan Karen, Elmendorf Douglas, and Sichel Daniel. 2012. “The Evolution of Household Income Volatility.” B.E. Journal of Economic Analysis and Policy 12 (2). [Google Scholar]
- Edin Kathryn and Shaefer Luke. 2015. $2.00 a Day: Living on Almost Nothing in America. New York: Houghton Mifflin Harcourt. [Google Scholar]
- Edin Kathryn and Lein Laura. 1997. Making Ends Meet: How Single Mothers Survive Welfare and Low-Wage Work. New York: Russell Sage Foundation. [Google Scholar]
- Ehrenreich Barbara. 2001. Nickel and Dimed: On (Not) Getting By in America. New York: Henry Holt. [Google Scholar]
- European Council. 2019. “Directive (EU) 2019/1152 of the European Parliament and of the Council of 20 June 2019 on transparent and predictable working conditions in the European Union.” Official Journal of the European Union [Google Scholar]
- Farrell Diana and Greig Fiona. 2016. Paychecks, Paydays, and the Online Platform Economy: Big Data on Income Volatility. JP Morgan Chase & Co. Institute report. [Google Scholar]
- Federal Reserve. 2016. Report on the Economic Well-Being of U.S. Households in 2015. Washington, D.C. [Google Scholar]
- Finnigan Ryan. 2018. “Varying Weekly Work Hours and Earnings Instability in the Great Recession” Social Science Research 74: 96–107. [DOI] [PubMed] [Google Scholar]
- Finnigan Ryan and Meagher Kelsey. 2018. “Past Due: Combinations of Utility and Housing Hardship in the United States.” Sociological Perspectives 62(1): 96–119. [Google Scholar]
- Fugiel Peter J. and Lambert Susan. 2019. “On-call and On-demand Work in the USA: Adversarial Regulation in a Context of Unilateral Control” Chapter in Zero Hours and On-call Work in Anglo-Saxon Countries Editors: O’Sullivan M, Lavelle J, McMahon J, Ryan L, Murphy C, Turner T, Gunnigle P. pp. 111–135. Springer Singapore. [Google Scholar]
- Gennetian Lisa A., Wolf Sharon, Hill Heather D., and Morris Pamela. 2015. “Intrayear Household Income Dynamics and Adolescent School Behavior.” Demography 52: 45583. [DOI] [PubMed] [Google Scholar]
- Gennetian Lisa and Shafir Eldar. 2015. “The Persistence of Poverty in the Context of Financial Instability: A Behavioral Perspective.” Journal of Policy Analysis and Management 34(4): 904–936. [Google Scholar]
- Goel S, Obeng A, Rothschild D. 2016. “Non-Representative Surveys: Fast, Cheap, and Mostly Accurate.” Working Paper. [Google Scholar]
- Golden Lonnie. 2015. “Irregular Work Scheduling and Its Consequences” Economic Policy Institute Briefing Paper No. 394. [Google Scholar]
- Gottschalk Peter, and Moffitt Robert A.. 2009. “Household Risks: The Rising Instability of US Earnings.” Journal of Economic Perspectives 23(4): 3–24. [Google Scholar]
- Greenwood Shannon, Perrin Andrew, and Duggan Maeve. 2016. Social Media Update. Pew Research Center. [Google Scholar]
- Groves Robert. 2011. “Three Eras of Survey Research.” Public Opinion Quarterly 75(5): 861. [Google Scholar]
- Gundersen Craig and Ziliak James. 2014. “Childhood Food Insecurity in the U.S.: Trends, Causes, and Policy Options.” Future of Children 1–19. [Google Scholar]
- Halpern-Meekin Sarah, Edin Kathryn, Tach Laura, and Sykes Jennifer. 2015. It’s Not Like I’m Poor: How Working Families Make Ends Meet in a Post-Welfare World. Berkeley: UC Press. [Google Scholar]
- Halpin Brian. 2015. “Subject to Change Without Notice: Mock Schedules and Flexible Employment in the United States.” Social Problems 62: 419–438. [Google Scholar]
- Halpin Brian and Smith Vicki. 2017. “Employment Management Work: A Case Study and Theoretical Framework.” Work & Occupations 44(4) 339–375. [Google Scholar]
- Hannagan Anthony, and Morduch Jonathan. 2015. “Income Gains and Month-to-Month Income Volatility: Household evidence from the US Financial Diaries.” Working Paper. [Google Scholar]
- Hardy Bradley and Ziliak James. 2014. “Decomposing trends in Income Volatility: The ‘wild ride’ at the Top and Bottom.” Economic Inquiry 52(1): 459–476. [Google Scholar]
- Harknett Kristen, and Hartnett Caroline Sten. 2011. “Who Lacks Support and Why? An Examination of Mothers’ Personal Safety Nets” Journal of Marriage and Family 73(4): 861–875. [DOI] [PMC free article] [PubMed] [Google Scholar]
- Harknett Kristen, Schneider Daniel, and Luhr Sigrid. 2020. “Who Cares when Parents’ Work Schedules are Unpredictable?” (forthcoming) Social Problems. [DOI] [PMC free article] [PubMed] [Google Scholar]
- Hayes Sharon. 2003. Flat Broke with Children: Women in the Age of Welfare Reform. New York: Oxford. [Google Scholar]
- Heflin Colleen. 2016. “Family Instability and Material Hardship: Results from the 2008 Survey of Income and Program Participation.” Journal of Family Economic Issues 37: 359–372. [Google Scholar]
- Heflin Colleen M., and Iceland John. 2009. “Poverty, Material Hardship, and Depression.” Social Science Quarterly 90(5): 1051–1071. [DOI] [PMC free article] [PubMed] [Google Scholar]
- Heflin Colleen, Sandberg John, and Rafail Patrick. 2009. “The Structure of Material Hardship in U.S. Households: An Examination of the Coherence behind Common Measures of Well-Being” Social Problems 56(4): 746–764. [Google Scholar]
- Henly Julie, Kim Jaeseung, Sandstrom Heather, Pilarz Alejandra Ros, and Claessens Amy. 2017. “What Explains Short Spells on Child-Care Subsidies?” Social Service Review. 91(3): 488–533. [Google Scholar]
- Henly Julia, Shaefer Luke, and Waxman Ellen. 2006. “Nonstandard Work Schedules: Employer- and Employee-Driven Flexibility in Retail Jobs.” Social Service Review 80: 609–34. [Google Scholar]
- Henly Julia R., and Lyons Sandra. 2000. “The Negotiation of Child Care and Employment Demands among Low-Income Parents” Journal of Social Issues 56 (4): 683–706. [Google Scholar]
- Hill Heather and Ybarra Marcia. 2014. “Less-educated Workers’ Unstable Employment: Can the Safety Net Help?” Fast Focus. Institute for Research on Poverty. University of Wisconsin, Madison. [Google Scholar]
- Holtz-Eakin Douglas. 2016.“Reducing Poverty the Republican Way.” Pathways Winter (2016): 14–17. [Google Scholar]
- Iceland John and Bauman Kurt. 2007. “Income Poverty and Material Hardship: How Strong is the Association?” The Journal of Socio-Economics 36(2007):376–396. [Google Scholar]
- Jovanovic Boyan. 1979. “Firm-Specific Capital and Turnover.” Agrarian South: Journal of Political Economy 87(6): 1246–1260. [Google Scholar]
- Kalleberg Arne. 2013. Good Jobs, Bad Jobs: The Rise of Polarized and Precarious Employment Systems in the United States, 1970s to 2000s. New York: Russell Sage Foundation. [Google Scholar]
- Kalleberg Arne. 2009. “Precarious Work, Insecure Workers: Employment Relations in Transition.” American Sociological Review 74(1):1–22. [Google Scholar]
- Kalleberg Arne and Vallas Steven. 2018. “Probing Precarious Work: Theory, Research, and Politics.” Research in the Sociology of Work 31: 1–30. [Google Scholar]
- Karpman Michael, Zuckerman Stephen, and Gonzalez Dulce. 2018. Material Hardship among Nonelderly Adults and Their Families in 2017. Urban Institute. [Google Scholar]
- Lambert SJ, Fugiel P, and Henly JR. 2014. Precarious Work Schedules among EarlyCareer Employees in the US: A National Snapshot. University of Chicago. [Google Scholar]
- Lambert Susan. 2008. “Passing the Buck: Labor Flexibility Practices that Transfer Risk onto Hourly Workers.” Human Relations 61(9): 1203–1227. [Google Scholar]
- Leete Laura and Bania Neil. 2010. “The Effect of Income Shocks on Food Insecurity.” Review of Economics of the Household 8(4): 505–526. [Google Scholar]
- Donni Li, Paolo. 2019. “The unobserved pattern of material hardship and health among older Americans” Journal of Health Economics 65:31–42. [DOI] [PubMed] [Google Scholar]
- Mayer Susan and Jencks Christopher. 1989. “Poverty and the Distribution of Material Hardship.” The Journal of Human Resources XXIV(1):88–114. [Google Scholar]
- McCarthy Bill, Carter Angela, Jansson Mikael, Benoit Cecilia, and Finnigan Ryan. 2018. “Poverty, Material Hardship, and Mental Health among Workers in Three Front-Line Service Occupations.” Journal of Poverty 22(4): 334–354. [Google Scholar]
- McKernan Signe-Mary, Ratcliffe Caroline, and Iceland John. 2018. “The Effect of the US Safety Net on Material Hardship over the Past Quarter-Century.” Urban Institute Working Paper. [Google Scholar]
- Misra Joya and Walters Kyla. 2016. “All Fun and Cool Clothes? Youth Workers’ Consumer Identity in Clothing Retail.” Work & Occupations 43(3) 294–325. [Google Scholar]
- Moffitt Robert and Ribar David. 2009. Variable Effects of Earnings Volatility on Food Stamp Participation. Technical Report. Contractor and Cooperator Report No. 52. USDA. [Google Scholar]
- Morduch Jonathan and Schneider Rachel. 2014. “Spikes and Dips: How Income Uncertainty Affects Households.” U.S. Financial Diaries Project. Working Paper. [Google Scholar]
- Morduch Jonathan and Siwicki Julie. 2017. “In and Out of Poverty: Episodic Poverty and Income Volatility in the US Financial Diaries.” Social Service Review 91(3): 390–420. [Google Scholar]
- Morris Pamela, Hill Heather, Gennetian Lisa, Rodrigues Chris, and Wolf Sharon. 2015. “Income Volatility in U.S. Households with Children: Another Growing Disparity between the Rich and the Poor?” IRP Working Paper No. 1429–15. [Google Scholar]
- Mullainathan Sendhil, and Shafir Eldar. 2013. Scarcity: Why Having Too Little Means So Much. New York: Henry Holt & Company. [Google Scholar]
- Mullinix KJ, Leeper TJ, Druckman JN, and Freese J. Forthcoming. “The Generalizability of Survey Experiments.” Journal of Experimental Political Science. [Google Scholar]
- Mykerezi Elton; Mills Bradford. 2010. “The Impact of Food Stamp Program Participation on Household Food Insecurity.” American Journal of Agricultural Economics 92(5): 1379–1391. [Google Scholar]
- Osterman Paul and Schulman Beth. 2011. Good Jobs America: Making Work Better for Everyone. New York: Russell Sage Foundation Press. [Google Scholar]
- Perrin Andrew. 2015. “Social Networking Usage: 2005–2015.” Pew Research Center. [Google Scholar]
- Pilkauskas Natasha, Currie Janet, and Garfinkel Irv. 2012. “The Great Recession, Public Transfers, and Material Hardship.” Social Service Review 86(3): 401–427. [DOI] [PMC free article] [PubMed] [Google Scholar]
- Schneider Daniel and Harknett Kristen. 2019a. “Consequences of Routine Work-Schedule Instability for Worker Health and Well-Being.” American Sociological Review 84(1): 82–114. [DOI] [PMC free article] [PubMed] [Google Scholar]
- Schneider Daniel and Harknett Kristen. 2019b. “What’s to Like? Facebook as a Tool for Survey Data Collection.” Sociological Methods & Research. [DOI] [PMC free article] [PubMed] [Google Scholar]
- Schneider Daniel and Harknett Kristen. 2019c. It’s About Time: How Work Schedule Instability Matters for Workers, Families, and Racial Inequality. The Shift Project Research Brief. IRLE. UC Berkeley. [Google Scholar]
- Scott Ellen K., London Andrew S., and Hurst Allison. 2005. “Instability in Patchworks of Child Care When Moving from Welfare to Work.” Journal of Marriage and Family 67 (2): 370–386. [Google Scholar]
- Sen Amartya. 1979. “Issues in the Measurement of Poverty.” Scandinavian Journal of Economics 81(2): 285–307 [Google Scholar]
- Short Kathleen. 2005. “Material and Financial Hardship and Income-Based Poverty Measures in the USA.” Journal of Social Policy 34(1): 21–38. [Google Scholar]
- Smith Tom. 2013. “Survey-Research Paradigms Old and New.” International Journal of Public Opinion Research 25(2): 218–229. [Google Scholar]
- Tucker-Seeley Reginald D., Li Yi, Subramanian SV, and Sorensen Glorian. 2009. “Financial Hardship and Mortality among Older Adults Using the 1996–2004 Health and Retirement Study.” Annals of Epidemiology 19(12): 850–857. [DOI] [PMC free article] [PubMed] [Google Scholar]
- Wang W, Rothschild D, Goel S, and Gelman A 2015. “Forecasting elections with non-representative polls.” International Journal of Forecasting 31(3): 980–991. [Google Scholar]
- Williams Christine. 2006. Inside Toyland: Working, Shopping, and Social Inequality. Berkeley: UC Press. [Google Scholar]
- Wolfe Julia, Jones Janelle, and Cooper David. 2018. “Fair Workweek” Laws Help more than 1.8 Million Workers. Washington D.C.: Economic Policy Institute report. [Google Scholar]
- Wood Alex. 2018. “Powerful Times: Flexible Discipline and Schedule Gifts at Work.” Work, Employment, and Society 32(6) 1061–1077. [Google Scholar]
- Wood Alex. 2020. Despotism on Demand: Discipline and Power in the Flexible Workplace. New York: Cornell University Press. [Google Scholar]
- Zhang Baobao Matto Mildenberger, Howe Peter D., Marlon Jennifer, Rosenthal Seth, and Leiserowitz Anthony. 2017. “Quota Sampling Using Facebook Advertisements Can Generate Nationally Representative Opinion Estimates.” Working Paper. [Google Scholar]
Associated Data
This section collects any data citations, data availability statements, or supplementary materials included in this article.