

Abstract

Widespread deposition of siliciclastic sediments with consequent alternations between fine-grained siltstones and shales versus coarse-grained sandstones in the north Western Desert of Egypt provides an archive for mid-Cretaceous sea-level oscillations. This study presents elemental geochemical data as well as palynofacies and palynomorph components of upper Albian reservoirs in the Abu Gharadig Basin, north Western Desert. During the mid-Cretaceous, the studied area is located in the transition zone between the fluvio-deltaic and shallow marine settings at the southern margin of the Tethys Ocean. Thirty rock cutting samples were collected from the Kharita Formation and analyzed for major and trace elements, total organic carbon, and palynological composition. These data, together with geophysical gamma ray log values and lithological composition, allowed us to reconstruct the changes in relative sea level at this time in the framework of a third-order transgressive–regressive (T–R) sequence stratigraphic model. Palynomorph composition, represented by a fairly diverse assemblage of terrestrial plant spores and pollen grains versus marine dinoflagellate cysts and other microplankton, was employed along with the variation in the particulate organic matter composition. Chemical proxies, including Si, Ti, and often K and Fe, and their ratios normalized to Al, as well as the carbonate content and the Sr/Ca ratio, provided significant stratigraphic variations with respect to sea-level changes. The above proxies allowed for the subdivision of the studied reservoir intervals into three T–R sequences.
1. Introduction
The mid-Cretaceous was a significant period for global long-term sea-level rising, which occurred with a peak transgression from approximately 90 m during the early Albian to as high as 185 m at the Albian–Cenomanian boundary transition1,2 (Figure 1). This low-order/high-magnitude transgression is reflected in the southern margin of the Tethys Ocean by flooding in northern Africa, which extended beyond the southern borders of Egypt by the Late Cretaceous.3 A short-term sequence stratigraphic framework, principally of fourth and third orders, and the related sea-level oscillations and reconstructions are fundamental for the assessment of local to regional processes that triggered deposition of sediments in the southern Tethys. A typical example is represented by the siliciclastic deposits of the Kharita Formation in the Abu Gharadig Basin, which is one of the best reservoir intervals throughout the north Western Desert of Egypt (Figure 2). The Abu Gharadig rift basin is considered as one of the giant hydrocarbon basins that is an excellent target for optimal hydrocarbon exploration activities in Egypt.4 It contains excellent petroleum systems with significant organic matter-rich source rock and reservoir intervals capable of generating large volumes of hydrocarbons.
Figure 1.

Global species diversity of dinoflagellate cysts during the Cretaceous with respect to the eustatic sea-level curve of Haq.2 The used geological time scale is referred to Gradstein et al.67
Figure 2.

Regional Geology map of central and northern Egypt, showing the major structural features of the Western Desert and the location of the BED 2–3 well within the western block of the Mid Basin Arc, Abu Gharadig Basin (modified after EGPC4).
Several studies have investigated the Kharita Formation in the Abu Gharadig Basin as well as in other neighboring basins for its depositional environments, organic matter characterization and hydrocarbon generation potential,5−11 and petrophysical assessment and structural evolution.12−14 However, only limited studies addressed the sequence stratigraphy and sea-level changes during the deposition of the Kharita Formation, those in the Gindi15 and in the West Beni Suef basins,16 located to the east of the Abu Gharadig Basin (Figure 2).
The current study focused on the upper part of the Kharita Formation with its thick siliciclastic succession for the reconstructions of relative sea-level changes and application of sequence stratigraphy. The implication of sequence stratigraphy for hydrocarbon exploration and exploitation is widely accepted in the petroleum industry.3,17−23 Sequence stratigraphic interpretations and reconstructions in terms of systems tracts and bounding surfaces based on integrating palynofacies and palynomorph composition, geochemical composition (e.g., major and trace elements), and geophysical data such as wireline logs(e.g., gamma ray, neutron, and density logs) are widely acknowledged as a reliable approach.23−31 A third-order transgressive–regressive (T–R) sequence stratigraphic model was used in this study to divide the upper part of the Kharita Formation into distinctive systems tracts in response to relative sea-level fluctuations.
The Kharita Formation was investigated with a detailed focus on the late Albian oceanic anoxic event 1d by addressing biostratigraphy, assessing the depositional paleoenvironment, and evaluating the redox conditions and role of sediment fluxes based on palynofacies analysis and palynomorph composition as well as inorganic and isotope geochemistry.11 Therefore, the present study aims to (1) employ the palynofacies and palynomorph composition along with the geophysical gamma ray log data and the lithological characteristics of the Kharita Formation to reconstruct the relative sea-level fluctuations and subdivide them into distinctive systems tracts and stratigraphic sequences and (2) compare the sequence stratigraphic reconstructions based on the major and trace elemental geochemical composition to the results obtained from the palynofacies and palynomorph composition.
2. Regional Geological and Stratigraphic Settings
In northeastern Africa, where the Abu Gharadig Basin is located, active rifting events started in the Middle Jurassic in response to the spreading of the central Atlantic and activation of the Alpine Orogeny.32 These events resulted in a left lateral drift of Africa versus Europe and thus the deepening of the Tethys Ocean.33 Consequently, the maximum activity of the Alpine movement during the Early Cretaceous resulted in the development of NW-SE to WNW-ESE tensile stresses in northern Egypt with multiple phases of rifting and the formation of numerous hydrocarbon basins.33 During the Cenomanian, the closure of the Tethys was initiated. Subsidence in the northern basins and further tensile stresses were active at this time, which triggered the formation of two listric, E-W trending growth faults surrounding the Abu Gharadig Basin from the southern and northern edges32 (Figure 2). During the Turonian, multiple stresses likely related to the late Turonian Laramide Orogeny affected the northern and southern parts of Egypt. This triggered the uplift and basin inversion in many regions of the northern Western Desert, which are reflected in the sediments and structures of these areas as a result of the dextral drift of Africa versus Europe.34 By the Coniacian time, a major marine transgression occurred that led to the deposition of thick carbonate intervals.3,34 From the late Santonian to early Tertiary, the extensional activity terminated gradually in response to enhanced compressional tectonic activities and the closure of the Neo-Tethys Ocean that triggered the shortening of the North African continental margin and the formation of the Syrian Arc System.33,35 This was accompanied by a regression phase in the extreme northern Egypt that gave a way southward for enhanced clastic sedimentation across the Western Desert. During the Campanian–Maastrichtian, enhanced subsidence due to active extension took place across the NE African continental margin,36 which led to a strong transgression phase of sea level, and most of the Western Desert sedimentary basins received thick sequences of chalky limestones.34 Red Sea rifting during the Miocene resulted in NNW trending extensional faulting in the north Western Desert.4 Further structural details that controlled the Abu Gharadig Basin during the Cenozoic can be found in Mansour et al.3,10
The Abu Gharadig Basin is an east-west trending, asymmetrical half-graben basin.12 It is located in the north Western Desert of Egypt and has an area of ca. 18,000 km2, which extends between longitudes 27° 15′ and 29° 15′ E and latitudes 29° 00′ and 30° 15′ N (Figure 2). The Badr El Din-2 (BED-2) Field is one of the major gas fields in the north Western Desert, which is of great interest in this study. It has an area of ca. 170 km2 and is located to the west of the Badr El Din concession in the western part of the Abu Gharadig Basin. It encompasses the NE part of the Mid-Basin Arch forming an anticlinal sub-basin ridge (Figure 2).
The stratigraphic succession of the Abu Gharadig Basin is represented by a thick interval of siliciclastic and carbonate sequences of more than 9000 m. The drilled BED 2–3 well contains a thick interval from the middle Albian to the lower Miocene sediments spanning 2600 m and is represented by the upper Albian Kharita, the lower-middle Cenomanian Bahariya, the upper Cenomanian–lowermost Campanian Abu Roash, the Campanian–Maastrichtian Khoman, the Paleocene–middle Eocene Apollonia, the upper Eocene–Oligocene Daba’a, and the lower Miocene Moghra formations (Figure 3). During the deposition of the siliciclastic Kharita Formation, this part of the Abu Gharadig Basin acted as a shallow marine shelf with consequent alternations of fluvio-deltaic conditions and enhanced fluviatile influx.15 The Kharita Formation consists of cross-bedded, coarse-grained, light gray to white with high-porosity sandstone interbedded with siltstones and shale streaks (Figure 3). The drilled interval of the Kharita Formation represents only the upper part and is 165 m thick, extending from 2445 to 2610 m. The Kharita Formation is unconformably overlain by the Bahariya Formation, which is represented by marginal marine to shallow clastics.10,15
Figure 3.
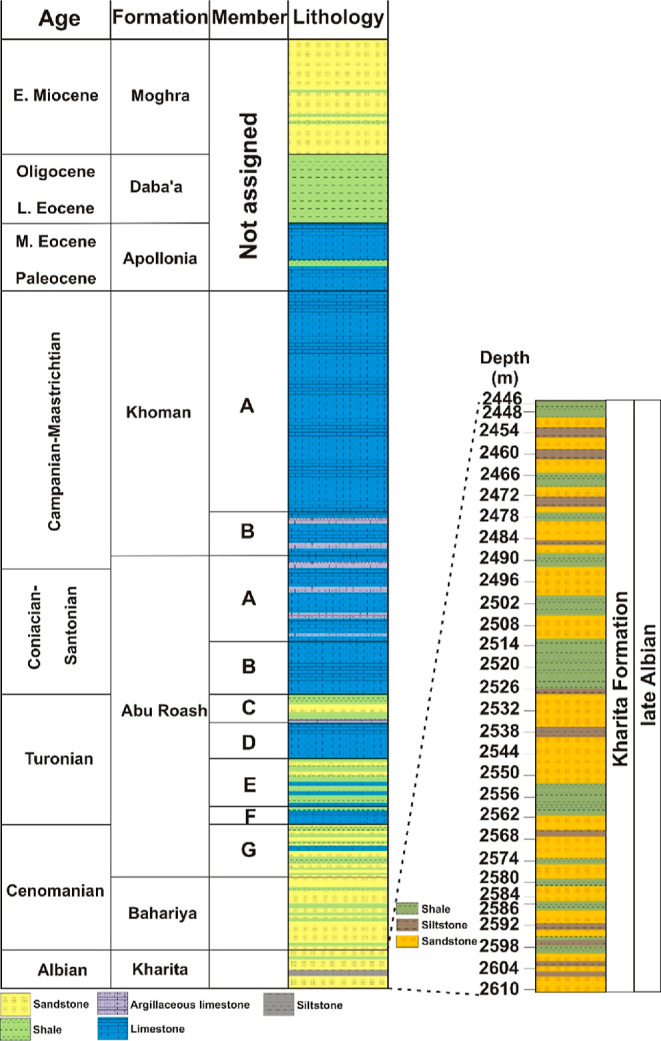
Lithostratigraphic chart of the BED 2–3 well drilled in the BED-2 gas field (left) and the expanded stratigraphic succession of the current study Kharita Formation (right).
3. Materials and Methods
The studied materials were taken from the BED 2–3 borehole drilled in the Mid-Basin Arc of the Abu Gharadig Basin in the north Western Desert, Egypt. The BED 2–3 well is located at latitudes 29° 53′ 13.23″ N and longitudes 27° 42′ 11.27″ E in the BED-2 Field (Figure 2). Thirty rock cuttings samples were obtained from the Kharita Formation reservoir at a spacing of 6 m (Figure 3). Additionally, the geophysical gamma ray log data and the lithological composite logs were also used.
3.1. Palynological Preparation
Twenty-eight samples of crushed rock cuttings were processed for their palynofacies analysis and palynomorph composition. An aliquot of 20 g of each sample was used to prepare the kerogen slides following the preparation techniques described by Wood et al.37 The organic residue of each sample was sieved in a 15 μm nylon mesh screen. The extracted organic particles were mounted on glass slides and covered by a coverslip (20 × 40 mm), whereby Canada Balsam was used as a mounting medium. Microscopic investigation was conducted using an Axioscope Zeiss (Model 4375) transmitted microscope and a digital camera (model ISH1000 Tucsen). All slides are stored in the Palynology laboratory of the Geology Department at Faculty of Science, Minia University, Egypt.
The terrestrial/marine (T/M) ratio is the sum of terrestrial palynomorph categories (e.g., pollen grains, spores, and freshwater algae) divided by marine palynomorph groups, including dinoflagellate cysts and microforaminiferal test linings (MFTLs).11,15,38−40 The recovered palynomorph groups from the Kharita Formation are reported in Appendix S1 (Supporting Information).
3.2. Elemental Geochemistry and Total Organic Carbon Analysis
For bulk rock geochemical analysis, an aliquot of 10 g of each sample was milled into powder and placed in a plastic cup after covering the base of the sample cup with a 25 mm diameter thin plastic wrap. Each sample was placed on the TRACER IV-SD of the Bruker AXS for quantitative measurements utilizing an energy-dispersive X-ray fluorescence device at the Department of Geology, Faculty of Earth Sciences, Geography and Astronomy, University of Vienna, Austria. A dual-mode method with two excitation energies was used to quantify the major elements of Al, Si, Ca, Mg, K, Ti, Fe, Mn, and P and the trace elements of Sr, Ba, Zn, Cu, Cr, Ni, Co, Zr, V, Mo, Ce, and Pb (Appendix S2). The low-energy mode(15 kV and 0.055 mA) was used to detect major oxides along with V, Ni, and Cr, whereas the high-energy mode (40 kV and 0.0065 mA with a filter of Ti 25 μm and Al 300 μm) was employed to measure the remaining elements. Internal standards for siliciclastic and carbonate mixtures were implemented using ICP–MS. Spectra were loaded into Bruker AXS calibration software, where the reference of each elemental concentration was evaluated from the concentration of the element that was calculated from the baseline-corrected peak heights as well as the inter-element slope from the energy-dispersive system. The analytical precision of multiple measurements was between 0.5 and 2%.
The total organic carbon (TOC) content of the Kharita Formation was measured using a LECO SC-632 analyzer. The analysis was conducted at the Advanced Technology Center, Core Laboratories in Houston, USA. The studied cutting samples of the Kharita Formation were contaminated by oil-based mud additives and/or migrated hydrocarbons. Thus, all samples were extracted prior to pyrolysis analysis using organic solvents such as dichloromethane/methanol (89:11 vol/vol). Then, an aliquot of 250–500 mg of each sample was pulverized into powder (∼100 μm). The carbonate content of each sample was removed by chemical treatment with HCl (25%) for 24 h with intermittent stirring. This was followed by rinsing the HCl solution by distilled water. The samples were dried in an oven to eliminate moisture and pyrolyzed at an oven temperature of ∼1100 °C, where the amount of released CO2 was measured by an infrared cell. The analytical precision rate is better than ±0.2%.41
4. Results
4.1. Palynomorph and Palynofacies Components
The recovered palynomorph composition is dominated by a fairly to well-preserved assemblage of plant spores and pollen grains with minor occurrences of dinoflagellate cysts and MFTLs. This assemblage is represented by 44 species that belong to 34 genera of various palynomorph categories (Appendix S1). The most recovered palynomorph taxa from the Kharita Formation (Figure 4) include the plant spores Cyathidites australis, Cyathidites minor, Crybelosporites pannuceus, Deltoidospora hallii, Deltoidospora diaphana, Cicatricosisporites sternum, Triplanosporites sinuosus, Todisporites minor, and Cicatricosisporites spp. and the pollen grains Araucariacites australis, Elatersporites klaszii, Elaterocolpites castelainii, Afropollis jardinus, Classopollis classoides, Inaperturopollenites dubius, Cycadopites sp., Cretacaeiporites densimurus, and Inaperturopollenites atlanticus. The dinoflagellate cysts, including Subtilisphaera pirnaensis, Subtilisphaera perlucida, Subtilisphaera sp., Circulodinium distinctum, Downiesphaeridium aciculare, Downiesphaeridium spp., Dinopterygium cladodes, Florentinia cooksoniae, Dinopterygium alatum, and Coronifera oceanica, are represented by frequent occurrences with relatively low abundances throughout the Kharita Formation. The dinoflagellate cyst diversity was calculated according to the Shannon Diversity Index (SDI). Within the Kharita Formation, the dinoflagellate cyst diversity ranged between 0.69 and 2.33, with an average of 1.44, except for one sample at a depth of 2580 m that did not show any diversity due to the rare occurrence of dinoflagellate cysts. The SDI values increase with an increase in the relative richness of dinoflagellate cyst records in a certain community.
Figure 4.

Various palynomorph categories recovered from the Kharita Formation in the BED 2–3 well. Each photograph is defined by the corresponding sample depth and slide label. The scale bar is equivalent to 20 μm. (1) Elaterosporites klaszii (Jardiné and Magloire) Jardiné (1967); sample depth 2568 m, slide A. (2) Deltoidospora halli Miner (1945); sample depth at 2460 m, slide B. (3) Crybelosporites pannuceus (Brenner) Srivastava (1977); sample depth at 2538 m, slide A. (4) Cyathidites australis Couper (1953); sample depth at 2484 m, slide A. (5) Cibotiumspora jurienensis (Filatoff, 1975); sample depth at 2478 m, slide B. (6) Triplanosporites sinuosus Thomson and Pflug 1953; sample depth at 2550 m, slide A. (7) Araucariacites australis Cookson ex Couper (1953); sample depth at 2466 m, slide A. (8) Afropollis jardinus (Brenner) Doyle et al. (1982); sample depth at 2574 m, slide B. (9) Inaperturopollenites dubius (Potonie and Venitz, 1934) Thomson and Pflug (1953); sample depth at 2454 m, slide A. (10) Classopollis classoides (Pflug) Pocock and Jansonius (1961); sample depth at 2604 m, slide A. (11) Cycadopites sp., sample depth at 2490 m, slide A. (12) Retimonocolpites variplicatus Schrank and Mahmoud (1998); sample depth 2502 m, slide B. (13) Subtilisphaera sp., sample depth at 2526 m, slide A. (14) Subtilisphaera perlucida (Alberti, 1959) Jain and Millepied (1973); sample depth at 2508 m, slide A. (15) Florentinia berran Below (1982); sample depth at 2472 m, slide A.
The particulate organic matter (POM) composition was abundant in all samples of the Kharita Formation, which provides significant information in terms of sea-level changes and sequence stratigraphy. The Kharita Formation is characterized by a moderate amount of amorphous organic matter (AOM) that fall in the range of 31.9–50.1% of the total POM composition (42.4% on average), except for the sample at a depth of 2580 m that contains the highest AOM content of 71.7% (Figure 5 and Table 1). The total phytoclast content varies between 25% and 63.9%, with slightly higher average values (52.4% of the total POM composition) than the AOM (Figure 5 and Table 1). The phytoclast content is dominated by slightly higher abundances of opaque wood particles (18.5–46.9% of the total POM composition, 26.6% on average) than translucent phytoclasts (4.3–35.4, 25.7% on average). Additionally, the opaque phytoclasts comprised mainly of large-size equidimensional wood particles (8–37% of the total POM composition, 18.8% on average) that are greater than 2 times the lath-shaped opaque particles (2–14.4, 7.8% on average). The translucent phytoclasts are characterized by prevalent abundances of wood tracheids with some contribution of cuticle particles. The recovered POM components of the Kharita Formation are illustrated in Figure 6. The pteridophyte spores show a moderate to high content that falls in the range of 23.9–78.4%, with an average of 52.8% of the total palynomorph composition. The pollen grains have low to moderate values (7.4–46.3, 29.5% on average), whereas the dinoflagellate cysts (1–16.2, 6.6% on average) and MFTLs are generally low (0.4–14.5, 3.2% on average) (Figure 5). The T/M ratio shows significant stratigraphic variations throughout the Kharita Formation between low and high values that are in the range of 3.1–39 (Figure 5 and Table 1).
Figure 5.

Quantitative stratigraphic distribution chart of various palynofacies and palynomorph components, including AOM, total phytoclast content, plant spores and pollen grains, marine microplanktons (dinoflagellate cysts and MFTLs), as well as geophysical gamma ray log, illustrating the changes in relative sea level and T–R stratigraphic sequences for the Kharita Formation in the BED 2–3 well, Abu Gharadig Basin.
Table 1. POM and Palynomorph Compositions of the Kharita Formation from the BED 2–3 Well in the Abu Gharadig Basin.
| sample depth (m) | total POM composition (100%) |
total palynomorph composition (100%) |
T/M ratio | |||||||||
|---|---|---|---|---|---|---|---|---|---|---|---|---|
| AOM (%) | palynomorphs (%) | Phytoclasts
(%) |
spores | pollen | dinocysts | MFTLs | FWA | |||||
| total | translucent | opaque |
||||||||||
| lath-shaped | equidimensional | |||||||||||
| 2446 | 42.9 | 4.0 | 53.1 | 34.5 | 10.6 | 8.0 | 58.8 | 32.7 | 5.3 | 1.6 | 1.6 | 13.4 |
| 2454 | 42.9 | 4.5 | 52.6 | 28.5 | 14.4 | 9.6 | 56.9 | 31.0 | 6.5 | 4.0 | 1.6 | 8.5 |
| 2460 | 44.4 | 4.2 | 51.4 | 28.3 | 12.2 | 10.9 | 61.6 | 30.3 | 5.1 | 1.5 | 1.5 | 14.2 |
| 2466 | 45.6 | 4.5 | 49.5 | 28.9 | 10.1 | 10.5 | 59.8 | 32.7 | 3.5 | 2.0 | 2.0 | 17.1 |
| 2472 | 46.0 | 3.4 | 50.7 | 28.2 | 11.1 | 11.4 | 60.7 | 29.3 | 5.8 | 1.6 | 2.6 | 12.6 |
| 2478 | 48.6 | 3.4 | 47.9 | 24.8 | 11.7 | 11.4 | 59.2 | 30.5 | 6.3 | 3.6 | 0.5 | 9.1 |
| 2484 | 40.9 | 5.1 | 54.1 | 30 | 10.5 | 13.6 | 64.3 | 29.1 | 5.3 | 0.4 | 0.8 | 16.4 |
| 2490 | 45.9 | 3.8 | 50.3 | 29.9 | 5.7 | 14.8 | 54.3 | 36.5 | 3.0 | 0.9 | 5.2 | 24.6 |
| 2496 | 41.9 | 4.2 | 53.9 | 28.2 | 7.1 | 18.5 | 62.9 | 27.9 | 2.1 | 0.4 | 6.7 | 39.0 |
| 2502 | 37.2 | 4.5 | 58.3 | 29.1 | 7.8 | 21.4 | 60.1 | 29.8 | 2.8 | 0.9 | 6.4 | 26.3 |
| 2508 | 37.6 | 5.0 | 57.3 | 31.5 | 6.8 | 19.0 | 43.2 | 36.3 | 10.7 | 0.9 | 9.0 | 7.7 |
| 2514 | 42.1 | 3.3 | 54.6 | 27.8 | 6.6 | 20.2 | 43.6 | 28.6 | 15.5 | 1.4 | 10.9 | 4.9 |
| 2520 | 40.6 | 2.1 | 57.3 | 30.4 | 8.0 | 18.9 | 45.9 | 31.5 | 13.1 | 1.4 | 8.1 | 5.9 |
| 2526 | 31.9 | 4.2 | 63.9 | 35.4 | 7.4 | 21.1 | 44.9 | 37.9 | 9.8 | 0.9 | 6.5 | 8.3 |
| 2532 | 48.9 | 4.0 | 47.1 | 23.6 | 6.2 | 17.4 | 52.3 | 31.9 | 11.6 | 0.5 | 3.7 | 7.3 |
| 2538 | 49.6 | 3.1 | 47.4 | 21.7 | 5.0 | 20.6 | 72.6 | 19.3 | 1.9 | 0.9 | 5.2 | 34.3 |
| 2544 | 50.1 | 2.9 | 47.0 | 18.7 | 6.3 | 21.9 | 73.2 | 16.1 | 2.4 | 0.5 | 7.8 | 33.2 |
| 2550 | 45.7 | 2.7 | 51.6 | 25.7 | 5.6 | 20.4 | 78.4 | 7.35 | 4.4 | 1.0 | 8.8 | 17.5 |
| 2556 | 39.9 | 4.8 | 55.3 | 24.7 | 5.8 | 24.7 | 71.4 | 22.2 | 2.5 | 1.0 | 3.0 | 28.0 |
| 2562 | 44.3 | 2.0 | 53.8 | 25.9 | 7.9 | 20.0 | 73.8 | 16.2 | 1.4 | 1.4 | 7.1 | 34.0 |
| 2568 | 35.7 | 6.0 | 58.3 | 30.7 | 6.7 | 21.0 | 31.4 | 34.0 | 16.2 | 5.2 | 13.1 | 3.7 |
| 2574 | 49.3 | 6.3 | 44.3 | 22.0 | 5.0 | 17.3 | 24.9 | 40.7 | 11.5 | 12.9 | 10.0 | 3.1 |
| 2580 | 71.7 | 3.3 | 25.0 | 4.3 | 2.0 | 18.7 | 44.9 | 36.7 | 2.04 | 6.1 | 10.2 | 11.3 |
| 2586 | 41.3 | 6.0 | 52.7 | 29.7 | 4.7 | 18.3 | 23.9 | 46.3 | 8.8 | 9.3 | 11.7 | 4.5 |
| 2592 | 43.7 | 5.7 | 50.7 | 20.7 | 8.3 | 21.7 | 32.9 | 30.0 | 7.7 | 14.5 | 15.0 | 3.5 |
| 2598 | 38.3 | 4.0 | 57.7 | 23.3 | 7.0 | 27.3 | 36.5 | 22.1 | 16.0 | 2.8 | 22.7 | 4.3 |
| 2604 | 37.0 | 5.3 | 57.7 | 18.0 | 8.7 | 31.0 | 46.0 | 30.0 | 1.0 | 4.0 | 19.0 | 19.0 |
| 2610 | 33.7 | 3.6 | 62.7 | 15.8 | 9.9 | 37.0 | 40.3 | 28.5 | 3.5 | 7.6 | 20.1 | 8.0 |
Figure 6.
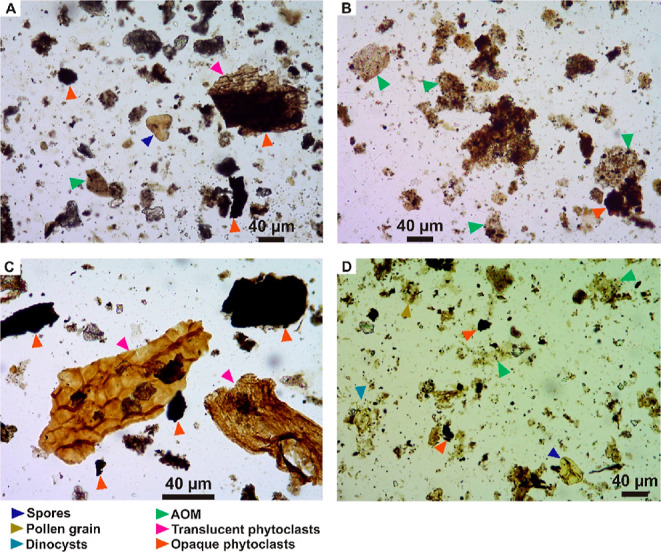
Palynofacies composition of various POM categories from samples at depths of 2610 m (A), slide A; 2574 m (B), slide A; 2526 m (C), slide B; and 2514 m (D), slide A.
Based on the above palynological characteristics of the Kharita Formation, the changes in relative sea level were reconstructed, whereby the studied interval was subdivided into three third-order T–R sequences (SQ 1–3, Figure 5). Stratigraphic sequence 1 (SQ 1) extends from 2604 to 2538 m at the lower part of the Kharita Formation (Figure 5), while SQ2 extends from 2538 to 2496 m at the middle part of the formation. SQ3 covers the upper interval of the Kharita Formation from 2496 to 2446 m. It is represented only by sediments of the transgressive systems tract (TST) and the absence of the regressive systems tract (RST) deposits (Figure 5).
4.2. Bulk Rock Geochemistry
To assess the role of the siliciclastic/detrital sediment flux within the depositional system, changes in major oxides and elemental ratios such as SiO2, Al2O3, Si/Al, Fe/Al, K/Al, Mn, CaCO3, and Sr/Ca are reported (Figure 7). The Kharita Formation shows high to moderate contents in SiO2 and Al2O3 that fall in the ranges 31.5–63.8 and 2.7–17.5%, respectively. The carbonate content is significantly low and falls in the range 0.8–7.9% (2.6% on average). The Si/Al ratios vary between 2.4 and 14.9 with an average value of 6.8 (Figure 7). The highest Si/Al ratios are recorded within the lower interval of the Kharita Formation (Figure 7). The Fe/Al ratios are variable and range between 0.3 and 1.4 (0.8 on average). The K/Al ratios are in the range 0.78–0.11 (0.31 on average). The Sr/Ca ratio is highly variable (152.5–2182.9) with an average value of 897.7. The Mn profile shows continuous alternations within the Kharita Formation (0.14–0.07, 0.096% on average). Besides, all samples of the Kharita Formation were plotted using the SiO2–Al2O3–CaO ternary diagram (Figure 8). This plot shows that all samples plot around the SiO2–Al2O3 line.
Figure 7.

Chemostratigraphic distribution chart of TOC content (wt %), geophysical gamma ray log, and various major and trace elemental composition and their ratios normalized to Al from the Kharita Formation in the BED 2–3 well, Abu Gharadig Basin.
Figure 8.
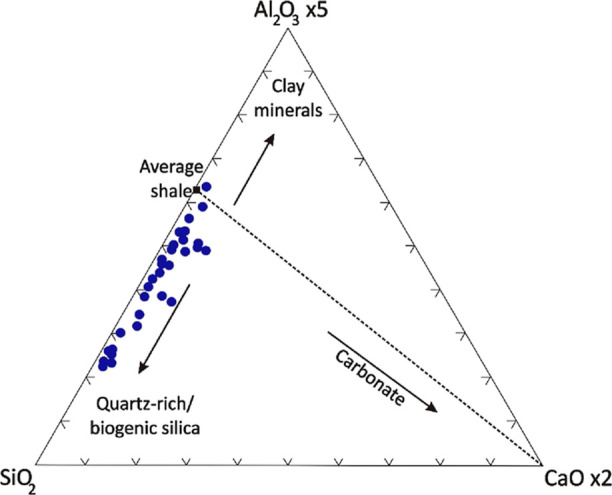
Ternary diagram of SiO2-5*Al2O3-2*CaO illustrating lithological differences within the Kharita Formation in the BED 2–3 well. All samples scatter toward a mixing line between the average shale61 and SiO2–Al2O3 line with minor content of the carbonate fractions.
5. Discussion
5.1. Age Assignments
Since the Albian–Cenomanian times in the northern basins of Egypt attested to fluvio-deltaic to shallow marine conditions, the sedimentary successions deposited were dominated mainly by mixed siliciclastic with minor carbonate rocks. This led to unfavorable conditions for a plethora of calcareous nannofossils and foraminiferal assemblages that could provide robust age calibrations, and therefore, the age control of the Kharita sequences is still a matter of debate. Due to the nature of cutting rock samples used in this study, the first downhole occurrence was used to avoid caving problems from upsection and provide a reliable age assessment of the Kharita Formation.
The studied succession of the Kharita Formation is characterized by the occurrences of index sporomorphs taxa, such as Crybelosporites pannuceus, Afropollis jardinus, Elaterocolpites castelainii, Elaterosporites klaszii, Cretacaeiporites densimurus, Concavissimisporites punctatus, and Trilobosporites laevigatus. Generally, Cretacaeiporites densimurus, Trilobosporites laevigatus, and Concavissimisporites punctatus are the most important marker taxa used to assess the age control of the Kharita Formation. This is because the other marker taxa have their top occurrences between the middle and early Cenomanian.15,23,42−45
Cretacaeiporites densimurus is recorded in most samples of the Kharita Formation. It was first reported by Schrank and Ibrahim42 within the foraminiferal-dated early–mid Cenomanian zone 5. Later, Ibrahim46 recorded this species from the late Albian–early Cenomanian of the Western Desert of Egypt. Additionally, Deaf et al.45 recorded this species within the pollen grain-dated late Albian–early Cenomanian zone 2 from the Abu Tunis 1× borehole in the Matruh Basin. Recently, Mansour and Tahoun15 defined a late Albian–early Cenomanian based on the common occurrence of C. densimurus in the Gindi Basin, Egypt.
Trilobosporites laevigatus appears in the topmost samples of the Kharita Formation. This species is commonly reported with a topmost occurrence from the middle–late Albian in the northern basins of Egypt.42,46 However, recent palynostratigraphic investigations indicated that the highest occurrence of T. laevigatus is consistent with the late Albian–early Cenomanian age in the northern Western Desert.15,44,45 The first downhole occurrence of Concavissimisporites punctatus appears in the middle part of the Kharita Formation from 2490 to 2562 m (Appendix S1). The top occurrence of this species is reported within the late Albian age in the adjoining northern basins of Egypt15,48 and the Western Portuguese Basin in Portugal.49 This indicates that the interval between 2446 and 2484 m that includes the co-occurrence of C. densimurus and T. laevigatus and the absence of C. punctatus might have an age not older than the late Albian–early Cenomanian, whereas the lower interval (from 2490 to 2610 m) that encompasses the former three marker taxa has an age of late Albian.
5.2. Approach Used for Sequence Stratigraphic Model Reconstructions
Deposition during the mid-Cretaceous (late Albian) took place during active tectonism and initiation of a major transgression phase that inundated marginal areas of northern Africa.33 Based on palynofacies and palynomorph analyses, the Kharita Formation was deposited under successive oscillations between fluvio-deltaic to marginal and shallow marine environments.11 The sedimentary record of the Kharita Formation is principally dominated by siliciclastic sediments that showed cyclic alternations between coarse-grained sandstones and siltstones and shales (Figure 3). As a result, the T–R sequence stratigraphic model was used following the third-order approach to subdivide the Kharita Formation into distinctive stratigraphic units. This led to a better understanding of the production potential of the Kharita Formation reservoirs and prediction of probable source rock intervals.
The T–R sequence model consists of the TST that occupies deeper marine sediments, followed by the RST that represents shallower marine sediments.18,20 The RST is commonly used to include sediments accumulated during the highstand and/or lowstand phases of sea level.22 Two stratigraphic surfaces bound a T–R sequence, which are the maximum flooding surface (MFS) and the maximum regressive surface (MRS).50 The TST sediments are bounded at the top by a MFS and at the base by a MRS and/or a subaerial unconformity surface.19,21,22 The MRS usually occurs during a full cycle of relative sea-level change in response to a change in local to regional tectonic activities and/or eustacy.
The geophysical data of gamma ray, neutron, and density logs are widely implemented to detect the lithological facies variations with respect to the sediment characteristics of grain size distribution, grain density, and interstitial pores. High values of gamma ray readings indicate abundant fine-grained particles, such as silt- and shale-rich facies, whereas low values characterize coarse-grained sandstones and/or shale-free facies such as limestones and marls.51 In siliciclastic sedimentary sections, most MRSs are identified by a strong decline in gamma ray log values as well as prevalent abundance of coarse-grained sediments, such as sandstone, compared to the underlying units.23,52 However, in the case when sandy intervals are absent, the MRS is located at the base of the shallowest/coarsest facies next to a sandstone, such as a siltstone. Subsequently, the MFS are usually plotted at or close to the maximum values of the gamma ray log that are consistent with finest facies associations, such as shale-rich intervals.
5.3. Sequence Stratigraphy Based on Palynofacies and Palynomorph Components
Variation in POM can be used as a reliable indicator to reconstruct changes in relative sea level and related stratigraphic sequences and systems tracts.3,15,23,24,38,39,53,54 Additionally, palynofacies analysis and various palynomorph categories are important not only in sequence stratigraphic interpretations but also for optimal hydrocarbon accumulation in reservoir rocks. The T/M ratio can be used to evaluate the relative input of riverine/terrestrial palynomorph versus the autochthonous marine categories. Here, it is implemented in this study as a reliable proxy to reveal inferences about sea-level oscillations and their subdivisions in the framework of the stratigraphic sequence, systems tracts, and bounding surfaces.3 Generally, high T/M ratios (>1) suggest a phase of sea-level fall with the highest value in a certain interval indicating the most regressive point of sea level that can be used to locate the MRS of a stratigraphic sequence and vice versa.
The TST sediments of SQ1 cover the lowermost part of the Kharita Formation and extend from 2604 to 2574 m. They are characterized by a gradual upward decline in the total phytoclast content from 57.7 to 44.3% compared to the increasing AOM content from 33.7 to 71.7% of the total POM composition. This is consistent with a relative decrease of the T/M ratio from high values of 19–3.1 (Figure 5), suggesting a phase of gradual sea-level rise from a MRS at a depth of 2604 m to the MFS of SQ1 at a depth of 2574 m.3,24 The relatively moderate abundances of the translucent phytoclasts (up to 29.7, 19.1% on average) indicate a close proximity to fluvio-deltaic/riverine sources during a slow phase of sea-level transgression. Although the large-sized equidimensional opaque phytoclasts gradually decrease from 37 to 17.3% (Table 1), they represent the highest proportions of the opaque phytoclasts compared to lath-shaped particles, suggesting the occurrence of regressive upper highstand and transgressive lower TST sediments.24,38 The marine phytoplankton, including dinoflagellate cysts and MFTLs, exhibits slightly increased values within the TST deposits (up to 11.5 and 12.9%, respectively, of total palynomorph composition). The relative increase of marine phytoplankton components is commonly known to bloom during phases of sea-level transgression up to the MFS.3,15,38,55−57 In most marine ecosystems, the SDI ranges from 1.5 to 3.5 and rarely reaches a value of 4.58 The calculated dinoflagellate cyst diversity based on the SDI shows a gradual increase within the TST from 0.69 to 1.44, confirming a rise in relative sea level. Despite the pteridophyte spore content being moderate within the TST sediments of SQ1, it showed a gradual upward decrease from 46 to 24.9% (Figure 5), suggesting a gradual deepening of relative sea level.15,24,38,54 Organic matter accumulation is controlled by sea level and thus sequence stratigraphy, whereby phases of high sea level specifically during the late stage of transgression at maximum flooding and early highstand are usually characterized by enhanced organic matter preservation.3,10,24,59 A typical example can be seen at depths of 2562 m and 2556 m within the TST of the SQ1, which showed the highest TOC content (ca. 1.5 wt % on average) throughout the Kharita Formation.47
Sediments of the RST exhibit a gradual decline in the dinoflagellate cyst content (from 11.5 to 1.9% at depths from 2568 to 2538 m), the dinoflagellate cyst diversity (SDI from 1.47 to 1.04), and MFTLs (from 12.9 to 0.9% of the total palynomorph composition), revealing a phase of relative sea-level fall up to maximum regression where the MRS is positioned.3,15,24,38,54,56 Additionally, a drastic increase in the T/M ratio, from 3.7 near the MFS of SQ1 to a maximum value of 34.3 at a depth of 2538 m, is seen (Figure 5). These values of the T/M ratios indicate a significant regression of relative sea level up to maxima, where the MRS of this sequence is located.15,39,54 The phytoclast content increased more than twice within the RST sediments from 25 to 58.3% compared to the relative decrease of the AOM content from 71.7 to 49.6% of the total POM content. This reveals a phase of enhanced input of fluviatile/terrigenous material at shallow shelf conditions.3,23,24,53 Additionally, the equidimensional opaque phytoclasts are still the dominant component compared to lath-shaped opaque particles, which increased slightly from 17.3 to 21.9% of the total POM composition (Table 1). This indicates the occurrence of a relative sea-level fall up to a minimum, whereby the MRS is predicted at a depth of 2538 m.24 The translucent phytoclast content shows a minor oscillation toward moderate values with an average of 24.6% of the total POM composition, which indicates an active fluvial influx during a phase of sea-level fall. This is consistent with a significant increase of the pteridophyte spores from 24.9 to 72.6% of the total palynomorph composition, represented mainly by Cyathidites australis, Cyathidites minor, Crybelosporites pannuceus, Deltoidospora diaphana, and Deltoidospora hallii (Appendix S1). The former spores are growing in areas of wet biotopes and freshwater lakes under enhanced warm-humid tropical–subtropical climatic conditions,43,60 suggesting the proximity to enhanced fluvio-deltaic sources and deposition during a fall of relative sea level.11,15,23,24,40 Similar trends were also observed in the adjoining Gindi Basin by Mansour and Tahoun,15 where the relative increase of these pteridophyte spores taxa was reported throughout the RST sediments with maximum percentages consistent with the MRSs.
The TST sediments of SQ2 extend from 2538 to 2514 m, which are characterized by moderate relative abundances of the AOM and total phytoclast contents with only minor changes in their values. The AOM content decreased from 49.6 to 42.1%, whereas the phytoclast content increased from 47.4 to 54.6% of the total POM content. Besides, the large-sized equidimensional opaque phytoclasts are approximately 3 times higher than lath-shaped opaque particles with average values of 19.6 and 6.6%, respectively (Table 1). These combined proxies likely indicate enhanced contribution of allochthonous terrigenous components during deposition in high-energy shallow marine conditions.24 Additionally, sediments of the TST of this sequence showed a significant fall in the T/M ratios from 34.3 at the bottom of the TST to 3.9 at the top (Figure 5), suggesting a maximum transgression of the relative sea level. This is in agreement with the relative abundance of the skolochorate and proximochorate dinoflagellate cysts, such as the Oligosphaeridium complex, Downiesphaeridium aciculare, Downiesphaeridium spp., C. distinctum, and D. cladodes, which increased drastically from 1.9 to 15.5% of the total palynomorph composition, revealing a long-term transgression of sea level up to MFS.3,56,57 Additionally, the calculated dinoflagellate cyst diversity showed a cyclic pattern within SQ2, which gradually increased from 1.04 to 2.3, reinforcing a rise of relative sea level up to maxima at the location of the MFS.3 A significant rise in the gamma ray log readings toward the maximum values is recorded at depth intervals from 2526 to 2514 m, underpinning a maximum transgression and deepening of the relative sea level.23 In contrast, a remarkable decrease in the plant spore content from 72.6 to 43.6% is consistent with a slight increase in the pollen grain content from 19.3 to 28.6%, indicating a phase of sea-level rise.15,24,38,54 The pollen content of the TST sediments is characterized commonly by the sphaeromorph forms, such as the Inaperturopollenites group, Classopollis classoides, and Araucariacites australis (Figure 4). Generally, the sphaeromorphs pollen content tends to decrease in high-energetic, shallow water column conditions compared to a significant increase toward deeper settings of a basin, which is consistent with a phase of relative sea-level rise.3,24
The RST sediments of SQ2 span the interval from 2514 m to 2496 m. The TST sediments are characterized by a significant rise of the T/M ratios from 4.9 at a depth of 2514 m, where the MFS is located, to a maximum value of 39 at a depth of 2496 m (Figure 5). This indicates a substantial contribution of terrestrial organic components during a maximum regression phase of relative sea level, where the MRS is indicated.15,39,54 This is consistent with a decrease in the gamma ray log values due to the vertical change of facies from shales to sandstones with respect to the relative sea-level fall. The AOM and total phytoclasts content remained stable toward moderate average values of 39.7 and 56%, respectively, supporting enhanced influx of coarse-grained silty and sandy particles dominated by terrigenous organic components at times of sea-level regression.15,38,54 The translucent phytoclasts (29.2% on average) are the dominant component of the total phytoclasts, followed by equidimensional opaque particles (19.8% on average), whereas the lath-shaped opaque phytoclasts are the lowest (7.1% on average), suggesting the occurrence of regressive highstand sediments.24,38 Additionally, there is a relative rise of the plant spore content from 43.6 to 62.9% of the total palynomorph composition (Figure 5). The spore content of this systems tract is dominated by Cyathidites australis, Cyathidites minor, Crybelosporites pannuceus, Deltoidospora diaphana, and Deltoidospora hallii, indicating a short duration of transport and proximity to active fluvio-deltaic source during a regressive phase of relative sea level.23,24,53 The pollen grain content remained stable toward the moderate average values of 30.7% of the total palynomorph content; however, Afropollis jardinus is one of the abundant species compared to sphaeromorphs pollen (Appendix S1). The angiosperm pollen species A. jardinus generally indicates more local coastal humidity settings,6 which is consistent with the relative sea-level fall. A typical example was also observed by Mansour and Tahoun15 within the Cenomanian Bahariya Formation from the neighboring Gindi Basin. On the contrary, the relative abundance of dinoflagellate cysts drastically decreased from 15.5 to 2.1% at the MRS (Figure 5). The same holds true for the dinoflagellate cyst diversity, which exhibited a significant decrease from 2.33 to 1. Additionally, the MFTL content is generally low within the RST sediments of SQ2, but it exhibits a gradual decrease from 1.4 to 0.4% of the total palynomorph composition, reinforcing a phase of sea-level fall3,24,38,56 (Figure 5).
The TST sediments of SQ3 extend from 2496 to 2454 m, which observed successive oscillations between moderate and high values in the gamma ray log due to change in facies between shales, siltstones, and sandstones (Figure 5). The T/M ratios exhibited a gradual decrease from the highest values of 39 at the MRS to 8.5 at 2454 m, indicating significant enhancement of autochthonous marine constituents during a phase of relative sea-level rise up to the MFS. Although the plant spore content within the TST is high, it showed a slight decrease from 62.9% at the MRS of the SQ2 to 56.9% at the MFS of the SQ3 (Figure 5). Besides, the pollen grain and dinoflagellate cyst contents exhibited a slight increase from 27.9 to 31% and from 2.1 to 6.5% of the total palynomorph composition, respectively, suggesting a phase of relative sea-level rise.3,56,57 The dinoflagellate cysts are dominated by chorate and proximochorate gonyaulacoids, such as the O. complex, Florentinia mantellii, C. oceanica, Downiesphaeridium aciculare, and C. distinctum, which inhabited in deeper, open marine conditions,3,56,57 compared to the peridinioid Subtilisphaera sp. that favor shallow coastal to shallow marine conditions.3 Therefore, the relative increase of the chorate and proximochorate gonyaulacoids is consistent with a relative sea-level rise. A similar trend was observed by Mansour et al.3 from the Coniacian–Santonian distal neritic sequences of the Abu Roash A Member, where gonyaulacoids increased throughout the TST to maximum values around the MFS. The MFTLs and dinoflagellate cyst diversity increased from 0.4 to 4.03% and from 1 to 2.22, underpinning the proposition that the MFS is situated at a depth of 2454 m. The AOM and total phytoclast contents are moderate, both of which showed minor fluctuations around the average values of 50% of the total POM content (Figure 5). However, the equidimensional opaque phytoclasts drastically decreased within the TST sediments from 18.5 to 8% compared to a significant increase of the lath-shaped opaque particles from 5.7 to 14.4% that are commonly known to predominate in more distal marine conditions, reinforcing deposition at times of relative sea-level rise23,24,38,53 (Table 1). Mansour and Tahoun15 conducted palynological and palynofacies analyses on the upper Albian–Cenomanian sediments of the Kharita and Bahariya formations from the neighboring Gindi Basin, located to the east of the Abu Gharadig Basin. They indicated that the uppermost part of the Kharita Formation contained one third-order sequence following the T–R model, which can be correlated with the current study SQ3 of the Kharita Formation. This is because both sequences from the two sedimentary basins contained a plethora of terrestrial palynomorphs, principally spores and pollen grains, and wood phytoclasts. This palynofacies similarity supports the presence of similar environmental conditions such as deposition in proximity to fluvio-deltaic sources and also to marginal shallow marine areas in both sedimentary basins at this time, thus suggesting a phase of regional sea-level fall in the southern Tethys during the late Albian.
5.4. Sequence Stratigraphy Based on Elemental Geochemistry
The relative abundances of specific major and trace elements and their ratios, such as Si, Al, Ca, Sr, Mn, and Fe, are linked to changes in sea level because of their fluctuation within a sequence stratigraphic framework.3,26−31 Therefore, the bulk geochemical composition of the Kharita samples relied on to reconstruct sea-level changes and systems tracts.
An increase in siliciclastic fluxes leads to a significant contribution of detrital and clay mineral-associated elements, such as Al, Si, Ti, Zr, K, and Fe, into a depositional system. The poor correlations between Al and Si (R2 = 0.1) and Al and Ca contents (R2 = 0.08) reveal that the Kharita Formation consists mainly of varying proportions of quartz, clay minerals, and carbonate components. This is indicated by the SiO2–Al2O3–CaO ternary plot (Figure 8), whereby most samples plot directly below the line of average shale,61 mostly at the line of SiO2–Al2O3 components due to the low carbonate content. The scatter of samples is induced principally by varying quartz (detrital and biogenic) and clay contents, indicating varying composition of the Kharita Formation between siltstone, shale, and sandstone versus minor contribution of carbonates.
Si/Al ratios varied significantly within the Kharita Formation with average values of 6.8, which is higher than that of average shale of Upper Continental Crust (UCC, 4.33) and about twice of the Post-Archaean Australian Shale (PAAS, 3.32).62 The coincident peaks in SiO2 and Si/Al ratio provide evidence of a regressive sea-level phase that is interpreted to trigger deposition of sand- and silt-rich sediments with enhanced contents of quartz and heavy minerals. Decreasing SiO2 (from 58.2 to 44.4%) and Si/Al ratios (from 12.4 to 3.8) compared to increasing Al2O3 contents (from 3.7 to 10.7%) accompany a long-term sea-level rise up to the MFS of the SQ1 (Figure 7). This was followed directly by reverse trends in the three end members within RST sediments and low gamma ray log values, with SiO2 (63.8%) and Si/Al maxima (12.7) were consistent with Al2O3 minima (2.4%), thus indicating a long-term sea-level fall that is characterized by a MRS at the top of the SQ1 (Figure 7). The interval from 2538 to 2514 m showed a gradual decrease in the SiO2 (63.8–35.3%) and Si/Al ratios (12.7–3.3), whereas the Al2O3 content increased slightly (2.3–6.6%). Values of these parameters are consistent with a long-term sea-level highstand associated with increased input of silt- and clay-size particles and increased gamma ray values up to maxima, all of which are coincident with the MFS. Another cycle of increasing values in SiO2 and Si/Al (from 2508 to 2496 m) followed by decreasing values (from 2496 to 2454 m) characterizes regressive to transgressive phases of relative sea level, which were accompanied by deposition of the RST and TST sediments of SQ2 and SQ3, respectively (Figure 7). A reverse pattern in Al2O3 can be seen in the sediments of these RST and TST for the former sequences, providing additional support and in agreement with the reconstructed sea-level changes at this time. The peaks in SiO2 and Si/Al are consistent with the lowest gamma ray log values and deposition of quartz-rich facies, which coincided with the MRS of the SQ2. On the contrary, the peaks in Al2O3 content are compatible with the moderate gamma ray values and deposition of silt-rich facies, which coincided with the MFS of SQ3 (Figure 7).
Fe/Al and K/Al ratios are commonly used to trace the occurrence of clay mineral-associated elements and detrital fluxes.11,63 The Fe/Al ratios exhibit similar trends to the Si/Al profile, and to some extent the K/Al ratios (Figure 5). The moderate correlations between Al and K (R = 0.51) and Fe (R = 0.41) indicate that both are largely associated with the clay fraction. The Fe/Al ratio is moderate (0.3–1.4) within the Kharita Formation, whereby decreasing trends in the Fe/Al ratio generally occur within the TSTs with minimum values at the MFSs, such as the MFSs of SQ1, SQ2, and SQ3. Several peaks in Fe/Al ratios are reported within the RST and MFSs of the lowermost part of the Kharita Formation as well as SQ1 and SQ2.
Strontium in marine environments is characterized by a complex geochemistry and is controlled by ecological and biological factors that control its partitioning.64 The relative abundance of Sr is predominant in pelagic–hemipelagic carbonate ecosystems. Seawater Sr/Ca ratios are characterized by an insensitive behavior to secular variations in weathering input fluxes.65 Thus, platform versus pelagic carbonate production rates as well as sea-level changes control short-term variations in Sr/Ca ratios.27 Rapid sea-level rise in particular may trigger large short-term decreases in seawater Sr/Ca ratios.65 The Sr/Ca profile of the Kharita Formation displays three short-term cyclic patterns that broadly correspond to the T–R sequences SQ1–SQ3 (Figure 7). Sr/Ca minima generally span the main parts of the TST of the proposed sequences, with minimum values close to, but not essentially coincident with, MFSs. Typical examples can be seen at MFSs of SQ1 and SQ3. The opposite is true for seawater Sr/Ca maxima that are identical for the upper parts of the RSTs and the overlying TSTs with maximum values close to and/or coincident with the MRSs, for example, the MRS of SQ1.
The Mn content in sediments is commonly controlled by enhanced terrigenous input of siliciclastic/detrital material. Like the Sr habitat, the Mn geochemistry is rather complex due to its association with carbonate fractions, clay minerals, oxyhydroxides, and organic matter.26,29,31 Generally, a long-term rise of the Mn content is consistent with sea-level transgression and packages of decreased Ti and Si. Usually, MFSs can be indicated following broad peaks in the Mn content. For the Kharita stratigraphic sequences, the Mn profile showed an increase toward the average values of 0.09% at depths from 2584 to 2574 m, where the MFS of SQ1 is located. Similar examples of the long-term rise in the Mn content are observed during the deposition of the TST sediments of SQ2 and SQ3 with maximum values coincident with the MFSs (Figure 7). On the contrary, a gradual long-term decrease of the Mn content up to the minimum value at 2538 m is coincident with the MRS of SQ1.
Of note, the geochemical composition of elemental proxies and their ratios within systems tracts and sequence stratigraphic bounding surfaces are in good agreement with the earlier inferences from palynofacies and palynomorph composition.3,28 A typical example can be seen within the TST sediments and MFS of SQ1–SQ3, whereby the relative decrease of the Si/Al, K/Al, and Sr/Ca contents (Figure 7) are consistent with the relative increase of dinoflagellate cyst and MFTL contents versus decreased plant spore content and T/M ratio (Figure 5). Other examples are observed in RST sediments up to MRS of SQ1 and SQ2, where SiO2, Si/Al, Fe/Al drastically increase with respect to Mn decrease (Figure 7), all of which are accompanied by maximum values of the T/M ratio and pteridophyte spore content versus minimum values of dinoflagellate cyst content and diversity (Figure 5).
5.5. Application of Sequence Stratigraphy in Petroleum Exploration
The application of sequence stratigraphic analysis in the petroleum industry is significantly intertwined, which assists in predicting the distribution of conventional reservoir-bearing and/or probable source rock intervals. This can adequately be implemented especially in cases of fine to coarse siliciclastic facies associations, such as the Kharita Formation in the BED 2–3 well. During the late stage of a RST and the early stage of a TST, coarse-grained sandy and silty facies are deposited, which could potentially form high-quality reservoir rocks.66 Additionally, phases of TSTs are characterized by a gradual rise of the relative sea level, which is consistent with the deposition of fine-grained sediments, such as fine silts and clays. As a result, condensed sections can be developed, which are characterized by an enhanced concentration of organic matter and/or authigenic minerals such as glauconite, phosphorite, and iron oxides accumulated during a prolonged episode of sea-level highstand.2,59 Therefore, condensed sections rich in organic carbon concentration can be linked to optimize petroleum exploration for potential source rock intervals. They are usually defined by their relatively thick intervals with high gamma ray values, especially in cases of organic-rich mudstones.23
In this context, the sequence stratigraphic interpretations were used to predict the occurrence of two condensed sections within the Kharita Formation that may be potential source rock intervals. The first condensed section occurs at 2552–2562 m directly after the MFS of SQ1 (Figure 5), revealing deposition at times of sea-level highstand. It is characterized by significantly high gamma ray values and fair to good TOC content (1.2 wt % on average). The second condensed section occurs at a depth from 2511 to 2526 m that was deposited during a transgressive phase of sea-level rise to the MFS of SQ2 (Figure 5). It is dominated by the highest gamma ray values throughout the Kharita Formation with average TOC values of 1.3 wt %. On the contrary, coarse-grained sandstones in the lower part of the succession were deposited during a phase of sea-level lowstand around the MRS that underlies SQ1. This interval is the major conventional reservoir for hydrocarbon (mainly gas) production in the BED-2 field due to significantly high neutron log versus density log values (composite log of the BED 2–3 well), thus strengthening the notion of being an excellent reservoir.
6. Conclusions
Based on the integration between major and trace elemental geochemistry, palynofacies and palynomorph compositions, and gamma ray log of the siliciclastic Kharita Formation in the BED 2–3 well in the petroliferous Abu Gharadig Basin, the significant concluding points can be summarized as follows:
The palynofacies and palynomorph compositions, including AOM, total phytoclasts, plant spores and pollen grains, dinoflagellate cysts and their diversity calculated using the SDI, MFTLs, and the T/M ratios, were used to compare the elemental geochemical results of the reconstructed sea-level changes and related subdivision of the stratigraphic sequences within the Kharita Formation. The relative increase of the dinoflagellate cyst and their diversity and MFTLs indicated the phases of sea-level rise, whereby their maximum values were consistent with the MFSs and vice versa. High values in the T/M ratio, pteridophyte spores, and total phytoclast contents indicated the phases of sea-level regression compared to low values that defined the phases of sea-level transgression. Overall, these palynofacies and palynomorph data led to reconstruct the changes in relative sea level, which were subdivided into three third-order T–R sequences.
Trends of major and trace elemental geochemistry such as SiO2 and ratios of Si/Al, Fe/Al, K/Al, Sr/Ca, and Ti/Al were reported and discussed, whereby the relative increase in their values indicated enhanced terrigenous input of coarse-grained particles during phases of sea-level regression and a decrease in values accompanied by phases of sea-level transgression. In contrast, CaCO3 and Mn exhibited a reverse pattern compared to the former geochemical proxies, where their relative increase was indicative of a long-term sea-level rise and vice versa. The use of major oxide and elemental ratios indicated consistent results in reconstructing cycles of the relative sea-level change, which are in agreement with the palynological investigations for the Kharita Formation.
Elemental geochemistry was not always consistent with palynofacies and palynomorph calibration, and thus, it can be used more confidently for reconstructing long-term changes of sea level rather than short-term oscillations.
Acknowledgments
We thank the Egyptian General Petroleum Corporation (EGPC) in Cairo, Egypt, for the permission to obtain cutting rock samples and electrical and composite logs of the studied interval from Bedr-Eldin Petroleum Company. This work was funded by Researchers Supporting project number (RSP2022R455), King Saud University, Riyadh, Saudi Arabia. We thank two anonymous reviewers who provided insightful comments that enhanced this manuscript. We would express our sincere gratitude to Krishna Ganesh (Coeditor of ACS Omega) and Mohamed Mahmoud (Associate Editor) for the way of handling the original and revised copies of the paper.
Supporting Information Available
The Supporting Information is available free of charge at https://pubs.acs.org/doi/10.1021/acsomega.2c03154.
Various palynomorph groups of counted taxa and elemental geochemistry data of the measured samples of the Kharita Formation (XLSX)
The authors declare no competing financial interest.
Supplementary Material
References
- Conrad C. P.The solid Earth’s influence on sea-level. Geol. Soc. Am. Bull. 2013, 125, ( (7−8), ), 1027−1052. 10.1130/B30764.1 [DOI] [Google Scholar]
- Haq B. U. Cretaceous eustasy revisited. Glob. Planet. Change 2014, 113, 44–58. 10.1016/j.gloplacha.2013.12.007. [DOI] [Google Scholar]
- Mansour A.; Gentzis T.; Wagreich M.; Tahoun S.; Elewa A. Short-Term Sea Level Changes of the Upper Cretaceous Carbonates: Calibration between Palynomorphs Composition, Inorganic Geochemistry, and Stable Isotopes. Minerals 2020, 10, 1099. 10.3390/min1012109. [DOI] [Google Scholar]
- EGPC (Egyptian General Petroleum Corporation). Western Desert, Oil and Gas Fields (A Comprehensive Overview). Cairo, Egypt, 1992; pp.431
- Felesteen A. W. Organic geochemical studies of some early cretaceous sediments, Abu Gharadig Basin, western Desert. Egypt. J. Afr. Earth Sci. 1998, 27, 115–127. 10.1016/S0899-5362(98)00050-5. [DOI] [Google Scholar]
- Schrank E.Paleoecological Aspects of Afropollis/Elateratespeaks (Albian-Cenomanian Pollen) in the Cretaceous of Northern Sudan and Egypt. In 11th Int. Proc., Palynological Congress; Goodman D. K., Clarke R. T., Eds.; Am. Assoc. Strat. Palynol. Found.: Houston, 2001, pp 201–210. [Google Scholar]
- Alsharhan A. S.; Abd El-Gawad E. A.. Geochemical Characterization of Potential Jurassic/cretaceous Source Rocks in the Shushan Basin, Northern Western Desert, Egypt. Egypt J. Petrol. Geol. 2008, 31. 10.1111/j.1747-5457.2008.00416.x. [DOI] [Google Scholar]
- Ela N. A.; Tahoun S. S.; Fouad T.; Mousa D. A.; Saleh R. Source rock evaluation of Kharita and Bahariya formations in some wells, North Western Desert, Egypt: visual palynofacies and organic geochemical approaches. Egypt. J. Petrol. 2018, 27, 455–465. 10.1016/j.ejpe.2017.07.009. [DOI] [Google Scholar]
- Gentzis T.; Carvajal-Ortiz H.; Tahoun S. S.; Deaf A.; Ocubalidet S. Organic facies and hydrocarbon potential of the early-middle Albian Kharita Formation in the Abu Gharadig Basin, Egypt, as demonstrated by palynology, organic petrology, and geochemistry. Int. J. Coal Geol. 2019, 209, 27–39. 10.1016/j.coal.2019.05.002. [DOI] [Google Scholar]
- Mansour A.; Gentzis T.; El Nady M.; Mostafa S. S.; Tahoun F. Hydrocarbon potential of the Albian-early Cenomanian formations (Kharita- Bahariya) in the North Western Desert, Egypt: A review. J. Petrol. Sci. Engin. 2020, 193, 107440. 10.1016/j.petrol.2020.107440. [DOI] [Google Scholar]
- Mansour A.; Gentzis T.; Carvajal-Ortiz H.; Tahoun S. S.; Wagreich M. Geochemistry and palynology of the upper Albian at the Abu Gharadig Basin, southern Tethys: Constraints on the Oceanic Anoxic Event 1d. Geol. J. 2020, 55, 6338–6360. 10.1002/gj.3810. [DOI] [Google Scholar]
- Bayoumi T.Synsedimentary tectonics and the distribution of Turonian sandstone reservoirs, Abu Gharadig basin, Western Desert, Egypt. Proceedings of the Egyptian General Petroleum Corporation 12th Petrol Expl. Prod. Con., 1994, pp 351–367.
- Sarhan M. A. Seismic delineation and well logging evaluation for Albian Kharita Formation, South West Qarun (SWQ) field, Gindi Basin, Egypt. J. Afr. Earth Sci. 2019, 158, 103544. 10.1016/j.jafrearsci.2019.103544. [DOI] [Google Scholar]
- Osman W.; Kassab M.; ElGibaly A.; Samir H. Petrophysical evaluation of sandstone gas reservoir using integrated well logs and core data for the Lower Cretaceous Kharita formation, Western Desert, Egypt. J. Petrol. Expl. Prod. Tech. 2021, 11, 3723–3746. 10.1007/s13202-021-01276-1. [DOI] [Google Scholar]
- Mansour A.; Tahoun S. S. Palynological and palaeoenvironmental analyses of the upper Albian-Cenomanian succession in Gindi Basin, Egypt: Implication for transgressive/regressive systems tracts. J. Afr. Earth Sci. 2018, 147, 603–622. 10.1016/j.jafrearsci.2018.07.007. [DOI] [Google Scholar]
- Shehata A. A.; El Fawal F. M.; Ito M.; Abdel Aal M. H.; Sarhan M. A. Sequence stratigraphic evolution of the syn-rift Early Cretaceous sediments, West Beni Suef Basin, the Western Desert of Egypt with remarks on its hydrocarbon accumulations. Arab. J. Geosci. 2018, 11, 331. 10.1007/s12517-018-3688-y. [DOI] [Google Scholar]
- Vail P. R.; Hardenbol J.; Todd R. G.. Jurassic unconformities, ChronoStratigraphy and sea level changes from seismic stratigraphy and BioStratigraphy In Interregional Unconformities and Hydrocarbon Accumulation, Schlee J. S., Ed.; Am. Assoc. Petrol. Geol. Memoir, 1984; Vol. 36, pp 129–144. [Google Scholar]
- Posamentier H. W.; Vail P. R.. Eustatic Controls on Clastic Deposition Ii-sequence and Systems Tract Models. In Sea Level Changes-An Integrated Approach; Wilgus C. K., Hastings B. S., Kendall C. G. St. C., Posamentier H. W., Ross C. A., Van Wagoner J. C., Eds.; Soci. Econ. Paleontol. Mineral.; Spec. Publ., 1988. [Google Scholar]
- Embry A. F.; Johannessen E. P. T.-R.. T-R sequence stratigraphy, facies analysis and reservoir distribution in the uppermost Triassic-Lower Jurassic succession, western Sverdrup Basin, Arctic Canada. In Arctic Geology and Petroleum Potential, Vorren T. O.; Bergsager E.; Dahl-Stamnes O. A.; Holter E.; Johansen B.; Lie E.; Lund T. B., Eds.; Vol. 2; Spec. Publ., Norwegian Petroleum Society (NPF), 1993; pp. 121–146. [Google Scholar]
- Emery D.Sequence Stratigraphy. In Sequence Stratigraphy; Emery D., Myers K., Eds.; Blackwell Science: Hoboken, NJ, 1996, pp 211–237. [Google Scholar]
- Catuneanu O. Sequence stratigraphy of clastic systems: concepts, merits, and pitfalls. J. Afr. Earth Sci. 2002, 35, 1–43. 10.1016/S0899-5362(02)00004-0. [DOI] [Google Scholar]
- Catuneanu O.; Galloway W. E.; Kendall C. G. St. C.; Miall A. D.; Posamentier H. W.; Strasser A.; Tucker M. E. Sequence stratigraphy: methodology and nomenclature. Newslet. Strat. 2011, 44, 173–245. 10.1127/0078-0421/2011/0011. [DOI] [Google Scholar]
- Mansour A.; Mohamed O.; Tahoun S. S.; Elewa A. M. T. Sequence stratigraphy of the Raha Formation, Bakr Oil Field, Gulf of Suez, Egypt: Insights from electrical well log and palynological data. J. Afr. Earth Sci. 2018, 139, 205–221. 10.1016/j.jafrearsci.2017.12.009. [DOI] [Google Scholar]
- Tyson R. V.Sequence-stratigraphical interpretation of organic facies variations in marine siliciclastic systems: general principles and application to the onshore Kimmeridge Clay Formation, UK. In Sequence Stratigraphy in British Geology; Hesselbo S. P., Parkinson D. N., Eds.; Geol. Soci.; Spec. Publ., 1996; Vol. 103, pp 75–96. [Google Scholar]
- MacRae R. A.; Fensome R. A.; Williams G. L. Fossil dinoflagellate diversity, originations, and extinctions and their significance. Can. J. Bot. 1996, 74, 1687–1694. 10.1139/b96-205. [DOI] [Google Scholar]
- Jarvis I.; Murphy A. M.; Gale A. S. Geochemistry of pelagic and hemipelagic carbonates: Criteria for identifying systems tracts and sea-level change. J. Geol. Soc. 2001, 158, 685–696. 10.1144/jgs.158.4.685. [DOI] [Google Scholar]
- Jarvis I.; Mabrouk A.; Moody R. T. J.; Murphy A. M.; Sandman R. I.. Applications of carbon isotope and elemental (Sr/Ca, Mn) chemostratigraphy to sequence analysis: Sea-level change and the global correlation of pelagic carbonates. In Geology of East Libya; Salem M. J., El-Hawat A. S., Eds.; Earth Sci. Soc. Libya: Tripoli: Libya, 2008, pp 369–396. [Google Scholar]
- Pearce M. A.; Jarvis I.; Tocher B. The Cenomanian-Turonian boundary event, OAE2 and palaeoenvironmental change in epicontinental seas: New insights from the dinocyst and geochemical records. Palaeogeogr., Palaeoclimatol., Palaeoecol. 2009, 280, 207–234. 10.1016/j.palaeo.2009.06.012. [DOI] [Google Scholar]
- Le Callonnec L.; Renard M.; De Rafélis M.; Minoletti F.; Beltran C.; Jan Du Chêne R. J. Evolution of the trace element contents (Sr and Mn) of hemipelagic carbonates from the Zumaia Paleocene section (Gipuzkoa, Spain): Implications for the knowledge of seawater chemistry during the Selandian. Bull. Soc. Geol. Fr. 2014, 185, 413–435. 10.2113/gssgfbull.185.6.413. [DOI] [Google Scholar]
- Wagreich M.; Koukal V.; Wagreich M.. The pelagic archive of short-term sea-level change in the Cretaceous: A review of proxies linked to orbital forcing. In Cretaceous climate events and short-term sea-level changes; Hart M., Sames B., Yilmaz I. O., Eds.; Geol. Soc. London, Spec. Publ., 2019, 498. [Google Scholar]
- LaGrange M. T.; Konhauser K. O.; Catuneanu O.; Harris B. S.; Playter T. L.; Gingras M. K. Sequence stratigraphy in organic-rich marine mudstone successions using chemostratigraphic datasets. Earth-Sci. Rev. 2020, 203, 103137. 10.1016/j.earscirev.2020.103137. [DOI] [Google Scholar]
- Wood D.The tectonic setting and structural evolution of the Abu Gharadig Basin, Western Desert of Egypt; Proceed. 7th Expl. Sem.: Cairo. EGPC, 1986, p 250. [Google Scholar]
- Guiraud R.; Bellion Y.. Late Carboniferous to Recent, Geodynamic Evolution of the West Gondwanian, Cratonic, Tethyan Margins. In The Tethys Ocean; Nairn A. E. M., Ricou L. E., Vrielynck B., Dercourt J., Eds.; Springer: Boston, MA, 1995. [Google Scholar]
- Said R.Cretaceous paleogeographic maps. In The Geology of Egypt; Said R., Ed., 1st ed.; Balkema: Rotterdam, 1990, pp 439–449. [Google Scholar]
- Issawi B.; El Hinnawi M.; Francis M.; Mazhar A.. The Phanerozoic geology of Egypt: A Geodynamic Approach. Egypt. Geol. Sur.; Spec. Pub., No.: Cairo, 1999; Vol. 76, p 462. [Google Scholar]
- Guiraud R.; Issawi B.; Bosworth W.; Cavazza W.. Phanerozoic history of Egypt and surrounding areas. In Peri-Tethys Memoir 6: Peri-Tethyan Rift/Wrench Basins and Passive Margins, Ziegler; Robertson A. H. F., Crasquin-Soleau S., Eds.; Paris, Mémoires du Muséum National d̵Histoire Naturelle, 2001, pp 469–509. [Google Scholar]
- Wood G. D.; Gabriel A. M.; Lawson J. C.. Chapter 3. Palynological techniques-processing and microscopy. In Palynology: Principles and Applications, Jansonius J.; McGregor D. C., Eds.; vol. 1. Am. Assoc. Strat. Palynol. Found., Dallas, 1996; pp. 29-50. [Google Scholar]
- Pittet B.; Gorin E. Distribution of sedimentary organic matter in a mixed carbonate-siliciclastic platform environment: Oxfordian of the Swiss Jura Mountains. Sedimentology 1997, 44, 915–937. 10.1046/j.1365-3091.1997.d01-58.x. [DOI] [Google Scholar]
- Schiøler P.; Crampton J. S.; Laird M. G. Palynofacies and sea-level changes in the middle Coniacian–late Campanian (Late Cretaceous) of the east coast basin, New Zealand. Palaeogeogr., Palaeoclimatol., Palaeoecol. 2002, 188, 101–125. 10.1016/S0031-0182(02)00548-5. [DOI] [Google Scholar]
- Mansour A.; Wagreich M.; Gentzis T.; Ocubalidet S.; Tahoun S. S.; Elewa A. M. T. Depositional and organic carbon-controlled regimes during the Coniacian-Santonian event: First results from the southern Tethys (Egypt). Mar. Petrol. Geol. 2020, 115, 104285. 10.1016/j.marpetgeo.2020.104285. [DOI] [Google Scholar]
- Carvajal-Ortiz H.; Gentzis T. Critical considerations when assessing hydrocarbon plays using Rock-Eval pyrolysis and organic petrology data: data quality revisited. Int. J. Coal Geol. 2015, 152, 113–122. 10.1016/j.coal.2015.06.001. [DOI] [Google Scholar]
- Schrank E.; Ibrahim M. I. A.. Cretaceous (Aptian-Maastrichtian) palynology of foraminifera-dated wells (KRM-1, AG-18) in northwestern Egypt. Selbstverlag Fachbereich Geowissenschaften; FU Berlin, 1995, Vol. 177. [Google Scholar]
- Mahmoud M. S.; Moawad A. M. Jurassic-cretaceous (Bathonian to Cenomanian) palynology and stratigraphy of the west Tiba-1 borehole, northern Western Desert, Egypt. J. Afr. Earth Sci. 2000, 30, 401–416. 10.1016/S0899-5362(00)00026-9. [DOI] [Google Scholar]
- El Beialy S.; El-Soughier M.; Mohsen S. A.; El Atfy H. Palynostratigraphy and paleoenvironmental significance of the Cretaceous succession in the Gebel Rissu-1 well, north Western Desert, Egypt. J. Afr. Earth Sci. 2011, 59, 215–226. 10.1016/j.jafrearsci.2010.10.007. [DOI] [Google Scholar]
- Deaf A. S.; Harding I. C.; Marshall J. E. A. Cretaceous (Albian-?early Santonian) palynology and stratigraphy of the Abu Tunis 1x borehole, northern Western Desert, Egypt. Palynology 2014, 38, 51–77. 10.1080/01916122.2013.828662. [DOI] [Google Scholar]
- Ibrahim M. I. A. Late Albian-middle cenomanian palynofacies and palynostratigraphy, Abu Gharadig-5 well, Western Desert, Egypt. Cret. Res. 2002, 23, 775–788. 10.1006/cres.2002.1027. [DOI] [Google Scholar]
- Tahoun S. S.; Mohamed O. Palynology and genetic sequence stratigraphy of the reservoir rocks (Cenomanian, Bahariya Formation) in the Salam Oil Field, north Western Desert, Egypt. Cret. Res. 2013, 45, 342–351. 10.1016/j.cretres.2013.06.004. [DOI] [Google Scholar]
- Sultan I. Z. Palynology of Albian-Cenomanian strata in Mersa Matruh well, Western Desert, Egypt. J. Afr. Earth Sci. 1987, 6, 665–675. 10.1016/0899-5362(87)90005-4. [DOI] [Google Scholar]
- Hasenboehler B.Thèse 3ème cycle. Étude paléobotanique et palynologique de l’Albien et du Cénomanien du Bassin Occidental Portugais au Sud de l’Accident de Nazaré (Province d’Estremadure); Univ. Paris, 1981; Vol. 6: Portugal [Google Scholar]
- Johnson J. G.; Murphy M. A. Time-rock model for Siluro-Devonian continental shelf, western United States. Geol. Soci. Am. Bull 1984, 95, 13492.. [DOI] [Google Scholar]
- Rider M. H.The geological interpretation of well logs, 2nd ed; Sutherland: Scotland, 2004, p 280. [Google Scholar]
- Krassay A. A. Outcrop and drill core gamma ray logging integrated with sequence stratigraphy: examples from Proterozoic sedimentary successions of northern Australia. J. Aust. Geol. Geophys. 1998, 17, 285–299. [Google Scholar]
- Batten D. J.Palynofacies analysis. In Fossil plants and Spores: Modern Techniques; Jones T. P., Rowe N. P., Eds.; Geol. Soci.: London, 1999, pp 194–198. [Google Scholar]
- Götz A. E.; Feist-Burkhardt S.; Ruckwied K. Palynofacies and sea-level changes in the Upper Cretaceous of the Vocontian Basin, southeast France. Cret. Res. 2008, 29, 1047–1057. 10.1016/j.cretres.2008.05.029. [DOI] [Google Scholar]
- Bujak J. P.; Williams G. L. Dinoflagellate diversity through time. Mar. Micropaleontol. 1979, 4, 1–12. 10.1016/0377-8398(79)90002-1. [DOI] [Google Scholar]
- Lister J. K.; Batten D. J. Stratigraphic and palaeoenvironmental distribution of Early Cretaceous dinoflagellate cysts in the Hurlands farm borehole, west Sussex, England. Palaeontgraphica, Abt. B 1988, 210, 9–89. [Google Scholar]
- Brinkhuis H. Late Eocene to Early Oligocene dinoflagellate cysts from the Priabonian type-area (Northeast Italy): biostratigraphy and paleoenvironmental interpretation. Palaeogeogr., Palaeoclimatol., Palaeoecol. 1994, 107, 121. 10.1016/0031-0182(94)90168-6. [DOI] [Google Scholar]
- Spellerberg I. F.; Fedor P. J. A tribute to Claude Shannon (1916-2001) and a plea for more rigorous use of species richness, species diversity and the ’Shannon-Wiener’ Index. Glob. Ecol. Biogeog. 2003, 12, 177. 10.1046/j.1466-822X.2003.00015.x. [DOI] [Google Scholar]
- Loutit T. S.; Hardenbol J.; Vail P. R.; Baum G. R.. Condensed Sections: The Key to Age Determination and Correlation of Continental Margin Sequences. Sea-Level Changes: An Integrated Approach; SEPM Society for Sedimentary Geology, 1988. [Google Scholar]
- Schrank E.; Mahmoud M. S. Palynology (pollen, spores and dinoflagellates) and Cretaceous stratigraphy of the Dakhla Oasis, central Egypt. J. Afr. Earth Sci. 1998, 26, 167. 10.1016/S0899-5362(98)00004-9. [DOI] [Google Scholar]
- Wedepohl K. H. Environmental influences on the chemical composition of shales and clays. Phys. Chem. Earth 1971, 8, 307. 10.1016/0079-1946(71)90020-6. [DOI] [Google Scholar]
- Taylor S. R.; McLennan S. M.. The continental crust: its composition and evolution; Blackwell: Oxford, 1985, p 312. [Google Scholar]
- Lyons T. W.; Werne J. P.; Hollander D. J.; Murray R. W. Contrasting sulfur geochemistry and Fe/Al and Mo/Al ratios across the last oxic-to-anoxic transition in the Cariaco Basin, Venezuela. Chem. Geol. 2003, 195, 131–157. 10.1016/S0009-2541(02)00392-3. [DOI] [Google Scholar]
- Schlanger S. O.Strontium Storage and Release During Deposition and Diagenesis of Marine Carbonates Related to Sea-Level Variations. In Physical and Chemical Weathering in Geochemical Cycles; Lerman A., Meybeck M., Eds.; Kluwer Academic: Dordrecht, The Netherlands, 1988, pp 323–339. [Google Scholar]
- Stoll H. M.; Schrag D. P. Sr/Ca variations in Cretaceous carbonates: raltion to productivity and sea level changes. Palaeogeogr., Palaeoclimatol., Palaeoecol. 2001, 168, 311–336. 10.1016/S0031-0182(01)00205-X. [DOI] [Google Scholar]
- Bowen D. W.; Weimer P.; Scott A. J.; Weimer P.. The relative success of siliciclastic sequence stratigraphic concepts in exploration: examples from incised valley fill and Turbidite systems reservoirs. In Siliciclastic sequence stratigraphy: Recent developments and applications; Posamentier H., Ed.; AAPG Memoir., 1993. [Google Scholar]
- Gradstein F. M.; Ogg J. G.; Schmitz M. D.; Ogg G. M.. The Geologic Time Scale, 1st ed.; Elsevier: Amsterdam, The Netherlands, 2012, p 1144. [Google Scholar]
Associated Data
This section collects any data citations, data availability statements, or supplementary materials included in this article.