

Abstract
To explore the diffusion law of harmful gases near the excavation face in tunnel construction on plateaus, select the optimal ventilation parameters, and improve the ventilation efficiency, Ansys Fluent was used to set the environmental parameters according to the highland, where the tunnel is located, and simulate and curve fit the diffusion phenomenon of CO and NO2 based on the fluid control equations and species transport model. The effects of air velocity, ventilation time, and duct position on the diffusion law of harmful gases were analyzed, from which the optimal ventilation conditions were selected, and the ventilation effects under the optimal conditions were compared with those under the original conditions. The study shows that after the fresh airflow passes through the outlet, part of it flows out along the tunnel wall toward the cave entrance, and the other part interacts with the return air to form a vortex; when the air supply speed is 10 m/s and the distance from the duct outlet to the excavation face is 25 m, the maximum concentration of harmful gases decreases by 92–99% after 20 min of ventilation compared with that before optimization and the smoke exhaust efficiency increases by 2.5% per minute.
1. Introduction
Low air pressure, low temperature, and low oxygen content are common phenomena of plateaus.1 Due to the influence of incomplete combustion, the blasting process near the excavation face will produce a large amount of toxic and harmful gases, whose concentration is several times that of the plain area.2 In addition, the diffusion of air molecules and the Brownian motion of particles on plateaus is slower than that in plain areas because of the low pressure and temperature, resulting in the diffusion of harmful gases with a certain degree of particularity, which undoubtedly increases the difficulty of removing exhaust and dust from construction tunnels.3 At present, there are many complex factors affecting the diffusion of harmful gases on plateaus. The interaction and coupling of various factors can inevitably lead to more abstract airflow diffusion. It is difficult to explore the spatial distribution characteristics of harmful gases in time after blasting.4 During tunnel ventilation, the wind speed is one of the most important factors affecting the diffusion of harmful gases. An excessive wind speed can affect an individual’s walking, increase the cost of ventilation, and easily cause secondary dust and noise pollution,5,6 and if the wind speed is too small, it can reduce the efficiency of ventilation, which can compromise the safety of the construction environment. Second, the harmful gas diffusion law in the tunnel is greatly affected by the time factor. The spatial distribution of harmful gases in different time periods is different.7,8 A long ventilation time is economically prohibiting;9 on the contrary, a short ventilation time causes the buildup of harmful gases that cannot be reduced to acceptable levels. The location of the air duct outlet also plays an important role in improving the efficiency of ventilation.10 If the position of the air duct outlet is too far away from the excavation face, it will result in low wind speed near the working face, and harmful gases will be difficult to discharge;11 while a too close position will result in a smaller wind flow section, which can carry less harmful gases and weaken the ventilation effect.12
In response to these problems, Ye13 established a calculation model of radon and blasting fume concentrations with ventilation time based on the law of conservation of mass and displacement ventilation theory and proposed a theoretical calculation method for the shortest ventilation time of blasting fume exhaust. Jiang14 tested the wind speed distribution experiment and obtained the wind flow field distribution characteristics near the excavation face and the recirculation zone according to a similar theory and similar experimental platform. Tan15 combined the gas–solid two-phase flow equation to derive the similarity criterion of the caving face and the influence of wind speed and moisture content on the distribution of dust from multiple sources of a fully mechanized caving face. Furthermore, Ding,16 Sun,17 Zhang,18 and others referred to the construction site and used Fluent to simulate the harmful gas and dust diffusion phenomenon near the excavation face and proposed an optimal scheme of underground engineering ventilation by comparing with the measured data. The above studies only investigated the wind flow and dust distribution law in plains with general conditions but did not further discuss the influence of different ventilation parameters on the diffusion law of blasting fume in the low-oxygen and low-pressure environment on the plateau.
In this paper, Ansys Fluent was used to simulate the distribution of the airflow field and the diffusion law of harmful gases with different ventilation times, different wind speeds, and different outlet positions of the air duct. The ventilation effects influenced by different parameters were compared, and the plateau environment characteristics19,20 and the basic theory of tunnel airflow were combined to determine the best ventilation conditions, which provides new insights and guidance for ventilation measures in tunnel construction sites.
2. Plateau Environment and Climate
2.1. Relationship Between Altitude and Atmospheric Pressure
The higher the altitude, the thinner the air, which forces the air pressure to drop. The air pressure in the same geographical location is less affected by the alternation of the seasons, and the range of change is very small, which can be ignored.21 There was a nonlinear relationship between altitude and air pressure, and the common laws of air pressure and altitude changes are shown in Table 1. The relational expression between the two is as follows
| 1 |
where pz is the atmospheric pressure at the altitude z, Pa, and z is the altitude, m.
Table 1. Atmospheric Pressure Corresponding to Different Altitudes.
| altitude (m) | air pressure (Pa) |
|---|---|
| 0 | 101.3 × 10³ |
| 500 | 95.4 × 10³ |
| 1000 | 89.8 × 10³ |
| 1500 | 84.6 × 10³ |
| 2000 | 79.7 × 10³ |
| 2500 | 74.5 × 10³ |
| 3000 | 69.96 × 10³ |
2.2. Relationship Between Altitude and Temperature
The air temperature decreases as the altitude rises.22 In general, for every 1 km increase in altitude, the average temperature drops by 5–7 °C. This can be calculated as follows
| 2 |
where tz is the temperature at altitude z, °C; tA is the temperature of the adjacent meteorological station, °C; gt is the temperature gradient, 0.5–0.7 °C/100 m; and ΔZ is the altitude difference between the altitude of Z and the adjacent meteorological station, m.
2.3. Relationship Between Altitude and Oxygen Content
Altitude has a significant influence on oxygen content.23 The volume of oxygen in the atmosphere is 21% under normal circumstances, but its mass content is negatively correlated with altitude,24 which can be calculated as follows
| 3 |
where ρV is the oxygen content in the atmosphere, kg/m3; T is the absolute temperature, K; p is the atmospheric pressure, Pa; and e is the partial pressure of water vapor, Pa.
3. Model Overview and Parameter Setting
3.1. Geometric Model and Meshing
We take a construction tunnel in Yunnan Province as an example. The construction tunnel is located in the Yunnan–Guizhou Plateau at an altitude of more than 2000 m. The annual average pressure is 75–80% of the sea level atmospheric pressure, and the oxygen content is approximately 18.3–20%. The total length of the tunnel is 8.4 km. It is a straight wall arch structure, with a vector height of 3 m and a span-to-vector ratio of approximately 1:3. The cross section of the tunnel is 10 m wide and 15 m high, and the distance between the air duct and the excavation face is 15 m. The diameter of the air duct is 1.8 m, and the method is press-in ventilation. The air velocity of the air outlet is 10 m/s and the position of the air duct is arranged, as shown in Figure 1. The ventilation time was set at 20 min. In keeping with the on-site construction situation, a 30 m tunnel from the excavation face was selected as the research object. To properly deal with the situation in the tunnel, we simplified the length, width, and height (30, 10, and 15 m, respectively) of the arch and used ICEM CFD to generate a simplified geometric model. The model topology was constructed for inspection after the geometric modeling was completed. We confirmed that the model was constructed correctly and continued to use ICEM CFD to mesh the geometric model with a hexahedral structure. After inspection, the minimum internal angle of the grid was greater than 18° and the quality of the grid was higher than 0.1, which met the calculation standards. The grid distribution after the division is shown in Figure 2.
Figure 1.

Geometrical model.
Figure 2.
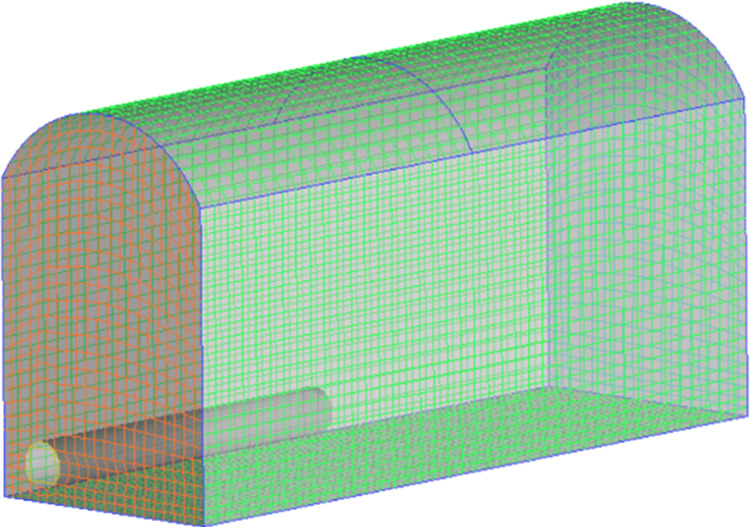
Grid partitioning.
3.2. Mathematical Model
Various processes near the tunneling face produce a large amount of toxic and harmful gases such as CO and NO2.25 With advancements in ventilation time, the dilution and discharge of toxic and harmful gases can be regarded as an unsteady fluid diffusion process.26
3.2.1. Basic Assumptions
Due to certain differences between the simulation and the actual working conditions, the following assumptions are made for the model under the premise that the error of the result is within an acceptable range:
-
(1)
The Mach number of the wind flow in the tunnel does not exceed 0.3, so all of the fluid in the tunnel can be regarded as subsonic incompressible flow.27
-
(2)
Assuming that any part of the inner wall of the tunnel has the same roughness and the gas temperature is higher after blasting, there is heat exchange with the air,28 so consider the energy exchange and use the energy equation.
-
(3)
Ignore the influence of obstacles and construction equipment in the tunnel on the flow of the wind flow field.
-
(4)
Assuming that the mixture of blasting fumes and harmful gases is evenly distributed in the throwing area after blasting, the concentration of harmful gas is the same anywhere in the tunnel.
-
(5)
The toxic and harmful gases produced after blasting include CO, NO2, SO2, CO2, and H2S,29 but most of the toxic and harmful gases have a very low concentration, which accounts for a relatively small amount and can be ignored. This article only focuses on CO and NO2.
3.2.2. Theoretical Equations of Airflow
The fluid flow is subject to the laws of conservation of physics. The harmful gas diffusion in the tunnel belongs to the species transport model without chemical reactions,30 and the Reynolds number of the fluid flow exceeds 8000, which belongs to the turbulent flow.31 Therefore, the continuity equation, momentum conservation equation, energy conservation equation, component transport equation, and the standard k–ε turbulent double equations are considered.
Continuity equation:
| 4 |
Momentum conservation equation:
| 5 |
| 6 |
Energy conservation equation:
| 7 |
| 8 |
In eqs 4–8, the meaning of each parameter is as follows: ρ is the fluid mass density, kg/m3; t is time, s; xi is the coordinate in the i direction, m; xj is the coordinate in the j direction, m; ui is the velocity of the fluid in the i direction, m/s; Sm is the source term, which is the mass added to the continuous phase from the dispersed secondary phase, the source term can also be any custom source term; p is the static pressure, Pa; τij is the stress tensor; and gi and Fi are the gravitational volume force and external volume force in the direction i, respectively. Fi encompasses other model-related source terms such as porous media and custom source terms; i is the internal energy, i = cpT, where cp is the specific heat capacity and T is the temperature; k is the heat transfer coefficient of the fluid; ST is the internal heat source of the fluid and the phase where the mechanical energy of the fluid is converted into thermal energy due to viscous action, sometimes referred to as ST as the viscous dissipation term; Ri is the chemical net production rate of the reaction product i; Si is the additional production rate; Yi is the mass fraction of component i; and Ji is the diffusion flux of component i.
The standard k–ε turbulent double equations are as follows
| 9 |
| 10 |
In eqs 9 and 10, k is the turbulent kinetic energy, J; ε is the dissipation rate of k, m2/s3; Gk is the production term of turbulent kinetic energy caused by the average velocity gradient; Gb is the turbulence caused by the buoyancy kinetic energy production term; YM is the production term of the compressible turbulent wave expansion on the overall dissipation rate; C1ε, C2ε, and C3ε are all constant terms; σk and σε are the turbulent Prandtl numbers of k and ε, respectively; and Sk and Sε are, respectively, the turbulent energy item and the turbulent energy dissipation rate source item.
3.3. Boundary Conditions and Parameter Settings
We imported the meshed model into Ansys Fluent and combined the actual situation to set the boundary conditions and model parameters, as shown in Tables 2 and 3, respectively.
Table 2. Boundary Condition Setting.
| boundary condition | setting |
|---|---|
| solver | pressure-based |
| time | transient |
| inlet boundary | velocity-inlet |
| outlet boundary | outflow |
| wall | standard wall function |
Table 3. Model Parameter Setting.
| model parameter | setting |
|---|---|
| species transport | on |
| energy | on |
| viscous | standard k–ε |
| hydraulic diameter | 1.8 |
| turbulent intensity | 3.627% |
| turbulent kinetic energy | 0.5 |
| turbulent dissipation rate | 0.314 |
| gauge pressure | 23 200 Pa |
| temperature | 292 K |
| oxygen content | 18% |
The formula of the hydraulic diameter DH is as follows
| 11 |
where A is the cross-sectional area of the flow, m2, and S is the perimeter of the fluid and solid foundation, m.
The formula of the turbulence intensity I is as follows
| 12 |
where u′ is the turbulent pulsation velocity, m/s, and u̅ is the average flow velocity, m/s.
The formula of the turbulent kinetic energy k is as follows
| 13 |
The formula of the turbulent energy dissipation rate ε is as follows
| 14 |
where l is the turbulence scale and k is the turbulent kinetic energy.
4. Discussion of Numerical Simulation Results
4.1. Distribution Law of Wind Flow Field
The diffusion of toxic and harmful gases is greatly affected by the wind flow field in the construction tunnel,32−34 and there is a certain relationship between the two parameters. Therefore, analyzing the wind flow field is of great significance for studying the diffusion of toxic and harmful gases.35,36 After a period of ventilation, the wind flow field gradually stabilized. Figure 3 shows the wind speed distribution vector diagram at the bottom of the tunnel (Y = 1.4 m) when the inlet wind speed was 10 m/s. Figure 4 shows the air streamline near the excavation face.
Figure 3.
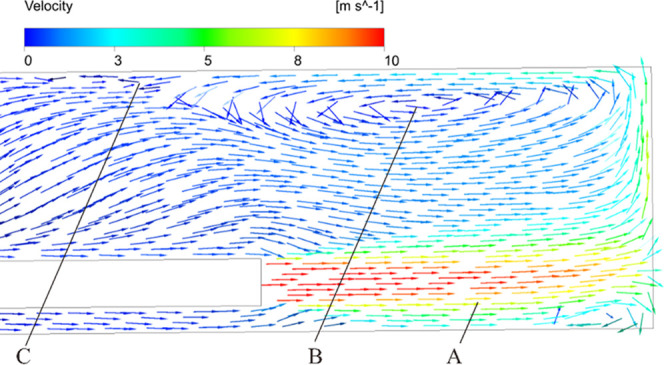
Air speed distribution near the excavation face (A, jet zone; B, vortex zone; C, reflux zone).
Figure 4.

Streamline of airflow near the excavation face.
Due to the gravitation between molecules and the relative motion between adjacent fluid layers, the speed difference is generated,37 resulting in friction within the fluid layers, so the airflow is viscous.38 Because of the low temperature, the molecular movement and the viscosity on the plateau were lower than that in the plain area. The layer with higher velocity cannot easily drive the layer with lower velocity, resulting in a smaller wind flow spreading section and a greater vortex phenomenon on the plateau.39 This phenomenon indirectly reduced the harmful gas discharge efficiency. As shown in Figures 3 and 4, the fresh airflow enters the tunnel from the air duct and shoots along the left side wall to the excavation face, forming zone A. In this area, the cross-sectional area of fresh air gradually expands. A nonuniform flow is formed, and an entrainment effect occurs with the original gas at the boundary,40 resulting in a gradual decrease in the wind speed. The average wind speed in this area was approximately 6.5 m/s. Upon reaching the excavation face, the wind was hindered by the excavation face and the speed continued to decrease to approximately 2.5 m/s. Subsequently, the wind flow rebound and changed its direction; a proportion of the wind flowed out along the wall to the entrance of the tunnel and gradually spread to the middle of the tunnel, forming the C area. The remaining proportion was entrained by the jet flow and returned to the excavation face with an average wind speed of approximately 0.6 m/s. At the same time, in the middle of the tunnel near the excavation face, due to the mutual influence between the inlet and the return winds,41 zone B was formed. There were obvious vortices in this area. The wind speed changed little here, but the airflow continued to swirl, making the discharge of dust and harmful gases more difficult.42
4.2. Influence of Different Inlet Wind Speeds on the Distribution of Toxic and Harmful Gases
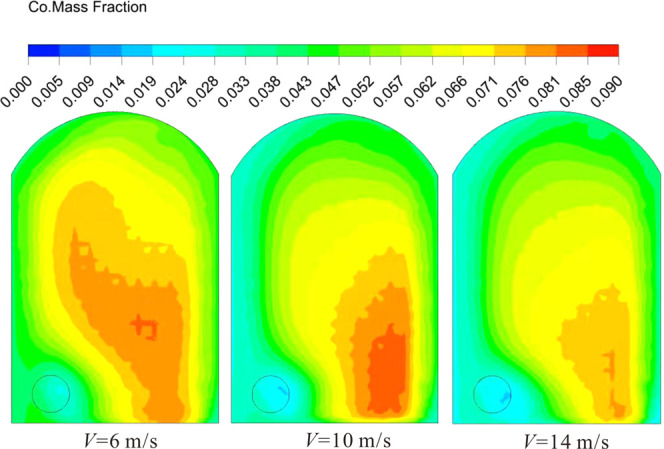
To study the influence of the wind speed V at the air duct inlet on the distribution of toxic and harmful gases, the air duct was set to a distance of 15 m from the excavation face, and the wind speed was set to 6, 10, and 14 m/s. We observed the distribution of harmful gas concentrations near the excavation face. According to the “Technical Guidelines for Railway Tunnel Construction Engineering” (TZ204-2008, written in Chinese), 15 min after blasting in nongas work areas, the blasting site should be patrolled to check the ventilation and other conditions. If there is no immediate danger, the staff can be allowed to enter. To explore the ventilation effect before and after the safety time of “15 min”, the CO and NO2 concentration distribution contours under different wind speeds at 1 and 20 min were compared and analyzed. The results are shown in Figures 5 and 6.
Figure 5.

Concentration distribution of harmful gases at different wind speeds after ventilating for 1 min.
Figure 6.

Concentration distribution of harmful gases at different wind speeds after ventilating for 20 min.
Figure 5 shows CO and NO2 concentration distribution contours at different wind speeds under the same ventilation conditions. After ventilating for 1 min, CO and NO2 began to be discharged at the tunnel exit along with the wind flow. Under three different wind speeds, CO and NO2 concentration distributions were obviously different. The gas concentration in front of the air duct continued to decrease as the wind speed increased. However, there was a slight difference in the concentration of the two harmful gases on the return air side. When the wind speed V was set to 6, 10, and 14 m/s, the CO concentrations on the return air side were 80.28, 69.58, and 62.08 mg/m3, and the NO2 concentrations were 0.532, 0.461, and 0.412 mg/m3, respectively. By comparing the two harmful gas concentration distribution contours under the three different wind speeds, it can be seen that the concentration distribution and diffusion law of CO and NO2 were roughly similar. Therefore, when the ventilation conditions are constant, the wind speed is higher and the removal of toxic and harmful gases is more efficacious.43
Figure 6 shows the CO and NO2 concentration distribution contours at different inlet wind speeds after ventilating for 20 min. It can be seen from the figure that the air environment near the excavation face was significantly improved, and the wind flow field distribution was basically stabilized. When the wind speed V was 6 m/s, the CO concentration near the excavation face was approximately 0.407–0.475 mg/m3 and the NO2 concentration was approximately 2.700 × 10⁻³–3.150 × 10⁻³ mg/m3. When the inlet wind speed V was 10 and 14 m/s, the CO concentration near the excavation face was approximately 6.256 × 10⁻⁴–6.754 × 10⁻³ mg/m3 and the NO2 concentration was approximately 4.147 × 10⁻⁶–4.477 × 10⁻⁵ mg/m3. As the wind speed increased, the concentrations of harmful gases decreased. At the same time, it can be seen from the figure that the higher the wind speed, the more obvious the improved effect of harmful gas accumulation in the vortex zone in the middle of the tunnel.
Table 4 shows the average airflow velocity and CO concentration at a distance of 1 m from the excavation face under different wind speeds after ventilating for 1 min. It can be seen from the table that the average wind speed V̅ near the excavation face was positively correlated with the wind speed V at the air duct outlet, and the CO average concentration was negatively correlated with the wind speed V at the air duct outlet. Figure 7 shows the CO concentration distribution near the excavation face after ventilating for 1 min. It can be seen from the figure that the higher the wind speed, the lower the CO concentration and the smaller the diffusion section. Therefore, it can be assumed that the greater the wind speed, the higher the exhaust efficiency of harmful gases. The “Technical Guidelines for Railway Tunnel Construction Engineering” (TZ204-2008) stipulates that the ventilation wind speed for full-face excavation should not be less than 0.15 m/s and not more than 6 m/s. Therefore, to ensure that the optimal wind speed is in compliance with the regulations, isokinetic diagrams of the wind flow distribution with three different wind speeds at a distance of 1 m from the excavation face were selected for comparison. As shown in Figure 8, the wind speed in front of the air outlet of the duct was higher, while the wind speed on the other side of the duct and in the middle of the tunnel was lower. When the wind speed V was 14 m/s, the wind speed near the tunneling face was relatively high, and the maximum speed was approximately 9 m/s, which exceeded the maximum wind speed specified in the “Technical Guide for Railway Tunnel Construction Engineering” (TZ204-2008). When V was 6 and 10 m/s, the maximum wind speeds near the tunneling face were approximately 3 and 5 m/s, respectively, which comply with the regulations. However, when V was 6 m/s, the wind speed near the heading face and the harmful gas exhaust efficiency were low, which led to an insignificant improved effect of the vortex phenomenon in the middle of the tunnel. Therefore, under the premise of complying with the relevant regulations, the ventilation effect was the best when the wind speed V of the air outlet was 10 m/s.
Table 4. Average Airflow Velocity Near the Driving Face and the Concentration of Harmful Gases.
| wind speed at air duct outlet V (m/s) | average wind speed near the tunneling face V̅ (m/s) | CO average concentration (mg/m3) |
|---|---|---|
| 6 | 0.83 | 67.42 |
| 10 | 2.12 | 58.64 |
| 14 | 3.67 | 49.38 |
Figure 7.
CO concentration distribution near the excavation face.
Figure 8.

Isovelocity of airflow distribution near the excavation face.
4.3. Influence of Different Ventilation Durations on the Distribution of Toxic and Harmful Gases
To study the influence of the ventilation duration (T) on the distribution of toxic and harmful gases in the tunnel, an air duct was set 15 m away from the excavation face and the wind speed was 10 m/s. The distribution of CO and NO2 concentration in the tunnel were analyzed at 1, 10, and 20 min, respectively. Figure 9 shows the concentration distribution of CO and NO2 at different times.
Figure 9.

Concentration distribution of harmful gases at different times.
It can be seen from the figure that within 1 min of starting ventilation, the concentrations of CO and NO2 near the tunneling face changed. The CO concentration was reduced from 85.63 mg/m3 to the interval of 69.58–80.28 mg/m3, and the NO2 concentration was reduced from 0.568 mg/m3 to the interval of 0.461–0.532 mg/m3. The wind flow carried harmful gases along the return air side to the tunnel opening, making the concentration of harmful gases on the return air side higher than that on the air duct side, and the airflow gradually spread to the side of the air duct after passing by the air duct outlet, resulting in a higher concentration of harmful gases in the section from the air duct outlet to the tunnel exit than the excavation face to the air duct outlet. The airflow near the excavation face tended to be stable, and the concentration of harmful gases changed significantly after ventilating for 10 min compared with that of ventilating for 1 min. The concentration of CO decreased to 0.834 mg/m3, and the concentration of NO2 decreased to 5.528 × 10⁻³ mg/m3. In the middle of the tunnel, the harmful gases kept swirling and gathering due to the presence of a vortex, making the harmful gas concentration slightly higher. After ventilating for 20 min, the concentration of harmful gases continued to decrease. The concentration of CO stabilized at 6.235 × 10⁻³ mg/m3, and the concentration of NO2 stabilized at 4.132 × 10⁻⁵ mg/m3. Both harmful gas concentrations were below the specified standards (according to the “Technical Guidelines for Railway Tunnel Construction Engineering” (TZ204-2008), that is, the maximum allowable concentration of CO was 30 mg/m3 and the maximum allowable concentration of NO2 was 5 mg/m3).
Figure 10 shows the relationship between CO and NO2 concentration and time. It can be seen from the figure that the concentration of harmful gases dropped sharply in the first 5–6 min, while the decrease rate of the harmful gas concentration slowed down significantly within 7–20 min. To further explore the relationship between concentration and time, 10 time points were randomly selected from 0 to 20 min to analyze the changes in CO and NO2 concentrations. Table 5 shows the concentration values at 10 different times. The slope indicates the speed of the harmful gas falling rate. The larger the absolute value, the faster the falling rate. It can be seen from the table that the absolute slopes of CO and NO2 at the first five moments were approximately 7.242–23.463 and 0.023–0.160, respectively, which were significantly greater than those of the last five moments. As the space near the excavation face is filled with blasting fume before the ventilation starts, when ventilation just starts, the fresh air rushes in near the excavation face and replaces the space occupied by the blasting fume, forming a mixture of fresh air and harmful gases, and the proportion of fresh air in the mixture gradually increases at this time. Therefore, the concentration of harmful gases drops sharply when the ventilation just starts. After a period of ventilation, the proportion of fresh air in the mixture is relatively large, while the proportion of harmful gases decreases, the residual CO and NO2 still exist in the vortex area and the gap between the air duct and the tunnel wall, which cannot be completely drained in a short time. Therefore, in the late stage of ventilation, the decline rate of harmful gases becomes slower and gradually stabilizes.
Figure 10.

Change curves of harmful gas concentration–time: (a) CO; (b) NO2.
Table 5. Concentration Values of CO and NO2 at Different Times.
| CO |
NO2 |
||||
|---|---|---|---|---|---|
| serial number | moment (min) | concentration (mg/m3) | absolute slope | concentration (mg/m3) | absolute slope |
| 1 | 1.00 | 63.080 | 23.463 | 0.418 | 0.160 |
| 2 | 2.25 | 33.751 | 16.545 | 0.223 | 0.123 |
| 3 | 3.50 | 21.719 | 7.740 | 0.114 | 0.063 |
| 4 | 4.75 | 14.402 | 6.547 | 0.061 | 0.032 |
| 5 | 6.00 | 5.350 | 7.242 | 0.031 | 0.023 |
| 6 | 7.00 | 2.770 | 0.712 | 0.018 | 0.004 |
| 7 | 10.25 | 0.456 | 0.415 | 0.003 | 0.003 |
| 8 | 13.50 | 0.071 | 0.068 | 4.340 × 10⁻⁴ | 4.170 × 10⁻⁴ |
| 9 | 16.75 | 0.011 | 0.011 | 6.842 × 10⁻⁵ | 6.513 × 10⁻⁵ |
| 10 | 20.00 | 0.002 | 0.003 | 1.074 × 10⁻⁵ | 1.775 × 10⁻⁵ |
Figure 11 clearly shows the change rate of the CO and NO2 concentration reduction rate. It can be seen from the figure that the fastest rate change occurred in the first minute. The rate change gradually slowed down as time progressed. The absolute slopes of the CO and NO2 concentrations did not fluctuate apparently from 6 min onward, indicating that the concentrations of harmful gases were still declining, but their trends of change were gradually stable. Therefore, it can be considered that the first 5 min of ventilation is the most efficient period of harmful gas discharge.
Figure 11.

Absolute slope values of harmful gas concentrations: (a) CO; (b) NO2.
4.4. Influence of Different Outlet Positions of the Air Duct on the Distribution of Toxic and Harmful Gases
To study the influence of the distance (L) from the air outlet to the excavation face on the distribution of toxic and harmful gases, air ducts were set to 5, 15, and 25 m away from the excavation face and the wind speed V was set to 10 m/s. We contrasted and analyzed the CO and NO2 concentration distribution contours at the time of ventilating for 15 min. Figure 12 shows the concentration distribution contours of the two harmful gases under different L conditions.
Figure 12.

Distribution of harmful gas concentrations at different ventilation distances.
It can be seen from the figure that when the distance between the air outlet and the excavation face was 5 m, the air velocity was relatively large when it reached the tunnel face, but the diffusion section of the wind flow was small, making the contact area with harmful gas small, so the wind flow could not carry enough harmful gas. Therefore, the concentration of harmful gas in the middle of the tunnel and the return air side was relatively high. The concentration of CO was approximately 0.1545–0.1766 mg/m3, and the concentration of NO2 was approximately 9.51 × 10⁻⁴–1.097 × 10⁻³ mg/m3. When L was 15 m, a vortex was generated due to the interaction of the jet and the backflow in the middle of the tunnel. In this area, harmful gases accumulated easily, and the concentrations of CO and NO2 were relatively high. The concentration of CO was approximately 0.07452 mg/m3, and the concentration of NO2 was approximately 4.863 × 10⁻⁴ mg/m3. When L was 25 m, the air outlet was far away from the excavation face. The wind speed gradually decreased as the wind flow continuously reached the excavation face, but the wind flow cross section gradually expanded. It increased the contact area of harmful gases with the wind flow. Harmful gases were discharged at the tunnel exit along with the wind, so the concentrations of CO and NO2 in the tunnel were relatively low; for CO, the concentration was approximately 9.557 × 10⁻⁵ mg/m3, and for NO2, the concentration was approximately 6.356 × 10⁻⁷ mg/m3.
With the increase of L, the concentration distribution of CO and NO2 became more uniform, and the difference between the highest concentration and the lowest concentration gradually became smaller, but the high-concentration area in the tunnel still existed. The “Technical Guidelines for Railway Tunnel Construction Engineering” (TZ204-2008) stipulates that the maximum allowable concentration of CO is 30 mg/m3 and the maximum allowable concentration of NO2 is 5 mg/m3. The above-specified concentrations are regarded as the critical values, and the area where the concentrations exceeded the critical values is regarded as the high-concentration area. Figure 13 shows the high-concentration distribution area of harmful gases under different L. With the increase of L, the high-concentration area gradually decreased. When L was 25 m, the high-concentration area accounted for approximately 54.84%, which was 97% less than when L was 5 m. To further explore the reasons for the differences in the regional distribution of high concentrations, the wind flow trajectories in the tunnel under different L conditions were compared, as shown in Figure 14. When L was 5 or 15 m, a large vortex area was formed in the middle of the tunnel due to the mutual influence of the inlet and return winds, which caused the accumulation of harmful gases that were difficult to discharge. When L was 5 m, the air outlet was too close to the excavation face. The impact strength of the wind flow was large, and the speed after a rebound was faster than 15 and 25 m, so the flow streamline was more disorganized, and the formed eddy current was affected more seriously, resulting in a larger area of high concentration of harmful gas. When L was 25 m, the airflow traces were relatively regular. After rebounding at the excavation face, most of the airflow was discharged from the top of the tunnel to the tunnel exit, and a small proportion of the airflow was affected by the incoming wind and the return to the excavation face. Figure 15 shows more detailed statistics of the percentages of CO and NO2 high-concentration areas on different sections of the excavation face. The smaller the percentage value, the better the harmful gas discharge effect. When L was 5 or 15 m, the areas with high concentrations of CO and NO2 accounted for a higher proportion. When L was 5 m, the areas with high concentrations of CO and NO2 accounted for the smallest proportion, and the proportions were 0–28.73 and 0–2.46%, respectively. After comprehensive consideration, 25 m was set as the optimal distance from the air outlet to the excavation face.
Figure 13.

Distributions of CO and NO2 in high concentrations: (a) areas with CO concentration higher than 30 mg/m3 and (b) areas with NO2 concentration higher than 5 mg/m3.
Figure 14.

Comparisons of airflow streamlines.
Figure 15.

Proportion of hazardous gas concentration area: (a) areas with CO concentration higher than 30 mg/m3 and (b) areas with NO2 concentration higher than 5 mg/m3.
4.5. Harmful Gas Concentration–Time Curve Fitting
All kinds of harmful gases produced after blasting of excavation face polluted the construction environment to a great extent. Their diffusion is abstract and complex, with low controllability and high perniciousness. Accidental inhalation of harmful gases may cause asphyxiation and death, which poses a great threat to the health of construction workers. Therefore, to ensure the safety of the working environment and construction personnel, curve fitting was carried out on the data of CO and NO2 concentrations at the height of the breathing zone (1.5 m above the ground) with the change of time, so as to further reveal the diffusion law of harmful gas concentration in the tunnel.
According to the simulation results, the ExpDec2 model was used to fit the curve with x value representing time (unit: min) and y value representing the concentration of harmful gas (unit: mg/m3). The curve obtained by fitting can visualize and concretize the relationship between the concentration of harmful gas and time to calculate its subsequent concentration. The relationship between CO and NO2 concentrations and the time obtained after fitting is shown in Figure 16. It can be seen that the two gases in the respiratory zone showed a nonlinear decreasing trend, and when the time was 20 min, the concentrations of CO and NO2 were close to 0 mg/m3 and the air quality in the respiratory zone was significantly improved.
Figure 16.

Fitting curves of hazardous gas concentration.
4.6. Effect Comparison between Original Ventilation Condition and Optimal Ventilation Condition
To more clearly reflect the ventilation effect under the optimum conditions, the ventilation effect was compared with that under the original conditions, as shown in Figures 17 and 18. The concentrations of harmful gases at the time of 5, 10, 15, and 20 min were compared and analyzed. It can be seen from the figures that the maximum concentrations of the two harmful gases under the optimum ventilation conditions decreased by 92–99% compared with those before improvement, and the discharge efficiency of CO and NO2 was greatly improved. The reduction of the two harmful gases reached 19.9%/min under the optimum conditions while it was 17.4%/min before, and the ventilation exhaust efficiency was increased by about 2.5% per minute. After ventilating for 10 min, the concentrations of CO and NO2 under the original ventilation conditions were still relatively high, and their maximum concentration values are about 85.01 and 0.343 mg/m3, respectively. At the same time, the concentrations of CO and NO2 under the optimum conditions were close to 0 mg/m3 in the space near the excavation face. It can be seen that the ventilation efficiency has been greatly improved, and the exhaust time is also significantly shortened under optimal ventilation conditions.
Figure 17.

Comparison of CO discharge effect near the excavation face.
Figure 18.

Comparison of NO2 discharge effect near the excavation face.
5. Conclusions
-
(1)
The fresh air enters the tunnel from the press-in air duct and shoots along the wall to the excavation face. Although the wind speed is high, the wind flow section gradually expands and the wind speed decreases. At the excavation face, the wind flow is reversed, a part of which is affected by the incoming wind to form a vortex area in the middle of the tunnel and the other part flows out along the tunnel wall to the tunnel outlet.
-
(2)
The greater the air velocity at the air outlet, the higher the smoke exhaust efficiency in the tunnel, the faster the diffusion of harmful gases, and the more obvious the improvement effect of the accumulation of harmful gases in the vortex area in the middle of the tunnel. When the air supply speed is 6 m/s, the wind speed near the excavation face is too small. When the air supply speed is 14 m/s, the wind speed on the excavation surface exceeds the maximum wind speed specified in the Technical Guidelines for Railway Tunnel Construction Engineering (TZ204-2008). Therefore, the optimal supply air speed is 10 m/s.
-
(3)
Exhaust efficiency is highest in the first 5 min of ventilation. The concentration of CO and NO2 near the excavation face decreases greatly within a certain period after the fan is turned on, but it gradually decreases slowly after a period of ventilation. It can be considered that the change of harmful gas concentration is “time sensitive” under the ventilation condition of the one-ended tunnel.
-
(4)
When L is 5 or 15 m, there is a serious eddy current area in the middle of the tunnel, CO and NO2 are easy to accumulate and are difficult to be discharged, and the high-concentration area accounts for a large proportion; when L is 25 m, the wind flow rebounds on the excavation face. Most of the wind flow is discharged along the top of the tunnel to the tunnel outlet, the eddy current phenomenon is slight, and the area with a high concentration of CO and NO2 accounts for a small proportion. Therefore, the best position of the air outlet should be 25 m away from the excavation face.
-
(5)
After the ventilation parameters are optimized, the maximum concentration of harmful gases at the same moment has dropped by 92–99% compared with the original, the reduction range of the two harmful gases has reached 19.9%/min, and the exhaust efficiency is improved by about 2.5% per minute.
Acknowledgments
This research was funded by the Key Research and Development Project of Yunnan Province (Grant No. 202003AC100002), Yunnan Fundamental Research Projects (Grant No. 202201AU070110), and the Scientific Research Fund Project of Yunnan University of Finance and Economics (Grant No. 2021D04). Constructive comments by anonymous reviewers and the editor are highly appreciated.
The authors declare no competing financial interest.
References
- Cao Z. M.; Liu X.; Niu B. C. Migration Characteristics of Dust during Construction Stage in Highway Tunnels at High Altitude Areas. Chin. J. Underground Space Eng. 2019, 15, 927–935. [Google Scholar]
- Chen J. S.; Jiang Z. A.; Tan C. Numerical simulation of dust removal and ventilation system in the rock comprehensive tunneling face. Harbin Polytech. Univ. J. 2015, 47, 98–103. [Google Scholar]
- Chen Z. C.; Yang P.; Lv W. S.; He L.; Men R. Y. Numerical simulation on the diffusion law of blasting fume during roadway tunneling across a vein in an alpine mine. Chin. J. Eng. 2011, 33, 521–525. 10.13374/j.issn1001-053x.2011.05.003. [DOI] [Google Scholar]
- Jiang Z. A.; Yang B.; Zhang G. L.; Zeng F. B.; Wang Y. P. Analysis of dust pollution effect of cutting dust and ventilation control parameters at the heading face in plateau mines. J. China Coal Soc. 2021, 46, 2146–2157. [Google Scholar]
- Liu J.; Song Y.; Liu H. M.; Liu Y. H.; Deng L. J. Experimental study on distribution laws of wind velocity in straight roadway section based on LDA. J. Saf. Sci. Technol. 2015, 11, 65–71. [Google Scholar]
- El-Fawal M. M. Mathematical Modelling for Radon Prediction and Ventilation Air Cleaning System Requirements in Underground Mines. J. Am. Sci. 2011, 7, 389–402. [Google Scholar]
- Fang Y.; Yao Z. G.; Lei S. Air flow and gas dispersion in the forced ventilation of a road tunnel during construction. Underground Space 2019, 4, 168–179. 10.1016/j.undsp.2018.07.002. [DOI] [Google Scholar]
- Gao F.; Tang Z. Y.; Zhang G. S.; Liu L.; Zhang J.; Qi H. Y. CO Migration Law of Spiral Tunnel in Plateau Area. J. Chongqing Jiaotong Univ., Nat. Sci. 2020, 39, 66–72. 10.3969/j.issn.1674-0696.2020.06.11. [DOI] [Google Scholar]
- Geng X. W.; Yan J. X. Optimization of dust control measures in steelmaking electric furnace workshop based on FLUENT. J. Saf. Sci. Technol. 2021, 17, 163–168. [Google Scholar]
- Hargreaves D.; Lowndes I. The computational modeling of the ventilation flows within a rapid development drivage. Tunnelling Underground Space Technol. 2006, 22, 150–160. 10.1016/j.tust.2006.06.002. [DOI] [Google Scholar]
- Hu S. Y.; Liao Q.; Wang H. T.; Feng G. R.; Xu L. H.; Huang Y. S.; Shao H.; Gao Y.; Hu F. Gas-solid two-phase flow at high-gassy fully mechanized within high gassy coal seam. J. China Coal Soc. 2019, 44, 3921–3930. [Google Scholar]
- Li Q.; Yu L.; Yan T.; Liu X.; Wang M. N. Study on Construction Ventilation Duct Leakage Rate in High Altitude Tunnel. J. China Railw. Soc. 2019, 41, 144–148. [Google Scholar]
- Ye Y. J.; Jiang J. T.; Ding D. X.; Zhong Y. M.; Xie C. Transport of radon and blasting-fume in blind roadway with exhaust ventilation after blasting. China Saf. Sci. J. 2015, 25, 131–137. 10.1007/s11426-014-5257-x. [DOI] [Google Scholar]
- Jiang W.; Wei J. P.; Xu X. Y. Analysis of structure of flow field in tunneling road based on similarity theory. China Saf. Sci. J. 2018, 28, 142–148. 10.16265/j.cnki.issn1003-3033.2018.08.024. [DOI] [Google Scholar]
- Tan C.; Jiang Z. A.; Wang M.; Chen Y. Similarity experiment on multi-source dust diffusion law in fully mechanized caving face. J. China Coal Soc. 2015, 40, 122–127. [Google Scholar]
- Ding H. C.; Quan M. M.; Shi X. X.; Xu Y. D.; Deng Q. L.; Liu K. Study on numerical simulation of blasting fume migration laws in tunnel with drilling and blasting construction. J. Saf. Sci. Technol. 2020, 16, 82–87. [Google Scholar]
- Sun Z. Q.Study on Dust Migration Regularity and Control Technology in Drilling and Blasting Method of Highway Tunnel Construction; University of Science and Technology Beijing Press: Beijing, 2015. [Google Scholar]
- Zhang X. H.; Shang Z. Z.; Feng Z.; Liu Y. J. Numerically simulated distribution of the airflow and dust movement in the respiratory zone at the fully mechanized mining face with great mining height. J. Saf. Environ. 2021, 21, 570–575. [Google Scholar]
- Nie W.; Wei W. L.; Liu Y. H.; Chen L. J.; Cheng W. M.; Ma X. Research on dust control and removal method of multi-direction rotational air curtain at rock mechanized excavation face and its application. J. Cent. South Univ. (Sci. Technol.) 2016, 47, 3612–3619. [Google Scholar]
- Nie W.; Wei W. L.; Ma X.; Liu Y. H.; Peng H. T.; Liu Q. The effects of ventilation parameters on the migration behaviors of head-on dusts in the heading face. Tunnelling Underground Space Technol. 2017, 70, 400–408. 10.1016/j.tust.2017.09.017. [DOI] [Google Scholar]
- Qin Y. P.; Zhang M. M.; Cui L. J.; Liu J. Y. Numerical simulation of dust migration and study on dust removal modes with the forced ventilation shunt in a fully mechanized workface. Chin. J. Eng. 2011, 33, 790–794. 10.13374/j.issn1001-053x.2011.07.008. [DOI] [Google Scholar]
- Song Y.; Liu J.; Li X. B.; Liu Y. H.; Tian R. X.; Zhao C. S. Experiment and numerical simulation of average wind speed distribution law of airflow in minetunnel. China Saf. Sci. J. 2016, 26, 146–151. [Google Scholar]
- Sasmito A. P.; Birgersson E.; Ly H. C.; Mujumdar A. S. Some approaches to improve ventilation system in underground coal mines environment – A computational fluid dynamic study. Tunnelling Underground Space Technol. 2013, 34, 82–95. 10.1016/j.tust.2012.09.006. [DOI] [Google Scholar]
- Shi X. X.; Jiang Z. A.; Deng Y. F.; Xing J. J. Study of fully mechanized mining face dust pollution status. J. Saf. Sci. Technol. 2008, 67–70. [Google Scholar]
- Min Y. L.; Su L.; Zhang J.; Liu G. W. Simulation of extinguishing oil-immersed transformer fire by polycomponent water mist. China Saf. Sci. J. 2014, 24, 43–48. [Google Scholar]
- Sun Z. Q.; Fang B. J. Study on airflow distribution regularities in construction of large section highway tunnel. J. Saf. Sci. Technol. 2016, 12, 154–158. [Google Scholar]
- Zhang H.; Zhang J. R.; Zhou S. Q.; Sun J. C.; Wu J. Deciding and determination of the key parameters of the relay ventilation based on the air cabin and its effect in the ultra-long tunnel. J. Saf. Environ. 2019, 19, 795–803. [Google Scholar]
- Zhang Y. W.; Xie Y. L.; Lai J. X.; Li Y. Y. Distribution of harmful gas concentration of plateau tunnel under the forced ventilation mode. J. Railw. Sci. Eng. 2016, 13, 1994–2000. [Google Scholar]
- Zhou G.; Zhang Q.; Bai R. N.; Fan T.; Wang G. The diffusion behavior law of respirable dust at fully mechanized caving face in coal mine: CFD numerical simulation and engineering application. Process Saf. Environ. Prot. 2017, 106, 117–128. 10.1016/j.psep.2016.12.005. [DOI] [Google Scholar]
- Wang F.; Wang M. N.; Liu X.; Wang Y. Research on the Limitation of CO Concentration in High Altitude Tunnels under Construction. Chin. J. Underground Space Eng. 2018, 14, 1072–1076. [Google Scholar]
- Nie W.; Ma X.; Cheng W. M.; Zhou G.; Liu Y. H. Simulation experiment on effects of ventilation conditions on dust diffusion of the forced with long duct fan accompanied with short duct exhaustor in heading face. J. Cent. South Univ. (Sci. Technol.) 2015, 46, 3346–3353. [Google Scholar]
- Wang S. B.; Chen R. H.; Liu S. T.; Meng X. Y. Analysis and Forecast on CO Concentration Change Rule of Dead Driving Working Face after Blasting. Sci. Technol. Eng. 2014, 14, 101–103. [Google Scholar]
- Wang H. F. Simulation study on monitoring and measuring location of average air velocity in section of mine roadway based on Fluent. Coal Sci. Technol. 2015, 43, 92–96. [Google Scholar]
- Wang X. Z. Anlysis of dust concentration influence factor in coal roadway driving. J. Saf. Sci. Technol. 2011, 7, 75–79. [Google Scholar]
- Wang Y. F.; Zhao W. D.; Ma L.; Li Z. B. On the movement regularity of CO and the evacuation parameters under the FED model in the working face fires. J. Saf. Environ. 2018, 18, 583–587. [Google Scholar]
- Wu B.; Chen H. H.; Huang W. Analysis of Forced Ventilation Flow Field in Railway Tunnel and Optimization of Construction Parameters. Sci. Technol. Eng. 2021, 21, 2922–2928. [Google Scholar]
- Xu H. Study on dust diffusion and dust removal system of open-type TBM construction tunnel. J. Saf. Sci. Technol. 2019, 15, 179–185. [Google Scholar]
- Yan T.; Bao Y. F.; Qin P. C.; Chen J. Y.; Wang M. N.; Wang X. Review on Key Parameters of Ventilation and Oxygen Supply in High-altitude Tunnel Construction. Mod Tunnel Technol. 2019, 56, 572–577. [Google Scholar]
- Zhou X. H.; Meng L.; Li C. Y.; Feng C. C.; Zhou Y. B.; Shi M. J. Experimental study on determination and correction method of wind speed in circular pipe. J. Liaoning Tech. Univ., Nat. Sci. Ed. 2012, 31, 801–804. [Google Scholar]
- Ye Y. J.; Wang L. H.; Ding D. X.; Zhou X. H.; Li X. Y.; Zhong Y. M.; Wang S. Y. Study on Calculation Models and Distribution Rules of the Radon Concentration and Its Progenies Concentration in Blind Roadway with Forced-exhaust Ventilation. Chin. J. Nucl. Sci. Eng. 2014, 34, 219–227. [Google Scholar]
- Zhu H. Q.; Zhu S. H.; Jia G. W. Numerical simulation for the optimal driving duct height in a large scale cross section of driving face. J. Saf. Environ. 2014, 14, 25–28. 10.1016/j.ecoenv.2014.01.013. [DOI] [Google Scholar]
- Zhang N.; Tan Z. S. Numerical Simulation Study on Smoke Distribution of Fire in High-altitude Super-long Railway Tunnels. China Saf. Sci. J. 2013, 23, 52–57. [Google Scholar]
- Zhang Z. H.; Huang K.; Zhang X. L.; Lv Y.; Liu Y. Z. Study on leakage laws and ventilation scheme of natural gas pipeline in Yanyingshan tunnel. J. Saf. Sci. Technol. 2016, 12, 42–48. [Google Scholar]