

Abstract

Ionic liquids (ILs) show remarkable performance in enhancing the naphthenic acid extraction efficiency and decreasing the extraction time. However, the ultrasonic-assisted IL-based extraction of naphthenic acid is merely addressed previously. Therefore, this study investigated the impact of essential ultrasonic parameters, including amplitude and time, on naphthenic acid extraction using different ILs, and the system was optimized for maximum extraction. The IL 1,8-diazobicyclo[5.4.0]-undec-7-ene (DBU) with thiocyanate anions revealed the highest efficiency in extracting naphthenic acid from a model oil (dodecane) at optimized conditions, and the experimental liquid–liquid equilibrium data were obtained at atmospheric pressure for the mixture of dodecane, [DBU], thiocyanate, and naphthenic acid. In addition, the influence of the chain length of the cation (hexyl, octyl, or decyl) on the extraction efficiency was also evaluated by determining the distribution coefficients, and the conductor-like screening model for real solvents (COSMO-RS) study was carried out at infinite dilution. It was found that [DBU-Dec] [SCN] gives the best extraction efficiency and has a distribution coefficient of 9.2707 and a performance index of 49.48. Based on these values, ILs can be ordered as follows: [DBU-Dec] [SCN] > [DBU-Oct][SCN] > [DBU-Hex][SCN] in the decreasing order of performance index 49.48, 41.58, and 28.13. Moreover, non-random two liquid and Margules thermodynamic models were employed to investigate the interaction parameters between the components. Both models showed excellent agreement with the experimental results and could successfully be used for ultrasonic-assisted IL extraction of naphthenic acid.
1. Introduction
The world of ionic liquids (ILs) is continuously changing, and currently they are entering an era of industrial applications. Commercialization of the process of removal of basil, difasol, and, recently, mercury from the natural gas is among the most promising industrial method developed using ILs.1,2 ILs possess some remarkable and even tunable physical–chemical properties, making them potentially excellent solvents for numerous applications, including heavy metal removal, CO2 capture, oil spill remediation, heat-transfer fluid for solar applications, and so forth.3−6 The extraction of naphthenic acid (NA) from crude oil and model oil has also been performed via ILs using the neutralization, liquid–liquid extraction (LLE), and adsorption approach.7,8 NA is one of the critical reasons for corrosion in crude oil refineries utilizing a high acidic oil, and it also causes foaming in the desalter. Conversely, NA is a valuable byproduct with good market value and has many applications in various industries, making it highly desirable to be extracted from oil for valorization purposes.9
NA is generally composed of cyclic, aromatic, and linear monocarboxylic acids, with the general formula CnH2n+zO2. Here “n” represents the number of carbon atoms, whereas “z” shows the deficiency of hydrogen, and it can be zero or a negative integer.10 Because of its complicated structure, the extraction of NA is a cumbersome process. NA is one of the significant sources of toxicity in process water, and it is primarily present in the effluent discharge from different petrochemical industries processing acidic crude oil.11,12 Moreover, they possess higher solubility in water compared to hydrocarbons, thus making them a significant threat to marine life.13 To avoid the toxic effect of NA on the aquatic system, a simple and efficient process for extracting NA from its source of origin (acidic crude oil) would be beneficial. For the refiners, the economically viable and environmentally friendly extraction of NA remains a challenge. The most common technique for removing NA is via a reaction with an aqueous sodium hydroxide solution. The sodium naphthenate salt is then protonated with mineral acid to afford back NA.14 This method has posed serious environmental concerns, such as generating a significant amount of waste for the unit production of crude NA. Furthermore, in this process, the lighter ends are also carried away from the crude oil, leading to subsequent economic loss to the refinery.9 In addition, the purity of the final product is very low and requires further processing. Above all, it contains harmful sulfur and phenolic compounds.
Many extraction techniques have been explored for the selective removal of NA from model oil and crude oil. The methodology for these techniques can be found elsewhere.15−18 Conventional LLE techniques are time-consuming, and the mass-transfer efficiency is very low.19−22 ILs have shown promising potential for NA extraction from crude/model oil. In most of these techniques, conventional LLE mechanisms had been applied. However, as the main drawback, most ILs display a relatively high viscosity, hampering possibly complete mass transfer in LLE technology. Owing to this, the assistance of low-frequency ultrasonic irradiation to quantitatively remove NA from model oil in a quick, safe, and economical way was investigated.
Indeed, in ultrasonic-assisted extraction, very fine emulsions are formed that are smaller in size and more time stable than conventionally obtained emulsions. These emulsions enhance the interfacial area available for reactions, thus enhancing the mass transfer.23−25
In this current study, diazobicyclo[5.4.0]-undec-7-ene (DBU)-based ILs bearing the same cationic unit but with different lengths of alkyl side chains with thiocyanate counteranions have been used to obtain liquid–liquid equilibrium data for these ternary systems. The chain length was correlated to the extraction efficiency via a distribution coefficient. The equilibrium data were modeled using Margules and non-random two-liquid (NRTL) thermodynamic models. The low value of root-mean-square deviation indicates the goodness of these models.
2. Materials and Methods
The ILs were synthesized using an already reported procedure.26 The chemicals employed for IL synthesis and the extraction study were procured from Sigma-Aldrich (Bornem, Belgium). The chemical structure of all the studied ILs and their general properties are given in Table1.
Table 1. Synthesized Ionic Liquid Structures and Their Molecular Weights.

2.1. Ultrasonic-Assisted Liquid–Liquid Extraction
The ultrasonic-assisted liquid–liquid extraction (UALLE) was performed using an ultrasonic processor from Sonics and Materials, Inc., Newtown, CT (model VCX 130) with a nominal power of 130 W, a working frequency at 20 kHz, and a 6 mm diameter microtip. Before starting the UALLE experiments, all the parameters were optimized for it. The reaction time and amplitude for the UALLE was optimized before starting the reaction. The acoustic power was calculated using a calorimetric method, and it was found that 40% was the highest possible amplitude that could be used. The UALLE was performed at 40% amplitude in 10 mL vials. The extraction time was optimized and the optimum extraction time was found to be 2 mins. The microtip was inserted into the solution at about 1/3 of the total height from the sample surface.27 Once the sonication was done, the samples were left overnight to separate the hydrocarbon and the IL layer.
The feed for each experiment was composed of known amounts of dodecane, IL, and NA, respectively. Dodecane was used in these experiments as it is one of the perfect analogies to kerosene and jet fuel oil, which are the source of the world’s most commercial NA. The feed composition was approximately kept constant to explore the capability of the studied ILs in extracting NA. In feed, the mole ratios of ILs were changed from 0.11 to 0.27. Similarly, dodecane mole ratios in the feed were varied from 0.20 to 0.73, and the NA mole fraction was changed from 0.01 to 0.67 to explore the potential of the studied ILs in LLE.
2.2. Quantification Procedure
The quantification of NA in dodecane and IL layers was performed using an ATAGO programmable digital refractometer (RX-5000α) according to an already reported procedure8 because the quantification of NA via gas chromatography (GC) and high-pressure liquid chromatography (HPLC) is quite a cumbersome process because of its complex structure.10,28−30 The respective concentrations of NA in hydrocarbon and IL layers were estimated from the graphs of the refractive index against the mole fraction, as shown in Figure 1.
Figure 1.

NA and ILs [DBU-Hex, Oct, and Dec] [SCN] refractive index vs concentration graph.
The possible cross-contamination between both immiscible solvents has been verified with the help of 1H nuclear magnetic resonance (NMR). 1H NMR measurements were done using a Bruker Avance 500 MHz NMR spectrometer. The NMR spectra of dodecane and IL layers without the presence of NA but after typical shaking and decantation procedures are recorded and shown in Figures S1 and S2. In dodecane, no trace of the IL has been found and vice-versa in the IL phase (no trace of dodecane was recorded) indicating that cross contamination does not occur.
2.3. Conductor-like Screening Model for Real Solvents
The conductor-like screening model for real solvents (COSMO-RS) model effectively predicts phase behavior and thermophysical properties of the fluid or its mixture.31−34 COSMO-RS uses statistical thermodynamics in combination with quantum chemistry to determine the chemical potential of the interacting species. Based on the chemical potential, different thermodynamic properties, including; distribution ratios, activity coefficients, and phase equilibria of all components in a mixture, are estimated.35−37 The COSMO-RS NA (pentadecanoic acid), dodecane, and anion and cation files were created using BP functionals with a triple-ξ valence polarized with a diffuse function basis set (TZVPD) along with the approximation technique by employing the TURBOMOLE 7.38 The estimation of selectivity and capacity at infinite dilution along with ternary phase diagrams of IL + hydrocarbon + NA was done by employing the COSMOtherm.39
3. Results and Discussion
To estimate the performance of ILs to extract NA, initial screening at infinite dilution was performed using COSMO-RS. Activity coefficient, capacity, and selectivity were predicted at 303.15 K, and the performance index (product of capacity and selectivity) was measured from these predicted values. The predicted values for activity coefficient, capacity, and selectivity are as follows: [DBU-Hex][SCN] (3.2375, 0.3089, and 91.08); [DBU-Oct][SCN] (2.0399, 0.4902, and 84.84) and [DBU-Dec] [SCN] (1.5672, 0.6380, and 77.55). Based on these values, ILs can be ordered as follows: [DBU-Dec] [SCN] > [DBU-Oct] [SCN] > [DBU-Hex] [SCN] in the decreasing order of performance index 49.48, 41.58, and 28.13. The order received from the COSMO-RS screening is similar to the experimental order which is discussed below.
Through aforementioned mechanical effects, low-frequency ultrasonic-assisted extraction aims to reduce extraction times compared to the conventional LLE process. Indeed, while the latter requires about 5 hours to achieve the best extraction,40 the extraction time in the present study was set to only 2 minutes. The mole ratio of ILs and dodecane is calculated from the refractive index versus concentration graph given in Figure 1. These concentrations were further used to calculate the liquid–liquid equilibrium data for all ILs. The ultrasonic-assisted liquid–liquid equilibrium data for NA, dodecane, and [DBU-Hex,Oct,Dec] [SCN] are shown in Table 2. Similarly, the data for [DBU-Oct,Dec] [SCN] are shown in Tables S1 and S2.
Table 2. Experimental LLE Data for the Ternary System Dodecane (1) + [DBU-Hex][SCN] (2) + Naphthenic Acid (3) on a Mole Fraction Basis.
| hydrocarbon-rich
phase |
ionic
liquid-rich phase |
|||||
|---|---|---|---|---|---|---|
| ẋ1 | ẋ2 | ẋ3 | ẍ1 | ẍ2 | ẍ3 | βa |
| 0.997 | 0.0 | 0.006 | 0.0 | 0.966 | 0.034 | 5.309 |
| 0.901 | 0.0 | 0.099 | 0.0 | 0.923 | 0.077 | 0.778 |
| 0.807 | 0.0 | 0.193 | 0.0 | 0.883 | 0.117 | 0.605 |
| 0.714 | 0.0 | 0.286 | 0.0 | 0.829 | 0.171 | 0.598 |
| 0.622 | 0.0 | 0.378 | 0.0 | 0.769 | 0.231 | 0.610 |
| 0.528 | 0.0 | 0.472 | 0.0 | 0.713 | 0.287 | 0.608 |
| 0.435 | 0.0 | 0.565 | 0.0 | 0.653 | 0.347 | 0.614 |
| 0.341 | 0.0 | 0.659 | 0.0 | 0.593 | 0.407 | 0.618 |
| 0.247 | 0.0 | 0.753 | 0.0 | 0.538 | 0.462 | 0.614 |
The ternary plot for [DBU-Hex] [SCN] is given in Figure S3. From this, it is clear that the higher the amount of NA to be extracted, the higher the amount of added IL is necessary. Even so, no carry-over of ILs to the dodecane phase had occurred, preventing any contamination of the raffinate phase.
The ternary plot for [DBU-Dec][SCN] and [DBU-Oct][SCN] is shown in Figures S4 and S5, respectively. From these data, it can be seen that the length of the side alkyl chain does exert a certain impact on the NA extraction efficiency as both [DBU-Oct] [SCN] and [DBU-Dec] [SCN] do allow better NA extraction efficiencies compared to [[DBU-Hex] [SCN]. At low concentrations, the composition of NA is higher in the extract phase. This is evident from the positive slope of the two tie lines in Figures S3 and S4.
Thus, chain length plays a significant role in NA extraction/removal from crude oil through LLE.22,41 From the LLE data in Tables 1, S1 and S2, we can conclude that the extraction potential of the three studied ILs is in the following sequence. [DBU-Dec] [SCN] is more significant than [DBU-Oct] [SCN] and [DBU-Oct] [SCN] is greater than [DBU-Hex] [SCN]. With the increase in the chain length, the van der Waals interactions between the NA and ILs enhance, hence extracting NA more efficiently Thus, we can say that the longer the alkyl chain length is, the higher the extraction efficiency due to van der Waals forces.
3.1. Distribution Coefficient
The distribution coefficient for the tie line data can be calculated using eq 1.
| 1 |
where xNAE and xNA are the concentrations of NA in the extract and raffinate phases, respectively. To establish the relationship between the solute concentration in the raffinate and extract phases, a distribution coefficient was used. The studied IL distribution coefficient values are presented in Tables 1, S1 and S2. The graph between the distribution coefficient and mole fraction of NA in the hydrocarbon phase is presented in Figure 2.
Figure 2.

NA distribution coefficient (symbols represent an experimental value and dashed lines represent COSMO-RS predicted values).
It can be noted (Figure 2) that the distribution coefficient is relatively higher at low concentrations of NA in the feed. However, as the NA concentration in the feed increased, the distribution coefficient value started decreasing. The distribution coefficient is one of the primary indicators of the separation efficiency of ILs, the highest being observed here for [DBU-Dec] [SCN]. In most of the LLE studies employing ILs, it had been found that increasing side chain lengths led to an enhancement in the distribution coefficient. Van der Waals interactions between the alkyl group and NA are reinforced by increasing alkyl chain length. Similarly, the π–π interaction between NA and ILs also increases with the chain length and leads to enhancement in the extraction efficiency. The same trend was observed in the extraction of toluene using imidazolium-based ILs with varying alkyl chain lengths and [NTf2] as the anion. Distribution coefficient values rise by increasing the chain length of ILs.40 A similar trend was also observed for cyclohexane carboxylic extraction from dodecane.42
For the present systems, COSMO-RS-predicted trends in the distribution coefficient is shown in Figure 2 and compared with experimental data. The predicted distribution coefficients are satisfactory to the experimental values. Similarly, COSMO-RS-predicted trends for the tie line, and binodal curves for [DBU-Hex, Oct, Dec] [SCN] is shown in Figures S6, 3 and 4 respectively. As predicted before, [DBU-Dec] [SCN] extracted more NA compared to [DBU-Oct] [SCN] and [DBU-Hex] [SCN]. However, for long alkyl chain systems, the binodal curve prediction reduces, which is reflected by the increase in rmsd values from 3.18% for DBU-Hex followed by 5.18% for DBU-Oct to 6.18% for DBU-Dec.
Figure 3.

Liquid–liquid equilibrium graph showing a comparison for the NA + [DBU-Oct] [SCN] and dodecane (solid lines and squares illustrate experimental tie lines whereas dashed lines and crosses illustrate COSMO-RS predicted data).
Figure 4.
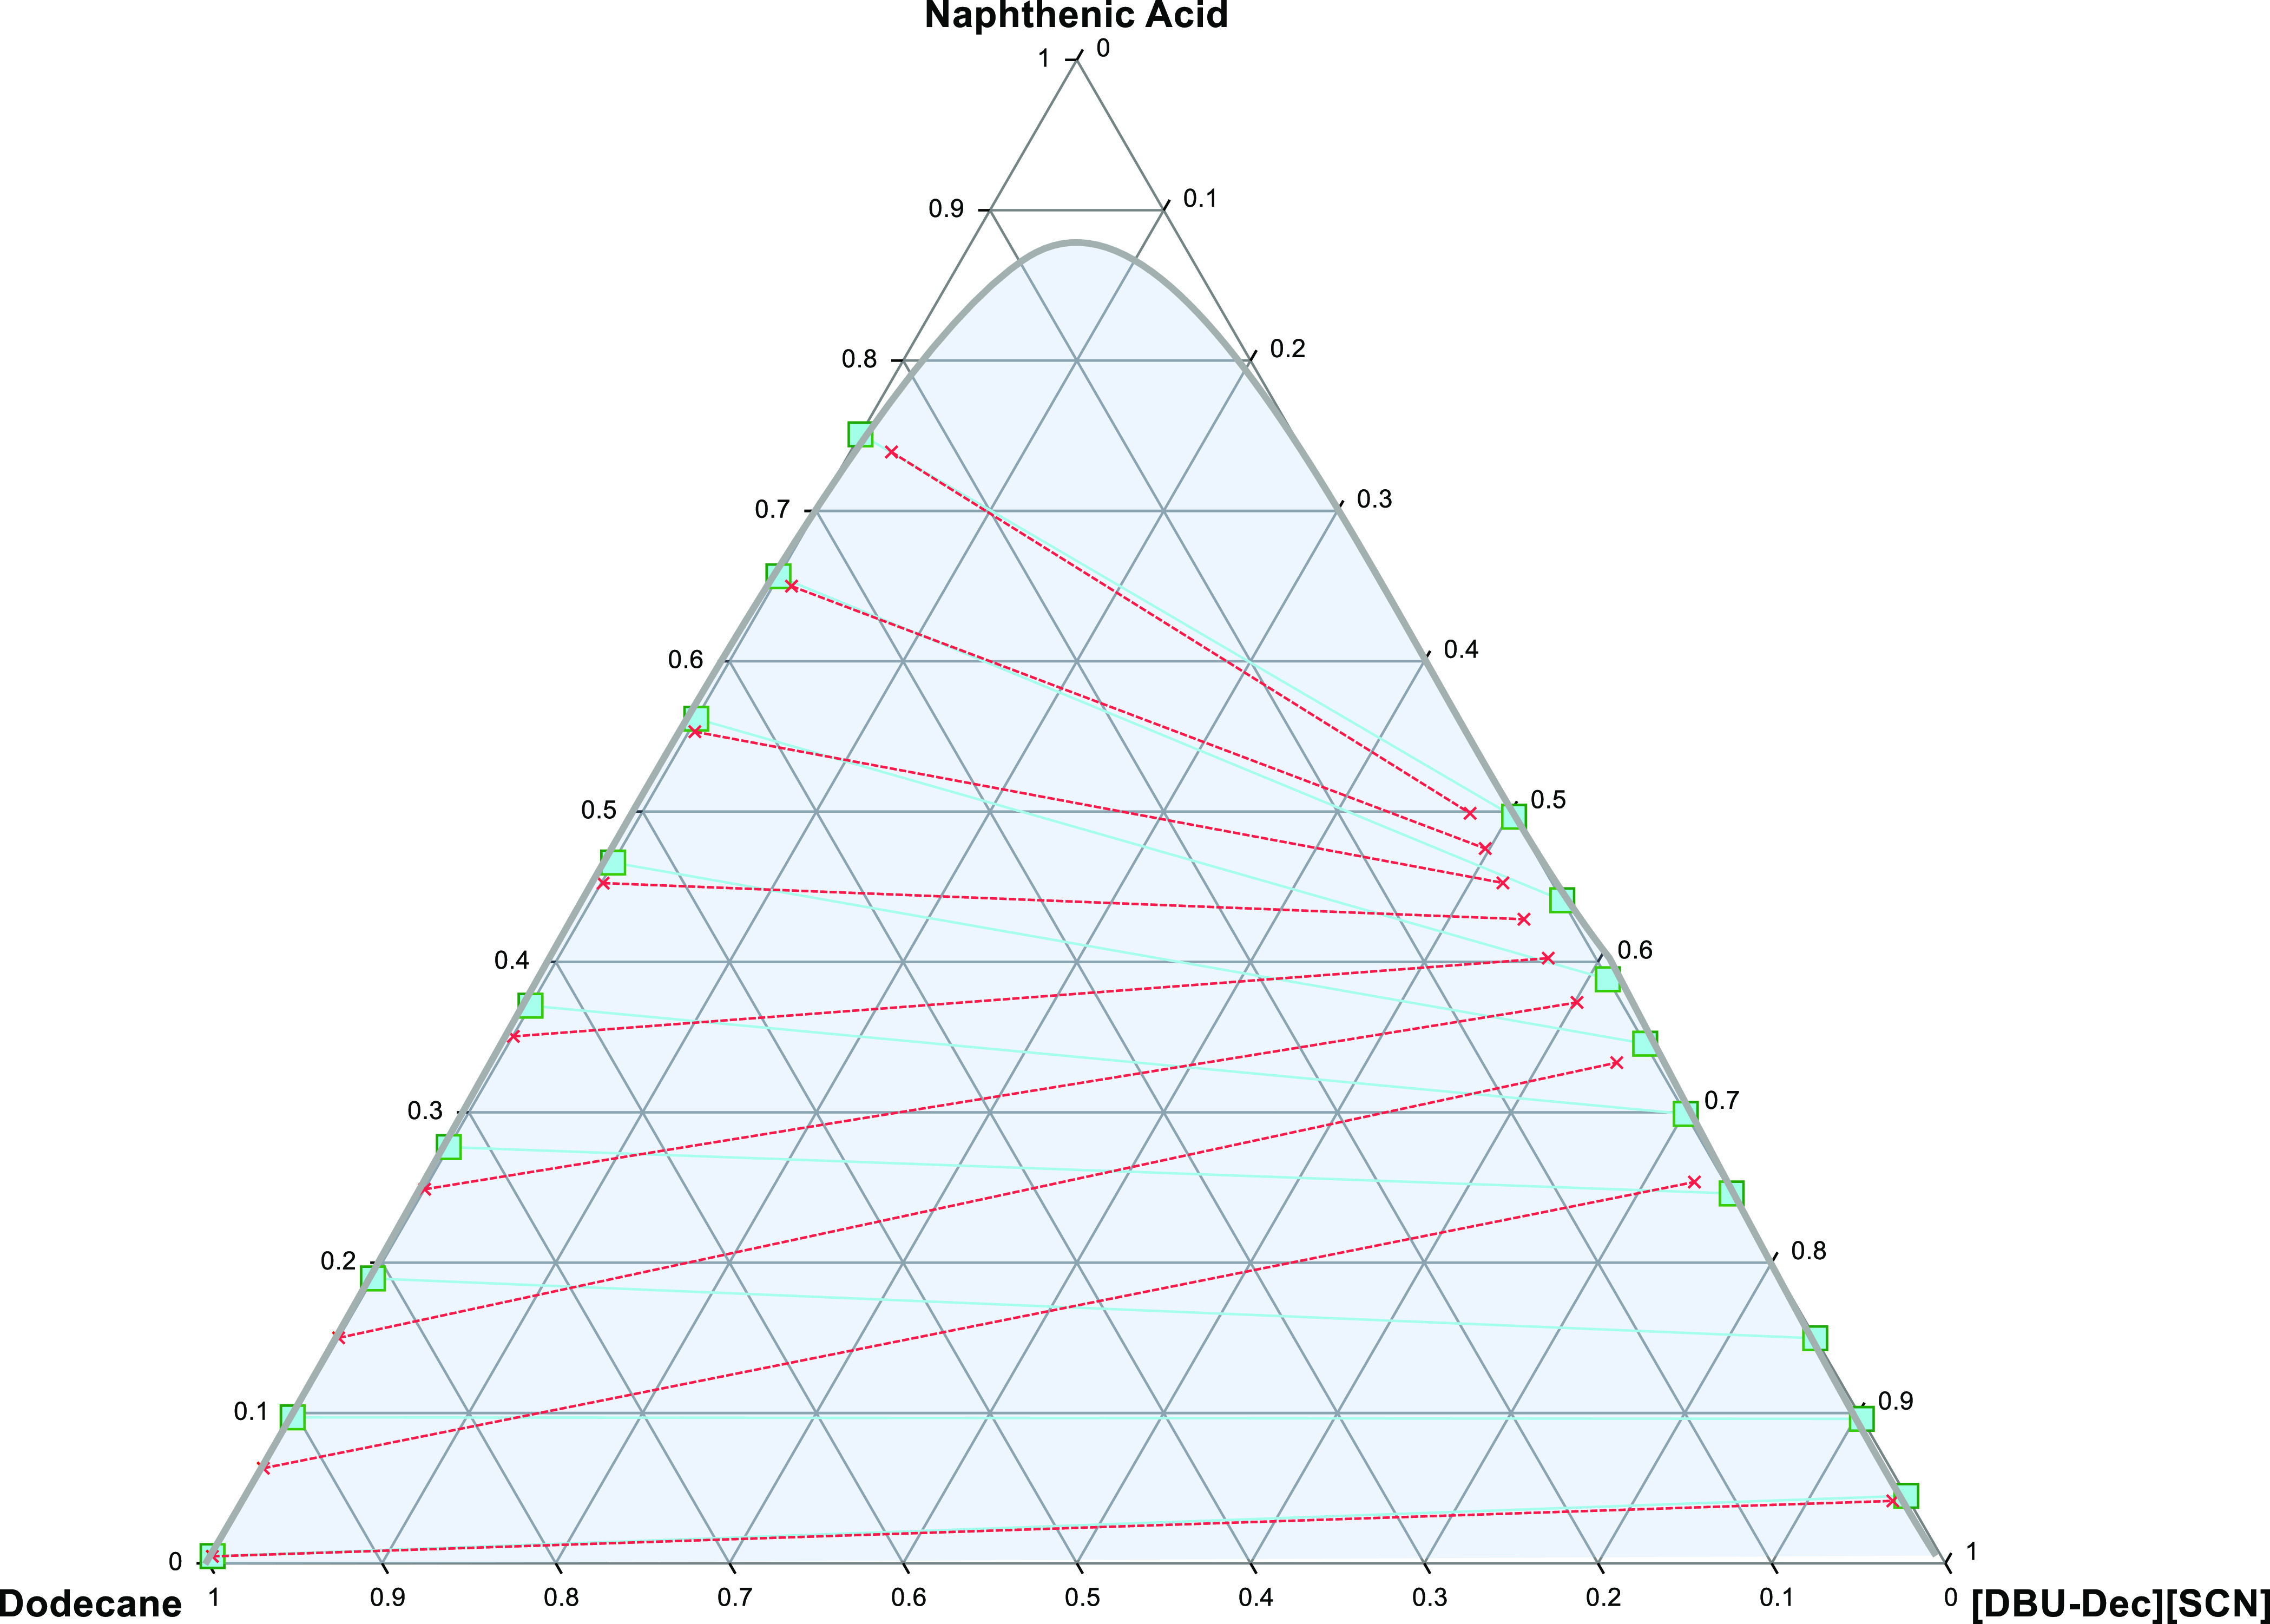
Liquid–liquid equilibrium graph showing a comparison of the system; NA + dodecane and [DBU-Dec] [SCN] (solid lines and squares illustrate experimental tie lines, whereas dashed lines and crosses illustrate COSMO-RS predicted data).
3.2. Thermodynamic Framework
Previously, the NRTL model and universal quasi-chemical activity coefficient (UNIQUAC) model were used effectively to describe experimental liquid–liquid equilibrium data. However, it was observed that the UNIQUAC application was undermined by the unavailability of volume and surface area parameters. Moreover, none of the applied models could illustrate the ionic behavior of ILs. In addition, in the NRTL model, the definition of a non-randomness parameter remained ambiguous. Even though, the 0.2 value was considered a standard for calculations of LLE systems containing ILs, it was seen that identical or even better results were achieved for values less than 0.2. Hence, it was deemed essential that the modeling performance be studied when the value of the non-randomness parameter is zero. Therefore, the Margules activity coefficient model was chosen. It must be noted that the NRTL equation reduces to the Margules model when the non-randomness parameter is equated to zero. The latter is effectively simple and easily correlated. Renon et al.43 successfully illustrated the thermodynamic modeling of the liquid–liquid equilibrium data by developing a new model involving the NRTL model and three suffix Margules activity coefficient model.
3.2.1. NRTL Model
The liquid–liquid equilibrium data having ILs have been successfully correlated using the NRTL model. In this model, ILs are assumed as completely associated compounds.44 Thus, we consider IL as a single molecular species in which cations and anions are fully paired to each other. For all species, the reference is chosen as pure liquids at the same pressure and temperature of the system. Hence, we can calculate the total Gibbs energy (per mole of mixture) from the molar Gibbs energy of mixing gM, which is
| 2 |
where R is the universal gas constant, T is the system temperature, xi denotes the mole fraction of component i, n represent the number of species, and gE is the molar excess Gibbs energy. The NRTL model estimates heat of mixing, illustrating the attributes of electrolyte.43 The phase activity coefficient of non-ideal system, γi of component i can be calculated as follows
| 3 |
| 4 |
| 5 |
where g is the energy parameters that inform about the interaction among different species, γ shows the activity coefficient, αij = αji demonstrates the existence of non-randomness, whereas αij = 0 means an ideal solution or complete randomness. Although αij is an adjustable factor, it can be set as a constant to limit the binary factors/parameters. For binary LLE data having IL/co-solvent and IL/solvent, the parameter estimation is done using mutual solubilities that can be calculated by employing activity equations.45 In the case of the model having no separation of the liquid phase, αij = αji was set to 0.2 as it is usually used for immiscible binaries.
3.2.2. Margules Model
The Margules activity coefficient model was chosen to represent the small-range forces at the molecular level.46 The model is represented by the following equation.
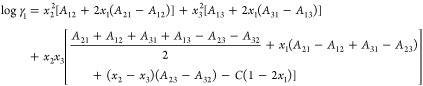 |
6 |
where A12, A21, A13, A31, A23, A32, and C are the adjustable factors that can be obtained from experimental data. The ternary system activity coefficients, γ1, γ2, and γ3 are also determined using eq 6.
3.2.3. Determination of NRTL and Margules Energy Interaction Parameters
The interaction parameters Δgij = Tij for the NRTL and Axx are estimated by reducing the objective function of experimental data. The objective function can be determined by employing the equation.
| 7 |
The root mean square deviation (rmsd) was employed to determine the goodness of fit using eq 8.
| 8 |
where x represents the calculated and experimental mole fraction/ratio. The subscripts k, j, and i indicates the tie line, phase, and component/specie, respectively. Whereas n represents the number of species.
The fitting of experimental ternary liquid–liquid equilibrium data was done using NRTL and Margules models. The comparison of experimental LLE and modeling data for DBU-Dec] [SCN], [DBU-Oct] [SCN], and [DBU-Hex] [SCN] using the NRTL can be found in Figures S7, 5, and 6. The NRTL model is an established thermodynamic model that is capable of correlating properties of non-ideal multiple phases and multi-component systems. Although the definition of the non-randomness parameter is empirical, the model results are satisfactory for LLE-based separation systems. However, overfitting of interaction energy parameters is commonly observed.
Figure 5.

Liquid–liquid equilibrium graph illustrating comparison for the system; NA + [DBU-Oct] [SCN] and dodecane (solid lines and squares illustrate experimental tie lines, whereas dashed lines and crosses illustrate NTRL model data).
Figure 6.
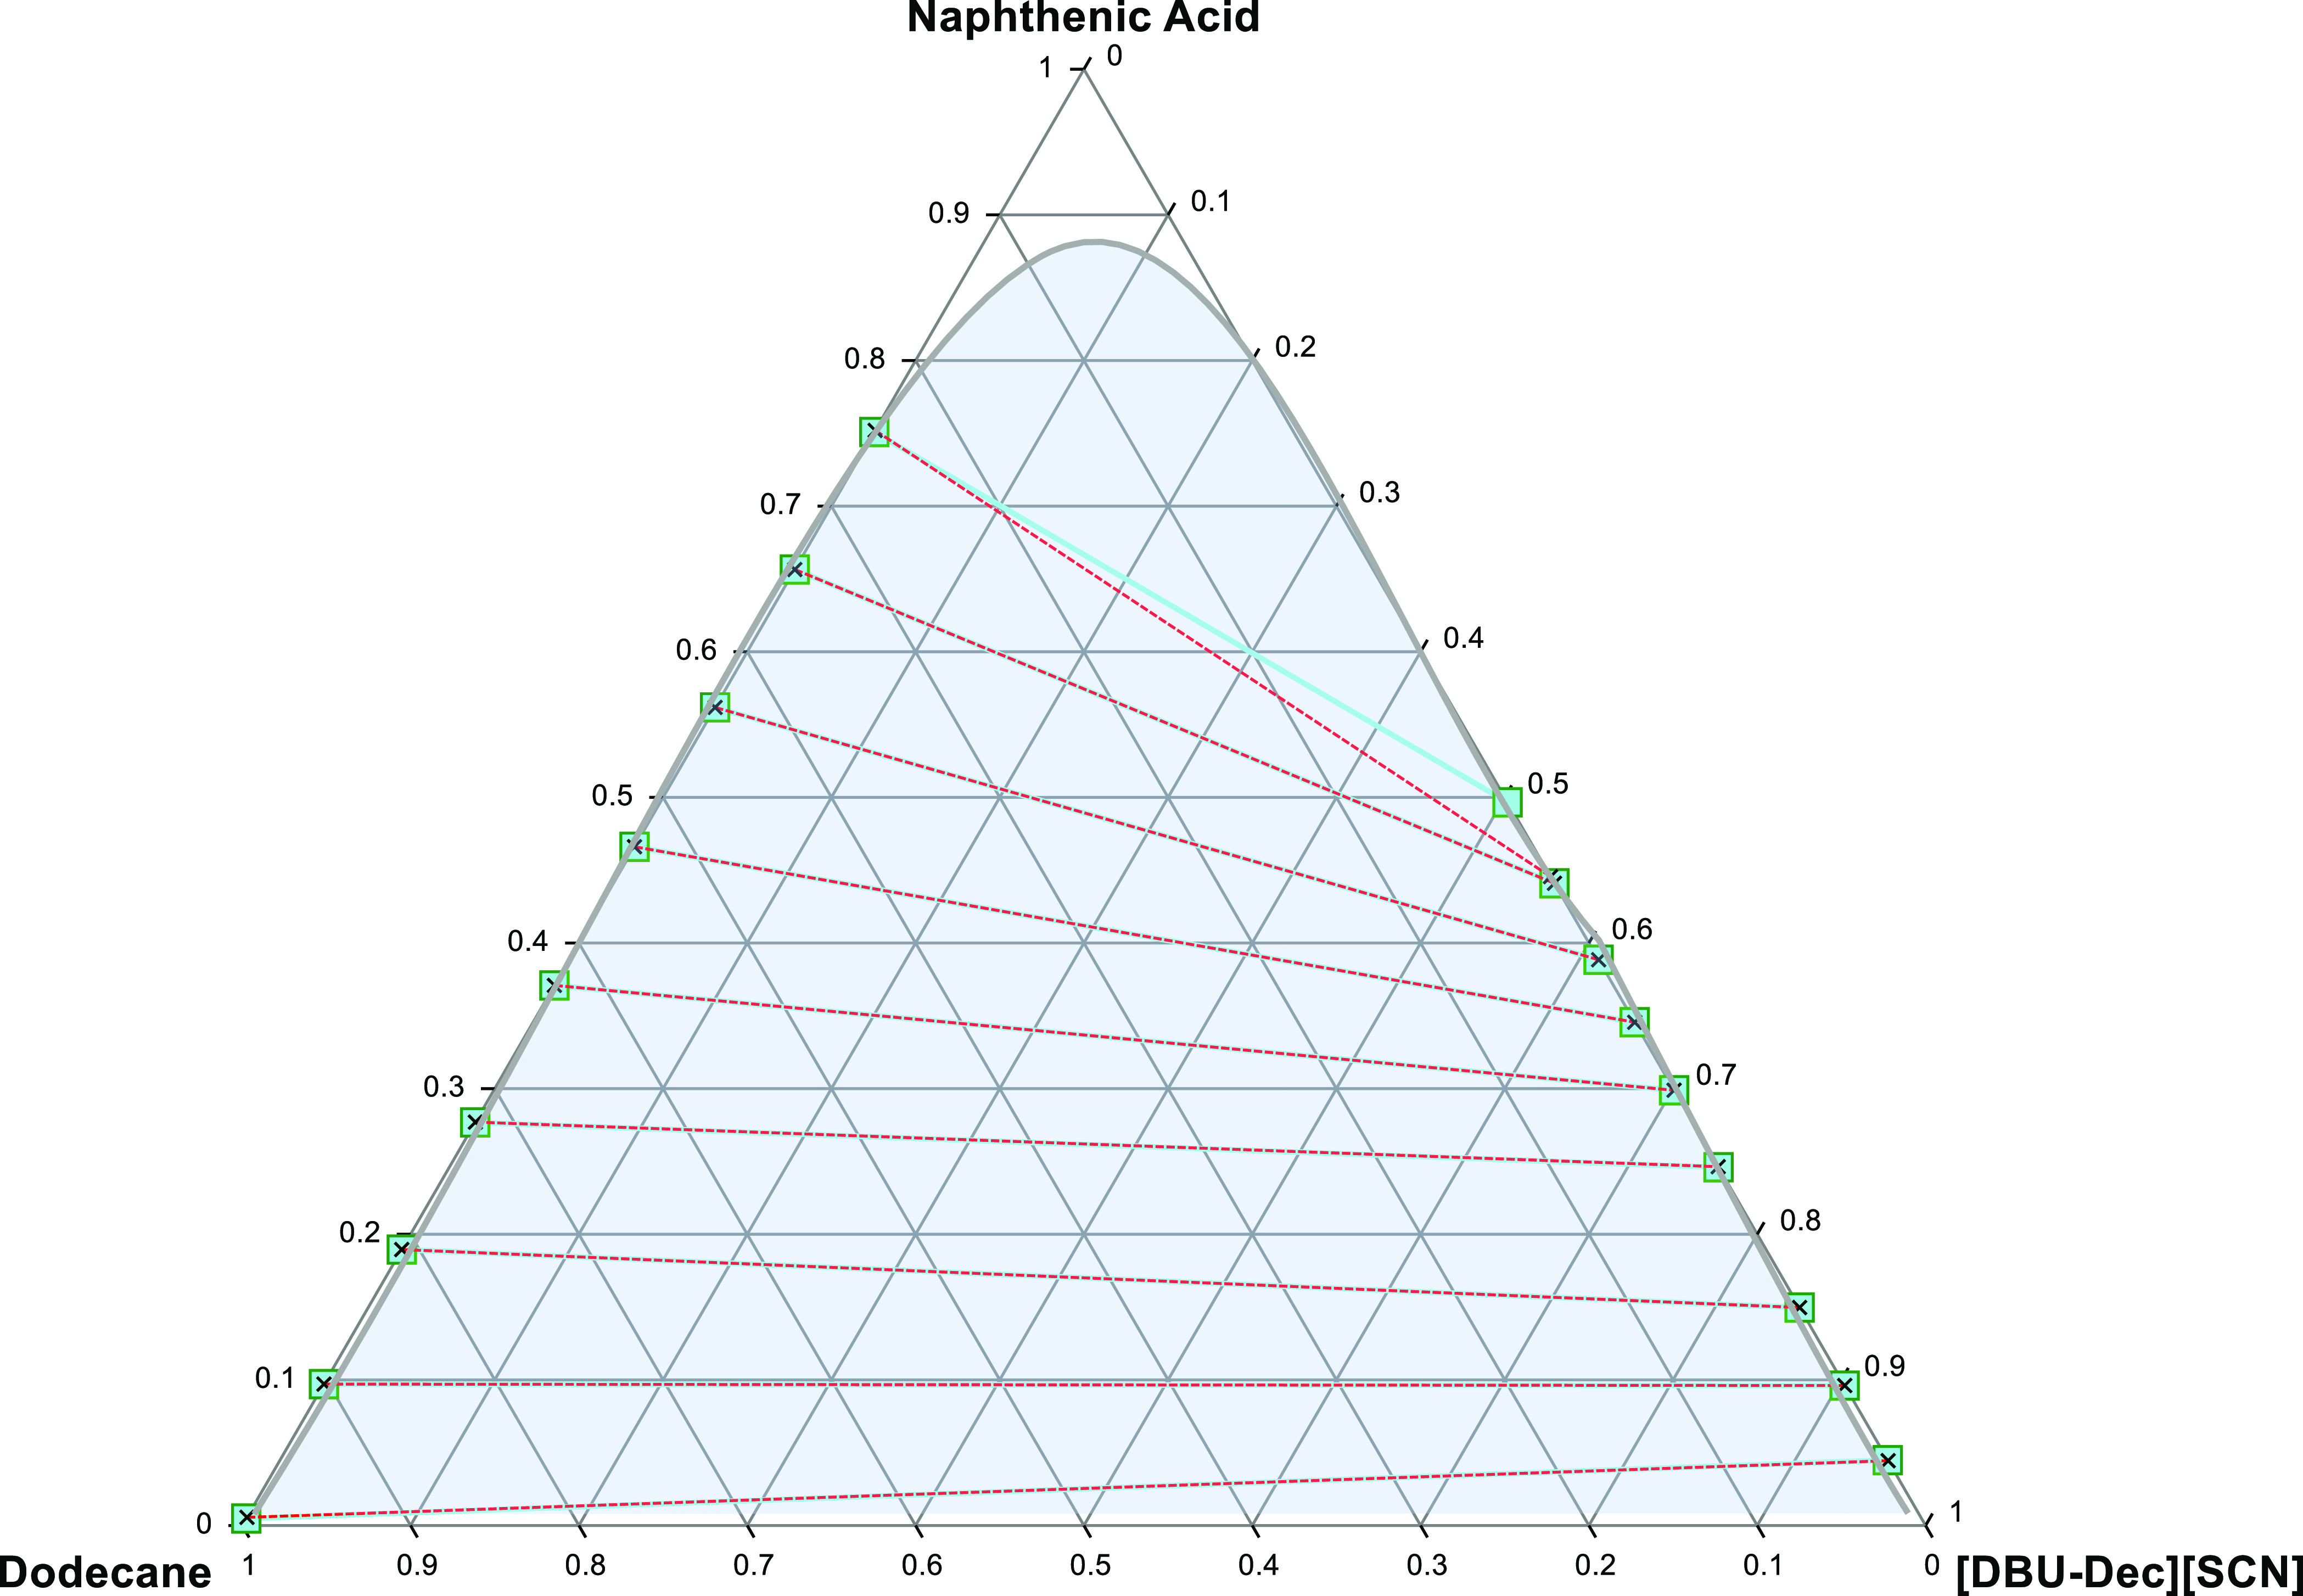
Liquid–liquid equilibrium graph illustrating comparison of the system; NA + [DBU-Dec] [SCN] and dodecane (solid lines and squares illustrate experimental tie lines, whereas dashed lines and crosses illustrate NTRL model data).
The fitting of experimental data using Margules can be found in Figures S8, 7, and 8, respectively. When the non-randomness factor of the NRTL model is taken as zero, the equation reduces to the Margules model having three suffixes. The Margules model is deemed as the simplest thermodynamic model that can satisfactorily correlate nominally non-ideal multicomponent systems such as IL-based separation. The interaction parameters have a strong dependence on temperature. Hence, the effect of temperature is sometimes overlooked. The close fit of experimental data and modeling data using NRTL and Margules allows us to conclude that both these models can be used for fitting of experimental LLE data. Marginally, small values of root furthermore confirm this observation. The mean square deviation values are shown in Tables 3 and 4, respectively.
Figure 7.

Liquid–liquid equilibrium graph illustrating comparison for the system; NA + [DBU-Oct] [SCN] and dodecane (solid lines and squares illustrate experimental tie lines whereas dashed lines and crosses illustrate Margules model data).
Figure 8.
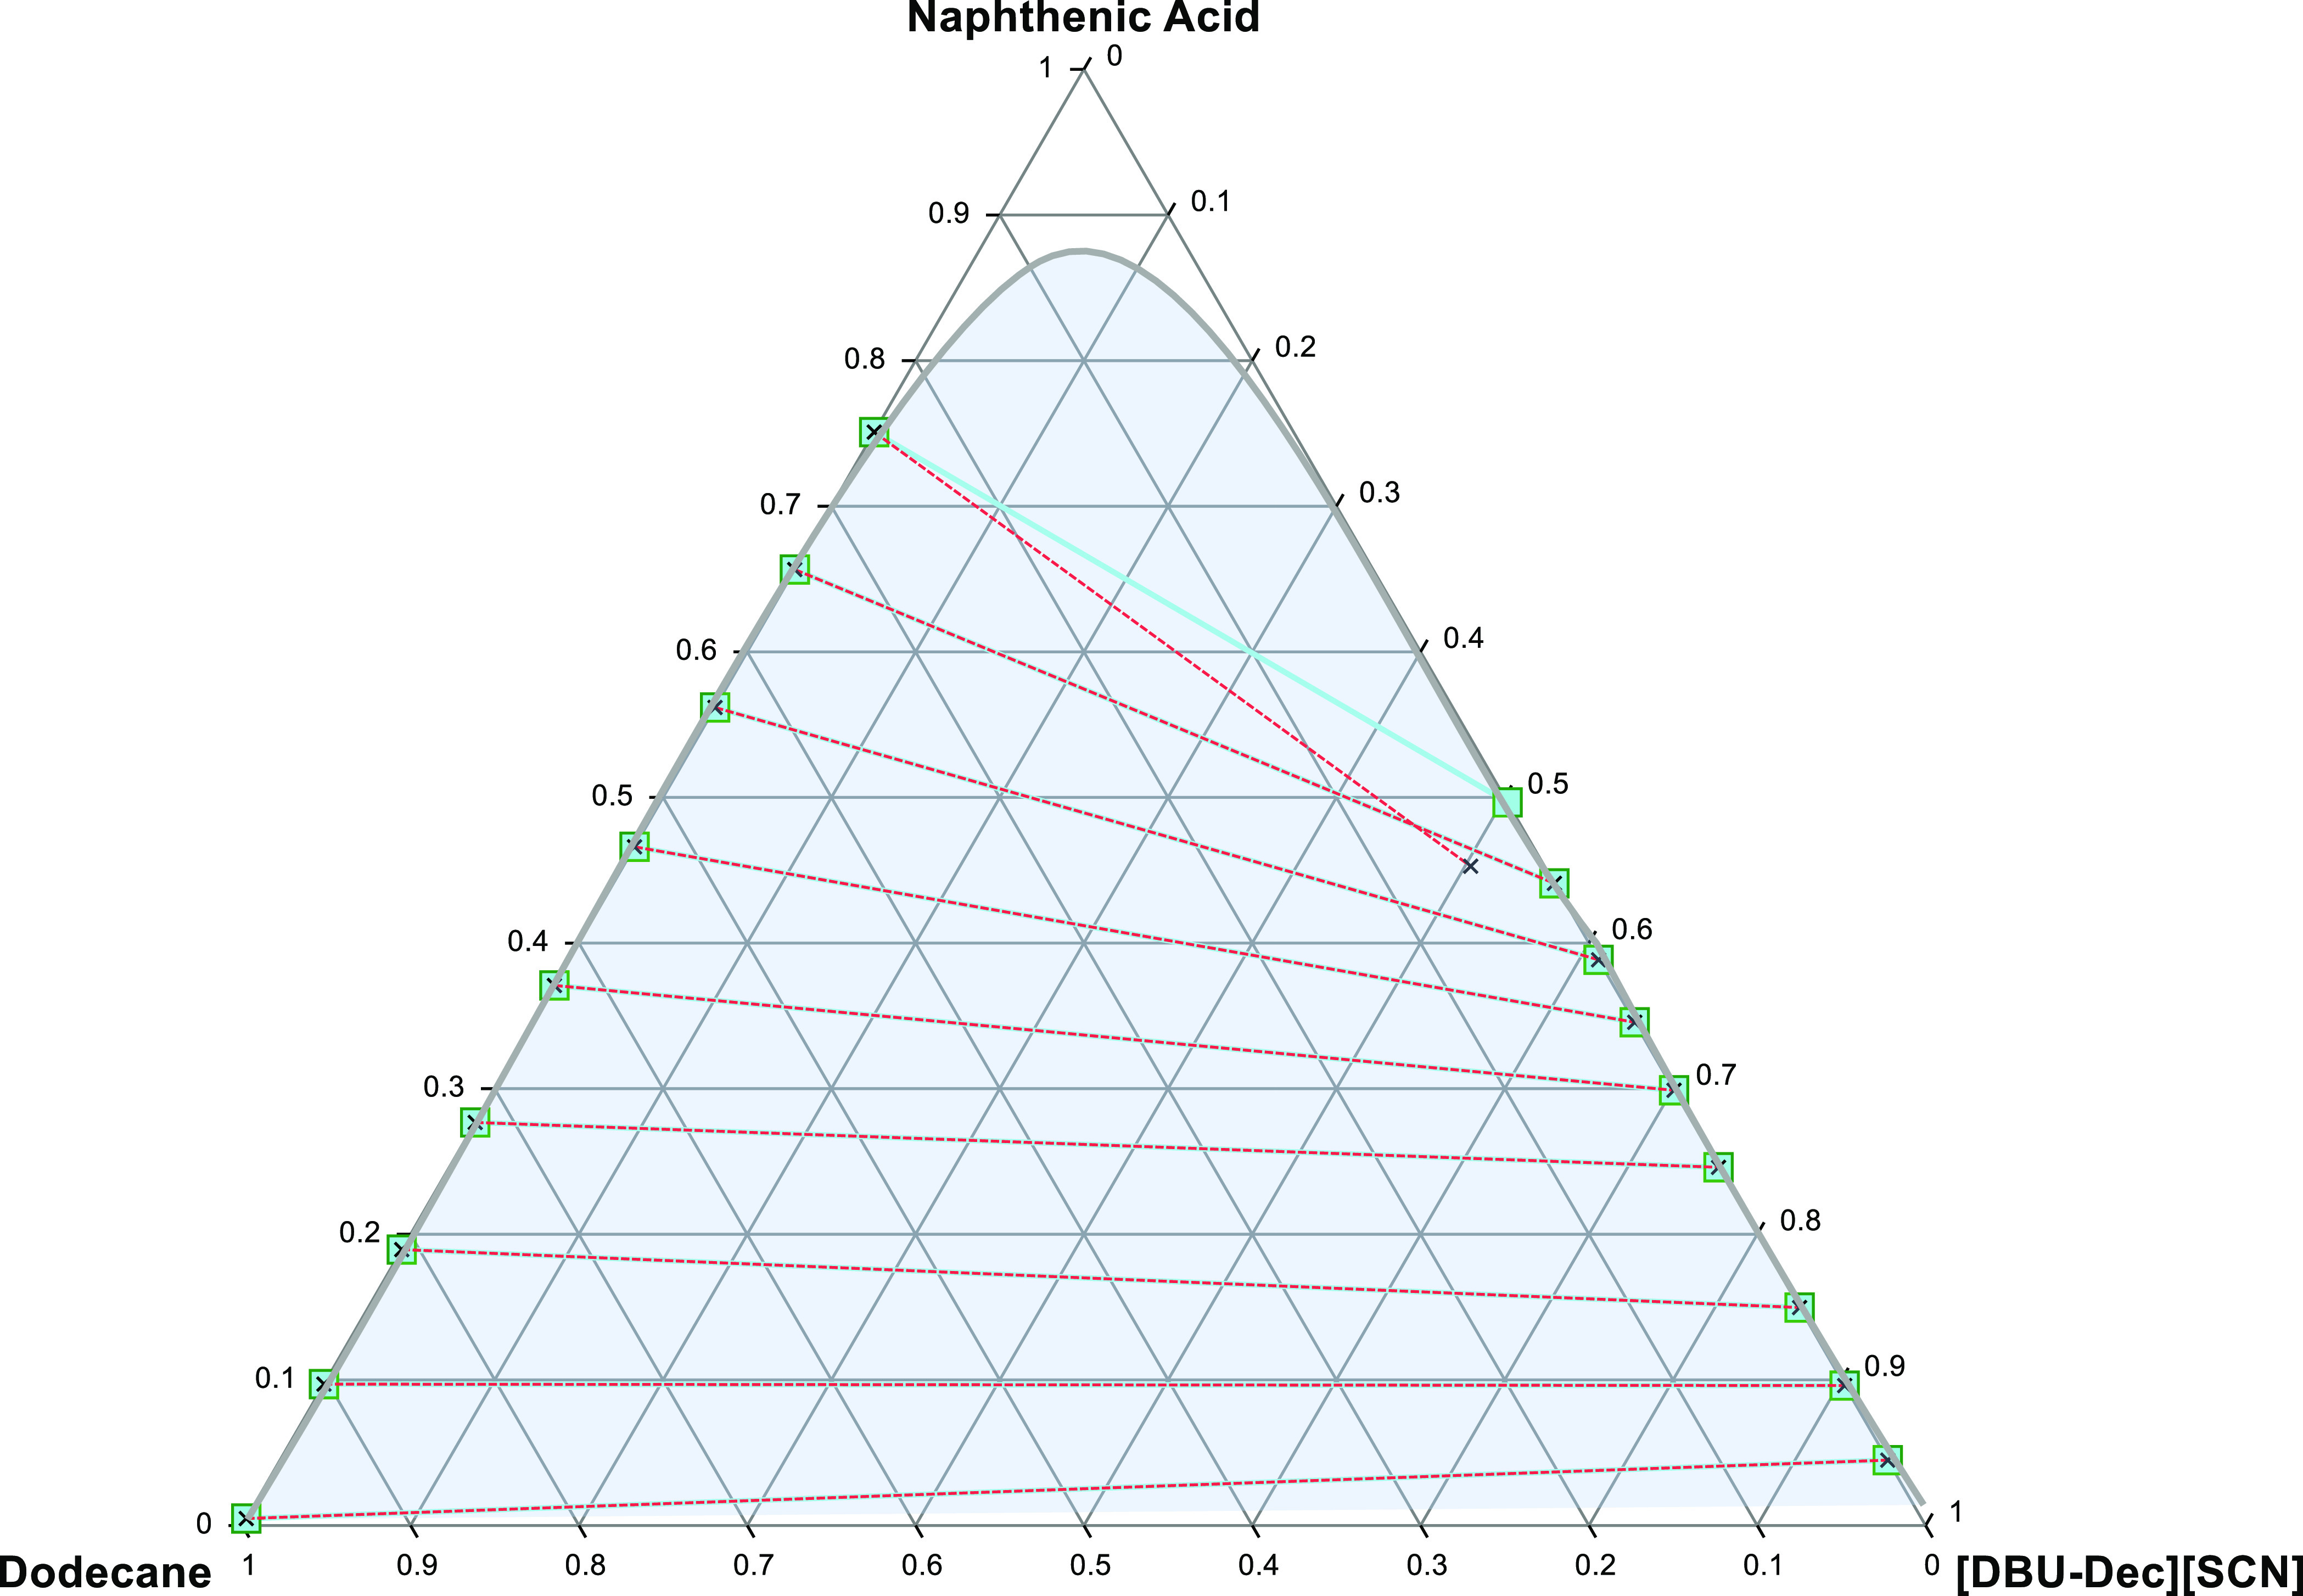
Liquid–liquid equilibrium graph illustrating comparison for the system; NA + [DBU-Dec] [SCN] and dodecane (solid lines and squares illustrate experimental tie lines whereas dashed lines and crosses illustrate Margules model data).
Table 3. NRTL Factors Determined by Regression Using LLE Data at Temperature 303.2 K.
| components (i–j) | αij (K) | αij (K) | Fa | rmsdb |
|---|---|---|---|---|
| naphthenic acid + [DBU-Hex] [SCN]+ dodecane | ||||
| 1–2 | 12.990 | 14.826 | 1.87 × 10⁻¹⁷ | 6.08 × 10–09 |
| 1–3 | –9.909 | 14.336 | ||
| 2–3 | –1.176 | 11.162 | ||
| dodecane + naphthenic acid + [DBU-Oct] [SCN] | ||||
| 1–2 | –10.977 | 11.835 | 9.94 × 10⁻¹⁸ | 6.18 × 10–09 |
| 1–3 | –9.944 | 11.335 | ||
| 2–3 | –10.132 | 10.132 | ||
| dodecane + naphthenic acid + [DBU-Dec] [SCN] | ||||
| 1–2 | 6.655 | 5.769 | 4.77 × 10⁻⁷ | 1.34 × 10–04 |
| 1–3 | –12.867 | 6.185 | ||
| 2–3 | –14.764 | 3.156 | ||
Table 4. Margules Factors/Parameters Determined by Regression Using LLE Data at Temperature 303.2 K.
| components/species (i–j) | Aij (K) | Aij (K) | Fa | rmsdb |
|---|---|---|---|---|
| naphthenic acid + [DBU-Hex] [SCN]+ dodecane | ||||
| 1–2 | 2.786 | 1.584 | 1.12 × 10⁻⁸ | 1.60 × 10–03 |
| 1–3 | –3.900 | –10.000 | ||
| 2–3 | 9.837 | –10.0000 | ||
| dodecane + naphthenic acid + [DBU-Oct] [SCN] | ||||
| 1–2 | 10.000 | –4.174 | 3.67 × 10⁻¹⁶ | 6.08 × 10–09 |
| 1–3 | –2.734 | 0.484 | ||
| 2–3 | 10.000 | –10.000 | ||
| dodecane + naphthenic acid + [DBU-Dec] [SCN] | ||||
| 1–2 | 2.631 | 7.827 | 8.91 × 10⁻⁷ | 2.00 × 10–03 |
| 1–3 | –7.109 | –7.582 | ||
| 2–3 | 7.678 | –9.994 | ||
In general, the Margules model satisfactorily correlates all data values. However, model results at the extrema for [DBU-Hex] [SCN] and [DBU-Dec] [SCN] show a little deviation from experimental data points, which is still within the range of experimental error. This error can be reduced by careful regression of binary interaction parameters with a larger experimental data set.
The interaction parameters calculated using NRTL and Margules models are given in Tables 3 and 4. The interaction parameters can be used to perform many thermodynamic calculations, such as the enthalpy of the mixtures. Furthermore, they can be used in the designing of LLE columns for any desired concentration of the product. These interaction parameters can be employed in design software such as ASPEN-HYSYS to do the design and thermodynamic calculations.
4. Conclusions
In this study, ultrasound was employed to get the liquid–liquid equilibrium data for the first time. It was found that UALLE can be extremely useful to get the liquid–liquid equilibrium data as it can save a significant amount of time. An extremely high concentration of NA and low oil/IL ratio was used in the feed to extract NA by using DBU-based thiocyanate ILs from dodecane. For NA, a positive slope was obtained at low concentrations; however, by increasing the NA concentration in the feed, the slope of the tie lines becomes negative. This shows that a high amount of ILs is required for the complete separation. Chain length plays a significant role in the solubility of NA in the ILs. Thus, from the LLE data and the distribution coefficient values, it can conclude that [DBU-Dec] [SCN] has the highest extraction efficiency compared to [DBU-Hex] [SCN] and [DBU-Oct] [SCN].
Furthermore, no leaching of the ILs to the raffinate phase had occurred, thus eliminating any further purification steps. The NRTL and Margules models give a satisfactory correlation of the experimental LLE data for the studied ternary systems. Both models provide similar correlative capability. Furthermore, the results presented in the current study showed the applicability of the COSMO-RS model for screening of ILs that can be successfully employed for the selected component separation from hydrocarbon mixtures.
Supporting Information Available
The Supporting Information is available free of charge at https://pubs.acs.org/doi/10.1021/acsomega.2c02514.
1H NMR spectrum of the dodecane layer showing no traces of ionic liquid, 1H NMR spectrum of the IL([DBU-Dec] [SCN] with naphthenic acid) layer showing no traces of dodecane, liquid–liquid equilibrium plot (experimental) for the system including dodecane + [DBU-Hex] [SCN] and naphthenic acid at the temperature 303.23 K, liquid–liquid equilibrium plot (experimental) for the system including dodecane + [DBU-Oct] [SCN] and naphthenic acid at the temperature 303.23 K, liquid–liquid equilibrium plot (experimental) for the system including dodecane + [DBU-Dec] [SCN] and naphthenic acid at temperature 303.23 K, liquid–liquid equilibrium graph showing comparison for naphthenic acid + [DBU-Hex] [SCN] and dodecane (solid lines and squares illustrate experimental tie lines, whereas dashed lines and crosses illustrate COSMO-RS predicted data), liquid–liquid equilibrium graph illustrating comparison for the system dodecane[DBU-Hex] [SCN] + naphthenic acid (solid lines and squares illustrate experimental tie lines, whereas dashed lines and crosses illustrate NTRL model data), liquid–liquid equilibrium graph illustrating comparison for the system naphthenic acid + dodecane and [DBU-Hex] [SCN] (solid lines and squares illustrate experimental tie lines, whereas dashed lines and crosses illustrate Margules model data), and experimental LLE data for the ternary systems dodecane (1) + [DBU-Oct] [SCN] (2) + naphthenic acid and (3) and dodecane (1) + [DBU-Dec] [SCN] (2) + naphthenic acid (3) on a mole fraction basis (PDF)
The authors declare no competing financial interest.
Supplementary Material
References
- Plechkova N. V.; Seddon K. R. Applications of ionic liquids in the chemical industry. Chem. Soc. Rev. 2008, 37, 123–150. 10.1039/b006677j. [DOI] [PubMed] [Google Scholar]
- Abai M.; Atkins M. P.; Hassan A.; Holbrey J. D.; Kuah Y.; Nockemann P.; Oliferenko A. A.; Plechkova N. V.; Rafeen S.; Rahman A. A.; Ramli R.; Shariff S. M.; Seddon K. R.; Srinivasan G.; Zou Y. An ionic liquid process for mercury removal from natural gas. Dalton Trans. 2015, 44, 8617–8624. 10.1039/c4dt03273j. [DOI] [PubMed] [Google Scholar]
- Baharuddin S. H.; Mustahil N. A.; Reddy A. V. B.; Abdullah A. A.; Mutalib M. I. A.; Moniruzzaman M. Development, formulation and optimization of a novel biocompatible ionic liquids dispersant for the effective oil spill remediation. Chemosphere 2020, 249, 126125. 10.1016/j.chemosphere.2020.126125. [DOI] [PubMed] [Google Scholar]
- Thangaraj V.; Bhaskarapillai A. Crosslinked poly(ionic liquid)s as selective receptors for Cr(VI)—Counter anion effect and application in treating drinking water and tannery effluents. Chemosphere 2022, 286, 131922. 10.1016/j.chemosphere.2021.131922. [DOI] [PubMed] [Google Scholar]
- Swati I. K.; Sohaib Q.; Cao S.; Younas M.; Liu D.; Gui J.; Rezakazemi M. Protic/aprotic ionic liquids for effective CO2 separation using supported ionic liquid membrane. Chemosphere 2021, 267, 128894. 10.1016/j.chemosphere.2020.128894. [DOI] [PubMed] [Google Scholar]
- Huang H.-L.; Huang Z.-H.; Chu Y.-C.; Lin H.-P.; Chang Y.-J. Application of metallic nanoparticle-biochars with ionic liquids for thermal transfer fluids. Chemosphere 2020, 250, 126219. 10.1016/j.chemosphere.2020.126219. [DOI] [PubMed] [Google Scholar]
- Anderson K.; Goodrich P.; Hardacre C.; Hussain A.; Rooney D.; Wassell D. Removal of naphthenic acids from crude oil using amino acid ionic liquids. Fuel 2013, 108, 715–722. 10.1016/j.fuel.2013.02.030. [DOI] [Google Scholar]
- Shah S. N.; Mutalib M. A.; Ismail M. F.; Suleman H.; Lethesh K. C.; Pilus R. B. M. Thermodynamic modelling of liquid-liquid extraction of naphthenic acid from dodecane using imidazolium based phenolate ionic liquids. J. Mol. Liq. 2016, 219, 513–525. 10.1016/j.molliq.2016.03.053. [DOI] [Google Scholar]
- Brient J. A.; Wessner P. J.; Doyle M. N.. Naphthenic acids: Kirk-Othmer Encyclopedia of Chemical Technology; Wiley, 1995. [Google Scholar]
- Rudzinski W. E.; Oehlers L.; Zhang Y.; Najera B. Tandem mass spectrometric characterization of commercial naphthenic acids and a Maya crude oil. Energy Fuels 2002, 16, 1178–1185. 10.1021/ef020013t. [DOI] [Google Scholar]
- Miles S. M.; Asiedu E.; Balaberda A.-l.; Ulrich A. C. Oil sands process affected water sourced Trichoderma harzianum demonstrates capacity for mycoremediation of naphthenic acid fraction compounds. Chemosphere 2020, 258, 127281. 10.1016/j.chemosphere.2020.127281. [DOI] [PubMed] [Google Scholar]
- Vander Meulen I. J.; Klemish J. L.; Peru K. M.; Chen D. D. Y.; Pyle G. G.; Headley J. V. Molecular profiles of naphthenic acid fraction compounds from mine lease wetlands in the Athabasca Oil Sands Region. Chemosphere 2021, 272, 129892. 10.1016/j.chemosphere.2021.129892. [DOI] [PubMed] [Google Scholar]
- Headley J. V.; McMartin D. W. A review of the occurrence and fate of naphthenic acids in aquatic environments. J. Environ. Sci. Health, Part A 2004, 39, 1989–2010. 10.1081/ese-120039370. [DOI] [PubMed] [Google Scholar]
- Speight J. G.High acid crudes; Gulf Professional Publishing, 2014. [Google Scholar]
- Wang Y.; Li J.; Sun X.; Duan H.; Song C.; Zhang M.; Liu Y. Removal of naphthenic acids from crude oils by fixed-bed catalytic esterification. Fuel 2014, 116, 723–728. 10.1016/j.fuel.2013.08.047. [DOI] [Google Scholar]
- Oh H.-Y.; Park J.-H.; Rhee Y.-W.; Kim J.-N. Decarboxylation of naphthenic acid using alkaline earth metal oxide. J. Ind. Eng. Chem. 2011, 17, 788–793. 10.1016/j.jiec.2011.05.024. [DOI] [Google Scholar]
- Shohaimi N. A. M.; Bakar W. A. W. A.; Jaafar J. Catalytic neutralization of acidic crude oil utilizing ammonia in ethylene glycol basic solution. J. Ind. Eng. Chem. 2014, 20, 2086–2094. 10.1016/j.jiec.2013.09.037. [DOI] [Google Scholar]
- Shukri N. M.; Bakar W. A. W. A.; Jaafar J.; Majid Z. A. Removal of naphthenic acids from high acidity Korean crude oil utilizing catalytic deacidification method. J. Ind. Eng. Chem. 2015, 28, 110–116. 10.1016/j.jiec.2015.02.005. [DOI] [Google Scholar]
- Anderson K.; Atkins M.; Goodrich P.; Hardacre C.; Hussain A.; Pilus R.; Rooney D. Naphthenic acid extraction and speciation from Doba crude oil using carbonate-based ionic liquids. Fuel 2015, 146, 60–68. 10.1016/j.fuel.2015.01.015. [DOI] [Google Scholar]
- Nasir Shah S.; Kallidanthiyil Chellappan L.; Gonfa G.; Mutalib M. I. A.; Pilus R. B. M.; Bustam M. A. Extraction of naphthenic acid from highly acidic oil using phenolate based ionic liquids. Chem. Eng. J. 2016, 284, 487–493. 10.1016/j.cej.2015.09.017. [DOI] [Google Scholar]
- Shah S. N.; Ismail M.; Mutalib M. I. A.; Pilus R. B. M.; Chellappan L. K. Extraction and recovery of toxic acidic components from highly acidic oil using ionic liquids. Fuel 2016, 181, 579–586. 10.1016/j.fuel.2016.05.041. [DOI] [Google Scholar]
- Sun Y.; Shi L. Basic ionic liquids with imidazole anion: New reagents to remove naphthenic acids from crude oil with high total acid number. Fuel 2012, 99, 83–87. 10.1016/j.fuel.2012.04.014. [DOI] [Google Scholar]
- Thompson L.; Doraiswamy L. Sonochemistry: science and engineering. Ind. Eng. Chem. Res. 1999, 38, 1215–1249. 10.1021/ie9804172. [DOI] [Google Scholar]
- Mei H.; Mei B.; Yen T. F. A new method for obtaining ultra-low sulfur diesel fuel via ultrasound assisted oxidative desulfurization. Fuel 2003, 82, 405–414. 10.1016/s0016-2361(02)00318-6. [DOI] [Google Scholar]
- Petrier C.; Luche J. L.; Luche J. L.. Synthetic organic sonochemistry; Plenum Press: New York, 1998; pp 53–56. [Google Scholar]
- Lethesh K. C.; Shah S. N.; Mutalib M. A. Synthesis, characterization, and thermophysical properties of 1, 8-diazobicyclo [5.4. 0] undec-7-ene based thiocyanate ionic liquids. J. Chem. Eng. Data 2014, 59, 1788–1795. 10.1021/je400991s. [DOI] [Google Scholar]
- Sarwono A.; Man Z.; Muhammad N.; Khan A. S.; Hamzah W. S. W.; Rahim A. H. A.; Ullah Z.; Wilfred C. D. A new approach of probe sonication assisted ionic liquid conversion of glucose, cellulose and biomass into 5-hydroxymethylfurfural. Ultrason. Sonochem. 2017, 37, 310–319. 10.1016/j.ultsonch.2017.01.028. [DOI] [PubMed] [Google Scholar]
- Fan T. P. Characterization of naphthenic acids in petroleum by fast atom bombardment mass spectrometry. Energy Fuels 1991, 5, 371–375. 10.1021/ef00027a003. [DOI] [Google Scholar]
- Schmitter J.; Arpino P.; Guiochon G. Investigation of high-molecular-weight carboxylic acids in petroleum by different combinations of chromatography (gas and liquid) and mass spectrometry (electron impact and chemical ionization). J. Chromatogr. A 1978, 167, 149–158. 10.1016/s0021-9673(00)91154-3. [DOI] [Google Scholar]
- Hsu C. S.; Dechert G.; Robbins W.; Fukuda E. Naphthenic acids in crude oils characterized by mass spectrometry. Energy Fuels 2000, 14, 217–223. 10.1021/ef9901746. [DOI] [Google Scholar]
- Diedenhofen M.; Klamt A. COSMO-RS as a tool for property prediction of IL mixtures—a review. Fluid Phase Equilib. 2010, 294, 31–38. 10.1016/j.fluid.2010.02.002. [DOI] [Google Scholar]
- Klamt A.; Eckert F. COSMO-RS: a novel and efficient method for the a priori prediction of thermophysical data of liquids. Fluid Phase Equilib. 2000, 172, 43–72. 10.1016/s0378-3812(00)00357-5. [DOI] [Google Scholar]
- Klamt A.; Eckert F.; Arlt W. COSMO-RS: an alternative to simulation for calculating thermodynamic properties of liquid mixtures. Annu. Rev. Chem. Biomol. Eng. 2010, 1, 101–122. 10.1146/annurev-chembioeng-073009-100903. [DOI] [PubMed] [Google Scholar]
- Klamt A.COSMO-RS: from quantum chemistry to fluid phase thermodynamics and drug design; Elsevier, 2005. [Google Scholar]
- Freire M. G.; Carvalho P. J.; Santos L. M.; Gomes L. R.; Marrucho I. M.; Coutinho J. A. Solubility of water in fluorocarbons: Experimental and COSMO-RS prediction results. J. Chem. Thermodyn. 2010, 42, 213–219. 10.1016/j.jct.2009.08.005. [DOI] [Google Scholar]
- Freire M. G.; Ventura S. P.; Santos L. M.; Marrucho I. M.; Coutinho J. A. Evaluation of COSMO-RS for the prediction of LLE and VLE of water and ionic liquids binary systems. Fluid Phase Equilib. 2008, 268, 74–84. 10.1016/j.fluid.2008.04.009. [DOI] [Google Scholar]
- Freire M. G.; Santos L. M.; Marrucho I. M.; Coutinho J. A. Evaluation of COSMO-RS for the prediction of LLE and VLE of alcohols+ ionic liquids. Fluid Phase Equilib. 2007, 255, 167–178. 10.1016/j.fluid.2007.04.020. [DOI] [Google Scholar]
- TURBOMOLE V7.1 2016, a development of University of Karlsruhe and Forschungszentrum Karlsruhe GmbH, 1989-2007; TURBOMOLE GmbH, 2007. http://www.turbomole.com.
- COSMOtherm, C3.0, release 1601; COSMOlogic GmbH & Co KG, 2019. http://www.cosmologic.de.
- García S.; Larriba M.; García J.; Torrecilla J. S.; Rodríguez F. Liquid– liquid extraction of toluene from heptane using 1-alkyl-3-methylimidazolium bis (trifluoromethylsulfonyl) imide ionic liquids. J. Chem. Eng. Data 2010, 56, 113–118. 10.1021/je100982h. [DOI] [Google Scholar]
- Duan J.; Sun Y.; Shi L. Three different types of heterocycle of nitrogen-containing alkaline ionic liquids treatment of acid oil to remove naphthenic acids. Catal. Today 2013, 212, 180–185. 10.1016/j.cattod.2012.07.023. [DOI] [Google Scholar]
- Manan N. A.; Atkins M. P.; Jacquemin J.; Hardacre C.; Rooney D. W. Phase equilibria of binary and ternary systems containing ILs, dodecane, and cyclohexanecarboxylic acid. Sep. Sci. Technol. 2012, 47, 312–324. 10.1080/01496395.2011.620588. [DOI] [Google Scholar]
- Renon H.; Prausnitz J. M. Local compositions in thermodynamic excess functions for liquid mixtures. AIChE J. 1968, 14, 135–144. 10.1002/aic.690140124. [DOI] [Google Scholar]
- Simoni L. D.; Lin Y.; Brennecke J. F.; Stadtherr M. A. Modeling liquid-liquid equilibrium of ionic liquid systems with NRTL, electrolyte-NRTL, and UNIQUAC. Ind. Eng. Chem. Res. 2008, 47, 256–272. 10.1021/ie070956j. [DOI] [Google Scholar]
- Sørensen J.; Arlt W.. Liquid–Liquid Equilibrium Data Collection; DECHEMA: Frankfurt/Main, Germany, 1979. [Google Scholar]
- Wohl K. Thermodynamic evaluation of binary and ternary liquid systems. Chem. Eng. Prog. 1953, 49, 218–219. [Google Scholar]
Associated Data
This section collects any data citations, data availability statements, or supplementary materials included in this article.