

Abstract
Carbon quantum dots (CQDs) have potential applications in many fields such as light-emitting devices, photocatalysis, and bioimaging due to their unique photoluminescence (PL) properties and environmental benignness. Here, we report the synthesis of nitrogen-doped carbon quantum dots (NCQDs) from citric acid and m-phenylenediamine using a one-pot hydrothermal approach. The environment-dependent emission changes of NCQDs were extensively investigated in various solvents, in the solid state, and in physically assembled PMMA–PnBA–PMMA copolymer gels in 2-ethyl-hexanol. NCQDs display bright emissions in various solvents as well as in the solid state. These NCQDs exhibit multicolor PL emission across the visible region upon changing the environment (solutions and polymer matrices). NCQDs also exhibit excitation-dependent PL and solvatochromism, which have not been frequently investigated in CQDs. Most CQDs are nonemissive in the aggregated or solid state due to the aggregation-caused quenching (ACQ) effect, limiting their solid-state applications. However, NCQDs synthesized here display a strong solid-state emission centered at 568 nm attributed to the presence of surface functional groups that restrict the π–π interaction between the NCQDs and assist in overcoming the ACQ effect in the solid state. NCQD-containing gels display significant fluorescence enhancement in comparison to the NCQDs in 2-ethyl hexanol, likely because of the interaction between the polar PMMA blocks and NCQDs. The application of NCQDs-Gel as a solid/gel state fluorescent display has been presented. This research facilitates the development of large-scale, low-cost multicolor phosphor for the fabrication of optoelectronic devices, sensing, and bioimaging applications.
Introduction
Heavy metal-based semiconductor quantum dots (SCDs) such as CdSe, CdTe, and PbTe have been investigated as potential candidates for display and lighting applications because of their high photoluminescence quantum yield (PLQY) and color tunability.1−4 However, these quantum dots are expensive for large-scale production and, because of the presence of heavy metals, are potentially toxic for humans and hazardous to the environment.
Carbon quantum dots (CQDs) are the most prominent alternatives to SCDs that do not have some of these limitations. CQDs have been increasingly popular in the last decade due to their exciting characteristics such as ease of synthesis and subsequent surface modifications, low cost, photocatalytic responses, and environmental friendliness.5−8 CQDs have already been investigated in various potential applications similar to SCDs and also in some additional applications such as medical diagnosis, drug delivery, sensing, solar cell, and photocatalysis.9−15 The above applications require fluorescence across the visible spectrum from blue to red with high PLQY. Hence, tunable multicolor CQDs are highly desirable. CQDs have been synthesized through top-down and bottom-up approaches using various carbon precursors and small molecules, and most of these CQDs emit blue light.14−16 CQDs display strong luminescence and tunable photoluminescence (PL) characteristics, but despite recent progress, the underlying PL emission mechanism and excitation-dependent emission behavior still need further investigations.
Most of the CQDs reported in the literature are highly emissive in solution or in a dispersed state, but these are weakly emissive or nonemissive in the solid state due to π–π stacking and excessive resonance energy transfer between fluorophores, resulting in fluorescence quenching.17−19 This unwanted phenomenon, known as the aggregation-caused quenching (ACQ) effect, generally occurs in most organic fluorophores.19,20 The ACQ effect could limit the applications of CQDs, especially in optoelectronic device fabrication, as the phosphor needs to be emissive in the solid state. Therefore, achieving solid-state emissive CQDs is desired but challenging, and their emission mechanism is still debated.
Citric acid is a commonly available carbon precursor that has widely been used for the synthesis of carbon dots as the three carboxyl and one hydroxyl groups allow them to react with many small molecules and with themselves.21,22 Phenylenediamine isomers such as ortho (o-), meta (m-), and para (p-) phenylenediamines are also of significant importance for synthesizing polymers and many heterocyclic compounds.23−25 Phenylenediamine isomers as a nitrogen source precursor to prepare carbon dots using the solvothermal method have been reported in the literature, but there are only a few reports on tunable multicolor emission characteristics obtained from this precursor.17,26−28 Full color (red, green, blue) tunable carbon dots were synthesized only from o-, m-, and p-phenylenediamines precursors through the solvothermal method, and their applications in cellular imaging have been reported.17 Carbon dots synthesized from phenylenediamine isomers have been used to cross-link alginate hydrogels.26 In a recent study, multicolor emissive carbon dots were synthesized using citric acid and p-phenylenediamine through a hydrothermal process, resulting in ≈24% relative fluorescence quantum yield, measured with respect to the standard fluorescence dye (quinine sulfate), in chlorobenzene and 4–19% in polar protic solvents.28
Similar to various solvents, a polymeric environment can affect the emission properties of quantum dots. The enhanced emission observed in graphene quantum dots (GQDs) containing polymer blends (with regioregular poly(3-hexylthiophene-2,5-diyl) or poly(2-methoxy-5-(2-ethylhexyloxy)-1,4-phenylenevinylene)) demonstrated significant improvement in organic photovoltaic characteristics.29 The fluorescence emission of maleimide-functionalized GQDs has been restored (turn-on) while interrupting the Froster resonance energy transfer system between tetrakis(4-aminophenyl)porphyrin and GQDs using glutathione molecules.30
Herein, we report tunable multicolor nitrogen-doped carbon quantum dots (NCQDs) with strong solid-state luminescence, synthesized by the hydrothermal process using citric acid and m-phenylenediamine precursors. This is in contrast to the earlier reports on the fabrication of carbon dots from citric acid and o- or p-phenylenediamine as precursors, which have been reported to display lower relative PLQY.28,31−33 The NCQDs synthesized here exhibit two interesting characteristics: (i) solvent-dependent emission properties and (ii) excitation wavelength-dependent emission. NCQDs display tunable photoluminescence nearly across the entire visible spectrum, and the solvent interaction with NCQDs has been investigated thoroughly. In addition to the multicolor emission in solution, these NCQDs display yellow emission in the aggregate or solid state when excited with a 365 nm wavelength source. Further, CQDs have been embedded in a physical gel system, and the self-assembly process has been shown to uniquely enhance the emission intensity. Such solid-state emission behavior of carbon dots and incorporation in gel systems have not been frequently reported in the literature.19,34,35
Results and Discussion
Synthesis Strategy and Characterization
The schematic of the synthesis of NCQDs is shown in Figure 1a. Here, NCQDs were synthesized through a one-step bottom-up approach by the condensation reaction and carbonization of citric acid with m-phenylenediamine precursors. As shown in Figure 1a, the synthesis process involved mixing equal masses of citric acid and m-phenylenediamine in water, followed by the hydrothermal treatment in a Teflon-coated stainless steel autoclave at 200 °C for 9 h (further details can be found in the Experimental Section). Here, citric acid and m-phenylenediamine are the primary carbon and nitrogen sources, respectively, in NCQDs. The synthesized NCQDs dispersed in water exhibited cyan blue color under 365 nm (UV) illumination (Figure 1b). The structure of NCQDs consists of various functional groups.36,37 Especially, they have nitrogenous fused aromatic rings with sp2 and sp3 carbon domains (defined as core) and oxygenated species, namely, −C–O and −OH. Also, the other functional groups, such as −C=O, −NH2, −O=C–NH2, −OH, and −COOH, are present on the surface, particularly at the edges.38 As discussed below, Fourier transform infrared spectroscopy (FTIR) and X-ray photoelectron spectroscopy (XPS) confirm the presence of these functional groups in the NCQDs.
Figure 1.

(a) Hydrothermal synthetic route for the preparation of multicolor NCQDs, (b) photographs of NCQDs dispersed in water in daylight (left) and under the illumination of 365 nm (right), and (c) illustration showing the hydrogen bonding of polar protic and aprotic solvent molecules with surface functional groups of NCQDs.
The NCQDs were characterized by various techniques such as transmission electron microscopy (TEM), X-ray diffraction (XRD), FTIR, and XPS analysis. The TEM image presented in Figure 2a indicates that the NCQDs are quasispherical, and we have not been able to capture any clear crystal lattice fringes. The average particle size has been found to be ∼10 nm, and a representative NCQD with a diameter of ≈9.6 nm is shown in Figure 2a. The XRD pattern (Figure 2b) exhibits one broad peak at ≈19.32° attributed to the highly disordered carbon (amorphous), corresponding to a d-spacing of ≈0.46 nm, which is larger than the d-spacing (002 planes) of the graphitic structure. The formation of an amorphous structure is likely due to the abundance of oxygen-containing surface groups (see below).35
Figure 2.

(a) TEM image of a single NCQD at a higher magnification. (b) Powder XRD pattern of NCQDs.
The surface functional groups of NCQDs were characterized by FTIR and XPS techniques. The FTIR spectra of NCQDs are shown in Figure 3a. The broad peaks appeared in the range of 3100–3542 cm–1 ascribed to the −OH and −NH stretching vibrations, implying the presence of multiples of hydroxyl and amino groups present in the NCQDs. The aromatic −CH stretching vibration peaks were observed in the range of 2919–2896 cm–1. The strong absorption bands observed at 1700 and 1603 cm–1 are assigned to the −C=O/–COOH groups from the edge of NCQDs and the −C=N– (formed from the condensation of carboxylic acid and primary amine) stretching frequency of NCQDs.
Figure 3.

Characterization of NCQDs: (a) FTIR spectrum, (b) XPS full survey, and high-resolution XPS spectra for (c) C 1s, (d) N 1s, and (e) O 1s.
The surface functional groups and elemental composition of NCQDs were further characterized by XPS analysis. The XPS full scan spectrum, high-resolution XPS spectrum, and its deconvoluted spectra for carbon (C 1s), nitrogen (N 1s), and oxygen (O 1s) of NCQDs are shown in Figure 3b–e, respectively. In Figure 3b, the full scan XPS spectrum exhibits three bands that appeared at 285.96, 400.81, and 532.96 eV. These correspond to the existence of carbon (C 1s), nitrogen (N 1s), and oxygen (O 1s), respectively. The atomic ratio was found to be 69.64% (carbon), 7.58% (nitrogen), and 22.77% (oxygen), respectively. Further, as shown in Figure 3c, C 1s can be deconvoluted into four different carbon species C–C/C=C (sp2C) at 284.68 eV, C–N (sp3C) at 285.78 eV, C–O at 287.88 eV, and −C=O/–C=N at 289.08 eV. The N 1s spectrum can be fitted into three peaks at 399.18, 400.18, and 401.58 eV corresponding to pyridine N, amino N, and graphitic N, respectively, confirming the successful incorporation of nitrogen in the carbon core structure during surface passivation (Figure 3d). Thus, N 1s results indicate that the surface contains many nitrogenous fused aromatic rings (pyridinic N and graphitic N) in the core site and amino nitrogen and graphitic nitrogen at the edge site. Typically, the cores originate from the π-conjugated sp2 carbon domain in the carbon dots.39Figure 3e, the O 1s deconvoluted spectrum, shows that two kinds of species −C=O and −C–O appeared at 531.88 and 533.48 eV, respectively.
We can identify the functional groups present on the surface based on the FTIR and XPS data, as XPS predominantly captures the surface functional groups. From these results, we illustrated the NCQDs structure (Figure 1c), which depicts the presence of nitrogenous fused aromatic rings with sp2 and sp3 domains in the NCQDs. Also, there are some defects that mainly arise from the amorphous carbogenic profile as exhibited by broad reflection in the XRD pattern. These defects consist of different oxygenic moieties such as C–O–C, −OH, and −COOH in the NCQDs. Therefore, the FTIR and XPS results of NCQDs reveal that the synthesized NCQDs contain many hydrophilic groups such as −OH, −NH, and −C=O/–COOH on the surface, confirming that the NCQDs were successfully passivated with the nitrogen heteroatom. These surface functional groups make the NCQDs soluble in all common solvents, helping us to study their photophysical properties in these solvents in detail.
Photophysical Properties
The absorption spectrum of NCQDs suspended in deionized water was recorded and is shown in Figure 4a. The absorption spectrum exhibits broad-band absorption with a strong peak at 220 nm in the range of 200–450 nm with a tail extended to the entire visible region, similar to that reported for nitrogen-doped CQDs prepared by other protocols.28,40,41 The absorption bands are mainly centered around ≈220, 284, 380, and 492 nm.42 The strong absorption bands from 210–295 nm correspond to the π–π* transition of the −C=C– of the sp2 carbon core.43,44 The absorption shoulder from 348 to 492 nm is ascribed to the electronic transition of nonbonding orbital n (of −C=O/–C=N– and −NH2 groups) to the π* orbital.45,46 The direct band gap of NCQDs was determined from the Tauc plot shown in Figure 4b. (αhυ)2 versus E was plotted using UV–visible spectral data of NCQDs. Here, α is the normalized absorption coefficient, hυ is the energy of the incident wave, and E is the photon energy. The energy band gap (eV) calculated from the extrapolation of the linear region is 2.71 eV.36,47,48 The observed band gap of NCQDs is consistent with the cyan color fluorescence emitted by exciting these particles with 365 nm. The obtained band gap value is slightly larger than the reported value (2.40 eV) of graphene quantum dots synthesized from coal materials.48
Figure 4.

(a) UV–visible spectrum of NCQDs in water and (b) the corresponding plot for (αhυ)2 versus photon energy, E. The horizontal intercept of the tangent in (b) indicates the band gap of NCQDs. (c) PL emission spectra of NCQDs for different excitation wavelengths and (d) the corresponding normalized PL emission spectra.
The PL emission spectra of NCQDs in water excited at different wavelengths ranging from 300 to 450 nm at a 10 nm interval are shown in Figure 4c. The corresponding normalized spectra are shown in Figure 4d, obtained by dividing emission intensity values by the maximum emission intensity for each excitation wavelength. The normalized data clearly captures the change in emission properties for different excitation wavelengths. With increasing excitation wavelength, the emission wavelength is red-shifted (bathochromic shift). This phenomenon is referred to as excitation-dependent PL emission.11,49,50 For example, when excited at 300 nm, NCQDs emit blue light with the emission maxima centered at 431 nm, whereas exciting at 450 nm results in green color (502 nm). These results suggest that the emission of NCQDs can be made tunable from blue to green without changing any precursor.51−53
The synthesized NCQDs are well dispersed in common polar aprotic solvents, such as chloroform, dichloromethane, tetrahydrofuran, acetone, dimethylformamide, acetonitrile, and dimethyl sulfoxide, and polar protic solvents such as isopropanol, octanol, ethanol, methanol, and water. Also, these dispersions are very stable for a prolonged duration, as we have not seen significant changes in emission properties at least for two days. However, the NCQDs are not dispersible in nonpolar solvents like hexane, toluene, etc. The broad dispersibility of the NCQDs enabled the detailed investigations of photophysical properties in various solvents. To characterize the interaction of NCQDs with solvents, we have recorded absorption spectra and steady-state PL spectra of NCQDs in different polar protic and aprotic solvents, as listed above. The absorption spectra of NCQDs in these solvents are displayed in Figures 5a and S1. NCQDs in polar aprotic and protic solvents display two to three absorption bands in UV and visible regions at 250–400 and 450–650 nm (except chloroform and dichloromethane), respectively. The absorption bands in the higher-energy region (200–300 nm) can be attributed to the π–π* transition of −C=C–. The abundant N and O elements enhance the charge carrier density on the surface of NCQDs and induce the electron charge transfer toward the edge functional groups such as carboxyl, amino hydroxyl, and amide (the extended absorption band observed at 450–650 nm is shown in Figure 5a).27
Figure 5.

(a) Absorption spectra of NCQDs in polar protic solvents; (b) normalized emission spectra of NCQDs in different solvents excited at a wavelength of 360 nm; (c) emission maxima as a function of dielectric constants of solvents; and (d) Lippert–Mataga relationship capturing orientational polarization of hydrogen bonding solvents versus Stokes shift.
Different functional groups in the NCQDs can possibly interact with solvent dipoles.39 This solvent-dependent phenomenon is called solvatochromism, usually attributed to intramolecular charge transfer. This behavior is commonly observed in organic fluorophore materials54−56 but has not been investigated frequently for the carbon dots. We have recorded the PL emission spectra of NCQDs in different solvents by varying the excitation wavelengths (Figures S2 and S3), and the corresponding CIE diagrams are shown in Figure 6. The CIE diagram depicts that the emission is red-shifted with the increase in the excitation wavelength. This is likely due to the existence of different emissive sites on the surface of NCQDs, which are responsible for the excitation-dependent emission properties. Further, the emission color changes from blue to orangish red in methanol and blue to green in other solvents when the excitation wavelength reaches 480 nm. These results confirm the highly tunable emission without changing any synthetic protocol and make them a promising material in optoelectronic applications.
Figure 6.

CIE diagram of NCQD dispersion in (a) acetone, (b) tetrahydrofuran, (c) dimethylformamide, (d) methanol, and (e) water with different excitation wavelengths.
To further understand the solvatochromism effect in NCQDs, we have recorded PL emission spectra in different solvents while excited at 360 nm. The normalized PL spectra are shown in Figure 5b (data without normalization are shown in Figure S4). There is a red shift of emission maximum with increasing solvent polarity. The emission shift to the lower energy region with increasing polarity is likely due to the excited-state stabilization by the polar solvent molecules. The dipole moment of solvents with increasing solvent polarity affects the surface electronic state, resulting in a red-shifted emission wavelength.57 The emission maximum is at 419 nm for THF, a less polar solvent, and this maximum shifts to 467 nm in a high polar solvent, such as water. The polarity parameters of different solvents and photophysical data of NCQDs in polar protic and aprotic solvents are tabulated in Table S1. Emission maxima in eV for different polar protic and aprotic solvents versus the dielectric constants of the solvents are plotted in Figure 5c. The emission maxima are approximately linear to the dielectric constants of the solvents, which confirms that both ground and excited states are sensitive to the solvent environment.
For more insights into emission properties with solvent polarity, we have investigated the applicability of the Lippert–Mataga relationship. The orientational polarization that arises from the dipole moments of different polar aprotic and polar protic solvents was calculated from the Lippert–Mataga equation.58 Orientational polarizability versus Stokes shift values of different polar aprotic and protic solvents is plotted in Figure S5. The solvent-dependent emission properties can be interpreted using the Lippert–Mataga plot, which displays a linear relationship between the Stokes shift and orientational polarization if the emission properties depend on the solvent dipole moment. As displayed in Figure S5, the Stokes shift for NCQDs is not linear with respect to their orientational polarization if all solvents are considered. However, a linear relationship can be found for the alcohols considered here: octanol, isopropanol, ethanol, and methanol (Figure 5d). Thus, it can be inferred that the alcohols form hydrogen bonds (specific solvent interaction) with the functional groups present on the NCQD surface.
The hydrogen bonding donation capability of solvents can be quantified by the well-known Kamlet–Taft parameter shown in Table S2. The polar protic solvents have a high α′ (hydrogen bond donation) value than the polar aprotic solvents, and as a result, the −OH group in the polar protic solvents form hydrogen bonds with the surface functional groups of NCQDs, as illustrated in Figure 1c. Also, the decrease in the emission intensity of polar protic solvents is due to the formation of specific solvent interaction that results in nonradiative decay. In the case of polar aprotic solvents, the NCQDs can donate protons to the aprotic solvents (proton-accepting capability) as conveyed by moderately large β Kamlet–Taft values shown in Table S2. Thus, it can be concluded that specific hydrogen bonding primarily dictates the photoluminescence characteristics of NCQDs in protic solvents, which leads to excited-state stabilization.59,60 In polar aprotic solvents, both strong hydrogen bonding acceptance basicity and dipole moment are responsible for photoluminescence.
To further investigate the solvent interaction with NCQDs, we have determined the absolute PLQY (ΦF) of the NCQDs in dimethylformamide, a polar aprotic solvent, and four alcohols, namely, ethanol, isopropanol, methanol, octanol, and water (polar protic). The ΦF values vary between 14 and 30%, depending on the nature of the solvents (Table S3), as the highest PLQY of ∼30% was obtained in 1-octanol, whereas the lowest PLQY of ∼14% was obtained in DMF. The NCQDs exhibit high absolute PLQY in polar protic solvents and a moderate value in DMF, a polar aprotic solvent. The PLQY of NCQDs in alcohols majorly depends on the hydrogen bonding capacity, hydrophobicity, and viscosity. Generally, if the chain length of alcohols increases, the hydrogen bonding ability decreases, and the viscosity also increases with the chain length. Here, the PLQY of NCQDs in alcohols increases with an increase in the chain length (methanol → ethanol → isopropanol → octanol). Therefore, the viscosity and the hydrophobicity of alcohols enable the restriction of the intramolecular motion of the NCQDs, resulting in high PLQY. The same reason could be attributed to the decrease in PL intensity with an increase in polarity (discussed earlier in solvatochromism).
The PLQYs of NCQDs obtained here are higher than the earlier reported values for carbon dots in protic solvents obtained from the hydrothermal process, demonstrating that the PLQYs highly depend on the synthetic protocol.28,61,62 The high quantum yield and the CIE value of NCQDs (shown in Figure 6d) in the range of blue color (CIEy < 0.10) are highly desirable in deep blue light-emitting diode applications.63 The fluorescence intensity decay was measured in polar protic solvents such as deionized water, methanol, ethanol, isopropanol, and an aprotic solvent, DMF. The results are shown in Figure 7a. The experimental data were fitted using a single exponential function, as I = Ae–(t/τ) + I0, where I is the fluorescence intensity, t is the time, I0 is the offset, and τ is the fluorescence lifetime. This function can fit the experimental data reasonably well (R2 > 0.99), indicating that the observed fluorescence emanates from a well-defined electronic transition. The fluorescence lifetime of NCQDs has not changed significantly with the change in the solvent polarity. Our NCQDs exhibit multicolor emission properties with high PLQY by exciting them in different wavelengths and changing the solvent environment. This gives an easy way to switch from the existing environmentally hazardous quantum dots (CdSe, CdTe, and PbTe) to reduce the production cost and synthetic difficulties for multicolor applications. With unique emission properties in alcoholic solvents, our NCQDs could be a promising fluorescent probe for sensing compounds containing hydroxyl groups.
Figure 7.

(a) Fluorescence intensity decay and model fit in different solvents (excitation at 360 nm and emission at 450 nm). (b) Solid-state absorption and PL emission spectrum of the NCQD powder. (c) CIE diagram of the NCQD powder. (d) Fluorescence emission photographs of the NCQD powder under the illumination of visible and UV 365 nm light.
Interestingly, we have also observed the solid-state PL emission in the NCQD powder, and this has been studied in detail. As shown in Figure 7b, the absorption spectrum of the NCQD powder shows three bands in the 200–300 nm range. These can be attributed to the π–π* transition of the aromatic sp2 carbon core. The band at 300–500 nm is due to the n−π* transition of hydrophilic functional groups −C=N/–C=O and/or −C–N. Most of the CQDs or graphene quantum dots presented in the literature show fluorescence emission strongly in the dispersed state or solution, but they emit weakly or display no emission in the solid state due to the ACQ effect, which limits their applications in the solid state.64,65 The PL emission spectrum of the NCQD powder indicates a strong yellow emission centered at 568 nm. We have calculated the CIE coordinates of the NCQD powder from the PL spectrum and found them to be (0.406, 0.475), further indicating that they emit yellow fluorescence (Figure 7c).
In addition, the emission spectra of the NCQD powder were recorded by exciting the light from 300 to 600 nm wavelength. As shown in Figure S6, the 568 nm emission intensity first increases gradually with increasing the excitation wavelength from 300 to 500 nm at 20 nm intervals. The intensity of red-shifted emission maxima decreases when excited from 520 to 600 nm. This reveals that the solid-state NCQDs have tunable emission properties similar to those observed when in water. Figure 7d displays the color of the NCQD powder captured under visible and UV 365 light. The orangish red color under visible light changes to bright yellow under UV light clearly capturing the red shift. There are abundant functional groups present on the surface of NCQDs preventing π–π interactions between multiple dots due to steric hindrance. Since there is no significant π–π stacking, the ACQ process is avoided, and the NCQDs emit in the solid state.42 Also, the yellow color emission in the solid state may be due to the energy transfer from higher-energy-emitting sites to yellow-emitting sites.
We have investigated the PL emission properties of NCQDs by incorporating them in a physically assembled triblock copolymer acrylic gel, where the interactions between NCQDs and the polymer blocks and the solvent dictate the photophysical behavior. This gel, also referred to as acrylic gel, in the pristine form is prepared by dissolving a 5% (v/v) (≈6.41% (w/w)) poly(methyl methacrylate)–poly(n-butyl acrylate)–poly(methyl methacrylate) (PMMA–PnBA–PMMA) triblock copolymer in 2-ethyl-1-hexanol (2EH) at 80 °C, followed by cooling the solution to room temperature (22 °C).66 The respective molecular weights of PMMA and PnBA in this polymer are 9000 and 53,000 g/mol with 12.7% (w/w) PMMA.67−69 At high temperatures, both PMMA and PnBA blocks are soluble in 2EH, resulting in a viscous polymer solution. With decreasing temperature, the solubility of PMMA becomes poor, leading to the collapse of PMMA blocks, and the PMMA blocks physically associate with forming aggregates. These aggregates act as cross-linking points.66 PnBA solubility in 2EH does not change significantly with temperature; therefore, they remain soluble in solvent and bridge PMMA aggregates. Consequently, a physically assembled three-dimensional polymer network is obtained.66,67,70,71
To incorporate NCQDs in the gels, we prepared 1% (w/w) NCQDs–polymer samples by first dispersing the NCQDs in 2EH at room temperature (22 °C) followed by dissolving the PMMA–PnBA–PMMA (5% (w/w)) copolymer by heating the solution to 80 °C. These gels are referred to as NCQDs-Gel hereon. In addition, samples containing NCQDs and PMMA or PnBA homopolymers were also prepared in the same manner. The concentrations (w/w) of PMMA and PnBA homopolymers in their respective solutions were the same as in the pristine gel, i.e., 0.81 and 5.60%, respectively. Further, in these samples, a polymer-to-NCQDs ratio of 1% (w/w) has been maintained, as in the NCQDs-Gel. These samples are referred to as NCQDs-PnBA and NCQDs-PMMA here.
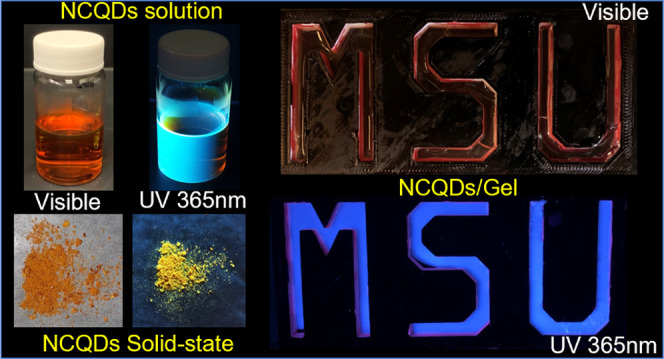
The NCQDs in 2EH exhibit blue color emission when excited with 365 nm, as shown in Figure 8a. The 5% (v/v) pristine acrylic gel does not display any fluorescence under UV 365 nm light (Figure 8b). Interestingly, NCQDs-Gel displays a bright blue color fluorescence (Figure 8c). Since NCQDs can interact with either or both block copolymer components, the NCQDs-PMMA and NCQDs-PnBA samples were also investigated. From Figure 8d,e, it can be inferred that the NCQDs-dispersed PMMA solution displays a higher fluorescence than that dispersed in the PnBA solution.
Figure 8.

Images of (a) NCQDs in 2-ethyl-1-hexanol, (b) pristine gel, (c) NCQDs-Gel, (d) NCQDs/PnBA, (e) NCQDs/PMMA, and (f, g) NCQDs-Gel in a three-dimensional (3D) printed mold under daylight and under 365 nm UV light.
The PL spectra of NCQDs in 2EH, NCQDs-Gel, NCQDs-PnBA, and NCQDs-PMMA were collected by varying the temperature. Figure 9a displays the PL spectra of NCQDs in the 2EH solution over a temperature range of 80–25 °C with a step of 5 °C. With decreasing temperature, no significant change in the luminescence intensity was observed. However, as displayed in Figure 9b, a significant increase in the intensity was observed for NGQDs-Gel with decreasing temperature. The change is significant at the higher temperature, but the intensity appears to remain unchanged as the temperature approaches room temperature. The PL intensity is approximately twice that observed in Figure 9a for the same NCQD concentration. The normalized PL intensity maximum as a function of temperature is shown in Figure S7 (calibration curve). The maximum intensity at 80 °C has been considered as a basis to normalize the intensity data. The PL intensity has been found to be increasing with decreasing temperature, and the slight curvature in the data, particularly at lower temperatures, likely captures the change in the sample because of gelation.
Figure 9.

Temperature-dependent PL spectra of (a) NCQDs in the 2-ethyl-1-hexanol solution, (b) NCQDs-Gel, (c) NCQDs-PnBA, and (d) NCQDs-PMMA.
Further comparisons were conducted by probing the photoluminescence of NCQDs-PnBA and NCQDs-PMMA solutions. As shown in Figure 9c, the PL intensity of the NCQDs-PnBA sample is weaker in comparison to the other samples, and the temperature-dependent change is not significant. In contrast, the NCQDs-PMMA sample (Figure 9d) displays a higher PL intensity, which increases with decreasing temperature. This suggests that PMMA facilitates the temperature-dependent photoluminescence intensity. Note that in comparison to NCQDs-Gel, the PL emission maxima are slightly shifted to the higher wavelength for NCQDs-PMMA.
The carboxyl, hydroxyl, and amino functional groups present on the NCQD surface can potentially interact with the oxygen group present in PMMA via hydrogen bonds, leading to enhanced luminescence.72,73 At lower temperatures, PMMA solubility in 2EH decreases, and NCQDs can act as nucleation sites for the collapsed PMMA chains. Because of enhanced interaction between NCQDs and PMMA, PL intensity increases. As shown in previous work, adding a few layers of graphene (FLG) sheets in acrylic gels can slightly alter their gelation and mechanical properties.66 Similar to the present case, FLG graphene sheets act as nucleation sites for the aggregation of PMMA.
We have investigated the effects of NCQDs on the gelation and rheological properties of acrylic gels. Figure S8 displays the result of amplitude sweep experiments performed at room temperature. Here, storage and loss moduli (G′ and G″) are plotted as a function of strain amplitude. Both gels display a similar response with similar G′ and G″ values and stiffening behavior at higher strain amplitudes. Figure S9 displays G′ and G″ as a function of temperature. Here, the gelation temperature (Tgel) is considered the crossover temperature of G′ and G″. For both gels, the gelation occurs at ≈33°C, and no significant change in Tgel with the addition of NCQDs was observed. We hypothesize that a small amount of NCQDs and their smaller sizes in comparison to FLGs have not caused any change in the gelation and rheological properties. However, such a small amount resulted in the temperature-dependent photoluminescence properties of these gels.
The self-assembled acrylic gels are widely studied as model gels for understanding the mechanisms like cavitation and stiffening in biopolymers. The addition of photoluminescence functionality enables these gels to be potentially utilized in diverse applications, including sensing, optical displays, drug release, and bioimaging.41,74−76 Here, the application of NCQDs-Gel as a fluorescent display has been investigated. The triblock copolymer (10% (v/v)) was dissolved in NCQD (0.1 mg/mL)-dispersed 2-ethyl-1-hexanol at 80 °C. This solution was poured into a 3D-printed mold of the MSU logo (Figure 8f). The solution formed a gel as the temperature was reduced to room temperature. The gel emitted bright blue fluorescence under the illumination of 365 nm light (Figure 8g). As the gel was cast from a viscous liquid state, any complex shape can be achieved using this method. Further, the same strategy can be used to incorporate various types of carbon/quantum nanodots; therefore, other colors can also be achieved.
Conclusion
In this article, we reported yellow solid-state emissive NCQDs with multicolor tunability in the solution. These are synthesized via a simple one-pot hydrothermal process using citric acid and m-phenylenediamine precursors. NCQDs exhibit excitation-dependent emission properties in the entire visible spectrum and the solvatochromism effect. The emission color and PLQY of NCQDs can be tuned by altering the excitation wavelength and the surrounding environment. The red-shifted emission has been observed when NCQDs interact with both polar aprotic and polar protic solvents. We studied solvent-dependent emission property changes using the Lippert–Mataga relationship. The results show that the emission maxima observed in different polar aprotic and polar protic solvents are approximately linear to the solvents’ dielectric constant and orientational polarity. In polar protic solvents, the NCQDs follow the regular trend in the emission shift depending on the specific hydrogen bonding between the surface functional groups present in the NCQDs with the solvents. The synthesized NCQDs emit blue color light in an aqueous solution and yellow color in the solid state or powder form. Most earlier reports on the CQDs or CDs suffer from the ACQ effect in the solid state or in aggregate, but our NCQDs overcome the ACQ effect and emit yellow light in the solid state. These could be employed to fabricate solid-state light-emitting devices. Moreover, for the first time, NCQDs have been incorporated into a physically assembled triblock copolymer gel. These gels display unique temperature-dependent optical PL properties. The multicolor emissive NCQDs investigated here have potential applications in lighting devices, sensing, and bioimaging.
Experimental Section
Materials
Citric acid, m-phenylenediamine (m-PD) with 99% purity, and 2-ethyl-1-hexanol (2EH) were used as received from Sigma-Aldrich. The following solvents were procured from Fisher Scientific Company: chloroform, dichloromethane, acetone, acetonitrile, dimethylformamide, dimethyl sulfoxide, ethanol, methanol, isopropanol, and octanol. All studies were conducted with deionized (DI) water from the Millipore Milli-Q purification system, which had a resistance of 18.2 M/cm–1.
Synthesis of NCQDs
Tunable and highly emissive NCQDs were synthesized by the hydrothermal reaction of citric acid and m-phenylenediamine. Citric acid (20 mg) and m-phenylenediamine (20 mg) were dissolved in 10 mL of deionized water under stirring. The mixture was transferred into a 50 mL Teflon-lined autoclave and then heated at 200 °C for 9 h (Figure 1). The reaction temperature was slowly cooled to room temperature and then the brown color suspension was centrifuged for 5 min at 4000 rpm to remove fully carbonized particles. The supernatant solution was filtered through a 0.2 μm pore-sized PTFE membrane filter. The filtrate solution was concentrated by a rotary evaporator and then dried under a freeze dryer to obtain orangish red-colored NCQDs.
Gel Preparation
The acrylic triblock copolymer poly(methyl methacrylate)–poly(n-butyl acrylate)–poly(methyl methacrylate) (PMMA–PnBA–PMMA) (kindly provided by Kuraray Co.) was used for the gel preparation in 2-ethyl-1-hexanol (2EH). Based on the manufacturer datasheet, the PMMA and PnBA blocks have molecular weights of 9000 and 53,000 g/mol, respectively.
For preparing the NCQD-PMMA and NCQD-PnBA solutions, respective homopolymers were purchased from Polymer Source Inc and were used as received. Based on the supplier datasheet, PMMA has an Mn of 7000 g/mol and an Mw of 58,400 g/mol with an S:H:I tacticity of 35:55:10. PnBA has an Mn of 61,000 g/mol and an Mw of 72,000 g/mol. Note that these polymers have molecular weights close to the blocks of the triblock copolymer. Considering the densities of the polymer (1.08 g/mL) and the solvent 2EH (0.83 g/mL), the weight fraction can be converted to the volume fraction.
The pristine gel with 5% (v/v) was prepared by dissolving the desired amount of the polymer in 2EH and heated up to 80°C in a convective oven.66,70,71 After 5 h, a clear solution was obtained, which turned into a soft gel upon cooling to room temperature. To prepare the NCQDs-Gel, using a polymer as a basis, 1% (w/w) NCQDs were first dispersed into 2EH using ultrasonication for 1800 s and then kept in an oven at 80 °C overnight to dissolve. This was referred to as an NCQDs-2EH solution. Once a clear solution was obtained, the desired amount of the polymer was added to obtain 5% (v/v) NCQDs-Gel using the above procedure.
NCQDs-PMMA and NCQDs-PnBA solutions were prepared by adding PMMA and PnBA homopolymers in the NCQDs-2EH solution, respectively. Here, 1% (w/w) NCQD concentration was maintained using the homopolymer weights as a basis. The weight fraction of respective homopolymers was maintained as in the pristine gel. Both mixtures were heated for 5 h in a convective oven to obtain transparent solutions. Pristine homopolymer solutions (without NCQDs) were also prepared for reference.
Characterization
TEM images were obtained with a JEOL 2100, operating at 200 kV. Few drops of a dilute NCQD solution in ethanol were drop-casted on a copper grid for imaging. Fourier transform infrared spectroscopy (FTIR) technique (ATR mode) was used to characterize the functional groups in the NCQDs and the FTIR spectrum of the NCQD powder sample was obtained by a Nicolet 6700 FTIR spectrometer (Thermo Scientific).
A Thermo Scientific K-α XPS system with a monochromatic X-ray source at 1486.6 eV, corresponding to the Al K line, was used for the XPS study. A 400 m2 spot size was chosen. The Constant Analyzer Energy mode was used for the measurements. The survey spectra were taken over a range of 0–1300 eV at a pass energy of 200 eV. The high-resolution (HR) core-level spectra were acquired using an average of 20 scans at a pass energy of 40 eV and an energy step size of 0.1 eV. HR scans of C 1s, O 1s, and N 1s have also been performed. “CasaXPS” was used to process the XPS data.
A Dimension Icon AFM with ScanAsyst in the contact mode was used to analyze the morphology of NCQDs on a silicon wafer. Scanning was carried out at a rate of 1 Hz with a scan size of 50 μm. The AFM images were processed using Gwyddion 2.38 SPM data visualization software. Photoluminescence spectra were collected in a Horiba Jobin Yvon Spectrofluorometer (FluoroMax-4). The solid-state fluorescence spectra were recorded using an FS5 Edinburgh spectrofluorometer. The fluorescence lifetime experiment was carried out in different solvent polarities at 8 mM concentration by collecting the time-resolved fluorescence using the time-correlated single-photon counting (TCSPC) technique. A picosecond laser diode (LDH-P-C-405B; LDH series; PicoQuant) emitting photons of 405 nm was used to excite the NCQDs. The emitted photons were counted by a single-photon avalanche photodiode (SPAD), and the time-resolved data were collected using a TimeHarp 260 PICO interface with a resolution of 25 ps. Ultraviolet–visible absorption spectra of NCQDs were recorded with a UV-2450 spectrophotometer. The absolute PLQY was calculated using a 450 W xenon arc lamp (LH-450, M/s SLM Instruments), a monochromator (Model no 77200, M/s ORIEL Instruments) to choose the excitation wavelength, an integrating sphere (Model IS200-4, M/s Thorlabs), and a UV–vis–NIR spectrometer (Flame 350–1000nm, M/s Ocean Optics) to record the scattered light/incident light and the fluorescence emission.
Acknowledgments
The authors acknowledge the help of Dr. Felio Perez at the University of Memphis for XPS characterization. The authors would like to thank Dr. Rooban Venkatesh K G Thirumalai and Dr. Iwei from the Institute for Imaging & Analytical Technologies at Mississippi State University for TEM and AFM characterization. The authors also acknowledge the Department of Chemistry, Mississippi State University, for the PL instrument support. This material is based upon work supported by the National Science Foundation under Grant No. 1757220 (OIA 1757220).
Supporting Information Available
The Supporting Information is available free of charge at https://pubs.acs.org/doi/10.1021/acsomega.2c03912.
Detailed experimental procedure for absolute quantum yield measurements; orientation polarization; solvent polarity parameters and steady-state PL data; Kamlet–Taft parameters of different solvents; absolute quantum yield data; fluorescence lifetime data; absorption spectra of NCQDs in polar aprotic solvents; PL spectra of NCQDs in polar protic and aprotic solvents with different excitation wavelengths; PL spectra of NCQDs in different solvents without normalization excited at 360 nm; Lippert–Mataga plot of NCQDs in protic and aprotic solvents; PL spectra of the NCQD powder; PL intensity as a function of temperature for NCQDs-Gel; amplitude sweep and temperature sweep of pristine gel and NCQDs-containing gels; and temperature sweep of pristine gel and NCQDs-containing gels (PDF)
Author Present Address
§ Center for Graphene Research and Innovation, C06 Jackson Avenue Center, University of Mississippi, Oxford, Mississippi 38677, United States
The authors declare no competing financial interest.
Supplementary Material
References
- Martynenko I. V.; Litvin A. P.; Purcell-Milton F.; Baranov Av.; Fedorov Av.; Gun’Ko Y. K. Application of Semiconductor Quantum Dots in Bioimaging and Biosensing. J. Mater. Chem. B 2017, 5, 6701–6727. 10.1039/c7tb01425b. [DOI] [PubMed] [Google Scholar]
- Coe S.; Woo W.-K.; Bawendi M.; Bulović V. Electroluminescence from Single Monolayers of Nanocrystals in Molecular Organic Devices. Nature 2002, 420, 800–803. 10.1038/nature01217. [DOI] [PubMed] [Google Scholar]
- Murray C. B.; Norris D. J.; Bawendi M. G. Synthesis and Characterization of Nearly Monodisperse CdE (E = Sulfur, Selenium, Tellurium) Semiconductor Nanocrystallites. J. Am. Chem. Soc. 1993, 115, 8706–8715. 10.1021/ja00072a025. [DOI] [Google Scholar]
- Colvin V. L.; Schlamp M. C.; Alivisatos A. P. Light-Emitting Diodes Made from Cadmium Selenide Nanocrystals and a Semiconducting Polymer. Nature 1994, 370, 354–357. 10.1038/370354a0. [DOI] [Google Scholar]
- Zhu S.; Song Y.; Zhao X.; Shao J.; Zhang J.; Yang B. The Photoluminescence Mechanism in Carbon Dots (Graphene Quantum Dots, Carbon Nanodots, and Polymer Dots): Current State and Future Perspective. Nano Res. 2015, 8, 355–381. 10.1007/s12274-014-0644-3. [DOI] [Google Scholar]
- Ding C.; Zhu A.; Tian Y. Functional Surface Engineering of C-Dots for Fluorescent Biosensing and in Vivo Bioimaging. Acc. Chem. Res. 2014, 47, 20–30. 10.1021/ar400023s. [DOI] [PubMed] [Google Scholar]
- Hola K.; Zhang Y.; Wang Y.; Giannelis E. P.; Zboril R.; Rogach A. L. Carbon Dots—Emerging Light Emitters for Bioimaging, Cancer Therapy and Optoelectronics. Nano Today 2014, 9, 590–603. 10.1016/j.nantod.2014.09.004. [DOI] [Google Scholar]
- Wang R.; Lu K.-Q.; Tang Z.-R.; Xu Y.-J. Recent Progress in Carbon Quantum Dots: Synthesis, Properties and Applications in Photocatalysis. J. Mater. Chem. A 2017, 5, 3717–3734. 10.1039/C6TA08660H. [DOI] [Google Scholar]
- Kwon W.; Do S.; Lee J.; Hwang S.; Kim J. K.; Rhee S. W. Freestanding Luminescent Films of Nitrogen-Rich Carbon Nanodots toward Large-Scale Phosphor-Based White-Light-Emitting Devices. Chem. Mater. 2013, 25, 1893–1899. 10.1021/cm400517g. [DOI] [Google Scholar]
- Shi W.; Li X.; Ma H. A Tunable Ratiometric PH Sensor Based on Carbon Nanodots for the Quantitative Measurement of the Intracellular PH of Whole Cells. Angew. Chem., Int. Ed. 2012, 51, 6432–6435. 10.1002/anie.201202533. [DOI] [PubMed] [Google Scholar]
- Wang J.; Peng F.; Lu Y.; Zhong Y.; Wang S.; Xu M.; Ji X.; Su Y.; Liao L.; He Y. Large-Scale Green Synthesis of Fluorescent Carbon Nanodots and Their Use in Optics Applications. Adv. Opt. Mater. 2015, 3, 103–111. 10.1002/adom.201400307. [DOI] [Google Scholar]
- Tang J.; Kong B.; Wu H.; Xu M.; Wang Y.; Wang Y.; Zhao D.; Zheng G. Carbon Nanodots Featuring Efficient FRET for Real-Time Monitoring of Drug Delivery and Two-Photon Imaging. Adv. Mater. 2013, 25, 6569–6574. 10.1002/adma.201303124. [DOI] [PubMed] [Google Scholar]
- Zhu S.; Meng Q.; Wang L.; Zhang J.; Song Y.; Jin H.; Zhang K.; Sun H.; Wang H.; Yang B. Highly Photoluminescent Carbon Dots for Multicolor Patterning, Sensors, and Bioimaging. Angew. Chem., Int. Ed. 2013, 52, 3953–3957. 10.1002/anie.201300519. [DOI] [PubMed] [Google Scholar]
- Zhang X.; Zhang Y.; Wang Y.; Kalytchuk S.; Kershaw Sv.; Wang Y.; Wang P.; Zhang T.; Zhao Y.; Zhang H.; Cui T.; Wang Y.; Zhao J.; Yu W. W.; Rogach A. L. Color-Switchable Electroluminescence of Carbon Dot Light-Emitting Diodes. ACS Nano 2013, 7, 11234–11241. 10.1021/nn405017q. [DOI] [PubMed] [Google Scholar]
- Strauss V.; Margraf J. T.; Dolle C.; Butz B.; Nacken T. J.; Walter J.; Bauer W.; Peukert W.; Spiecker E.; Clark T.; Guldi D. M. Carbon Nanodots: Toward a Comprehensive Understanding of Their Photoluminescence. J. Am. Chem. Soc. 2014, 136, 17308–17316. 10.1021/ja510183c. [DOI] [PubMed] [Google Scholar]
- Ding H.; Yu S.-B.; Wei J.-S.; Xiong H.-M. Full-Color Light-Emitting Carbon Dots with a Surface-State-Controlled Luminescence Mechanism. ACS Nano 2016, 10, 484–491. 10.1021/acsnano.5b05406. [DOI] [PubMed] [Google Scholar]
- Jiang K.; Sun S.; Zhang L.; Lu Y.; Wu A.; Cai C.; Lin H. Red, Green, and Blue Luminescence by Carbon Dots: Full-Color Emission Tuning and Multicolor Cellular Imaging. Angew. Chem., Int. Ed. 2015, 54, 5360–5363. 10.1002/anie.201501193. [DOI] [PubMed] [Google Scholar]
- Yuan F.; Wang Z.; Li X.; Li Y.; Tan Z.; Fan L.; Yang S. Bright Multicolor Bandgap Fluorescent Carbon Quantum Dots for Electroluminescent Light-Emitting Diodes. Adv. Mater. 2017, 29, 1604436 10.1002/adma.201604436. [DOI] [PubMed] [Google Scholar]
- Wang H. J.; Yu T. T.; Chen H. L.; Nan W.; bin Xie L. Q.; Zhang Q. Q. A Self-Quenching-Resistant Carbon Dots Powder with Tunable Solid-State Fluorescence and Their Applications in Light-Emitting Diodes and Fingerprints Detection. Dyes Pigm. 2018, 159, 245–251. 10.1016/j.dyepig.2018.06.039. [DOI] [Google Scholar]
- de Medeiros T. V.; Manioudakis J.; Noun F.; Macairan J. R.; Victoria F.; Naccache R. Microwave-Assisted Synthesis of Carbon Dots and Their Applications. J. Mater. Chem. C 2019, 7, 7175–7195. 10.1039/c9tc01640f. [DOI] [Google Scholar]
- Chahal S.; Yousefi N.; Tufenkji N. Green Synthesis of High Quantum Yield Carbon Dots from Phenylalanine and Citric Acid: Role of Stoichiometry and Nitrogen Doping. ACS Sustainable Chem. Eng. 2020, 8, 5566–5575. 10.1021/acssuschemeng.9b07463. [DOI] [Google Scholar]
- Meierhofer F.; Dissinger F.; Weigert F.; Jungclaus J.; Müller-Caspary K.; Waldvogel S. R.; Resch-Genger U.; Voss T. Citric Acid Based Carbon Dots with Amine Type Stabilizers: PH-Specific Luminescence and Quantum Yield Characteristics. J. Phys. Chem. C 2020, 124, 8894–8904. 10.1021/acs.jpcc.9b11732. [DOI] [Google Scholar]
- Li N.; Gu Y.; Gao M.; Wang Z.; Xiao D.; Li Y.; Lin R.; He H. Colorimetric Determination of O-Phenylenediamine in Water Samples Based on the Formation of Silver Nanoparticles as a Colorimetric Probe. Spectrochim. Acta, Part A 2015, 140, 328–333. 10.1016/j.saa.2014.12.053. [DOI] [PubMed] [Google Scholar]
- Ngamdee K.; Martwiset S.; Tuntulani T.; Ngeontae W. Selective Fluorescence Sensors for P-Phenylenediamine Using Formyl Boronate Ester with an Assistance of Micelles. Sens. Actuators, B 2012, 173, 682–691. 10.1016/j.snb.2012.07.077. [DOI] [Google Scholar]
- Shi B.; Su Y.; Zhang L.; Huang M.; Li X.; Zhao S. Facilely Prepared Fe3O4/Nitrogen-Doped Graphene Quantum Dot Hybrids as a Robust Nonenzymatic Catalyst for Visual Discrimination of Phenylenediamine Isomers. Nanoscale 2016, 8, 10814–10822. 10.1039/C6NR02725C. [DOI] [PubMed] [Google Scholar]
- Wijayapala R.; Hashemnejad S. M.; Kundu S. Carbon Nanodots Crosslinked Photoluminescent Alginate Hydrogels. RSC Adv. 2017, 7, 50389–50395. 10.1039/C7RA09805G. [DOI] [Google Scholar]
- Wang H.; Sun C.; Chen X.; Zhang Y.; Colvin V. L.; Rice Q.; Seo J.; Feng S.; Wang S.; Yu W. W. Excitation Wavelength Independent Visible Color Emission of Carbon Dots. Nanoscale 2017, 9, 1909–1915. 10.1039/c6nr09200d. [DOI] [PMC free article] [PubMed] [Google Scholar]
- Kundu A.; Park B.; Oh J.; Sankar K. V.; Ray C.; Kim W. S.; Chan Jun S. Multicolor Emissive Carbon Dot with Solvatochromic Behavior across the Entire Visible Spectrum. Carbon 2020, 156, 110–118. 10.1016/j.carbon.2019.08.037. [DOI] [Google Scholar]
- Gupta V.; Chaudhary N.; Srivastava R.; Sharma G. D.; Bhardwaj R.; Chand S. Luminscent Graphene Quantum Dots for Organic Photovoltaic Devices. J. Am. Chem. Soc. 2011, 133, 9960–9963. 10.1021/ja2036749. [DOI] [PubMed] [Google Scholar]
- Xue G.; Yu S.; Qiang Z.; Xiuying L.; Tang lijun.; Jiangrong L. Application of Maleimide Modified Graphene Quantum Dots and Porphyrin Fluorescence Resonance Energy Transfer in the Design of “Turn-on” Fluorescence Sensors for Biothiols. Anal. Chim. Acta 2020, 1108, 46–53. 10.1016/j.aca.2020.01.062. [DOI] [PubMed] [Google Scholar]
- Paulo S.; Stoica G.; Cambarau W.; Martinez-Ferrero E.; Palomares E. Carbon Quantum Dots as New Hole Transport Material for Perovskite Solar Cells. Synth. Met. 2016, 222, 17–22. 10.1016/j.synthmet.2016.04.025. [DOI] [Google Scholar]
- Lu D.; Tang Y.; Gao J.; Chen Y.; Wang Q. Green Anhydrous Assembly of Carbon Dots via Solar Light Irradiation and Its Multi-Modal Sensing Performance. Dyes Pigm. 2019, 165, 287–293. 10.1016/j.dyepig.2019.02.037. [DOI] [Google Scholar]
- Wang B.; Wang S.; Wang Y.; Lv Y.; Wu H.; Ma X.; Tan M. Highly Fluorescent Carbon Dots for Visible Sensing of Doxorubicin Release Based on Efficient Nanosurface Energy Transfer. Biotechnol. Lett. 2016, 38, 191–201. 10.1007/s10529-015-1965-3. [DOI] [PubMed] [Google Scholar]
- Han S.; Chen X.; Hu Y.; Han L. Solid-State N,P-Doped Carbon Dots Conquer Aggregation-Caused Fluorescence Quenching and Couple with Europium Metal-Organic Frameworks toward White Light-Emitting Diodes. Dyes Pigm. 2021, 187, 109090 10.1016/j.dyepig.2020.109090. [DOI] [Google Scholar]
- De B.; Karak N. A Green and Facile Approach for the Synthesis of Water Soluble Fluorescent Carbon Dots from Banana Juice. RSC Adv. 2013, 3, 8286–8290. 10.1039/c3ra00088e. [DOI] [Google Scholar]
- Yeh T.-F.; Teng C.-Y.; Chen S.-J.; Teng H. Nitrogen-Doped Graphene Oxide Quantum Dots as Photocatalysts for Overall Water-Splitting under Visible Light Illumination. Adv. Mater. 2014, 26, 3297–3303. 10.1002/adma.201305299. [DOI] [PubMed] [Google Scholar]
- Semeniuk M.; Yi Z.; Poursorkhabi V.; Tjong J.; Jaffer S.; Lu Z. H.; Sain M. Future Perspectives and Review on Organic Carbon Dots in Electronic Applications. ACS Nano 2019, 13, 6224–6255. 10.1021/acsnano.9b00688. [DOI] [PubMed] [Google Scholar]
- Mintz K. J.; Bartoli M.; Rovere M.; Zhou Y.; Hettiarachchi S. D.; Paudyal S.; Chen J.; Domena J. B.; Liyanage P. Y.; Sampson R.; Khadka D.; Pandey R. R.; Huang S.; Chusuei C. C.; Tagliaferro A.; Leblanc R. M. A Deep Investigation into the Structure of Carbon Dots. Carbon 2021, 173, 433–447. 10.1016/j.carbon.2020.11.017. [DOI] [Google Scholar]
- Gharat P. M.; Chethodil J. M.; Srivastava A. P.; Praseetha P. K.; Pal H.; Dutta Choudhury S. An Insight into the Molecular and Surface State Photoluminescence of Carbon Dots Revealed through Solvent-Induced Modulations in Their Excitation Wavelength Dependent Emission Properties. Photochem. Photobiol. Sci. 2019, 18, 110–119. 10.1039/C8PP00373D. [DOI] [PubMed] [Google Scholar]
- Jin S. H.; Kim D. H.; Jun G. H.; Hong S. H.; Jeon S. Tuning the Photoluminescence of Graphene Quantum Dots through the Charge Transfer Effect of Functional Groups. ACS Nano 2013, 7, 1239–1245. 10.1021/nn304675g. [DOI] [PubMed] [Google Scholar]
- Bhattacharya S.; Phatake R. S.; Nabha Barnea S.; Zerby N.; Zhu J. J.; Shikler R.; Lemcoff N. G.; Jelinek R. Fluorescent Self-Healing Carbon Dot/Polymer Gels. ACS Nano 2019, 13, 1433–1442. 10.1021/acsnano.8b07087. [DOI] [PubMed] [Google Scholar]
- Wang H. J.; Hou W. Y.; Hao Y. W.; Jiang W. S.; Chen H. L.; Zhang Q. Q. Novel Yellow Solid-State Fluorescent-Emitting Carbon Dots with High Quantum Yield for White Light-Emitting Diodes. Spectrochim. Acta, Part A 2021, 250, 119340 10.1016/j.saa.2020.119340. [DOI] [PubMed] [Google Scholar]
- Li L.; Dong T. Photoluminescence Tuning in Carbon Dots: Surface Passivation or/and Functionalization, Heteroatom Doping. J. Mater. Chem. C 2018, 6, 7944–7970. 10.1039/c7tc05878k. [DOI] [Google Scholar]
- Miao X.; Qu D.; Yang D.; Nie B.; Zhao Y.; Fan H.; Sun Z. Synthesis of Carbon Dots with Multiple Color Emission by Controlled Graphitization and Surface Functionalization. Adv. Mater. 2018, 30, 1704740 10.1002/adma.201704740. [DOI] [PubMed] [Google Scholar]
- Ghosh S.; Ghosh A.; Ghosh G.; Marjit K.; Patra A. Deciphering the Relaxation Mechanism of Red-Emitting Carbon Dots Using Ultrafast Spectroscopy and Global Target Analysis. J. Phys. Chem. Lett. 2021, 12, 8080–8087. 10.1021/acs.jpclett.1c02116. [DOI] [PubMed] [Google Scholar]
- Chen D.; Wu W.; Yuan Y.; Zhou Y.; Wan Z.; Huang P. Intense Multi-State Visible Absorption and Full-Color Luminescence of Nitrogen-Doped Carbon Quantum Dots for Blue-Light-Excitable Solid-State-Lighting. J. Mater. Chem. C 2016, 4, 9027–9035. 10.1039/C6TC02853E. [DOI] [Google Scholar]
- Chen L.-C.; Teng C.-Y.; Lin C.-Y.; Chang H.-Y.; Chen S.-J.; Teng H. Architecting Nitrogen Functionalities on Graphene Oxide Photocatalysts for Boosting Hydrogen Production in Water Decomposition Process. Adv. Energy Mater. 2016, 6, 1600719 10.1002/aenm.201600719. [DOI] [Google Scholar]
- Yan Y.; Chen J.; Li N.; Tian J.; Li K.; Jiang J.; Liu J.; Tian Q.; Chen P. Systematic Bandgap Engineering of Graphene Quantum Dots and Applications for Photocatalytic Water Splitting and CO2 Reduction. ACS Nano 2018, 12, 3523–3532. 10.1021/acsnano.8b00498. [DOI] [PubMed] [Google Scholar]
- Wang W.; Xu S.; Li N.; Huang Z.; Su B.; Chen X. Sulfur and Phosphorus Co-Doped Graphene Quantum Dots for Fluorescent Monitoring of Nitrite in Pickles. Spectrochim. Acta, Part A 2019, 221, 117211 10.1016/j.saa.2019.117211. [DOI] [PubMed] [Google Scholar]
- Tang L.; Ji R.; Cao X.; Lin J.; Jiang H.; Li X.; Teng K. S.; Luk C. M.; Zeng S.; Hao J.; Lau S. P. Deep Ultraviolet Photoluminescence of Water-Soluble Self-Passivated Graphene Quantum Dots. ACS Nano 2012, 6, 5102–5110. 10.1021/nn300760g. [DOI] [PubMed] [Google Scholar]
- Wang B.; Yu J.; Sui L.; Zhu S.; Tang Z.; Yang B.; Lu S. Rational Design of Multi-Color-Emissive Carbon Dots in a Single Reaction System by Hydrothermal. Adv. Sci. 2021, 8, 2001453 10.1002/advs.202001453. [DOI] [PMC free article] [PubMed] [Google Scholar]
- Nie H.; Li M.; Li Q.; Liang S.; Tan Y.; Sheng L.; Shi W.; Zhang S. X.-A. Carbon Dots with Continuously Tunable Full-Color Emission and Their Application in Ratiometric PH Sensing. Chem. Mater. 2014, 26, 3104–3112. 10.1021/cm5003669. [DOI] [Google Scholar]
- Guo L.; Ge J.; Liu W.; Niu G.; Jia Q.; Wang H.; Wang P. Tunable Multicolor Carbon Dots Prepared from Well-Defined Polythiophene Derivatives and Their Emission Mechanism. Nanoscale 2016, 8, 729–734. 10.1039/C5NR07153D. [DOI] [PubMed] [Google Scholar]
- Li L.; Wu G.; Yang G.; Peng J.; Zhao J.; Zhu J.-J. Focusing on Luminescent Graphene Quantum Dots: Current Status and Future Perspectives. Nanoscale 2013, 5, 4015–4039. 10.1039/C3NR33849E. [DOI] [PubMed] [Google Scholar]
- Park Y. il.; Kuo C.-Y.; Martinez J. S.; Park Y.-S.; Postupna O.; Zhugayevych A.; Kim S.; Park J.; Tretiak S.; Wang H.-L. Tailored Electronic Structure and Optical Properties of Conjugated Systems through Aggregates and Dipole–Dipole Interactions. ACS Appl. Mater. Interfaces 2013, 5, 4685–4695. 10.1021/am400766w. [DOI] [PubMed] [Google Scholar]
- Kucherak O. A.; Richert L.; Mély Y.; Klymchenko A. S. Dipolar 3-Methoxychromones as Bright and Highly Solvatochromic Fluorescent Dyes. Phys. Chem. Chem. Phys. 2012, 14, 2292–2300. 10.1039/C2CP23037B. [DOI] [PubMed] [Google Scholar]
- Dineshkumar S.; Laskar I. R. Study of the Mechanoluminescence and “aggregation-Induced Emission Enhancement” Properties of a New Conjugated Oligomer Containing Tetraphenylethylene in the Backbone: Application in the Selective and Sensitive Detection of Explosive. Polym. Chem. 2018, 9, 5123–5132. 10.1039/c8py01153b. [DOI] [Google Scholar]
- Kachwal V.; Sharma P. K.; Sarmah A.; Chowdhury S.; Laskar I. R. A Multistimuli Responsive Heteroleptic Iridium(Iii) Complex: Role of Hydrogen Bonding in Probing Solvent, PH and Bovine Serum Albumin (BSA). J. Mater. Chem. C 2020, 8, 6605–6614. 10.1039/c9tc07050h. [DOI] [Google Scholar]
- Kundu A.; Layek R. K.; Nandi A. K. Enhanced Fluorescent Intensity of Graphene Oxide–Methyl Cellulose Hybrid in Acidic Medium: Sensing of Nitro-Aromatics. J. Mater. Chem. 2012, 22, 8139–8144. 10.1039/C2JM30402C. [DOI] [Google Scholar]
- Kundu A.; Layek R. K.; Kuila A.; Nandi A. K. Highly Fluorescent Graphene Oxide-Poly(Vinyl Alcohol) Hybrid: An Effective Material for Specific Au3+ Ion Sensors. ACS Appl. Mater. Interfaces 2012, 4, 5576–5582. 10.1021/am301467z. [DOI] [PubMed] [Google Scholar]
- Kozák O.; Datta K. K. R.; Greplová M.; Ranc V.; Kašlík J.; Zbořil R. Surfactant-Derived Amphiphilic Carbon Dots with Tunable Photoluminescence. J. Phys. Chem. C 2013, 117, 24991–24996. 10.1021/jp4040166. [DOI] [Google Scholar]
- Gupta A.; Nandi C. K. PC12 Live Cell Ultrasensitive Neurotransmitter Signaling Using High Quantum Yield Sulphur Doped Carbon Dots and Its Extracellular Ca2+ Ion Dependence. Sens. Actuators, B 2017, 245, 137–145. 10.1016/j.snb.2017.01.145. [DOI] [Google Scholar]
- Yang X.; Xu X.; Zhou G. Recent Advances of the Emitters for High Performance Deep-Blue Organic Light-Emitting Diodes. J. Mater. Chem. C 2015, 3, 913–944. 10.1039/C4TC02474E. [DOI] [Google Scholar]
- Dineshkumar S.; Raj A.; Srivastava A.; Mukherjee S.; Pasha S. S.; Kachwal V.; Fageria L.; Chowdhury R.; Laskar I. R. Facile Incorporation of “Aggregation-Induced Emission”-Active Conjugated Polymer into Mesoporous Silica Hollow Nanospheres: Synthesis, Characterization, Photophysical Studies, and Application in Bioimaging. ACS Appl. Mater. Interfaces 2019, 11, 31270–31282. 10.1021/acsami.9b07664. [DOI] [PubMed] [Google Scholar]
- Zhang K.; Liu J.; Zhang Y.; Fan J.; Wang C.-K.; Lin L. Theoretical Study of the Mechanism of Aggregation-Caused Quenching in Near-Infrared Thermally Activated Delayed Fluorescence Molecules: Hydrogen-Bond Effect. J. Phys. Chem. C 2019, 123, 24705–24713. 10.1021/acs.jpcc.9b06388. [DOI] [Google Scholar]
- Zabet M.; Mishra S.; Kundu S. Effect of Graphene on the Self-Assembly and Rheological Behavior of a Triblock Copolymer Gel. RSC Adv. 2015, 5, 83936–83944. 10.1039/c5ra13672e. [DOI] [Google Scholar]
- Hashemnejad S. M.; Kundu S. Nonlinear Elasticity and Cavitation of a Triblock Copolymer Gel. Soft Matter 2015, 11, 4315–4325. 10.1039/C5SM00330J. [DOI] [PubMed] [Google Scholar]
- Mishra S.; Badani Prado R. M.; Kundu S. Concentration-Dependent Mechanical Behavior of Physically Assembled Triblock Copolymer Gels. ACS Appl. Polym. Mater. 2020, 2, 5388–5397. 10.1021/acsapm.0c00583. [DOI] [Google Scholar]
- De A.; Sen P.; Poddar A.; Das A. Synthesis, Characterization, Electrical Transport and Magnetic Properties of PEDOT-DBSA-Fe3O4 Conducting Nanocomposite. Synth. Met. 2009, 159, 1002–1007. 10.1016/j.synthmet.2008.12.030. [DOI] [Google Scholar]
- Zabet M.; Mishra S.; Boy R.; Walters K. B.; Naskar A. K.; Kundu S. Temperature-Dependent Self-Assembly and Rheological Behavior of a Thermoreversible Pmma–PnBA–PMMA Triblock Copolymer Gel. J. Polym. Sci., Part B: Polym. Phys. 2017, 55, 11 10.1002/polb.24336. [DOI] [Google Scholar]
- Seitz M. E.; Burghardt W. R.; Faber K. T.; Shull K. R. Self-Assembly and Stress Relaxation in Acrylic Triblock Copolymer Gels. Macromolecules 2007, 40, 1218–1226. 10.1021/ma061993+. [DOI] [Google Scholar]
- Kuo S.-W.; Tsai H.-T. Complementary Multiple Hydrogen-Bonding Interactions Increase the Glass Transition Temperatures to PMMA Copolymer Mixtures. Macromolecules 2009, 42, 4701–4711. 10.1021/ma900640a. [DOI] [Google Scholar]
- Chen J.; Li J.; Xu L.; Hong W.; Yang Y.; Chen X. The Glass-Transition Temperature of Supported PMMA Thin Films with Hydrogen Bond/Plasmonic Interface. Polymers 2019, 11, 601 10.3390/polym11040601. [DOI] [PMC free article] [PubMed] [Google Scholar]
- Bhattacharya S.; Nandi S.; Jelinek R. Carbon-Dot–Hydrogel for Enzyme-Mediated Bacterial Detection. RSC Adv. 2017, 7, 588–594. 10.1039/C6RA25148J. [DOI] [Google Scholar]
- Zhou Y.; Mintz K. J.; Oztan C. Y.; Hettiarachchi S. D.; Peng Z.; Seven E. S.; Liyanage P. Y.; de La Torre S.; Celik E.; Leblanc R. M. Embedding Carbon Dots in Superabsorbent Polymers for Additive Manufacturing. Polymers 2018, 10, 921 10.3390/polym10080921. [DOI] [PMC free article] [PubMed] [Google Scholar]
- Li Y.; Young D. J.; Loh X. J. Fluorescent Gels: A Review of Synthesis, Properties, Applications and Challenges. Mater. Chem. Front. 2019, 3, 1489–1502. 10.1039/C9QM00127A. [DOI] [Google Scholar]
Associated Data
This section collects any data citations, data availability statements, or supplementary materials included in this article.