Abstract
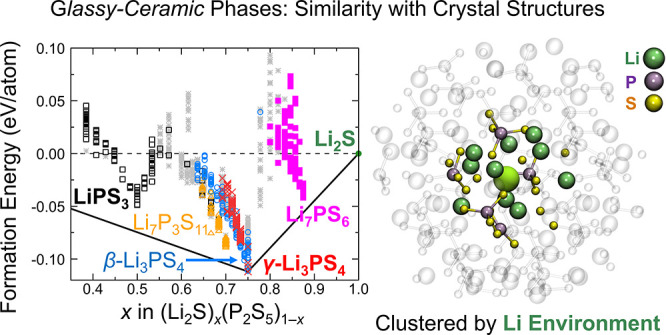
Lithium thiophosphates (LPSs) with the composition (Li2S)x(P2S5)1–x are among the most promising prospective electrolyte materials for solid-state batteries (SSBs), owing to their superionic conductivity at room temperature (>10–3 S cm–1), soft mechanical properties, and low grain boundary resistance. Several glass–ceramic (gc) LPSs with different compositions and good Li conductivity have been previously reported, but the relationship among composition, atomic structure, stability, and Li conductivity remains unclear due to the challenges in characterizing noncrystalline phases in experiments or simulations. Here, we mapped the LPS phase diagram by combining first-principles and artificial intelligence (AI) methods, integrating density functional theory, artificial neural network potentials, genetic-algorithm sampling, and ab initio molecular dynamics simulations. By means of an unsupervised structure-similarity analysis, the glassy/ceramic phases were correlated with the local structural motifs in the known LPS crystal structures, showing that the energetically most favorable Li environment varies with the composition. Based on the discovered trends in the LPS phase diagram, we propose a candidate solid-state electrolyte composition, (Li2S)x(P2S5)1–x (x ∼ 0.725), that exhibits high ionic conductivity (>10–2 S cm–1) in our simulations, thereby demonstrating a general design strategy for amorphous or glassy/ceramic solid electrolytes with enhanced conductivity and stability.
Introduction
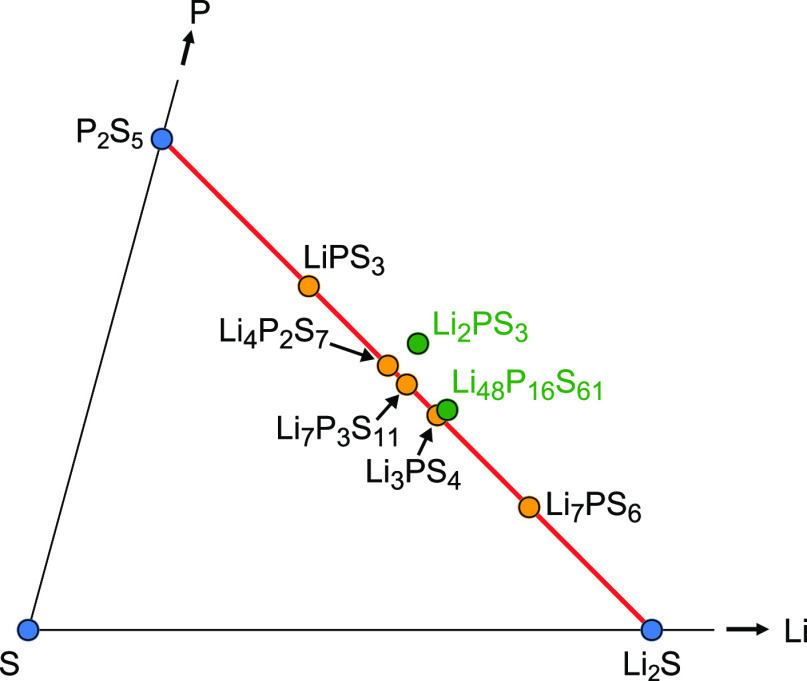
Solid-state batteries (SSBs) are a prospective alternative to conventional Li-ion batteries (LIBs), in which the flammable liquid electrolytes are replaced with safer solid Li-ion conductors. Additionally, SSBs can potentially enable the use of Li metal anodes and thus significantly higher energy densities.1−3 Different classes of materials have been investigated as solid electrolytes (SEs), including oxides, polymers, phosphates, and thiophosphates.4−7 Among all the prospective SE materials, lithium thiophosphates (LPSs) with the composition (Li2S)x(P2S5)1–x are among the most promising, owing to their superionic conductivity at room temperature (>10–3 S cm–1), soft mechanical properties, and low grain boundary resistance.8,9 The implementation of LPS glasses as SEs was first reported in 1980,10 where it was discovered that the substitution of O with S in phosphates significantly increased the ionic conductivity. In 2006, Mizuno and co-workers observed that the conductivity of LPS materials can be further promoted by partial crystallization of the Li2S–P2S5 glasses.11,12 By now, a number of different glass–ceramic (gc) LPS compositions have been synthesized and characterized, including LiPS3 ((Li2S)0.5(P2S5)0.5),13 Li2PS3 ((Li2S)0.667(P2S5)0.333),14−16 Li7P3S11 ((Li2S)0.7(P2S5)0.3),11,12,17−25 Li3PS4 ((Li2S)0.75(P2S5)0.25),24,26−34 and Li7PS6 ((Li2S)0.875(P2S5)0.125),35 all of which lie on or near the P2S5–Li2S composition line in the Li–P–S phase diagram (Figure 1).
Figure 1.
Excerpt from the ternary Li–P–S phase diagram showing reported LPS compositions on and near the Li2S–P2S5 composition line. The materials falling on the right of the red line are sulfur-deficient compositions (green circles).
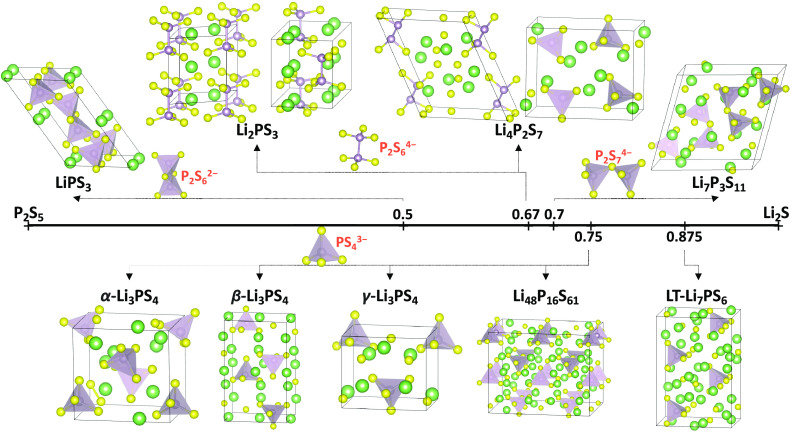
LPS compositions crystallize in several different crystal structures (Figure 2) that have been extensively characterized with experimental techniques, such as X-ray powder diffraction (XRD) and nuclear magnetic resonance (NMR)12,13,15,16,24,35−37 spectroscopy as well as with computational methods.38−41 Nevertheless, glass–ceramic (gc) LPS-based SEs exhibit both crystalline and noncrystalline phases, and the ionic conductivity of such gc-LPS materials is significantly influenced by the glassy phases.41,42 Although the crystal structures and electronic properties of LPS have been thoroughly studied, the relationship between structures and Li conductivity in the gc-LPS materials has not been well understood, also due to the limitations of experimental and computational techniques for characterizing noncrystalline phases.
Figure 2.
Crystal structures of LPS compositions on and near the Li2S–P2S5 composition line (Li: green; S: yellow; P: purple). The structures are grouped by their local P–S motifs (see Figure 3). Note that Li2PS3 and Li48P16S61 do not exactly lie on the Li2S–P2S5 composition line, as seen in Figure 1. Note that the structure of the high-temperature α-Li3PS4 phase has not been fully resolved in the experiment, and our assignment here is speculative.
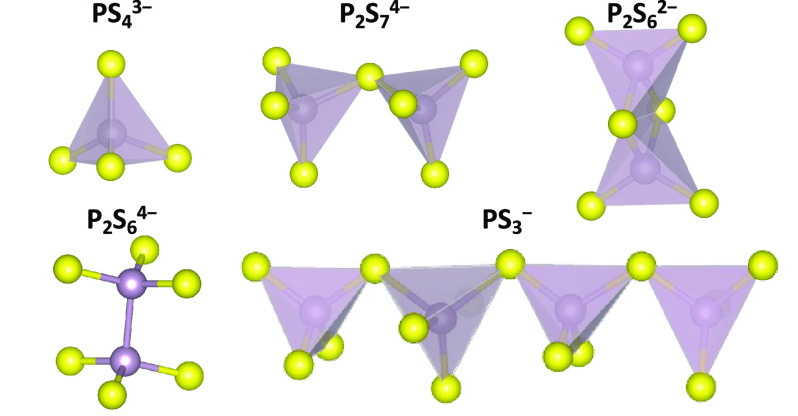
In contrast to crystal structures, glasses lack long-range atomic ordering. It has previously been reported that the energy landscape for ion migration can be impacted by subtle variations in the local structures of LPS,31,41,43,44 where different local P–S motifs are present depending on the LPS composition. Figure 3 illustrates the five PxSyn– anionic species commonly observed: ortho-thiophosphate (PS43–), pyro-thiophosphate (P2S74–), hypo-thiodiphosphate (P2S64–), meta-thiodiphosphate (P2S62–), and meta-thiophosphate (PS3–).45 Polymeric chains of PS3– are only observed in the LPS glasses with low Li2S contents (x ≤ 0.5 in Figure 2).45 Glass–ceramics, containing both crystalline and glassy domains, can be synthesized via ball-milling of the crystalline LPS compounds or by nucleating crystallites in glassy materials via heat treatment.45−47 Although the preparation methods can be dramatically different, the relative ratios of local motifs have been found to be similar as long as the composition remains the same.45
Figure 3.
P–S anion motifs in different gc-LPSs: ortho-thiophosphate (PS43–), pyro-thiophosphate (P2S74–), hypo-thiodiphosphate (P2S64–), meta-thiodiphosphate (P2S62–), and meta-thiophosphate (PS3–) (S: yellow; P: purple).
Different local P–S motifs can affect the Li sites and therefore change the Li ionic conductivity.41,43,44 For example, three Li3PS4 polymorphs, α-, β-, and γ-Li3PS4, have been synthesized and characterized.30−32 α-Li3PS4 was formed at high temperatures above 746 K,31 while β-Li3PS4 was first obtained at 573 K30 and subsequently also at room temperature with other preparation methods.32 γ-Li3PS4 was obtained only at room temperature.30 Although the local P–S motifs in the three Li3PS4 polymorphs are exclusively isolated PS43– tetrahedra, the phases exhibit different cation arrangements and differ in the orientation of the PS43– tetrahedra. Recent theoretical studies proposed that the Li mobility in the β phase is increased because of a paddle-wheel mechanism for Li migration that is observed in β-Li3PS4 but not in γ-Li3PS4.41,43,44
Previous computational studies mainly focused on the crystalline LPS phases, such as Li2PS3,48−50 Li7P3S11,21,51−56 Li3PS4,41,43,44,57 and Li7PS6.58 In some studies, glassy LPS phases were approximated with moderately sized defect structures or molecular dynamics simulations at high temperatures.41,54,57,59−63 The impact of local structure motifs on ionic conductivity in gc-LPS has recently been investigated by Sadowski and Albe,64 who report that the connectivity of PSx structural units does not significantly affect the Li conductivity of the glassy phases but that instead the nature of the Li sites is the most important structural factor. However, the Li migration mechanism remains controversial in the literature, since crystalline Li7P3S11 exhibits the highest ionic conductivity despite exhibiting corner-shared PS43– tetrahedra as local P–S motifs.21,51−55 In an earlier kinetic study combining reverse Monte Carlo (RMC) modeling and neutron diffraction, it was proposed that the corner-sharing P2S74– shields the positive charge of P due to electron transfer between P and bridging S, therefore suppressing Li conduction.65−67 However, a later ab initio molecular dynamics (AIMD) study found that the flexibility of P2S74– ditetrahedra facilitates Li+ diffusion.21
In essence, only few theoretical studies of amorphous/glassy LPS structures have been reported, and the effect of amorphization on Li conduction has not yet been well understood. Conventional density functional theory (DFT) based AIMD simulations alone are limited to relatively small structure models with ∼200 atoms, which makes it challenging to investigate amorphous phases without long-range ordering. In addition, sampling amorphous phases with such moderately sized structure models using AIMD simulations already required significant computational resources. On the other hand, machine learning potentials trained on first-principles reference data can be efficient and accurate for describing amorphous phases with reasonable computation cost.68−71
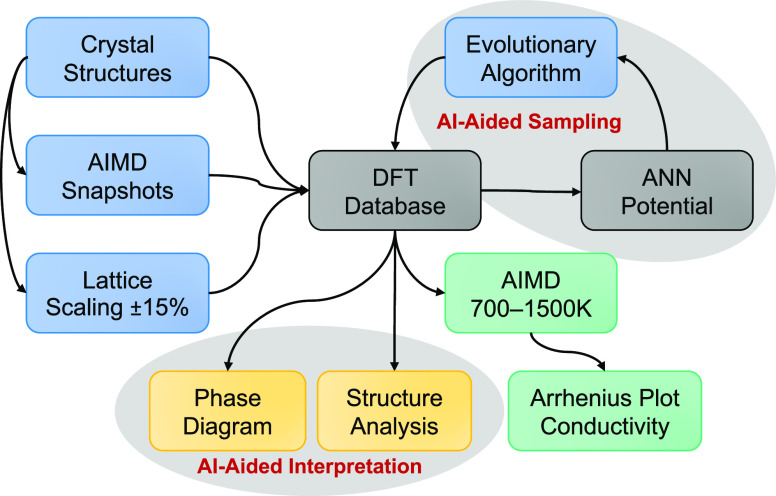
To determine the local atomic structures of gc-LPS with varying composition, we mapped the gc-LPS phase diagram by integrating DFT,72 artificial neural network (ANN) potentials,73 evolutionary/genetic-algorithm (GA) sampling, and AIMD simulations as illustrated by the workflow diagram in Figure 4. By varying the compositions along the Li2S–P2S5 composition line using an (artificial intelligence) AI-aided sampling approach, the phase diagram of gc-LPS was completed. For each LPS composition, GA global structure optimizations with an ANN potential were performed to determine low-energy atomic configurations. The relevant near-ground-state structures determined by this sampling approach were recomputed with DFT, and all reported final results are based on DFT. The thermodynamic stability and ionic conductivity of glassy/ceramic phases was correlated with local structural motifs by determining similarities of Li sites in glassy and crystalline LPS structures motivated by the recent findings by Sadowski and Albe,64 which allowed identifying structure–composition–conductivity relationships. With machine learning accelerated sampling and AIMD simulations, a candidate solid-state electrolyte composition, (Li2S)x(P2S5)1–x (x = 0.724), with high ionic conductivity (>10–2 S cm–1) was identified, which points toward a design strategy for LPS-based SE materials with enhanced conductivity and stability.
Figure 4.
Workflow that was used for the AI-aided mapping of the glass–ceramic (gc)-LPS phase diagram by combining density-functional theory (DFT) calculations and accelerated sampling with artificial neural network (ANN) potentials and an evolutionary (genetic) algorithm. All final reported results were obtained from either static DFT calculations (yellow boxes) or DFT-based ab initio molecular dynamics (AIMD) simulations (green boxes).
Methods
Density Functional Theory Calculations
All DFT calculations were carried out with the projector-augmented-wave (PAW) method74,75 and the Perdew–Burke–Ernzerhof (PBE) exchange-correlation functional76 as implemented in the Vienna Ab Initio Simulation Package (VASP)72,74 and an energy cutoff of 520 eV. Gaussian smearing with a width of 0.05 eV was used, and total energies were generally converged better than 10–5 eV/atom; the final force on each atom was less than 0.02 eV/Å. The first Brillouin zone was sampled using VASP’s fully automatic k-point scheme with length parameter Rk = 25 Å.
Amorphous structure models were generated with AIMD simulations of supercells containing 80–128 atoms. In AIMD simulations, a Gamma k-point scheme was employed to reduce the computational cost. The time step for the integration of the equations of motion was set to 1 fs, and the temperature of the system was set to 1200 K using a Nosé–Hoover thermostat.77 To obtain near-ground-state structures as reference for the machine-learning potential (see below), 150 evenly spaced snapshots were extracted from the AIMD trajectories that were reoptimized with DFT at zero Kelvin via geometry optimizations as described above.
To determine ionic conductivities, ∼300 ps long AIMD simulations were performed for select compositions (detailed in the Results section) after at least 50 ps of equilibration at the temperatures 700, 900, 1200, and 1500 K. The ionic conductivities at room temperature and the activation energies were obtained from Arrhenius extrapolation.69
Representation of Atomic Environments
To be suitable as inputs for our machine-learning models, local atomic environments, including atomic positions and species, need to be featurized, i.e., transformed to a vector representation with constant dimension.78 In the present work, these feature vectors were derived from the expansion of the radial and angular atomic distribution functions in an orthogonal basis set as described previously.78 The expansion of the radial distribution function (RDF) centered on atom i is approximated as
where α = 0, ..., αmax is the expansion order, ϕα and ϕ̅α are the basis function corresponding to order α as well as its orthogonal dual function, and cαRDF are the expansion coefficients. The second sum in the expression of the coefficients runs over the Cartesian coordinates R⃗j of all atoms j within the local environment of atom i, σi, the distance between atom i and its neighbor j is denoted Rij, and fc is a cosine cutoff function that smoothly goes to zero at a defined maximal interaction distance. The expansion of the angular distribution function (ADF) is equivalent and yields the expansion coefficients {cα}.
The RDF and ADF expansion coefficients {cαRDF} and {cα} are invariant with respect to the rotation and translation of the atomic structure and the permutation of equivalent atoms, which makes them suitable features of the local structure. To incorporate information about the chemical species within the local atomic environment σi, the contribution of each atom j is weighted with an element-specific weight wtj (tj is the type of atom j), yielding a second set of expansion coefficients {c̃αRDF} and {c̃α}. The complete feature vector of the local atomic environment of atom i is then given by the concatenation of the four sets of expansion coefficients
Here, we employed a Chebyshev basis set with a cutoff of 6.0 Å for the radial expansion (expansion order 18) and a cutoff of 3.0 Å for the angular expansion (expansion order 4).79 Hence, the dimension of the Chebyshev feature vectors f⃗i is 2 × (19 + 5) = 48, including also the coefficients for expansion order 0. We used wtj = −1, 0, +1 to weight the contributions of the three species.
Machine-Learning Potentials
All machine-learning potential (MLP) simulations were performed with artificial neural network (ANN) potentials79,80 as implemented in the atomic energy network package (ænet).73,79,81 ANN potentials represent the total energy Etot of an atomic structure as the sum of atomic energies, Etot = ∑iNatomEi, where the atomic energies Ei are predicted by ANNs for a given local atomic environment and Natom is the number of atoms in the structure. Local atomic environments were represented as described above. An ANN architecture with two hidden layers of 15 nodes each and hyperbolic tangent activation functions was employed. The Broyden–Fletcher–Goldfarb–Shanno (BFGS) method82 was employed for the weight optimization. A total of 10% of the reference data were randomly selected as an independent validation set for cross-validation and were not used during training. The training was repeated 10 times for 500 training iterations using different randomly initialized weight parameters, and the ANN potential with the lowest validation-set error was selected.
For accelerated sampling, a specialized ANN potential was trained on a data set containing ∼6000 atomic structures that were generated with the following iterative approach: (i) An initial ANN potential was trained on the LPS crystal structures with lattice parameters scaled between ±15% and randomly perturbed atomic positions from short AIMS simulations at 1200 K; (ii) a number of gc-LPS structure configurations were generated with the genetic algorithm sampling approach described below using the ANN potential; and (iii) the 10 structures with lowest ANN potential energy among those sampled were reoptimized using DFT and added to the reference data set. The final ANN potential yields a root-mean-squared error of 1.4 meV/atom and a mean absolute error of 0.6 meV/atom relative to the DFT reference energies in an independent validation set that was not used for training and contained 10% of the structures in our database. As previously demonstrated for amorphous LiSi alloys and LiPON solid electrolytes,68−70 specialized ANN potentials constructed based on moderately sized reference data sets can be used in conjunction with DFT for accelerated sampling of amorphous phases.
Genetic Algorithm Sampling
With the specialized ANN potential, the amorphous phases along the Li2S–P2S5 composition line were sampled with a genetic-algorithm (GA) as implemented in the atomistic evolution (ævo) package (http://ga.atomistic.net),68 following previously reported strategies that are briefly described in the following.68−70 Although glassy phases lack long-range ordering, it can be expected that the local atomic motifs in gc-LPS phases resemble those of the known LPS crystalline phases (Figure 3). The phase diagram of LPS compositions was therefore constructed by varying the stoichiometry x in (Li2S)x(P2S5)1–x via removing Li2S or P2S5, respectively, from supercells of the known LPS crystal structures. The approach is as follows:
-
1.
A supercell of one of the crystal structures LiPS3, Li7P3S11, β-Li3PS4, γ-Li3PS4, or Li7PS6 is chosen as the parent structure;
-
2.
The GA is used to identify combinations of 2 Li and 1 S atoms that can be removed with low formation energy relative to Li2S and P2S5;
-
3.
The created Li2S deficient composition is optimized with DFT; and
-
4.
The optimized structure is taken to be the new parent structure, and the algorithm continues with step (2).
We used the same technique to sample in the opposite direction on the Li2S–P2S5 composition line by removing 2 P and 5 S atoms at each step (instead of 2 Li and 1 S atoms).
The GA employed a population size of 32 trials and a mutation rate of 10%. For each composition, at least 10 lowest energy structure models identified with the ANN-GA approach were selected and fully relaxed with DFT to obtain the first-principles phase diagram. We emphasize that the GA sampling approach yields, by design, DFT optimized structures and their DFT energies.
Formation Energy
For any given structure and composition (Li2S)x(P2S5)1–x the corresponding formation energy per atom was calculated as
| 1 |
where E is the total energy of a specific configuration as predicted by DFT; x is the molar fraction of Li2S in the LPS composition; and ELi2S and EP2S5 are constant and are equal to the total energy per formula unit of bulk Li2S and P2S5, respectively. For any given composition, the configuration with a lower formation energy is thermodynamically favored at zero Kelvin. The stabilities of different compositions can be compared by constructing the lower convex hull of the formation energies to obtain the phase diagram.68
Structure Similarity and Classification
Low-energy amorphous LPS structures were compared with the known LPS crystal structures by their connectivity of PS4 tetrahedra, following a previous study.69 In addition, we analyzed structure similarities based on structure fingerprints, i.e., each considered structure was transformed to a feature vector with constant dimension. These structure fingerprints were constructed based on the Chebyshev descriptors of local atomic environments, mentioned above in the context of ANN potentials.79 The local environment of an atom i is represented by a Chebyshev feature vector f⃗i. To construct a structure fingerprint F⃗, the first K moments of the distribution of the atomic feature vectors were calculated, where the kth moment is given by
| 2 |
and ⟨f⃗⟩ =f⃗(1) is the mean atomic feature vector (the first moment). The structure fingerprint is then the union (i.e., vector concatenation) of the distribution moments, F⃗ = f⃗(1) ∪ f⃗(2) ∪ ..., until a maximum moment. In practice, we found that truncating after the second moment already yielded unique structure fingerprints that can distinguish all atomic structures in our database. Atom-type specific structure fingerprints can be constructed by including only atomic feature vectors for the local atomic environments of select atomic species. We made use of this approach by constructing structure fingerprints based on only the local atomic environment of Li atoms. Finally, we reduced the dimension of the structure fingerprints by performing a principal component analysis (PCA) after data standardization, using the PCA and StandardScaler implementations of the scikit-learn library.83 We found 10 principal components to be sufficient, which can explain 85% of the data variance. Hence, each atomic structure in our database could be uniquely represented by a fingerprint vector with 10 components.
Using the structure fingerprints, we define the similarity Sp of two atomic structures as the Pearson correlation coefficient
| 3 |
where F⃗1 and F⃗2 are two (dimension-reduced) structure fingerprints. Furthermore, we performed a cluster analysis of the structure fingerprints using the k-means approach as also implemented in scikit-learn.83
Results
Phase Diagram along the Li2S–P2S5 Composition Line
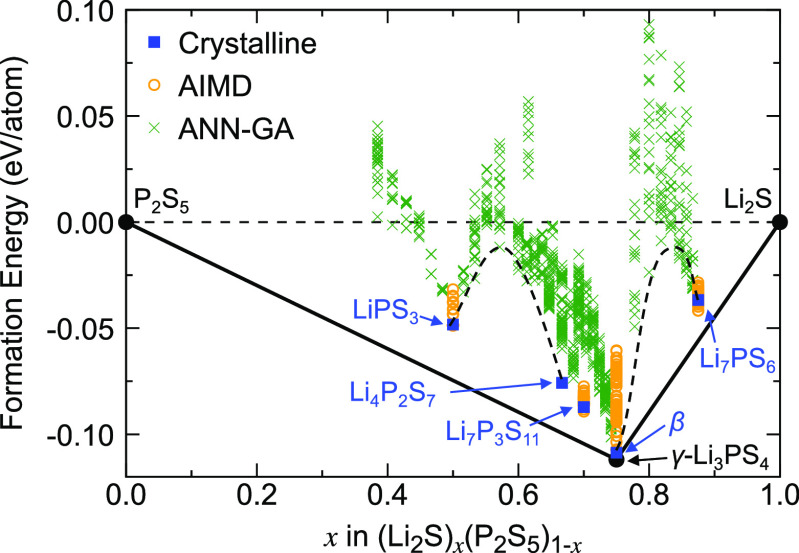
Our computational sampling of the Li2S–P2S5 composition line started with 13 LPS crystal structures with the formula units LiPS3,13 Li2PS3,14−16 Li4P2S7,58,60 Li7P3S11,17 α-Li3PS4,31 β-Li3PS4,30,32 γ-Li3PS4,30 Li48P16S61,84 and low-temperature (LT)-Li7PS635 that had previously been reported based on experimental characterization and/or theoretical modeling. The crystal structures, which were obtained from the Inorganic Crystal Structure Database (ICSD)85 and the Materials Project (MP)86 database, are shown in Figure 2. The DFT formation energies of the crystalline LPS phases relative to Li2S and P2S5, the end points of the composition line, are shown in Figure 5. As seen in this phase diagram, only one crystal structure (γ-Li3PS4) appears on the lower convex hull of the formation energies and is thus predicted to be thermodynamically stable at zero Kelvin. The previously reported superionic conductors, β-Li3PS430,32 and Li7P3S11,17 are 3.2 meV/atom and 17.2 meV/atom above the convex hull, indicating that they are metastable at zero Kelvin. However, the energy difference between β-Li3PS4 and γ-Li3PS4 is small (3.2 meV/atom) compared to the thermal energy per degree of freedom at room temperature (∼26 meV), so that it is plausible that the β polymorph can be thermodynamically stable at room temperature. Note that the crystal structure of Li4P2S758,60 is a theoretical prediction from the literature and has not been characterized experimentally yet, which is consistent with its comparatively high decomposition energy of 23.5 meV/atom in our phase diagram.
Figure 5.
Computational LPS phase diagram along the P2S5–Li2S composition line. Only the γ-Li3PS4 phase lies on the lower convex hull (black solid line) and is thus predicted to be thermodynamically stable at zero Kelvin. Metastable crystalline phases are indicated by blue squares, and structures generated from ab initio molecular dynamic (AIMD) simulations and genetic-algorithm (GA) sampling with the ANN potential are shown as orange circles and green crosses, respectively. Two miscibility gaps are indicated with dashed black lines to guide the eye.
Also shown in the phase diagram of Figure 5 are structures that were generated using the ANN-GA sampling methodology described in the Methods section by removing Li2S or P2S5 from supercells of the crystal structures. This composition sampling yielded low-energy structures with structural disorder and no symmetry, as one would expect for amorphous or glassy phases, while still exhibiting local similarities with the parent crystal structures from which they were derived. At zero Kelvin, these glass–ceramic structures are also predicted to be thermodynamically unstable, though they might be stabilized at synthesis temperatures due to their high entropy (entropy control) or via kinetic trapping.
As seen in the phase diagram, the ANN-GA sampling identified two miscibility gaps between LiPS3 and Li4P2S7 and between Li3PS4 and Li7PS6, respectively. This means that compositions (Li2S)x(P2S5)1–x with 0.5 < x < 0.667 and 0.75 < x < 0.875 will likely phase separate instead of forming a solid solution, in agreement with previous experimental observations (see also the Discussion section).24 However, between Li4P2S7 and Li3PS4, amorphous structures with low energies above the convex hull (<90 meV/atom) were found. It can, therefore, be expected that compositions with 0.667 < x < 0.75 can be more readily synthesized.
Structural Motifs of the Sampled LPS Phases
The LPS crystal structures shown in Figure 2 are composed of a variety of local motifs (Figure 3), which have previously been found to affect the ionic conductivity and the Li transport mechanisms.45 Isolated PS43– tetrahedra are mostly observed in the gc-LPS compositions with high Li2S content (x ≥ 0.75), such as α-Li3PS4, β-Li3PS4,30,32 γ-Li3PS4,30 and Li7PS6.35 The P2S74– motif, consisting of two corner-sharing PS4 tetrahedra, is the main building block of the Li7P3S11 crystal structure17 as well as glassy LPS compositions with x < 0.75. The P2S62– motif, formed by two edge-sharing PS4 tetrahedra, is observed in gc-LPS with x ≤ 0.6 and is the only local motif in LiPS3 crystals.13 The P2S64– with direct P–P bonding is typically present in gc-LPS with 0.6 ≤ x ≤ 0.7.24 Note that the oxidation state of P is +4 only in the P2S64– motif, while it is +5 in all other local motifs. The P2S64– motif also occurs in Li2PS3,14−16 which is a sulfur-deficient composition that is not on the Li2S–P2S5 composition line.
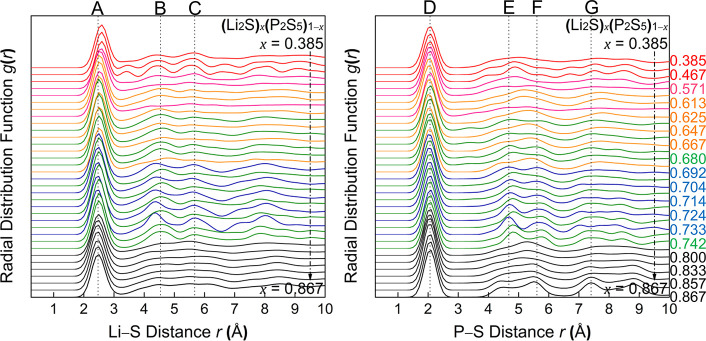
To better understand the local structures of the ANN-GA sampled gc-LPS phases, we computed the radial pair distribution functions (RDFs) for P–S and Li–S in gc-LPS compositions with 0.385 ≤ x ≤ 0.867 as shown in Figure 6 and Figure S1. As seen in the figures, and as expected, the RDFs of the generated gc-LPS structures exhibit features of the crystal structure RDFs but show broadened peaks with shifted peak positions. In general, with decreasing amount of Li2S in gc-LPS, the main Li–S peak shifts to greater distances, which is caused by the formation of corner-sharing motifs, in agreement with previous reports.42,60,61 Note that for a large fraction of the gc-LPS structures (∼1/3) the shape of the RDF differs significantly from that of the parent structure; i.e., the RDFs of derived structures exhibit different peaks than the RDF of the parent crystal structure. Instead, structures with the same composition that were derived from two different parent structures exhibit similar peaks, indicating that these compositions have a strong preference for specific structural motifs. This is especially evident in the S–S RDF shown in Figure S1 and indicates that gc-LPS with compositions in between the crystalline phases may exhibit multiple different local structural motifs found in the neighboring (by composition) crystalline LPS.
Figure 6.
Calculated Li–S (left) and P–S (right) radial distribution functions (RDF) of glass–ceramic (gc) (Li2S)x(P2S5)1–x (gc-LPS) phases with varying compositions from x = 0.385 to x = 0.867 (the composition of every other line is labeled on the right). Each line is an average RDF of the 10 lowest-energy structures at a specific composition. The gc-LPS structures were generated by genetic-algorithm modification of a parent structure (see Methods section), and the color represents the parent crystal structure (i.e., black: Li7PS6, blue: γ-Li3PS4, green: β-Li3PS4, orange: Li7P3S11, pink and red: LiPS3). The dashed lines indicate measured RDFs from experiments: Peak A,41,42,62 B,24,41,42 C,24,41 D,15,24,41,62 E,15,24,41 F,24,41 and G.24
As discussed in the Introduction section, the P–S structural building blocks alone cannot explain all the differences in the Li conductivities, and RDFs capture only one specific structural feature, namely, radial correlations. The structural fingerprints introduced in the Methods section are more general. Figure 7 shows an analysis of the structural fingerprints of all structures in our database to identify and visualize similarities more directly. For this comparison, each structure was represented by a structure fingerprint based on the local atomic environments of all Li atoms, which can be assumed to be an important criterion for Li conductivity.
Figure 7.
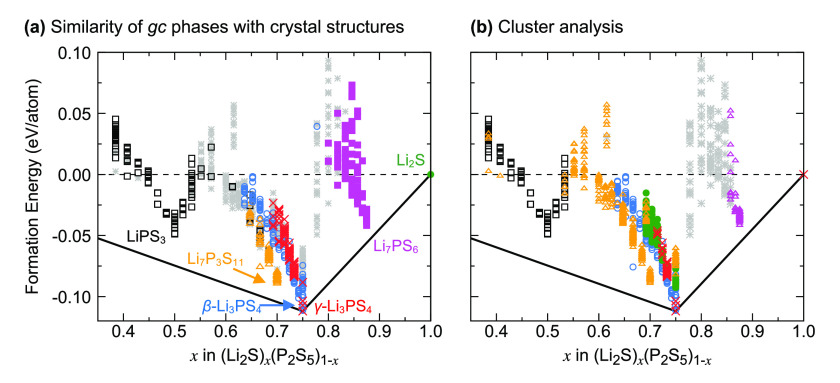
Analysis of the local atomic Li environment in the simulated glass–ceramic (gc) phases. (a) The symbols and color coding indicate the crystal structure that is most similar based on the Pearson correlation of the structural fingerprints. Structures that are not strongly correlated with any crystal structure are shown as gray stars. (b) Grouping of similar structures with k-means clustering of the Li local atomic environments. The structures within the same cluster are shown with the same symbol and color.
In Figure 7a, the similarities of each structure with the reference crystal structures LiPS3, Li7P3S11, β-Li3PS4, γ-Li3PS4, Li7PS6, and Li2S are shown. The Pearson correlation Sp of the structure descriptors (see Methods section) was used as a measure of similarity, and structures with Sp < 0.4 for all of the crystal structures were considered not to be similar to any of the reference structures. With this threshold, more than 95% of the structures in our database can be assigned uniquely to a reference crystal structure (see Figure S2). Most of the structures derived from either LiPS3 or Li7PS6 remain similar to their parent structure during sampling, leading to distinct clusters for these structures in Figure 7a. However, trends are more complicated for compositions near Li3PS4 (x = 0.75). Within the narrow composition range 0.70 ≤ x ≤ 0.75, the structures closest to the ground-state hull change in character from Li7P3S11 to structures that are similar to β-Li3PS4 and γ-Li3PS4.
Instead of classifying the sampled glass–ceramic structures by their similarities to reference crystal structures, Figure 7b shows the result of an unsupervised classification of Li environments using k-means clustering. The predicted grouping resembles the one shown in Figure 7a but with clearer trends in phase stabilities. At the composition Li3PS4, the cluster analysis finds that the Li environment changes with increasing energy, which we can attribute to the γ, β, and α polymorphs. At high energies above the ground state hull, a fourth class of the Li environment is found of which Li7P3S11 is also a member, though it is unlikely that these structures can be synthesized at any conditions.
Li Conductivity
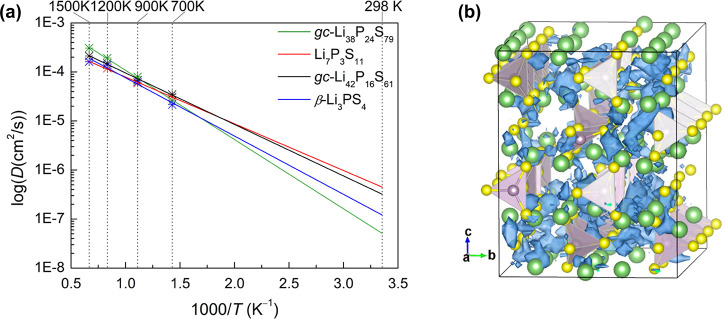
The cluster analysis of the Li atom environments discussed in the previous section indicates that the lowest-energy gc-LPS phases with compositions between Li7P3S11 (x = 0.70) and Li3PS4 (x = 0.75) exhibit the same type of Li environments as the superionic conductor β-Li3PS4. Given this energetic preference, it is likely that β-Li3PS4-like Li environments are present in as-synthesized gc-LPS within this composition range or would form over time. To determine if this similarity also translates to Li conductivity, we performed AIMD simulations for a glass–ceramic LPS with composition gc-Li42P16S61 (x = 0.724), the two neighboring crystalline phases (β-Li3PS4 and Li7P3S11), and a composition outside the target range, gc-Li38P24S79 (x = 0.613), for comparison. The ionic conductivities at room temperature were obtained from Arrhenius extrapolation (Figure 8a and Figure S3) and are compiled in Table 1. The table also shows measured ionic conductivities in gc-LPS from the literature, which are sensitive with respect to the experimental conditions, e.g., temperature and pressure. Samples prepared under different conditions may exhibit different local motifs, leading to a wide range of measured conductivities.21−23
Figure 8.
(a) Arrhenius plot of the calculated diffusivities from AIMD simulations at elevated temperatures (700, 900, 1200, and 1500 K) of selected gc-LPS compositions (gc-Li38P24S79, gc-Li42P16S61, Li7P3S11, and β-Li3PS4) and extrapolation to room temperature. (b) Isosurface of the probability density distribution (blue) P(r) of Li+ ions in gc-Li42P16S61 at 700 K (Li: green; S: yellow; P: purple).
Table 1. Comparison of Calculated Activation Energy and Li Conductivity of Selected gc-LPS Phases (i.e., gc-Li38P24S79, gc-Li42P16S61, Li7P3S11, and β-Li3PS4) with Experimental Measurements.
| activation
energy (eV) |
ionic
cond. RT (mS cm–1) |
|||||||
|---|---|---|---|---|---|---|---|---|
| x | formula | moiety | our AIMD | ref. AIMD | exp. | our AIMD | ref. AIMD | exp. |
| 0.613 | gc-Li38P24S79 | P2S74–, PS43– | 0.282 | N/A | N/A | 3.45 | N/A | N/A |
| 0.7 | Li7P3S11 | P2S74–, PS43– | 0.189 | 0.18955 | 0.18711 | 46.9 | 5721 | 3.211,12 |
| 0.18721 | 0.12412 | 72.1654 | 4.118 | |||||
| 0.1754 | 0.14518 | 5.219 | ||||||
| 0.3840 | 0.17620 | 1720 | ||||||
| 0.18–0.20921 | 1.3–11.621 | |||||||
| 0.29–0.42522 | 0.022–8.622 | |||||||
| 0.289–0.40123 | 0.05–423 | |||||||
| 0.45124 | ||||||||
| 0.724 | gc-Li42P16S61 | PS43– | 0.208 | N/A | N/A | 33.1 | N/A | N/A |
| 0.75 | β-Li3PS4 | PS43– | 0.236 | 0.1, 0.3561 | 0.4927 | 14.3 | 4.3557 | 0.228 |
| 0.2340 | 0.35228 | 7,41 1941 | 0.1632 | |||||
| 0.3544 | 0.1631 | 0.2824 | ||||||
| 0.22, 0.2541 | 0.35632 | |||||||
| 0.39924 | ||||||||
As shown in Table 1, our predicted ionic conductivity and activation energy in crystalline Li7P3S11 is in good agreement with previously reported experimental measurements and theoretical calculations. The differences are greater for the β-Li3PS4 phase, where the agreement with previous simulations is good but predicted conductivities are significantly greater than those observed in experiments. This has to be expected, since the metastable β phase is more challenging to characterize experimentally as well as in simulations. Hence, the data for the β phase is subject to greater uncertainties.
The ionic conductivity of gc-Li42P16S61 is high (33.1 mS cm–1) and lies between the conductivities of crystalline Li7P3S11, 46.9 mS cm–1, and β-Li3PS4, 14.3 mS cm–1. In comparison, the other amorphous phase, gc-Li38P24S79 (x = 0.613), has a significantly lower ionic conductivity of 3.45 mS cm–1 and higher activation energy of 0.282 eV (Table 1), showing that noncrystallinity alone is not responsible for the high conductivity. Note that energetically gc-Li42P16S61 is only 28.0 meV/atom above the ground-state hull and is likely synthesizable, whereas gc-Li38P24S79 lies in a miscibility gap (70.5 meV/atom above the hull) in the phase diagram (Figure 5) and is highly unstable, so that the composition would likely phase separate on longer time scales.
Discussion
In the present work, we mapped the phase stability and structure of glass–ceramic lithium thiophosphates along the Li2S–P2S5 composition line. Our calculations identified two miscibility gaps in the composition ranges (Li2S)x(P2S5)1–x with 0.5 ≤ x ≤ 0.667 and 0.75 ≤ x ≤ 0.875, predicting that solid solutions with such compositions would be challenging to synthesize and likely to phase separate at room temperature. Dietrich et al. previously conducted an experimental study of glass–ceramic LPS compounds with 0.6 ≤ x ≤ 0.8 and found that LPS (x = 0.8) phase separates into Li3PS4 (x = 0.75) and Li2S (x = 1.0),24 in agreement with our prediction. However, the same authors reported the successful preparation and characterization of LPS (x = 0.6), which should also be unstable based on the calculated phase diagram. A possible explanation for this discrepancy could be sulfur deficiency in the compositions, since Li4P2S6 is a known decomposition product of gc-Li4P2S713 and an attractor in the phase diagram (see Figure 1). The impact of such off-stoichiometries deserves a more detailed study in the future.
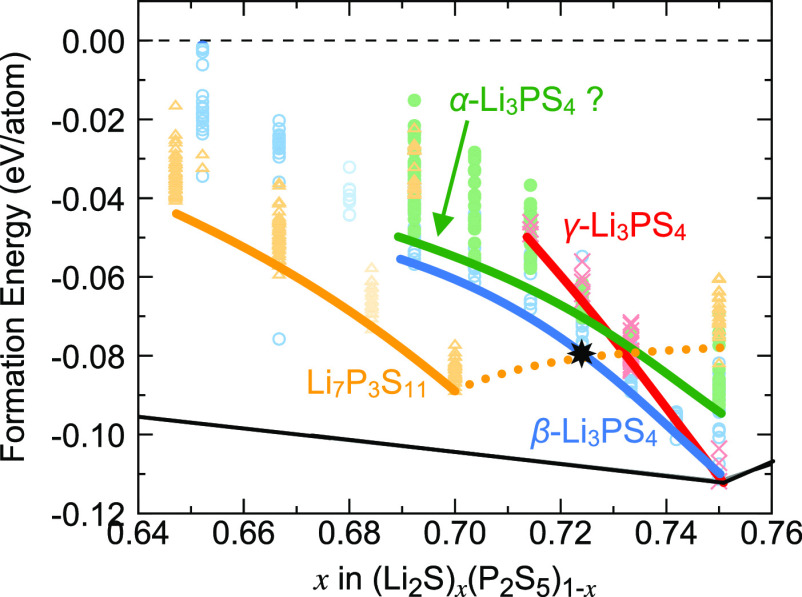
The calculated phase diagram shows that the superionic LPS compounds are metastable and therefore prone to decomposition, which is in agreement with previous experimental and computational work discussed in the Introduction section. A particular challenge is that the β-Li3PS4 polymorph, a superionic Li conductor, is unstable compared to the γ-Li3PS4 polymorph, which exhibits poor Li conductivity. The cluster analysis of Li environments (Figure 7) points toward an opportunity, since Li environments similar to those in β-Li3PS4 become stable compared to those of the γ phase when the composition is slightly altered from the ideal Li3PS4 (x = 0.75) to x < 0.75. This relative destabilization of the γ phase is visualized in Figure 9. Indeed, our AIMD simulations confirm that the glass–ceramic gc-Li42P16S61 (x = 0.724) exhibits a high Li conductivity of 33 mS cm–1. The RDF analysis of Figure 6 further shows that the P–S and Li–S distribution in gc-Li42P16S61 derived from β-Li3PS4 still resembles that of the parent phase. As seen in Figure 8b, the gc-Li42P16S61 structure exhibits both well-ordered and disordered domains, and the Li probability distribution is greater in the ordered regions. This further indicates that reminiscence of the crystalline phase is important for Li conductivity in this gc-LPS composition. Though we note that the PSx motifs do not generally control the Li environments, there are structures with similar P–S RDFs but different Li environments. An example is analyzed in Supporting Information Figure S4.
Figure 9.
Analysis of the LPS phase diagram near the composition Li3PS4 = (Li2S)0.75(P2S5)0.25, based on the cluster analysis of Figure 7. The energetic order of structures with Li environments similar to the β- and γ-Li3PS4 changes as the Li2S content decreases, and structures that are similar to γ-Li3PS4 are destabilized relative to those similar to β-Li3PS4. The identified glass–ceramic phase with good Li conductivity, gc-Li42P16S61, is indicated by a star. Note that the structure of the high-temperature α-Li3PS4 phase has not been fully resolved in experiment, and our assignment here is speculative.
Similar to the known crystalline LPS superionic conductors, the here identified LPS composition is also metastable and thermodynamically unstable with respect to decomposition into P2S5 and Li3PS4 at zero Kelvin; i.e., it is above the convex hull of formation energies. It has previously been established that knowledge of the energy above the convex hull is insufficient to predict synthesizability87 and that the thermodynamic limit for the synthesis of metastable compounds is chemistry-dependent.88 On the other hand, a wide range of different gc-LPS compositions have previously been reported (e.g., see ref (33)), indicating that glassy–ceramic phases can be synthesized even when their energy is more than the thermal energy at room temperature (26 meV) above the formation energy hull. Unlike crystalline phases, gc-LPS phases such as the predicted gc-Li42P16S61 benefit from entropy stabilization at finite temperatures. Furthermore, and unlike other glass–ceramic Li conductors, the desired phase with β-Li3PS4-like Li environments is predicted to be the lowest in energy at the composition (Li2S)x(P2S5)1–x with x = 0.724, which means that the phase, if it can be synthesized, could be expected to be shelf-stable at room temperature.
Taken together, the observations made in the present work led to the following design strategy for amorphous solid Li conductors: (1) If Li superionic conductors within a given composition space (such as Li2S–P2S5) are known but are unstable due to phase transitions, the local atomic environment of the Li sites can be taken as a design target, in agreement with previous findings.64 (2) Potentially stable superionic conductors can then be identified by searching for regions within the composition space that energetically favor the target Li site environment over other environments.
Finally, we stress that our computational study is subject to approximations, and an experimental confirmation is warranted. The most significant approximation in the present study is the generation and representation of glass–ceramic phases, which was necessarily limited to comparatively small structure sizes and nonexhaustive sampling. Though, based on previous work,68,69 ANN-potential accelerated sampling yielded a sufficiently good approximation of the true LPS composition and structure space that the predicted phase diagram and the identified trends in Li environments can be expected to be robust. Another limitation of the present study is that it only considered the Li2S–P2S5 composition line, even though sulfur-deficient LPSs have been reported. The impact of such off-stoichiometries, alluded to in the above discussion, deserves its own investigation.
Conclusions
We mapped the phase diagram of lithium thiophosphate, (Li2S)x(P2S5)1–x, solid electrolytes using first-principles calculations with AI-aided sampling and structure similarity analysis. The phase diagram exhibits two pronounced miscibility gaps, so that compositions with 0.5 < x < 0.667 and 0.75 < x < 0.875 are prone to phase separation at room temperature even if they can be synthesized. We showed that glassy/ceramic phases with compositions 0.70 < x < 0.75 are more likely to be stable because of their lower decomposition energies and exhibit Li sites with local structural environments similar to those in the superionic conductor β-Li3PS4. This led us to propose a candidate solid-state electrolyte composition, (Li2S)x(P2S5)1–x, with x = 0.724, that exhibits high ionic conductivity (>10–2 S cm–1) in simulations, demonstrating a design strategy for glassy or amorphous solid-electrolyte materials with good conductivity and stability.
Acknowledgments
This work was funded by the U.S. Department of Energy (DOE), Office of Energy Efficiency and Renewable Energy (EERE), Vehicle Technologies Office (VTO), Contract No. DE-SC0012704, Advanced Battery Materials Research program (Tien Duong, Program Manager). The project used resources at the Scientific Data and Computing Center of the Computational Science Initiative at Brookhaven National Laboratory under Contract No. DE-SC0012704. Computations also made use of the Extreme Science and Engineering Discovery Environment (XSEDE), which is supported by National Science Foundation Grant Number ACI-1053575 (Allocation No. DMR14005). We also acknowledge computing resources from Columbia University’s Shared Research Computing Facility project, which is supported by NIH Research Facility Improvement Grant 1G20RR030893-01, and associated funds from the New York State Empire State Development, Division of Science Technology and Innovation (NYSTAR) Contract C090171, both awarded April 15, 2010. The authors thank Feng Wang, Deyu Lu, Shinjae Yoo, and Zhoulin Xia for insightful discussions.
Supporting Information Available
. The Supporting Information is available free of charge at https://pubs.acs.org/doi/10.1021/acs.chemmater.2c00267.
A figure with additional radial distribution functions, a figure with additional details of the similarity analysis, mean squared displacement plots, and an analysis of representative gc-LPS structures (PDF)
The authors declare no competing financial interest.
Notes
This work made use of the free and open-source atomic energy network (ænet) package. The ænet source code can be obtained either from the ænet Web site (http://ann.atomistic.net) or from GitHub (https://github.com/atomisticnet/aenet). The evolutionary algorithm package, ævo, can also be obtained from the GitHub (https://github.com/atomisticnet/aevo). The reference LPS data sets can be obtained from the Materials Cloud repository (10.24435/materialscloud:j5-tz). The data set contains atomic structures and interatomic forces in the XCrySDen structure format (XSF),89 and total energies are included as additional meta information.
Supplementary Material
References
- Xiao Y.; Wang Y.; Bo S.-H.; Kim J. C.; Miara L. J.; Ceder G. Understanding Interface Stability in Solid-State Batteries. Nat. Rev. Mater. 2019, 5, 105–126. 10.1038/s41578-019-0157-5. [DOI] [Google Scholar]
- Trahey L.; Brushett F. R.; Balsara N. P.; Ceder G.; Cheng L.; Chiang Y.-M.; Hahn N. T.; Ingram B. J.; Minteer S. D.; Moore J. S.; Mueller K. T.; Nazar L. F.; Persson K. A.; Siegel D. J.; Xu K.; Zavadil K. R.; Srinivasan V.; Crabtree G. W. Energy Storage Emerging: A Perspective from the Joint Center for Energy Storage Research. Proc. Natl. Acad. Sci. U. S. A. 2020, 117 (23), 12550–12557. 10.1073/pnas.1821672117. [DOI] [PMC free article] [PubMed] [Google Scholar]
- Tian Y.; Zeng G.; Rutt A.; Shi T.; Kim H.; Wang J.; Koettgen J.; Sun Y.; Ouyang B.; Chen T.; Lun Z.; Rong Z.; Persson K.; Ceder G. Promises and Challenges of Next-Generation “Beyond Li-Ion” Batteries for Electric Vehicles and Grid Decarbonization. Chem. Rev. 2020, (121), 1623–1669. 10.1021/acs.chemrev.0c00767. [DOI] [PubMed] [Google Scholar]
- Banerjee A.; Wang X.; Fang C.; Wu E. A.; Meng Y. S. Interfaces and Interphases in All-Solid-State Batteries with Inorganic Solid Electrolytes. Chem. Rev. 2020, 120, 6878. 10.1021/acs.chemrev.0c00101. [DOI] [PubMed] [Google Scholar]
- Yu Z.; Wang H.; Kong X.; Huang W.; Tsao Y.; Mackanic D. G.; Wang K.; Wang X.; Huang W.; Choudhury S.; Zheng Y.; Amanchukwu C. V.; Hung S. T.; Ma Y.; Lomeli E. G.; Qin J.; Cui Y.; Bao Z. Molecular Design for Electrolyte Solvents Enabling Energy-Dense and Long-Cycling Lithium Metal Batteries. Nat. Energy 2020, 5 (7), 526–533. 10.1038/s41560-020-0634-5. [DOI] [Google Scholar]
- Pang Y.; Pan J.; Yang J.; Zheng S.; Wang C. Electrolyte/Electrode Interfaces in All-Solid-State Lithium Batteries: A Review. Electrochem. Energy Rev. 2021, 4, 169. 10.1007/s41918-020-00092-1. [DOI] [Google Scholar]
- Balaish M.; Gonzalez-Rosillo J. C.; Kim K. J.; Zhu Y.; Hood Z. D.; Rupp J. L. M. Processing Thin but Robust Electrolytes for Solid-State Batteries. Nat. Energy 2021, 6 (3), 227–239. 10.1038/s41560-020-00759-5. [DOI] [Google Scholar]
- Zhang Q.; Cao D.; Ma Y.; Natan A.; Aurora P.; Zhu H. Sulfide-Based Solid-State Electrolytes: Synthesis, Stability, and Potential for All-Solid-State Batteries. Adv. Mater. 2019, 31 (44), 1901131. 10.1002/adma.201901131. [DOI] [PubMed] [Google Scholar]
- Kim K. J.; Balaish M.; Wadaguchi M.; Kong L.; Rupp J. L. M. Solid-State Li-Metal Batteries: Challenges and Horizons of Oxide and Sulfide Solid Electrolytes and Their Interfaces. Adv. Energy Mater. 2021, 11 (1), 2002689. 10.1002/aenm.202002689. [DOI] [Google Scholar]
- Ravaine D. Glasses as Solid Electrolytes. J. Non-Cryst. Solids 1980, 38–39, 353–358. 10.1016/0022-3093(80)90444-5. [DOI] [Google Scholar]
- Mizuno F.; Hayashi A.; Tadanaga K.; Tatsumisago M. New, Highly Ion-Conductive Crystals Precipitated from Li2S-P2S5 Glasses. Adv. Mater. 2005, 17 (7), 918–921. 10.1002/adma.200401286. [DOI] [Google Scholar]
- Mizuno F.; Hayashi A.; Tadanaga K.; Tatsumisago M. High Lithium Ion Conducting Glass-Ceramics in the System Li2S-P2S5. Solid State Ion. 2006, 177 (26–32), 2721–2725. 10.1016/j.ssi.2006.04.017. [DOI] [Google Scholar]
- Dietrich C.; Weber D. A.; Culver S.; Senyshyn A.; Sedlmaier S. J.; Indris S.; Janek J.; Zeier W. G. Synthesis, Structural Characterization, and Lithium Ion Conductivity of the Lithium Thiophosphate Li2P2S6. Inorg. Chem. 2017, 56 (11), 6681–6687. 10.1021/acs.inorgchem.7b00751. [DOI] [PubMed] [Google Scholar]
- Mercier R.; Malugani J. P.; Fahys B.; Douglande J.; Robert G. Synthese, Structure Cristalline et Analyse Vibrationnelle de l’hexathiohypodiphosphate de Lithium Li4P2S6. J. Solid State Chem. 1982, 43 (2), 151–162. 10.1016/0022-4596(82)90224-9. [DOI] [Google Scholar]
- Dietrich C.; Sadowski M.; Sicolo S.; Weber D. A.; Sedlmaier S. J.; Weldert K. S.; Indris S.; Albe K.; Janek J.; Zeier W. G. Local Structural Investigations, Defect Formation, and Ionic Conductivity of the Lithium Ionic Conductor Li4P2S6. Chem. Mater. 2016, 28 (23), 8764–8773. 10.1021/acs.chemmater.6b04175. [DOI] [Google Scholar]
- Neuberger S.; Culver S. P.; Eckert H.; Zeier W. G.; Schmedt auf der Gunne J. Refinement of the Crystal Structure of Li4P2S6 Using NMR Crystallography. Dalton Trans. 2018, 47 (33), 11691–11695. 10.1039/C8DT02619J. [DOI] [PubMed] [Google Scholar]
- Yamane H.; Shibata M.; Shimane Y.; Junke T.; Seino Y.; Adams S.; Minami K.; Hayashi A.; Tatsumisago M. Crystal Structure of a Superionic Conductor, Li7P3S11. Solid State Ion. 2007, 178 (15), 1163–1167. 10.1016/j.ssi.2007.05.020. [DOI] [Google Scholar]
- Minami K.; Hayashi A.; Tatsumisago M. Preparation and Characterization of Superionic Conducting Li7P3S11 Crystal from Glassy Liquids. J. Ceram. Soc. Japan 2010, 118 (1376), 305–308. 10.2109/jcersj2.118.305. [DOI] [Google Scholar]
- Minami K.; Hayashi A.; Tatsumisago M. Crystallization Process for Superionic Li7P3S11 Glass-Ceramic Electrolytes. J. Am. Ceram. Soc. 2011, 94 (6), 1779–1783. 10.1111/j.1551-2916.2010.04335.x. [DOI] [Google Scholar]
- Seino Y.; Ota T.; Takada K.; Hayashi A.; Tatsumisago M. A Sulphide Lithium Super Ion Conductor Is Superior to Liquid Ion Conductors for Use in Rechargeable Batteries. Energy Environ. Sci. 2014, 7 (2), 627–631. 10.1039/C3EE41655K. [DOI] [Google Scholar]
- Chu I.-H.; Nguyen H.; Hy S.; Lin Y.-C.; Wang Z.; Xu Z.; Deng Z.; Meng Y. S.; Ong S. P. Insights into the Performance Limits of the Li7P3S11 Superionic Conductor: A Combined First-Principles and Experimental Study. ACS Appl. Mater. Interfaces 2016, 8 (12), 7843–7853. 10.1021/acsami.6b00833. [DOI] [PubMed] [Google Scholar]
- Busche M. R.; Weber D. A.; Schneider Y.; Dietrich C.; Wenzel S.; Leichtweiss T.; Schröder D.; Zhang W.; Weigand H.; Walter D.; Sedlmaier S. J.; Houtarde D.; Nazar L. F.; Janek J. In Situ Monitoring of Fast Li-Ion Conductor Li7P3S11 Crystallization Inside a Hot-Press Setup. Chem. Mater. 2016, 28 (17), 6152–6165. 10.1021/acs.chemmater.6b02163. [DOI] [Google Scholar]
- Wenzel S.; Weber D. A.; Leichtweiss T.; Busche M. R.; Sann J.; Janek J. Interphase Formation and Degradation of Charge Transfer Kinetics between a Lithium Metal Anode and Highly Crystalline Li7P3S11 Solid Electrolyte. Solid State Ionics 2016, 286, 24–33. 10.1016/j.ssi.2015.11.034. [DOI] [Google Scholar]
- Dietrich C.; Weber D. A.; Sedlmaier S. J.; Indris S.; Culver S. P.; Walter D.; Janek J.; Zeier W. G. Lithium Ion Conductivity in Li2S-P2S5 Glasses - Building Units and Local Structure Evolution During the Crystallization of Superionic Conductors Li3PS4, Li7P3S11 and Li4P2S. J. Mater. Chem. A 2017, 5 (34), 18111–18119. 10.1039/C7TA06067J. [DOI] [Google Scholar]
- Gamo H.; Nagai A.; Matsuda A. The Effect of Solvent on Reactivity of the Li2S-P2S5 System in Liquid-Phase Synthesis of Li7P3S11 Solid Electrolyte. Sci. Rep. 2021, 11 (1), 21097. 10.1038/s41598-021-00662-3. [DOI] [PMC free article] [PubMed] [Google Scholar]
- Mercier R.; Malugani J.-P.; Fahys B.; Robert G.; Douglade J. Structure du T6trathiophosphate de Lithium. Acta Crystallogr., Sect. B: Struct. Crystallogr. Cryst. Chem. 1982, 38, 1887–1890. 10.1107/S0567740882007535. [DOI] [Google Scholar]
- Tachez M.; Malugani J.-P.; Mercier R.; Robert G. Ionic Conductivity of and Phase Transition in Lithium Thiophosphate Li3PS4. Solid State Ion. 1984, 14 (3), 181–185. 10.1016/0167-2738(84)90097-3. [DOI] [Google Scholar]
- Hayashi A.; Hama S.; Morimoto H.; Tatsumisago M.; Minami T. Preparation of Li2S-P2S5 Amorphous Solid Electrolytes by Mechanical Milling. J. Am. Ceram. Soc. 2001, 84 (2), 477–479. 10.1111/j.1151-2916.2001.tb00685.x. [DOI] [Google Scholar]
- Murayama M.; Sonoyama N.; Yamada A.; Kanno R. Material Design of New Lithium Ionic Conductor, Thio-LISICON, in the Li2S-P2S5 System. Solid State Ionics 2004, 170 (3), 173–180. 10.1016/j.ssi.2004.02.025. [DOI] [Google Scholar]
- Homma K.; Yonemura M.; Nagao M.; Hirayama M.; Kanno R. Crystal Structure of High-Temperature Phase of Lithium Ionic Conductor, Li3PS4. J. Phys. Soc. Jpn. 2010, 79, 90–93. 10.1143/JPSJS.79SA.90. [DOI] [Google Scholar]
- Homma K.; Yonemura M.; Kobayashi T.; Nagao M.; Hirayama M.; Kanno R. Crystal Structure and Phase Transitions of the Lithium Ionic Conductor Li3PS4. Solid State Ion. 2011, 182 (1), 53–58. 10.1016/j.ssi.2010.10.001. [DOI] [Google Scholar]
- Liu Z.; Fu W.; Payzant E. A.; Yu X.; Wu Z.; Dudney N. J.; Kiggans J.; Hong K.; Rondinone A. J.; Liang C. Anomalous High Ionic Conductivity of Nanoporous β-Li3PS4. J. Am. Chem. Soc. 2013, 135 (3), 975–978. 10.1021/ja3110895. [DOI] [PubMed] [Google Scholar]
- Self E. C.; Hood Z. D.; Brahmbhatt T.; Delnick F. M.; Meyer H. M.; Yang G.; Rupp J. L. M.; Nanda J. Solvent-Mediated Synthesis of Amorphous Li3PS4/Polyethylene Oxide Composite Solid Electrolytes with High Li+ Conductivity. Chem. Mater. 2020, 32 (20), 8789–8797. 10.1021/acs.chemmater.0c01990. [DOI] [Google Scholar]
- Kudu Ö. U.; Famprikis T.; Cretu S.; Porcheron B.; Salager E.; Demortiere A.; Courty M.; Viallet V.; Mercier T. L.; Fleutot B.; Braida M.-D.; Masquelier C. Structural Details in Li3PS4: Variety in Thiophosphate Building Blocks and Correlation to Ion Transport. Energy Storage Mater. 2022, 44, 168–179. 10.1016/j.ensm.2021.10.021. [DOI] [Google Scholar]
- Kong S. T.; Gün Ö.; Koch B.; Deiseroth H. J.; Eckert H.; Reiner C. Structural Characterisation of the Li Argyrodites Li7PS6 and Li7PSe6 and Their Solid Solutions: Quantification of Site Preferences by MAS-NMR Spectroscopy. Chem. Eur. J. 2010, 16 (17), 5138–5147. 10.1002/chem.200903023. [DOI] [PubMed] [Google Scholar]
- Gobet M.; Greenbaum S.; Sahu G.; Liang C. Structural Evolution and Li Dynamics in Nanophase Li3PS4 by Solid-State and Pulsed-Field Gradient NMR. Chem. Mater. 2014, 26 (11), 3558–3564. 10.1021/cm5012058. [DOI] [Google Scholar]
- Self E. C.; Chien P.-H.; O’Donnell L. F.; Morales D.; Liu J.; Brahmbhatt T.; Greenbaum S.; Nanda J. Investigation of Glass-Ceramic Lithium Thiophosphate Solid Electrolytes Using NMR and Neutron Scattering. Mater. Today Phys. 2021, 21, 100478. 10.1016/j.mtphys.2021.100478. [DOI] [PMC free article] [PubMed] [Google Scholar]
- Deng Z.; Zhu Z.; Chu I.-H.; Ong S. P. Data-Driven First-Principles Methods for the Study and Design of Alkali Superionic Conductors. Chem. Mater. 2017, 29 (1), 281–288. 10.1021/acs.chemmater.6b02648. [DOI] [Google Scholar]
- Gao B.; Jalem R.; Ma Y.; Tateyama Y. Li+ Transport Mechanism at the Heterogeneous Cathode/Solid Electrolyte Interface in an All-Solid-State Battery via the First-Principles Structure Prediction Scheme. Chem. Mater. 2020, 32 (1), 85–96. 10.1021/acs.chemmater.9b02311. [DOI] [Google Scholar]
- Wang C.; Aoyagi K.; Wisesa P.; Mueller T. Lithium Ion Conduction in Cathode Coating Materials from On-the-Fly Machine Learning. Chem. Mater. 2020, 32 (9), 3741–3752. 10.1021/acs.chemmater.9b04663. [DOI] [Google Scholar]
- Smith J. G.; Siegel D. J. Low-Temperature Paddlewheel Effect in Glassy Solid Electrolytes. Nat. Commun. 2020, 11 (1), 1483. 10.1038/s41467-020-15245-5. [DOI] [PMC free article] [PubMed] [Google Scholar]
- Garcia-Mendez R.; Smith J. G.; Neuefeind J. C.; Siegel D. J.; Sakamoto J. Correlating Macro and Atomic Structure with Elastic Properties and Ionic Transport of Glassy Li2S-P2S5 (LPS) Solid Electrolyte for Solid-State Li Metal Batteries. Adv. Energy Mater. 2020, 10 (19), 2000335. 10.1002/aenm.202000335. [DOI] [Google Scholar]
- Lundén A. Enhancement of Cation Mobility in Some Sulphate Phases Due to a Paddle-Wheel Mechanism. Solid State Ion. 1988, 28–30, 163–167. 10.1016/S0167-2738(88)80026-2. [DOI] [Google Scholar]
- Zhang Z.; Li H.; Kaup K.; Zhou L.; Roy P.-N.; Nazar L. F. Targeting Superionic Conductivity by Turning on Anion Rotation at Room Temperature in Fast Ion Conductors. Matter 2020, 2 (6), 1667–1684. 10.1016/j.matt.2020.04.027. [DOI] [Google Scholar]
- Kudu Ö. U.; Famprikis T.; Fleutot B.; Braida M.-D.; Le Mercier T.; Islam M. S.; Masquelier C. A Review of Structural Properties and Synthesis Methods of Solid Electrolyte Materials in the Li2S - P2S5 Binary System. J. Power Sources 2018, 407, 31–43. 10.1016/j.jpowsour.2018.10.037. [DOI] [Google Scholar]
- Berbano S. S.; Mirsaneh M.; Lanagan M. T.; Randall C. A. Lithium Thiophosphate Glasses and Glass-Ceramics as Solid Electrolytes: Processing, Microstructure, and Properties. Int. J. Appl. Glass Sci. 2013, 4 (4), 414–425. 10.1111/ijag.12037. [DOI] [Google Scholar]
- Park K. H.; Bai Q.; Kim D. H.; Oh D. Y.; Zhu Y.; Mo Y.; Jung Y. S. Design Strategies, Practical Considerations, and New Solution Processes of Sulfide Solid Electrolytes for All-Solid-State Batteries. Adv. Energy Mater. 2018, 8 (18), 1800035. 10.1002/aenm.201800035. [DOI] [Google Scholar]
- Hood Z. D.; Kates C.; Kirkham M.; Adhikari S.; Liang C.; Holzwarth N. A. W. Structural and Electrolyte Properties of Li4P2S6. Solid State Ion. 2016, 284, 61–70. 10.1016/j.ssi.2015.10.015. [DOI] [Google Scholar]
- Rush L. E.; Holzwarth N. A. W. First Principles Investigation of the Structural and Electrochemical Properties of Na4P2S6 and Li4P2S6. Solid State Ion. 2016, 286, 45–50. 10.1016/j.ssi.2015.12.015. [DOI] [Google Scholar]
- Sadowski M.; Sicolo S.; Albe K. Defect Thermodynamics and Interfacial Instability of Crystalline Li4P2S6. Solid State Ionics 2018, 319, 53–60. 10.1016/j.ssi.2018.01.047. [DOI] [Google Scholar]
- Lepley N. D.; Holzwarth N. A. W. Computer Modeling of Crystalline Electrolytes - Lithium Thiophosphates and Phosphates. ECS Trans. 2011, 35 (14), 39. 10.1149/1.3644902. [DOI] [Google Scholar]
- Lepley N. D.; Holzwarth N. A. W. Computer Modeling of Crystalline Electrolytes: Lithium Thiophosphates and Phosphates. J. Electrochem. Soc. 2012, 159 (5), A538. 10.1149/2.jes113225. [DOI] [Google Scholar]
- Onodera Y.; Mori K.; Otomo T.; Sugiyama M.; Fukunaga T. Structural Evidence for High Ionic Conductivity of Li7P3S11 Metastable Crystal. J. Phys. Soc. Jpn. 2012, 81 (4), 044802. 10.1143/JPSJ.81.044802. [DOI] [Google Scholar]
- Chang D.; Oh K.; Kim S. J.; Kang K. Super-Ionic Conduction in Solid-State Li7P3S11-Type Sulfide Electrolytes. Chem. Mater. 2018, 30 (24), 8764–8770. 10.1021/acs.chemmater.8b03000. [DOI] [Google Scholar]
- Wang Y.; Richards W. D.; Ong S. P.; Miara L. J.; Kim J. C.; Mo Y.; Ceder G. Design Principles for Solid-State Lithium Superionic Conductors. Nat. Mater. 2015, 14 (10), 1026–1031. 10.1038/nmat4369. [DOI] [PubMed] [Google Scholar]
- Qi J.; Banerjee S.; Zuo Y.; Chen C.; Zhu Z.; Holekevi Chandrappa M. L.; Li X.; Ong S. P. Bridging the Gap between Simulated and Experimental Ionic Conductivities in Lithium Superionic Conductors. Mater. Today Phys. 2021, 21, 100463. 10.1016/j.mtphys.2021.100463. [DOI] [Google Scholar]
- Kim J.-S.; Jung W. D.; Son J.-W.; Lee J.-H.; Kim B.-K.; Chung K.-Y.; Jung H.-G.; Kim H. Atomistic Assessments of Lithium-Ion Conduction Behavior in Glass-Ceramic Lithium Thiophosphates. ACS Appl. Mater. Interfaces 2019, 11 (1), 13–18. 10.1021/acsami.8b17524. [DOI] [PubMed] [Google Scholar]
- Holzwarth N. A. W.; Lepley N. D.; Du Y. A. Computer Modeling of Lithium Phosphate and Thiophosphate Electrolyte Materials. J. Power Sources 2011, 196 (16), 6870–6876. 10.1016/j.jpowsour.2010.08.042. [DOI] [Google Scholar]
- Yang J.; Tse J. S. First-Principles Molecular Simulations of Li Diffusion in Solid Electrolytes Li3PS4. Comput. Mater. Sci. 2015, 107, 134–138. 10.1016/j.commatsci.2015.05.022. [DOI] [Google Scholar]
- Baba T.; Kawamura Y. Structure and Ionic Conductivity of Li2S-P2S5 Glass Electrolytes Simulated with First-Principles Molecular Dynamics. Front. Energy Res. 2016, 10.3389/fenrg.2016.00022. [DOI] [Google Scholar]
- Phani Dathar G. K.; Balachandran J.; Kent P. R. C.; Rondinone A. J.; Ganesh P. Li-Ion Site Disorder Driven Superionic Conductivity in Solid Electrolytes: A First-Principles Investigation of β-Li3PS4. J. Mater. Chem. A 2017, 5 (3), 1153–1159. 10.1039/C6TA07713G. [DOI] [Google Scholar]
- de Klerk N. J. J.; van der Maas E.; Wagemaker M. Analysis of Diffusion in Solid-State Electrolytes through MD Simulations, Improvement of the Li-Ion Conductivity in β-Li3PS4 as an Example. ACS Appl. Energy Mater. 2018, 1 (7), 3230–3242. 10.1021/acsaem.8b00457. [DOI] [PMC free article] [PubMed] [Google Scholar]
- Ariga S.; Ohkubo T.; Urata S.; Imamura Y.; Taniguchi T. A New Universal Force-Field for the Li2S-P2S5 System. Phys. Chem. Chem. Phys. 2022, 24, 2567. 10.1039/D1CP05393K. [DOI] [PubMed] [Google Scholar]
- Sadowski M.; Albe K. Computational Study of Crystalline and Glassy Lithium Thiophosphates: Structure, Thermodynamic Stability and Transport Properties. J. Power Sources 2020, 478, 229041. 10.1016/j.jpowsour.2020.229041. [DOI] [Google Scholar]
- Mori K.; Ichida T.; Iwase K.; Otomo T.; Kohara S.; Arai H.; Uchimoto Y.; Ogumi Z.; Onodera Y.; Fukunaga T. Visualization of Conduction Pathways in Lithium Superionic Conductors: Li2S-P2S5 Glasses and Li7P3S11 Glass-Ceramic. Chem. Phys. Lett. 2013, 584, 113–118. 10.1016/j.cplett.2013.08.016. [DOI] [Google Scholar]
- Mori K.; Enjuji K.; Murata S.; Shibata K.; Kawakita Y.; Yonemura M.; Onodera Y.; Fukunaga T. Direct Observation of Fast Lithium-Ion Diffusion in a Superionic Conductor: Li7P3S11 Metastable Crystal. Phys. Rev. Appli. 2015, 4 (5), 054008. 10.1103/PhysRevApplied.4.054008. [DOI] [Google Scholar]
- Ohara K.; Mitsui A.; Mori M.; Onodera Y.; Shiotani S.; Koyama Y.; Orikasa Y.; Murakami M.; Shimoda K.; Mori K.; Fukunaga T.; Arai H.; Uchimoto Y.; Ogumi Z. Structural and Electronic Features of Binary Li2S-P2S5 Glasses. Sci. Rep. 2016, 6 (1), 21302. 10.1038/srep21302. [DOI] [PMC free article] [PubMed] [Google Scholar]
- Artrith N.; Urban A.; Ceder G. Constructing First-Principles Phase Diagrams of Amorphous LixSi Using Machine-Learning-Assisted Sampling with an Evolutionary Algorithm. J. Chem. Phys. 2018, 148 (24), 241711. 10.1063/1.5017661. [DOI] [PubMed] [Google Scholar]
- Lacivita V.; Artrith N.; Ceder G. Structural and Compositional Factors That Control the Li-Ion Conductivity in LiPON Electrolytes. Chem. Mater. 2018, 30 (20), 7077–7090. 10.1021/acs.chemmater.8b02812. [DOI] [Google Scholar]
- Artrith N.; Urban A.; Wang Y.; Ceder G.. Atomic-Scale Factors That Control the Rate Capability of Nanostructured Amorphous Si for High-Energy-Density Batteries. arXiv, Condensed Matter, Materials Science, January 26, 2019; 10.48550/arXiv.1901.09272 (accessed 2022-07-11). [DOI] [Google Scholar]
- Park C. W.; Kornbluth M.; Vandermause J.; Wolverton C.; Kozinsky B.; Mailoa J. P. Accurate and Scalable Multi-Element Graph Neural Network Force Field and Molecular Dynamics with Direct Force Architecture. npj Comput. Mater. 2021, 7 (1), 73. 10.1038/s41524-021-00543-3. [DOI] [Google Scholar]
- Kresse G.; Furthmüller J. Efficient Iterative Schemes for Ab Initio Total-Energy Calculations Using a Plane-Wave Basis Set. Phys. Rev. B 1996, 54 (16), 11169–11186. 10.1103/PhysRevB.54.11169. [DOI] [PubMed] [Google Scholar]
- Artrith N.; Urban A. An Implementation of Artificial Neural-Network Potentials for Atomistic Materials Simulations: Performance for TiO2. Comput. Mater. Sci. 2016, 114, 135–150. 10.1016/j.commatsci.2015.11.047. [DOI] [Google Scholar]
- Kresse G.; Joubert D. From Ultrasoft Pseudopotentials to the Projector Augmented-Wave Method. Phys. Rev. B 1999, 59 (3), 1758–1775. 10.1103/PhysRevB.59.1758. [DOI] [Google Scholar]
- Blöchl P. E. Projector Augmented-Wave Method. Phys. Rev. B 1994, 50 (24), 17953–17979. 10.1103/PhysRevB.50.17953. [DOI] [PubMed] [Google Scholar]
- Perdew J. P.; Burke K.; Ernzerhof M. Generalized Gradient Approximation Made Simple. Phys. Rev. Lett. 1996, 77 (18), 3865–3868. 10.1103/PhysRevLett.77.3865. [DOI] [PubMed] [Google Scholar]
- Nosé S. A Unified Formulation of the Constant Temperature Molecular Dynamics Methods. J. Chem. Phys. 1984, 81 (1), 511–519. 10.1063/1.447334. [DOI] [Google Scholar]
- Miksch A. M.; Morawietz T.; Kästner J.; Urban A.; Artrith N. Strategies for the Construction of Machine-Learning Potentials for Accurate and Efficient Atomic-Scale Simulations. Mach. Learn.: Sci. Technol. 2021, 2 (3), 031001. 10.1088/2632-2153/abfd96. [DOI] [Google Scholar]
- Artrith N.; Urban A.; Ceder G. Efficient and Accurate Machine-Learning Interpolation of Atomic Energies in Compositions with Many Species. Phys. Rev. B 2017, 96 (1), 014112. 10.1103/PhysRevB.96.014112. [DOI] [Google Scholar]
- Behler J.; Parrinello M. Generalized Neural-Network Representation of High-Dimensional Potential-Energy Surfaces. Phys. Rev. Lett. 2007, 98 (14), 146401. 10.1103/PhysRevLett.98.146401. [DOI] [PubMed] [Google Scholar]
- Cooper A. M.; Kästner J.; Urban A.; Artrith N. Efficient Training of ANN Potentials by Including Atomic Forces via Taylor Expansion and Application to Water and a Transition-Metal Oxide. Npj Comput. Mater. 2020, 6 (1), 54. 10.1038/s41524-020-0323-8. [DOI] [Google Scholar]
- Byrd R. H.; Lu P.; Nocedal J.; Zhu C. A Limited Memory Algorithm for Bound Constrained Optimization. SIAM J. Sci. Comput. 1995, 16 (5), 1190–1208. 10.1137/0916069. [DOI] [Google Scholar]
- Pedregosa F.; Varoquaux G.; Gramfort A.; Michel V.; Thirion B.; Grisel O.; Blondel M.; Prettenhofer P.; Weiss R.; Dubourg V.; Vanderplas J.; Passos A.; Cournapeau D.; Brucher M.; Perrot M.; Duchesnay E. Scikit-Learn: Machine Learning in Python. J. Mach. Learn. Res. 2011, 12 (85), 2825–2830. [Google Scholar]
- Ong S. P.; Richards W. D.; Jain A.; Hautier G.; Kocher M.; Cholia S.; Gunter D.; Chevrier V. L.; Persson K. A.; Ceder G. Python Materials Genomics (Pymatgen): A Robust, Open-Source Python Library for Materials Analysis. Comput. Mater. Sci. 2013, 68, 314–319. 10.1016/j.commatsci.2012.10.028. [DOI] [Google Scholar]
- Hellenbrandt M. The Inorganic Crystal Structure Database (ICSD)—Present and Future. Crystallogr. Rev. 2004, 10 (1), 17–22. 10.1080/08893110410001664882. [DOI] [Google Scholar]
- Jain A.; Ong S. P.; Hautier G.; Chen W.; Richards W. D.; Dacek S.; Cholia S.; Gunter D.; Skinner D.; Ceder G.; Persson K. A. Commentary: The Materials Project: A Materials Genome Approach to Accelerating Materials Innovation. APL Mater. 2013, 1 (1), 011002. 10.1063/1.4812323. [DOI] [Google Scholar]
- Sun W.; Dacek S. T.; Ong S. P.; Hautier G.; Jain A.; Richards W. D.; Gamst A. C.; Persson K. A.; Ceder G. The Thermodynamic Scale of Inorganic Crystalline Metastability. Science Advances 2016, 2 (11), e1600225 10.1126/sciadv.1600225. [DOI] [PMC free article] [PubMed] [Google Scholar]
- Aykol M.; Dwaraknath S. S.; Sun W.; Persson K. A. Thermodynamic Limit for Synthesis of Metastable Inorganic Materials. Science Advances 2018, 4 (4), eaaq0148 10.1126/sciadv.aaq0148. [DOI] [PMC free article] [PubMed] [Google Scholar]
- Kokalj A. XCrySDen—a New Program for Displaying Crystalline Structures and Electron Densities. Journal of Molecular Graphics and Modelling 1999, 17 (3), 176–179. 10.1016/S1093-3263(99)00028-5. [DOI] [PubMed] [Google Scholar]
Associated Data
This section collects any data citations, data availability statements, or supplementary materials included in this article.


