

SUMMARY
A large number of sequence variants have been linked to complex human traits and diseases1, but deciphering their biological functions is still challenging since most of them reside in the noncoding DNA. To fill this gap, we have systematically assessed the binding of 270 human transcription factors (TF) to 95,886 noncoding variants in the human genome using an ultra-high-throughput multiplex protein-DNA binding assay, termed SNP evaluation by Systematic Evolution of Ligands by EXponential enrichment (SNP-SELEX). The resulting 828 million measurements of TF-DNA interactions enable estimation of the relative affinity of these TFs to each variant in vitro and allow for evaluation of the current methods to predict the impact of noncoding variants on TF binding. We show that the Position Weight Matrices (PWMs) of most TFs lack sufficient predictive power, while the Support Vector Machine (SVM) combined with the gapped k-mer representation show much improved performance, when assessed on results from independent SNP-SELEX experiments involving a new set of 61,020 sequence variants. We report highly predictive models for 94 human TFs and demonstrate their utility in genome-wide association studies (GWAS) and understanding of the molecular pathways involved in diverse human traits and diseases.
GWAS have implicated hundreds of thousands of single nucleotide polymorphisms (SNPs) in human diseases and traits1, but very few of them have been mechanistically characterized. This is in part due to incomplete knowledge of the DNA binding specificity for human TFs2. To systematically characterize the effects of noncoding variants on TF binding to DNA, we adopted an ultra-high-throughput, multiplexed TF-DNA binding assay HT-SELEX3 to examine in vitro binding of human TFs to common sequence variants, using a sampling scheme that surveys candidate cis-regulatory variants near the reported T2D risk loci. Compared to HT-SELEX that employed randomized DNA sequences as input, SNP-SELEX used a library of 40-bp DNA matching the reference human genomic sequence, with the center position corresponding to tested SNPs permutated to all four bases (Fig. 1a; Extended Data Fig. 1a). By the time when this project began, 110 distinct tagging SNPs had been linked to T2D susceptibility. We designed 6,724 DNA oligos to represent these tagging variants as well as the SNPs in linkage disequilibrium (LD) with them (r2≥0.8). We additionally designed oligonucleotides to cover a much larger pool of 89,162 common SNPs in annotated candidate cis-regulatory sequences located within 500 kb of these T2D tagging SNPs (Supplementary Table S1). Thus, the input DNA library contained a total of 383,544 distinct oligonucleotides corresponding to 95,886 SNPs. The sequence features of these genomic fragments closely resembled those of the rest of the human reference genome, especially the fraction containing transcription factor binding sites and DNase I hypersensitive elements (Extended Data Fig. 1b,c).
Figure 1 |. High throughput analysis of the binding of human TFs to common sequence variants by SNP-SELEX.
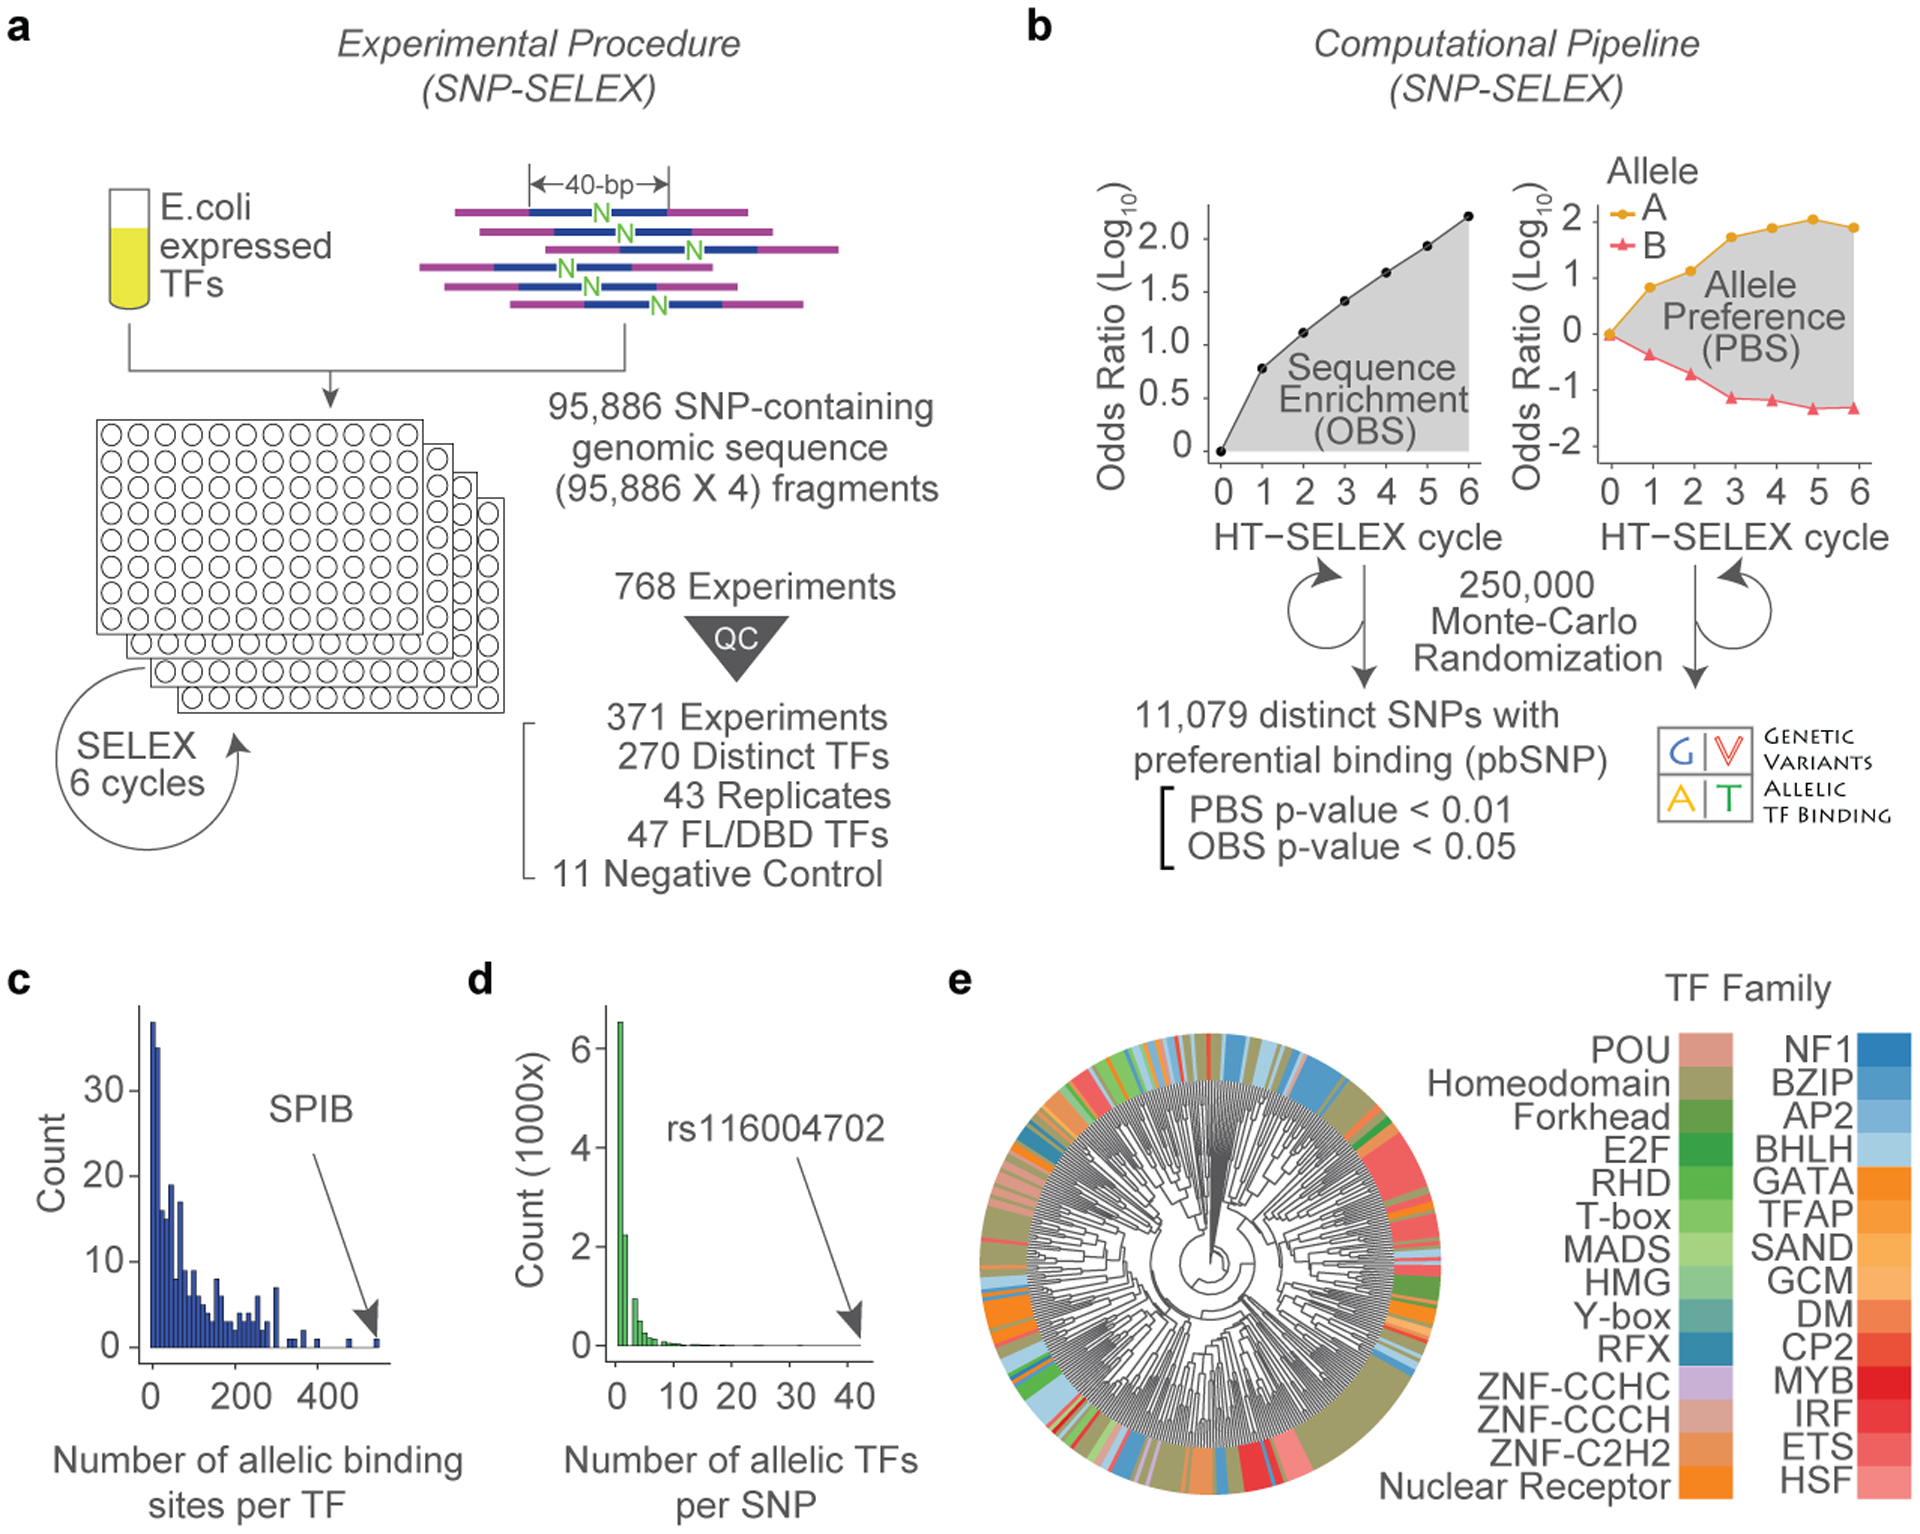
(a) An overview of the SNP-SELEX experimental procedure.
(b) The data obtained from each SELEX cycle was analyzed to determine OBS and PBS. Two alleles of the SNP are shown in different colors and shapes, solid circle for the alternative allele, and solid triangle for the reference allele. Differential binding information for all SNPs tested is publicly available from the GVAT database.
(c-d) Histograms show the number of pbSNPs bound by each TF (c), and the number of TFs showing allelic binding for each pbSNP (d).
(e) A clustering diagram of TFs tested in this study was generated based on the pairwise Pearson correlation of their DNA binding specificity from the SNP-SELEX data. For each pair of experiments, we computed the Pearson Correlation Coefficient (PCC) and dissimilarity (1 - PCC) of PBS between significantly enriched oligos in both experiments and clustered them using the UPGMA algorithm.
The enrichment of each oligonucleotide could be used to estimate the relative affinity between the TF and the DNA (Extended Data Fig. 2a). We conducted a total of 768 SNP-SELEX experiments including 751 recombinant TF proteins and protein-free controls (Supplementary Table S2). Overall, 360 experiments passed in-house quality control and were subject to subsequent analyses (Supplementary File S1). Altogether, we obtained ~828 million successful measurements of TF-DNA interactions.
We first computed the relative enrichment of DNA sequences in the pool as an odds ratio (OR) after each cycle of experiment and then defined the Oligonucleotide Binding Score (OBS) as the cumulative area under the curve (AUC) of enrichment values across the six rounds of SNP-SELEX, which reflects the relative binding affinity of the 40-mer sequence to the TF (Fig. 1b, Extended Data Fig. 2b). This computational strategy could effectively retain information of all SNP-SELEX cycles and control variations among experiments. We estimated the significance of OBS for each pair of oligonucleotides and TF, finding that 89,171 oligonucleotides displayed significant binding to at least one TF (p<0.05 by Monte Carlo randomization, n=25,000; Extended Data Fig. 2c,d). To describe the differential TF binding between the reference and alternative alleles of each SNP, we next defined the Preferential Binding Score (PBS) by computing the difference between OBSs of two alleles to each TF (Fig. 1b, Extended Data Fig. 2e). A total of 11,079 SNPs exhibited significantly differential binding to at least one TF (Monte Carlo randomization p<0.01, n=25,000; Fig. 1b; Supplementary Table S3; Supplementary File S2). We termed them pbSNPs (preferential binding SNP) hereafter. Among the 270 TFs that succeeded in SNP-SELEX, 250 exhibited preferential binding to at least one pbSNP. Overall, each TF bound differentially to a median number of 53 pbSNPs (Fig. 1c), and each pbSNP showed differential binding to one TF on average (Fig. 1d).
Several lines of evidence support the reliability of SNP-SELEX results. First, both OBS and PBS were highly reproducible between independent replicative experiments (Extended Data Fig. 3a-c). Second, PBS and OBS of the full-length TFs matched very well with those of the corresponding DNA-binding domains (DBD), to a similar degree between replicates (Extended Data Fig. 3d,e), as noted previously4. Third, the correlation between different TFs within the same structural family was significantly higher than that between randomly selected pairs of TFs (Wilcoxon-test, p<2×10⁻¹⁶; Extended Data Fig. 3d,e), also noted before4. The majority of TFs from the same family except for C2H2 zinc finger family, tended to share similar pbSNPs, consistent with a previous notion that DBD adequately determined TF’s DNA sequence specificity4 (Fig. 1e). Overall, our results suggest that SNP-SELEX is a cost-effective and highly reproducible platform to analyze differential TF binding to noncoding variants in vitro.
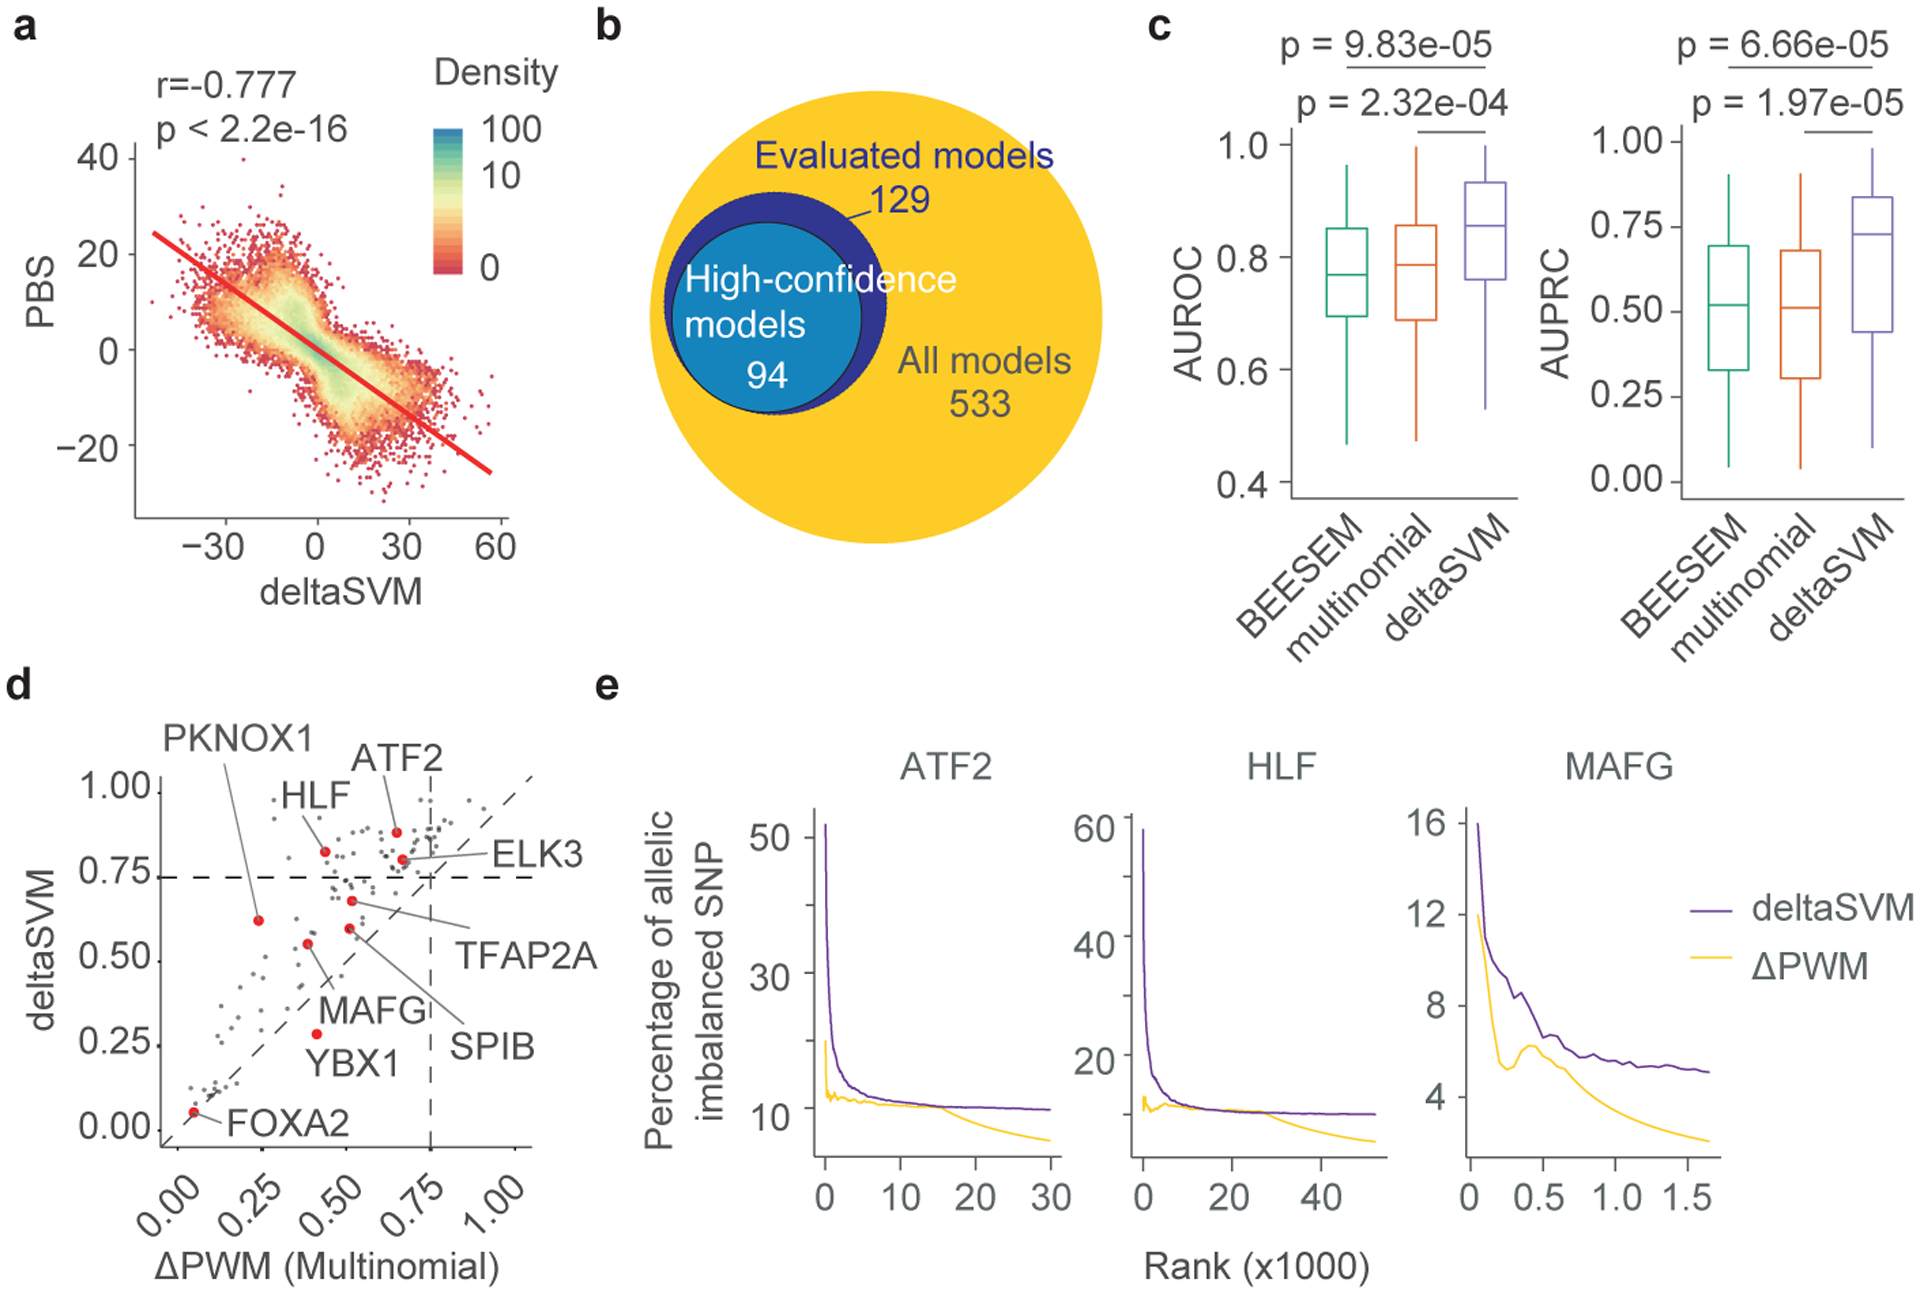
PWMs have been widely utilized to predict the potential TF binding sites in a DNA sequence. However, the performance of PWM in predicting differential binding of a TF to sequence variants has not been systematically evaluated. To address this, we first derived PWMs for TFs using the latest HT-SELEX experimental data involving 40-mer random sequences3. Then we compared PBS of TFs to ΔPWM scores (differential PWM scores between alleles) for 255 TFs out of the 549 TFs characterized to date. These PWMs were originally derived from HT-SELEX using a multinomial algorithm3. To avoid systematic bias caused by the choice of motif-generating algorithm, we also derived independent PWMs from the same set of data but using BEESEM5 algorithm, which relied on binding energy models of protein-DNA interactions. We found that PBS and ΔPWM scores for the 70,402 SNPs with both types of estimation available are moderately correlated (Pearson r=0.534) (Fig. 2a). The ΔPWM-based prediction and SNP-SELEX experimental analysis agreed in more than 80% of cases (339,961 TF-SNP pairs). However, in a substantial fraction of cases (17.85%), ΔPWM predictions did not match SNP-SELEX results (73,876 TF-SNP pairs) (Extended Data Fig. 4a). These discordant cases frequently corresponded to low affinity TF-DNA binding events (Extended Data Fig. 4b). Notably, common genetic diseases are believed to be attributable to a large number of common SNPs with small effect sizes. It is thus crucial to comprehensively characterize these variants. In line with the role of sequence variations at weak binding sites in common diseases, suboptimal TF binding sites have shown particular importance in regulation of developmental genes6.
Figure 2 |. Evaluation of the current PWM models using the SNP-SELEX data.

(a) A scatterplot shows PBS on y-axis and ΔPWM scores on x-axis. The red line denotes a linear regression of PBS as a function of ΔPWM. The Pearson Correlation Coefficient (PCC) and p-values calculated based on two-sided t-test are shown on the upper left corner. The color key for the dot density is shown.
(b) Examples of the Precision-Recall Curve show the variation of performance of different PWM models in predicting pbSNPs.
(c) A scatterplot ranks the predictive performance of 129 PWMs. Note that AUPRC of only 24 TFs exceeded 0.75. TFs shown in (b) were highlighted in red dots.
(d) A scatterplot shows the correlation of allelic biases of DNA binding detected from ChIP-seq experiments in HepG2 cells and those predicted by PBS (blue) and ΔPWM (yellow). The PCC and p-value calculated based on two-sided t-test are shown. The allelic binding ratio is computed as log10 OR over input. In total, 193 TF-SNP pairs involving 147 unique SNPs and six TFs were plotted, including ATF2, FOXA2, HLF, MAFG, YBX1, and FOXA1.
(e) Comparison of PBS and ΔPWM in predicting the impact of SNPs in differential enhancer activity. The SNPs were categorized into five quantiles according to their effect size in affecting TF binding based on PBS (blue) or ΔPWM (yellow) accumulatively. Note that quantile 1 includes the SNPs that display the largest effect size in contributing to differential TF binding.
When ΔPWM predictions of individual TFs were tested against pbSNPs to predict differential TF binding, ΔPWM of many TFs, e.g. IRF3, performed rather poorly (Fig. 2b). Out of the 129 TFs with more than 40 pbSNPs to allow sufficient statistic power for evaluation, ΔPWM based prediction of only 24 TFs achieved a satisfactory performance (the Area Under the Precision-Recall Curve or AUPRC≥0.75) (Fig. 2c). The performance of different PWM models varied dramatically among different TF structural families. For example, PWMs of TFAP family TFs generally had outstanding predictive power, whereas E2F family TFs showed poor performance, despite similar information content of their PWM models (Extended Data Fig. 4c,d).
When ΔPWM predictions differed from the PBSs derived from SNP-SELEX experiments, we found that the latter could more accurately predict the impact of SNPs on TF binding in vivo. First, we examined 12 publicly available or in-house ChIP-seq datasets corresponding to 10 TFs in either HepG2 (hepatocytes) or GM12878 (lymphoblast) cells7 (Supplementary Table S4). Among the 86 pbSNPs, the ratios between allelic ChIP-seq signals in HepG2 were significantly correlated with PBS for that factor (t-test p=5.17×10⁻⁵, Pearson r=0.409) whereas the correlation with ΔPWM was insignificant (t-test p=0.792, Pearson r=0.027; Fig. 2d). The same trend was observed in ChIP-seq from GM12878 cells (Extended Data Fig. 4e). Second, using a high throughput reporter assay STARR-seq8, we examined the enhancer activity of 2,246 pbSNPs and 1,697 non-pbSNPs-containing genomic fragments in HepG2 and human embryonic kidney HEK293T cells (Extended Data Fig. 5a,b; Supplementary Table S5), and found that 424 and 527 pbSNP-harboring genomic fragments showed significant enhancer activity in these two cell types, respectively (Extended Data Fig. 5c; empirical FDR<0.05). Of them, 200 SNPs displayed allelic bias on enhancer activity in HepG2 cells and 206 in HEK293T cells (FDR<0.05), designated as paSNPs for preferentially active SNPs (Supplementary Table S6). We found that pbSNPs were more likely to be associated with allelic enhancer activity than non-pbSNPs (Fisher’s exact test p=0.027, OR=1.57; Extended Data Fig. 5d). Interestingly, the more allelic bias there was for a paSNP, the greater PBS score for the pbSNP (Fig. 2e). In contrast, significantly fewer paSNPs were identified by ΔPWM. SNPs predicted by ΔPWM to be differentially bound by TFs were not associated with the degrees of differential enhancer activities (Fisher’s exact test p=0.465, OR=1.23; Extended Data Fig. 5e). These results strongly suggest that SNP-SELEX results are more reliable than ΔPWM scores in predicting the effects of noncoding variants on TF binding in vivo.
The number of SNPs tested in SNP-SELEX is still finite and far fewer than the number of known noncoding SNPs in human genome9. Aiming to obtain differential DNA binding by TFs to any genetic variants, we employed the deltaSVM10 framework, which used changes in gapped k-mers support-vector machine (gkm-SVM) scores to quantify effects of variants. We derived deltaSVM models for 533 TFs with previously published HT-SELEX data3 (Extended Data Fig. 6a). The deltaSVM scores computed between the reference and alternative allele-containing genomic fragments were highly correlated with PBS values (Fig. 3a), notably better than the correlation between PBS and ΔPWM scores (Fig. 2a). We then used pbSNPs from SNP-SELEX as a gold standard for comparing the performance between deltaSVM and ΔPWM in predicting SNPs’ impact on TF binding. To ensure sufficient statistic power, we only included 129 TFs with 40 or more pbSNPs (Fig. 3b). In five-fold cross validation, deltaSVM substantially outperformed the ΔPWM models developed with either multinomial3 or BEESEM5 algorithms (Extended Data Fig. 6b-d; Supplementary Table S7).
Figure 3 |. DeltaSVM models outperform ΔPWM in predicting differential TF binding to noncoding variants in vitro and in vivo.
(a) A scatterplot shows correlation between PBS and deltaSVM scores. The red line denotes a linear regression of the two scores. The PCC and the p-value calculated based on two-sided t-test are shown. Each dot represents one TF-SNP pair. The color key was shown for the dot density.
(b) Venn diagrams show the number of TFs with differential DNA binding models or experimental data defined by deltaSVM.
(c) Boxplots show the comparison of the performance of deltaSVM, PWM originally derived in HT-SELEX (multi-nominal), or derived with BEESEM algorithm (BEESEM) in predicting pbSNPs of novel SNP-SELEX batch for 87 TFs. Two statistical evaluation methods were used, including AUROC (left) and AUPRC (right). P-values by two-sided Wilcox-test are shown. Horizontal line is median; hinges are 25th and 75th percentile; whiskers are most extreme value no further than 1.5 * IQR.
(d) A scatterplot shows the comparison of performance between deltaSVM (y-axis) and multinomial-generated ΔPWM (x-axis) in predicting pbSNPs identified in the novel batch of SNP-SELEX. The values in both axes are AUPRC.
(e) Elbow plots show that the top-ranked allelic SNPs by deltaSVM models were mostly allelic TF binding SNPs in vivo identified by ChIP-seq in HepG2 cells (purple). For allelic SNPs predicted by ΔPWM, only a very small fraction showed allelic binding in vivo (yellow).
To further evaluate the performance of deltaSVM models against ΔPWM, we conducted an independent set of SNP-SELEX experiments using 61,020 previously uncharacterized SNPs and 487 TFs (Extended Data Fig. 6e; Methods for the SNP selection). We identified additional 21,299 pbSNPs from this novel batch (p<0.01 by Monte Carlo randomization, n=25,000; Supplementary Table S8). When using this new list of pbSNPs as the gold standard, we continued to find that deltaSVM models significantly outperformed both multinomial-derived and BEESEM-derived ΔPWM models (Fig. 3c), with the median value of AUPRC (area under precision-recall curve) for deltaSVM at 0.728, compared to 0.513 and 0.521 for multinomial- and BEESEM-derived ΔPWM models, respectively (Fig. 3c,d, Extended Data Fig. 6f; Supplementary Table S7).
We reasoned that the poor performance of many ΔPWMs was likely because they neglected dinucleotide interdependency in TF-DNA interactions and the influence of flanking DNA sequences11,12. Previous studies have shown that the dinucleotide interdependency exists when some TF dimers are involved4. For example, the bZIP family TF HLF tended to bind DNA as homodimers. The SNP rs79124498 is located within a binding site of HLF, and the PWM predicted that the SNP had little effect on the binding affinity. In contrast, the deltaSVM model and SNP-SELEX result both indicated that ‘G’ allele bound significantly stronger to HLF than ‘T’ allele. This could be caused by the dinucleotide inter-dependence between the position 2 (SNP position), and the position 10 in the binding site. When position 10 is ‘G’ nucleotide instead of ‘A’, HLF prefers ‘G’ to ‘T’ at position 2 (Fisher’s exact test p<2.2×10⁻¹⁶, OR=3.34) (Extended Data Fig. 6g). Unfortunately, such dinucleotide interdependency information is not embedded in regular PWM models.
We also found that ΔPWM performed poorly for SNPs located in low affinity binding sites of TFs (Extended Data Fig. 4b). However, such limitation could be overcome by deltaSVM. When we categorized SNPs into five quantiles based upon their binding affinities as measured by OBS, and assessed the performance of ΔPWM and deltaSVM in predicting their allelic binding by five-fold cross-validation or using the novel batch of SNP-SELEX experimental results (Extended Data Fig. 7), deltaSVM outperformed ΔPWM scores in all quantiles, and the difference was especially large in the lower quantiles where the SNPs were located in weak TF binding sites. The results demonstrate that deltaSVM models built from HT-SELEX datasets are superior to ΔPWM in predicting the impact of SNPs in TF binding.
We subsequently focused on the 94 high-confidence deltaSVM models whose performance exceeded 0.75 in terms of AUPRC for genome-wide prediction and analysis (Fig. 3b; Supplementary File S3). We showed that these deltaSVM models outperformed ΔPWM scores in predicting differential TF binding to SNPs (Extended Data Fig. 8a). Analyzing the allelic TF-DNA binding in HepG2 cells from ChIP-seq datasets, deltaSVM models accounted for twice as many SNPs with allelic DNA binding as ΔPWM (Extended Data Fig. 8b). If we ranked the SNPs based on their deltaSVM scores, the top-ranked SNPs recovered the most allelic imbalanced SNPs identified by ChIP-seq. In contrast, ΔPWM predictions did not show such a trend (Fig. 3e). Similarly, deltaSVM models could explain a significantly higher percentage of allelic DNA-binding for ATF2, PKNOX1, and NR2F1 in GM12878 cells than ΔPWM scores (Extended Data Fig. 8c,d).
If noncoding variants contribute to diseases by affecting TF binding to cis-regulatory sequences of phenotypically responsible genes, the causal SNPs should be enriched for pbSNPs discovered in the current study. Indeed, we found that pbSNPs were highly enriched in the set of candidate causal SNPs reported for T2D from two independent studies13,14 (Fig. 4a; Extended Data Fig. 9a). Importantly, the enrichment of pbSNPs became even stronger given the likelihood of the variants increased. When we performed similar analysis on the same dataset but using SNPs with allelic TF binding predicted by ΔPWM scores, the candidate causal SNPs were no longer enriched (Extended Data Fig. 9b), further revealing the value of pbSNPs in dissecting the molecular mechanisms of disease inheritance.
Figure 4 |. deltaSVM models predict TFs likely involved in complex traits and diseases.
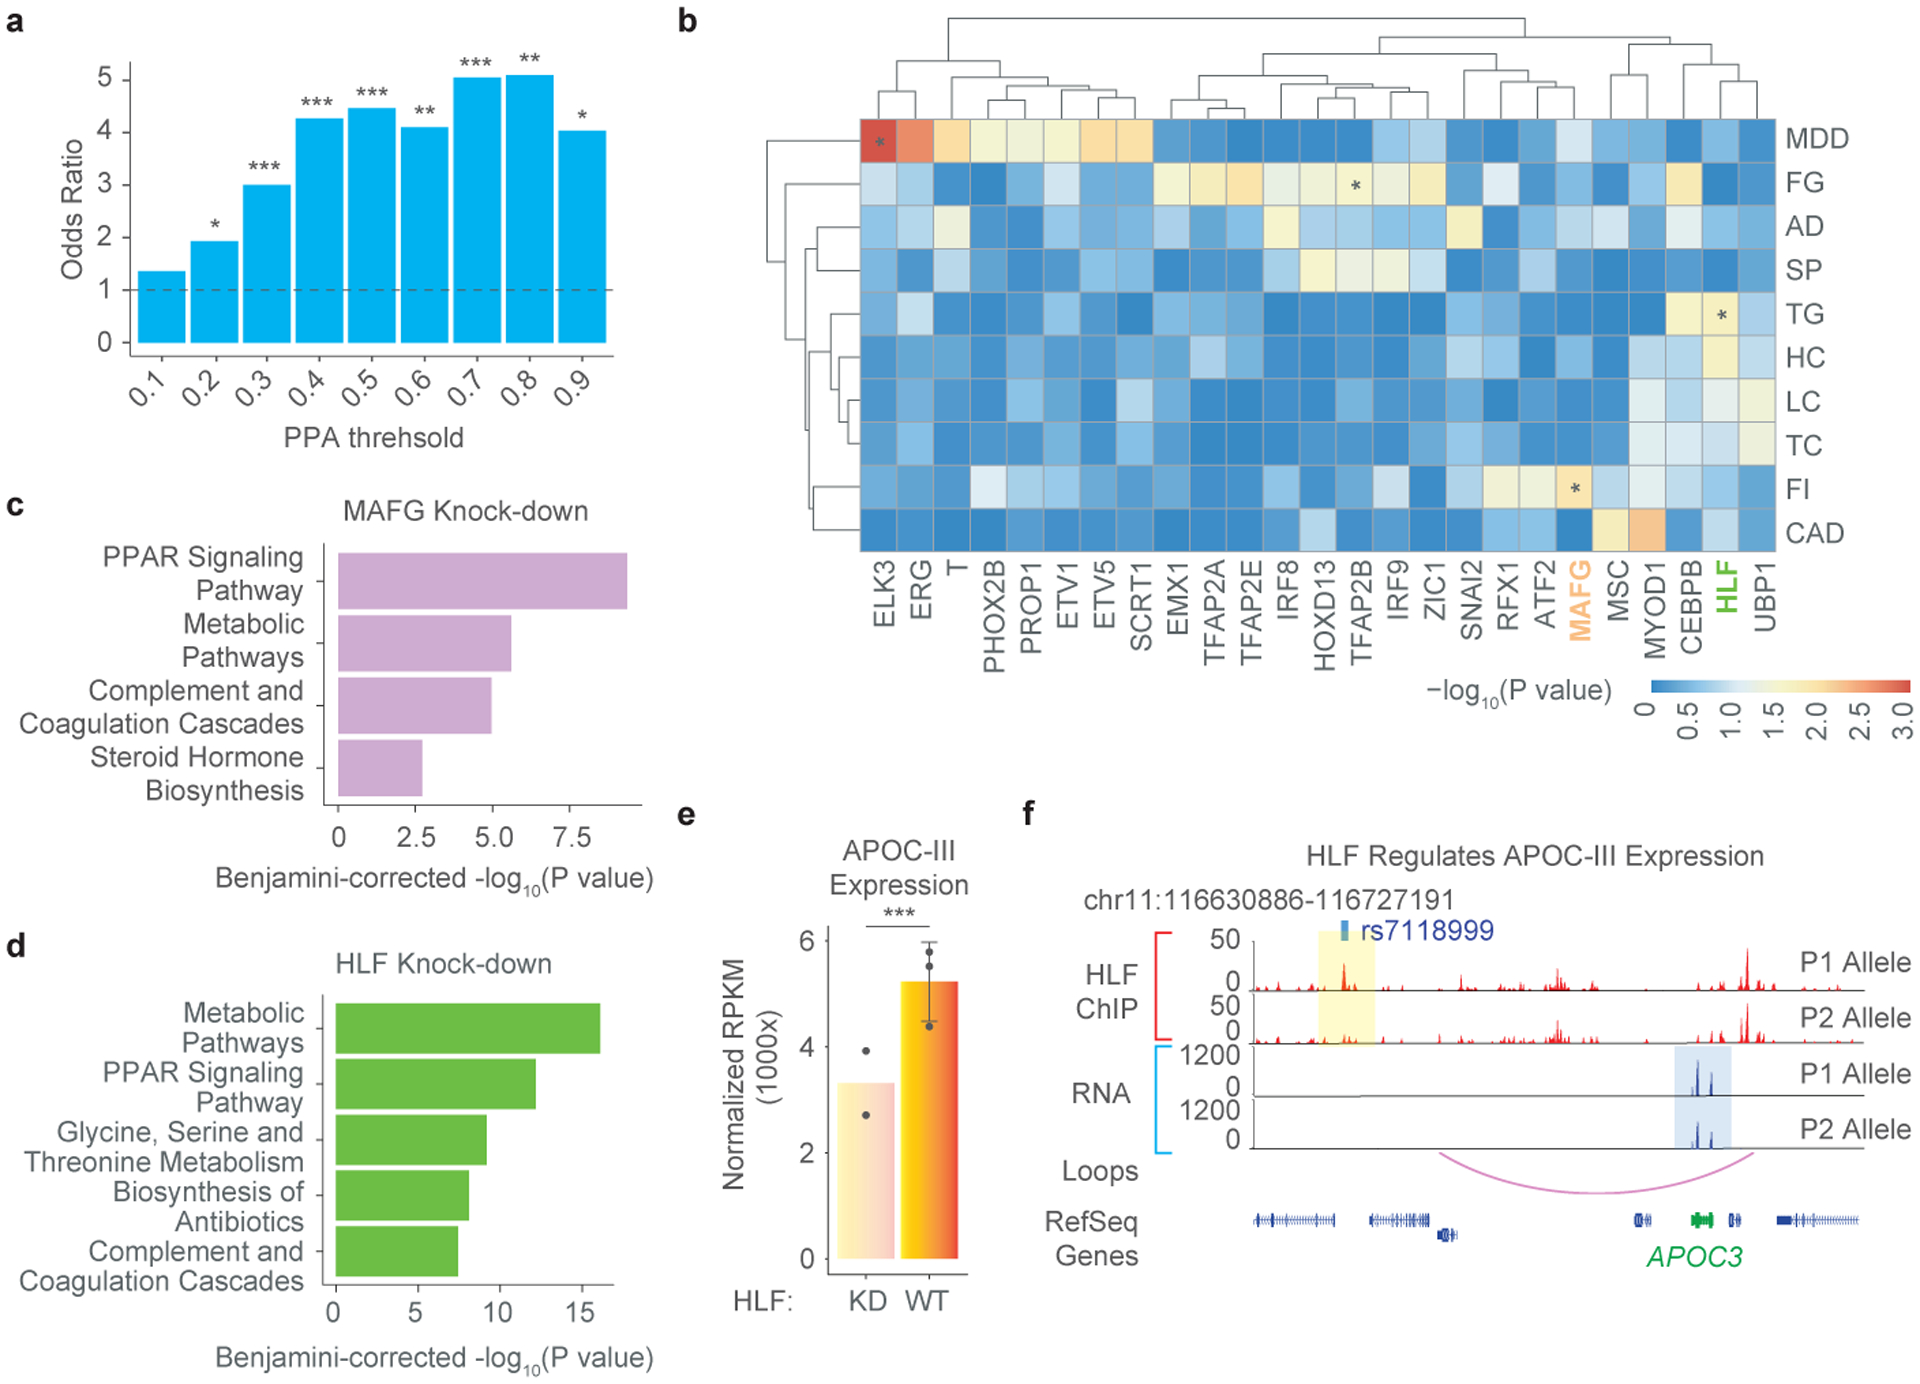
(a) Barplot shows the enrichment of pbSNPs in reported T2D candidate causal SNPs12. The level of association is categorized according to the PPA (Posterior Probability of Association) threshold. P-values for the enrichment by Fisher’s exact test are indicated, * p<0.05, ** p<0.01, and *** p<0.001.
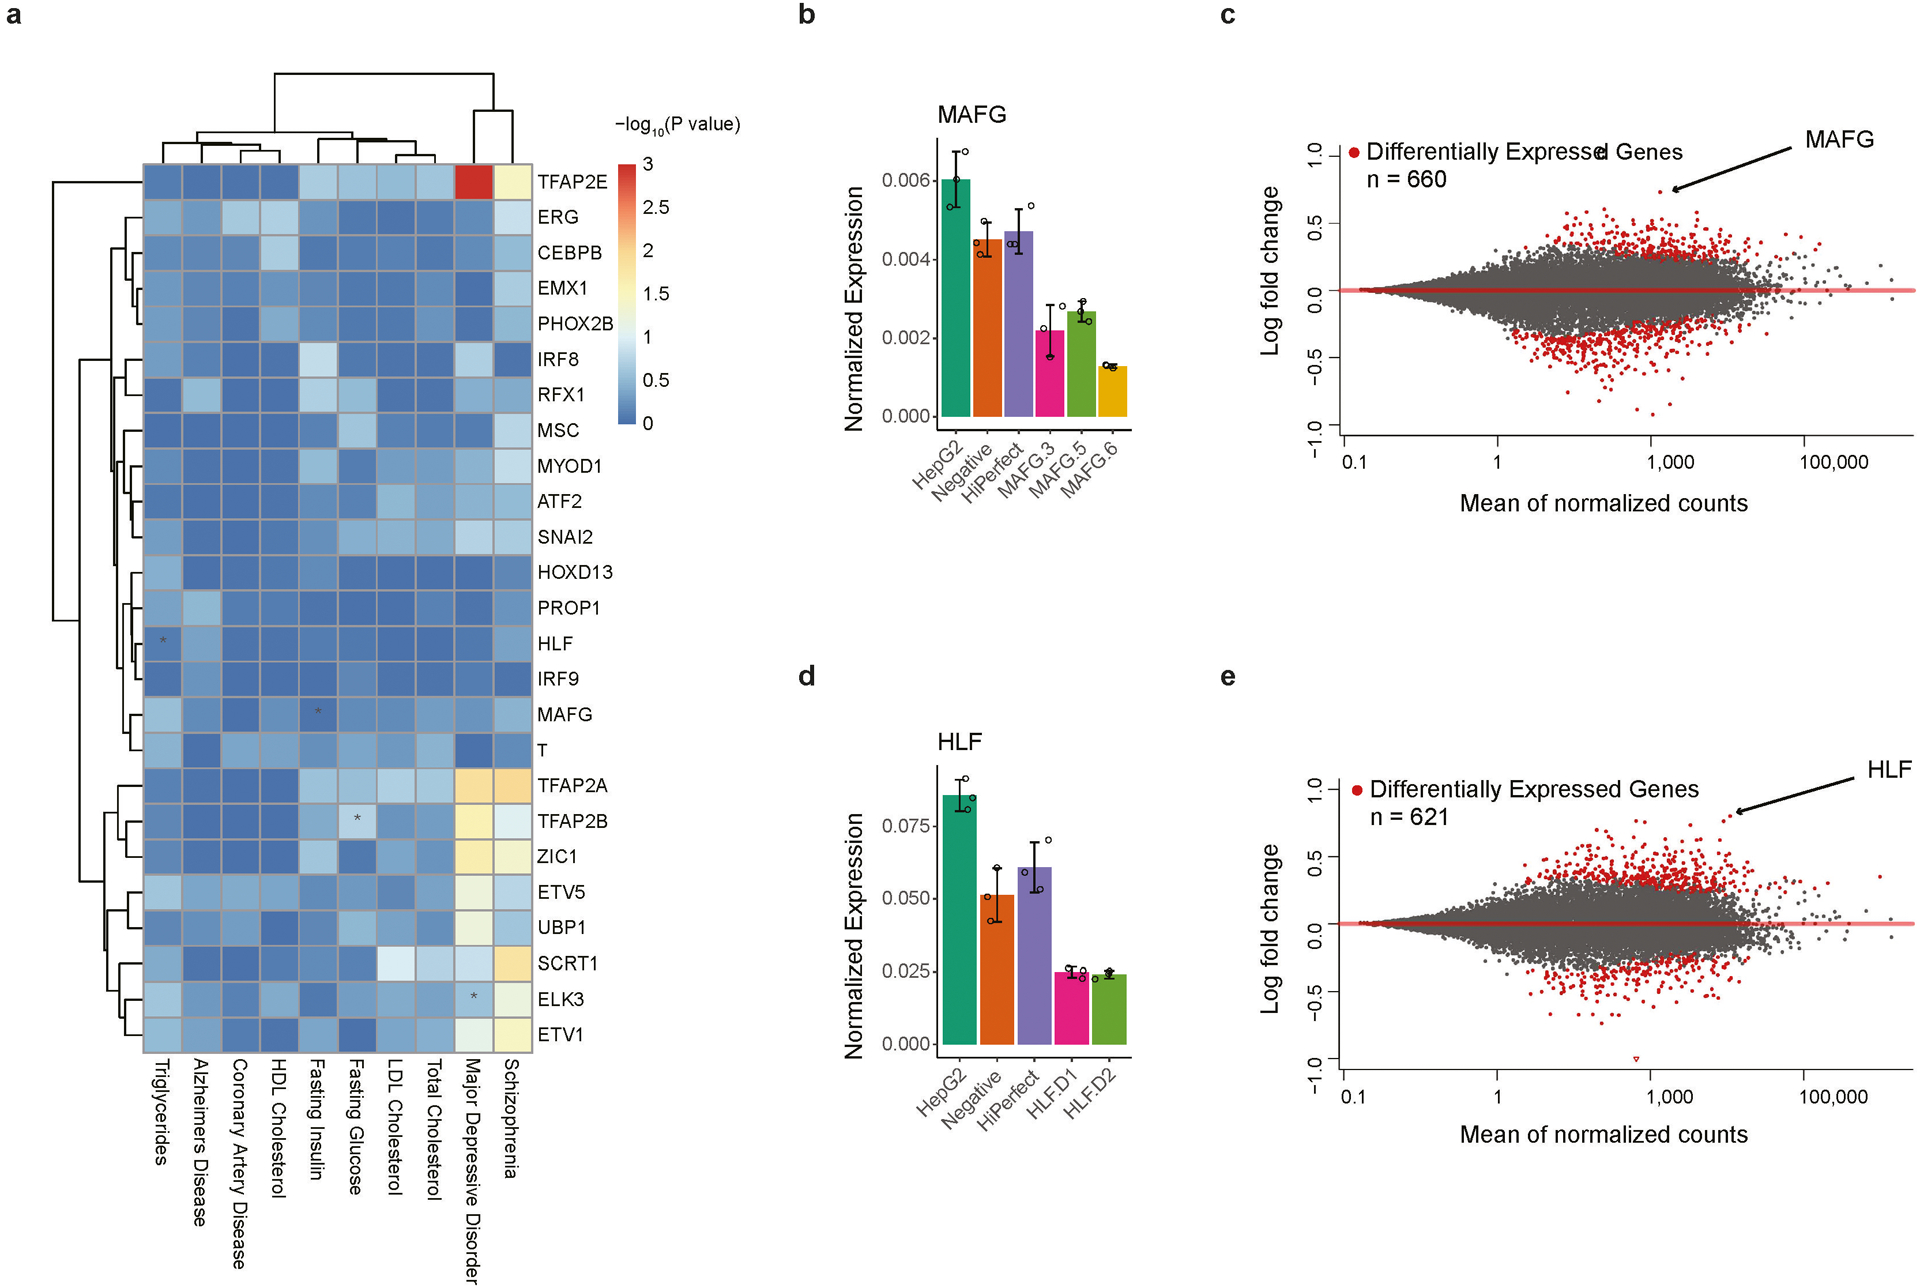
(b) A heatmap shows the significance of enrichment of SNPs with differential binding to TFs among traits- or disease-associated SNPs. Only TFs showing significant enrichment ratios in at least one trait are shown for clarity. The color key is shown for −log10 p-value. TF-trait pairs mentioned in the current study were highlighted with *. The traits analyzed included major depression disorder (MDD), fasting glucose (FG), Alzheimer’s Disease (AD), Schizophrenia (SP), Triglycerides (TG), HDL Cholesterol (HC), LDL Cholesterol (LC), Total Cholesterol (TC), Fasting Insulin (FI), and Coronary Artery Disease (CAD).
(c-d) Barplots show enriched KEGG pathways significantly affected by MAFG (c) and HLF (d) knockdown in HepG2 cells. The BH corrected p-values were shown in y-axis (−log10 p-value).
(e) Barplots show normalized gene expression for APOC-III in HLF KO and WT HepG2 cells. P-value is 6.67e-05 (***) as computed by DESeq2. Expression values are presented as mean values +/− SD.
(f) Genome browser shot shows that differential HLF binding to rs7118999 is linked to allelic gene expression of APOC-III, which is predicted to be targeted by the SNP locus based on a chromatin loop in HepG2 cells (purple curve). The top two tracks (red) showed the binding of HLF by ChIP-seq with two alleles separated by haplotypes. Allelic expression (blue) of nearby genes was shown below. Note that stronger binding of HLF in P1 alleles corresponded to higher expression of APOC-III on the same allele.
One example is SNP rs7578326, located in a locus intensively modified by H3K27ac. The SNP was found to affect binding of a liver-specific TF CEBPB in our analysis (Extended Data Fig. 9c). The region that harbors this SNP is spatially proximal to Insulin Receptor Substrate 1 (IRS1) gene located ~500kb downstream, evidenced by the presence of long-range chromatin interactions in HepG2 cells by Hi-C analysis. To confirm the regulatory role of the underlying SNP-harboring enhancer in HepG2 cells, we introduced CRISPR interference to this locus in HepG2 and HEK293T cells. Upon silencing, significant reduction of IRS1 was observed in HepG2 cells, which expressed a high level of CEBPB protein, but not in HEK293T cells, where the expression of CEBPB was much lower (Extended Data Fig. 9d). An independent study showed that SNP rs7578326 was an expression quantitative trait locus (eQTL) of IRS1 in liver and adipose tissues15 (Extended Data Fig. 9e). The SNP had also been reported to be associated with fasting insulin levels and insulin sensitivity16,17. These data suggest that SNP rs7578326 is likely causal in T2D pathogenesis, through regulation of insulin sensitivity in certain organs18,19.
To further determine whether binding of any specific TFs was disproportionately affected by noncoding variants associated with T2D-related metabolic traits and other human diseases, we used the 94 high-confidence deltaSVM models and performed stratified LD score regression (S-LDSC) to test the enrichment of SNPs affecting TF-binding in the set of variants identified from GWAS of these traits (Supplementary Table S9). As expected, TFs previously known to be associated with some metabolic traits showed strong enrichment among TFs that could be affected by the risk SNPs and those in LD20,21 (Fig. 4b). For example, we found that the binding of TFAP2B, a known regulator of insulin resistance and central adiposity22, was more likely to be disrupted by the set of noncoding variants associated with fasting glucose traits than by chance (p=0.034). Similarly, DNA binding of ELK, whose expression was recently found elevated in the brain of depression patients and in mouse model of depression23, was significantly affected by SNPs associated with the heritability of major depressive disorders (p=3.58e-4). It is important to note that if we performed enrichment analysis merely for the presence of trait-associated SNPs in TF binding sites, we would not be able to recover most of the trait-associating TFs, particularly those known key factors discussed above, demonstrating importance of allelic TF binding information (Extended Data Fig. 10a).
We identified novel candidate TFs associated with additional human traits and diseases. For instance, MAFG was identified to act in regulating fasting insulin levels (Fig. 4b), an indicator of insulin sensitivity16. To validate this prediction, we examined the genes differentially expressed in HepG2 cells following knockdown of MAFG, and found that genes in PPAR signaling pathway were most affected (Fig. 4c; Extended Data Fig. 10b,c). It is well-known that PPAR signaling pathway is key to regulation of the insulin signaling cascade24.
Our analysis also predicted that HLF could be associated with circulating triglycerides level (Fig. 4b). Consistent with this prediction, knockdown of HLF in HepG2 cells resulted in changes of expression in genes significantly involved in metabolic and PPAR signaling pathways (Fig. 4d; Extended Data Fig. 10d,e), important for level of blood triglycerides25. APOC-III is among the most affected genes after HLF knockdown, a gene known to regulate triglyceride-rich lipoprotein metabolism26,27 (Fig. 4e). ChIP-seq experiment further showed that HLF bound to a putative enhancer enclosing SNP rs7118999, located approximately 70-kb upstream of, but was spatially close to, the APOC-III gene promoter (Fig. 4f). Importantly, allelic binding of HLF to the heterozygous rs7118999 was accompanied by allelic expression of APOC-III in HepG2 cells, where stronger binding of HLF was correlated with higher expression of APOC-III in cis (Fig. 4f). These results, put together, suggest that HLF can regulate APOC-III expression and in turn mediates the abundance of triglyceride-rich lipoprotein (VLDL) in blood, which is a major risk factor for coronary artery disease (CAD)27,28. Since APOC-III had already been considered as a target to reduce the risk of CAD in a variety of clinical studies29, our analysis raised the possibility of targeting HLF for therapeutic intervention of CAD.
The current SNP-SELEX study design is still limited to only a small fraction of SNPs in the human genome and is slightly skewed towards T2D-associated risk loci. Future SNP-SELEX experiments will cover a broader range of SNPs, which in turn aid the development of more accurate deltaSVM models. Additionally, with more recombinant TF proteins and combinations of heterodimeric TFs30 for SNP-SELEX experiments, the list of TFs with validated deltaSVM models is expected to grow. We propose that the unique high-throughput approach and resource described here will lead to new insights into the mechanisms of human diseases and uncover new therapeutic targets.
METHODS
I. SNP-SELEX experiments
(1). SNP selection
In total, 110 leading SNPs were selected from previous T2D GWAS31,32. Common SNPs (minor allele frequency>1%) within 500 kb of the 110 leading SNPs were extracted from 1000 Genome Project from all available populations, resulting in 379,895 unique SNPs. From these SNPs, 6,724 SNPs were selected in Linkage Disequilibrium with leading SNPs in East Asian and Caucasian populations (r2≥0.8) from 1000 Genome Project Pilot 133, and 89,162 SNPs were selected based on their distance (≤500 kb) to the accessible chromatin regions in ENCODE DHS sites34 or FANTOME 535 permissive enhancers for all cell and tissue types. Altogether, 95,886 SNPs were included in the current study (Supplementary Table S1).
(2). Experimental procedure
Oligo design was adapted to Illumina TruSeq dual-index system (Extended Data Fig. 1a) and synthesized by CustomArray (Seattle, WA). The oligos were amplified using 20 cycles of PCR and sequenced with Illumina HiSeq 2500 to verify the identities. The cDNAs of TF proteins were cloned to pET20a plasmids3 and expressed using Rosetta (DE3) pLysS strains (amino acid sequence information of the TF proteins could be found in Supplementary Table S2) as previously described4.
The SELEX experiments were performed essentially the same as previously described4. In each SNP-SELEX experiment, this double stranded DNA library was incubated with a recombinant TF protein. The bound DNA molecules were eluted, PCR-amplified, and sequenced, while an aliquot was used as input for the next round of SNP-SELEX experiment. The binding-washing-sequencing cycle was repeated for a total of six times. Because the binding reaction is competitive and the washing steps are long enough, the read counts for each 40-mer sequence can be assumed to be proportional to its binding affinity to the assayed TFs.
Briefly, the E. coli expressed 6xHis-tagged TF proteins were immobilized to Ni-sepharose beads (GE, 17-5318-01) in Promega binding buffer (10mM Tris pH7.5, 50mM NaCl, 1mM MgCl2, 4% glycerol, 0.5mM EDTA, 5μg/ml poly-dIdC). Oligos from input or the previous HT-SELEX cycles were added into the protein beads mixture and incubated at ambient temperature for 30 min. After binding, the beads were consecutively washed for 12 times with the Promega binding buffer. After final wash, TE (10mM Tris pH 8.0, 1mM EDTA) was used to re-suspend the beads and for PCR amplification. The PCR products from each HT-SELEX cycle were purified (Qiagen, 28004) and sequenced with Illumina HiSeq 2500. An aliquot of the PCR products was used for next cycle of SELEX.
(3). SNP-SELEX data analysis
Sequencing data of each SELEX cycle was aligned to the oligo library using BWA36. Several filters were applied to aligned reads after alignments: 1) Reads of low quality, containing ambiguous bases, unaligned to reference and aligned outside of the oligo boundaries were filtered out and experiments with less than 10,000 reads were excluded from further analysis; 2) To control for PCR-duplication bias, the frequency of all PCR bias control (PDC) sequences (256 combinations) of each cycle were compared to the input library (cycle 0) using a linear regression model. PDC whose difference between expected and observed frequency exceeded 30% of the observed values were considered biased and all reads containing the biased PDC were removed.
De novo motif discovery was then conducted using the cycle six reads with Homer toolset37 (Supplementary File S1). Motifs were then compared to JASPAR 2016 non-redundant vertebrates’ motifs38 and SELEX models to examine quality of the experiments3. Only SNP-SELEX experiments whose motif models match either its TF or TF of same structural family4,39 were kept for further analysis (Supplementary Table S2). The frequencies of reads supporting each SNP oligo and its alleles were obtained from the remaining dataset. After quality control, there are 360 experiments pass Quality Control (stated above). In total, we obtained in total 828,455,040 measurement of TF-DNA interactions for 95,886 oligonucleotides with six cycles and four possible nucleotides per oligonucleotides (360 experiments × 95,886 oligonucleotides × 4 possible bases × 6 cycles = 828,455,040 measurements).
Aiming to quantify the TF binding to genomic oligo, oligo binding score (OBS) was defined as area the under the curve (AUC) of the logarithmic odds ratio curve along the HT-SELEX cycles to estimate the relative binding affinity of the 40-mer sequence to the TF (Extended Data Fig. 2b). We first estimated odds ratio of observing oligo at cycle i as ORoligo,cycle i, where Poligo,cycle i is the proportion of oligo at cycle i and ORoligo,cycle i is the odds of observing oligo at cycle i regarding all other oligos (Eq.1). We then compared odds ratios for each oligo at each cycle to cycle 0, namely the input library, to calculate the relative odds ratio at each cycle as LORoligo,cycle i (Eq.2). OBS was then computed as AUC of LORoligo,cycle i over six HT-SELEX cycles (Eq. 3).
| Eq.1 |
| Eq.2 |
| Eq.3 |
Likewise, preferential binding score (PBS) was introduced to quantify allele preferential binding for each SNP as difference of OBS between reference and alternative alleles in terms of logarithmic odds ratio along HT-SELEX cycles to estimate the difference of relative binding affinities between the two alleles to the TF (Extended Data Fig. 2e). We first calculated odds ratios for each allele at each cycle comparing to cycle 0 as LORallele a,cycle i in a similar manner for oligos (Eq. 4 and 5). We then compared two alleles for each SNP to calculate relative logarithmic odds ratio as ΔLORsnp,cycle i (Eq. 6). PBS was then computed as AUC of ΔLORc over six HT-SELEX cycles (Eq. 7).
| Eq.4 |
| Eq.5 |
| Eq.6 |
| Eq.7 |
The statistical significance of both PBS and OBS in each experiment was measured by Monte-Carlo randomization, where the oligo and allele read counts were shuffled within each cycle and the scores were recomputed for 250,000 times. Oligos were considered significantly bound to the TF for OBS p-value < 0.05. Oligos were considered significantly preferentially bound for SNPs for PBS p-value < 0.01 and OBS p-value < 0.05.
(4). Novel batch of SNP-SELEX experiments
To generate a completely independent dataset to benchmark deltaSVMs models, we performed additional novel batch of SNP-SELEX experiments. Variants tested in the novel batch included 32,289 SNPs within known T2D loci (lead variants and variants in LD with r2≥0.6 in EUR and non EUR, and credible variants from fine mapping studies), 58,184 SNPs within islet enhancers (defined using ATAC-Seq and H3K27ac ChIP-Seq data from human islets), and 8,000 negative control SNPs randomly chosen from the genome. The SNP-SELEX experiments were performed exactly as the first batch while only four cycles were used.
The following filters were applied before calculating preferential binding: 1) Each of the 768 experiments were done in replicate. If the replicates did not correlate (r<0.5) with each other (the fraction of reads aligning to each oligo) and did not show motif enrichment, the experiment was excluded; 2) For each experiment, only variants covered by at least 8 read pairs for SNPs, or 4 reads pairs for indels, in all five cycles (0–4) were retained; 3) For each experiment, only variants with at least 2 read pairs in the input for both the reference and alternate alleles and composing 5% of the total reads in the pool were retained; 4) Experiments with less than 25 variants remaining after the above two filtering steps were excluded.
After calculating preferential binding statistics as PBS score and p-values as described in the previous section, results of the two replicates for each experiment were combined using meta-analysis of p-values and average of effect sizes. Further, experimental replicates of the same TF protein were meta-analyzed to obtain a unique value for each TF.
In summary, 1,048,486 TF-SNP pairs including 66,329 SNPs (61,020 SNPs different from the first batch) and 487 TFs were tested. Out of them, there are 23,262 pbSNPs (p-value < 0.01).
II. STARR-seq experiments
(1). Design of oligonucleotides
To directly evaluate the impact of pbSNP on enhancer activities, STARR-seq8 was conducted with the human embryonic kidney cell line (HEK293T) and human hepatocarcinoma cell line (HepG2). In total, we tested 11,961 genomic sequences harboring 2,246 pbSNPs and 1,697 non-pbSNPs from SNPs either located in the human islet ATAC-seq peaks14 or displayed significant OBS scores in SNP-SELEX. In addition, we included 37 true positive controls which are known enhancers and 2,998 negative controls that correspond to random yeast open read frames (ORFs) sequences (Supplementary Table S5).
Oligo design was adapted from the previously published STARR-seq work8 (Extended Data Fig. 5a) and synthesized from Agilent (Santa Clara, CA). Briefly, each oligo contains 190 bp of genomic sequence enclosing the SNP and 20 bp constant flanking sequences (upstream: 5’-ACACGACGCTCTTCCGATCT; downstream: AGATCGGAAGAGCACACGTC-3’) on both ends, which were used for amplification and cloning. The generic PCR primers including Illumina Truseq adapter sequences and different indexes were used to amplify the oligo pool and cloned into the human STARR-seq plasmid (a gift from the Stark lab, Austria). PCR amplification from the plasmids was performed and sequenced for 2×100 paired-end cycles with Illumina HiSeq 4000 sequencer as input control.
(2). Cell culture and transfection
The plasmid pool was transfected into HEK293T or HepG2 cell lines using Fugene HD. The HEK293T cells (ATCC, CRL-3216) and HepG2 (ATCC, HB-8065) cells were cultured under normal condition with 5% CO2 at 37°C. Fugene HD (Promega, E2311) was used for plasmid transfection. Specifically, 2 μg of STARR-seq plasmids were mixed with 5 μl of transfection reagents for transfection into 300,000 cells cultured in a single well of 6-well plate.
(3). mRNA extraction and sequencing
Forty-eight hours post transfection, total RNA was then extracted with RNeasy kit (Qiagen, 74104) and mRNA was enriched with poly(dT)25 Dynabeads (Invitrogen, 61002). First strand cDNA was synthesized using a specific primer (5’-CAAACTCATCAATGTATCTTATCATG) with high High-Capacity cDNA Reverse Transcription kit (ThermoFisher Scientific, 4368814). Nested PCR was used to amplify the SNP specific fragments from cDNA, first using two reporter-specific PCR primers (5’-GGGCCAGCTGTTGGGGTGTCCAC & 5’-CTTATCATGTCTGCTCGAAGC) and then generic primers used in HT-SELEX. DNA was purified with AMPure beads and sequenced for 2×100 paired-end cycles with illumina HiSeq 2500 sequencer. In total, three biological replicates were performed with two technical replicates each for both HepG2 and HEK293T cells.
(4). STARR-seq data analysis
STARR-seq reads were aligned to the oligo libraries using BWA40 with default parameters. Read counts for each oligos were then counted. Counts for technical replicates were merged. Oligos covered by more than 25 reads in the input library (the synthesized oligo pool) and more than five reads in at least three libraries were kept for downstream analysis.
We first identified oligo that were enriched compared to the input library. Enriched oligos were determined by a negative binomial regression from R package edgeR41. Common biological dispersion was estimated using only yeast oligos where no real variation is expected. The resulting p-values were adjusted by Benjamin-Hochberg procedure, and the significance cutoff for enriched oligos was set to limit the rate of enriched yeast oligos to 5%.
We then focused on the SNPs for which at least one allele was significantly enriched, and calculated the difference of log fold-change activity between the two alleles using paired t-test from R package limma42, shrinking the variance with an empirical Bayesian method. The p-values were adjusted by Benjamin-Hochberg procedure and SNPs were considered significant with adjusted p-value < 0.01.
III. in situ Hi-C experiments to predict target genes of non-coding SNPs
The in situ Hi-C was performed according to a previously described protocal43 with slight modifications. Briefly, the HepG2 cells were trypsinized and washed with PBS. The chromatin was cross-linked with 1% formaldehyde (Sigma) at ambient temperature for 10 min and quenched with 125mM glycine for 5 min. PBS washed tissue was homogenized with loose fitting douncer for 30 strokes before centrifugation to isolate the nuclei.
Nuclei were isolated and directly applied for digestion using 4 cutter restriction enzyme MboI (NEB) at 37 °C o/n. The single strand overhang was filled with biotinylated-14-ATP (Life Tech.) using Klenow DNA polymerase (NEB). Different from tradition Hi-C, with in situ protocol the ligation was performed when the nuclear membrane was still intact. DNA was ligated for 4h at 16 °C using T4 ligase (NEB). Protein was degraded by proteinase K (NEB) treatment at 55 °C for 30 min. The crosslinking was reversed with 500 mM of NaCl and heated at 68 °C o/n. DNA was purified and sonicated to 300–700 bp small fragments. Biotinylated DNA was selected with Dynabeads My One T1 Streptavidin beads (Life Tech.). Sequencing library was prepared on beads and intensive wash was performed between different reactions. Libraries were checked with Agilent TapeStation and quantified using Qubit (Life Tech.). Libraries were sequenced with Illumina HiSeq 4000 for 100 cycles of paired-end reads.
Hi-C data was processed as previously described44. Briefly, each end of read pairs were aligned separately using BWA MEM to the hg19 reference genome with default parameters. Chimeric read ends were further processed to keep only the five-prime alignment. Read ends with low mapping quality (mapq<10) were removed, and remaining read ends were paired using custom scripts. PCR duplicates were removed using Picard tool (http://broadinstitute.github.io/picard). Resulting read alignments were stored as bam files using samtools. Aligned reads were further transformed to the juicer format and processed into hic format using juicebox tool45. Chromatin loops were called using HiCCUPS with default parameters.
To assign potential target genes for SNPs, two approaches were taken: 1) SNPs within 2Kb upstream region of a TSS were assigned to the TSS; 2) SNPs overlapping one anchor of chromatin loops (with in 25Kb window) were assigned to the TSS overlapping the other anchor (with in 25Kb window). Similar approaches were used to connect TF binding sites to target genes.
IV. Determination of allele imbalance of TF binding from ChIP-seq data
The ChIP-seq experiment was carried out using an established protocol46. Briefly, the cells were crossed linked with 1% formaldehyde at ambient temperature for 10 min. The reaction was quenched by 125mM glycine for 5 min at room temperature. Cells were washed with PBS and treated with hypotonic buffer (20mM Hepes pH7.9, 10mM KCl, 1mM EDTA, 10% Glycerol and 1mM DTT with additional protease inhibitor (Roche)) to isolate nuclei. The nuclei were suspended with RIPA buffer (10 mM Tris-HCl pH 8.0, 140 mM NaCl, 1 mM EDTA, 1% Triton X-100, 0.1% SDS, 0.1% sodium deoxycholate with protease inhibitor) and sonicated using Covaris S220 Focused-ultrasonicator. Fragmented chromatin was pre-cleared with protein G conjugated sepharose beads (GE).
Antibodies against HLF (Santa Cruz, sc-134359, 5 μg antibody was applied to 1 mL cell lysis per ChIP), MAFG (Santa Cruz, sc-166548 X, 5 μg antibody was applied to 1 mL cell lysis per ChIP), Histone H3K4me1 (Abcam, ab8895, 5 μg antibody was applied to 1 mL cell lysis per ChIP), H3K4me3 (Abcam, ab8580, 5 μg antibody was applied to 1 mL cell lysis per ChIP), H3K27ac (Abcam, ab4729, 5 μg antibody was applied to 1 mL cell lysis per ChIP), and CTCF (Santa Cruz, sc-15914 X, 5 μg antibody was applied to 1 mL cell lysis per ChIP) were used to pull down the respective proteins and their associated chromatin. Washes with different concentration of NaCl were performed. The enriched protein-DNA complexes were reverse crosslinked at 65°C over night with proteinase K (NEB). DNA was purified with Qiagen MinElute kit.
Sequencing library was prepared using an in-house kit, including end-repair, “A” addition and adapter ligation. The library was sequenced with Illumina HiSeq 4000 for 50bp single reads or 100bp pair-end reads.
Reads were aligned using BWA MEM40 with either single-end or pair-end model to the hg19 reference genome. Reads with low mapping quality (mapq<10) were filtered out, and PCR duplicates were removed using Picard tool (http://broadinstitute.github.io/picard/). MACS247 were then used to call peaks and generate signal tracks to view in the genome browser.
In addition to ChIP-seq performed in this study, ChIP-seq for additional TFs were also collected from the ENCODE project (Supplementary Table S4). For allelic analysis, reads were aligned using WASP mapping pipeline to control potential allelic mapping bias48. Specifically, heterozygous SNPs called using WGS data were used for HepG2 cells, and heterozygous SNPs from 1000 genome project were used for GM12878 cells. Allelic read counts for each phased heterozygous SNP within the 300bp window in TF ChIP-seq data and corresponding control data were counted. Specifically, only reads with high mapping quality (mapq>10) and basepairs with high accuracy (base call quality>13) were used. To remove sampling biases, SNPs that are covered by less than 20 reads in either the treatment or the control were filtered out. Odds ratios were then computed for each SNPs comparing allelic counts between the treatment and control to measure allelic imbalance. SNPs were tested for allelic imbalance using binomial test using background ratio derived from control data. SNPs with Benjamin-Hochberg adjusted p-value < 0.05 were considered as allelic imbalanced.
V. Genotyping and haplotype phasing of HepG2 cells
The genomic DNA was extracted using Qiagen kit (cat. no. 69506). The DNA was then fragmented with Covaris S220 ultrasonicator to 300–500 bp long. Sequencing library was then prepared using the same in-house kit as ChIP-seq, including end-repair, “A” addition and adapter ligation. The library was sequenced with Illumina HiSeq 4000 sequenced for 100 bp paired-end reads to achieve an average coverage of 30–40 times of the human genome.
Reads from whole genome sequencing (WGS) were aligned using BWA MEM40 in pair-end model with default parameters. PCR duplicates were removed using Picard tools (http://broadinstitute.github.io/picard). Variants were then called according to the GATK best practice pipeline using GATK 3.6–049–51. Briefly, reads were realigned locally, and base pair qualities were recalibrated. Variants were then called using HaplotypeCaller with default parameters. Variants were then recalibrated based on known gold standard variants. Only variants that passed filters were used in the downstream analysis.
To obtain haplotypes, aligned Hi-C bam files were processed through GATK realignment pipeline the same as WGS data describe above. Two filters were applied to SNPs so that bi-allelic SNPs and heterozygous SNPs with high genotype quality (GQ>20) were kept. WGS and Hi-C data were then parsed to extract informative fragments with extractHAIRs52 using filtered SNPs. The fragments from Hi-C and WGS data were combined, and HAPCUT252 was used to derive haplotypes. Results from HAPCUT2 were then paired with SNPs in 1000 Genome Project Phase 3 data, and Beagle 4.153 was used to impute haplotypes for SNPs that were not phased by HAPCUT2. We obtained chromosome-span haplotypes for all auto chromosomes except for chr22 (Supplementary Table S10). Phasing quality was further examined by computing fraction of homologous trans (h-trans) reads in RNA-seq data from HepG2 cells. Specifically, h-trans reads were read pairs that contain SNPs from both haplotypes. Chromosome-span haplotypes with high accuracy were obtained (Supplementary Table S10).
VI. Differential gene expression analysis
The HepG2 (ATCC) cells were cultured under normal condition with 5% CO2 at 37°C. For siRNA transfection, HiPerfect transfection was used following the manufacture guidance. For each experiment, 50 nM of siRNA was used with 5 ul of HiPerfect reagent to make the transfection complex for 1–3×10⁴ cells. Cells were continued to be cultured for 72 hours. The siRNAs targeting human HLF (cat. #GS3131) and MAFG (cat. #GS4097) were commercially available from Qiagen. Silencer negative control siRNA was commercially manufactured and order from Thermo Fisher (cat. #AM4635).
The total RNA was isolated using Qiagen RNeasy mini kit. The sequencing library was prepared using the Illumina Truseq RNA Library Prep Kit v2 (cat. #RS-122–2001). The library was sequenced using Illumina HiSeq 4000 for 100bp paired-end reads.
Reads were aligned to the hg19 reference genome using STAR 2.4.2a54 with default parameters in pair-end model. Only uniquely aligned reads were kept for further analysis. Cufflinks 2.2.155 was used to compute FPKM for each gene.
For allelic gene expression analysis, reads were aligned to the hg19 reference genome using STAR and WASP48 pipeline to control allelic mapping bias. The same set of SNPs and haplotypes were used for RNA-seq as ChIP-seq as described above in HepG2 cells. Allelic counts for each gene were generated using htseq-count 0.6.056. Genes with at least 10 allelic reads were tested for allelic imbalance using the Binomial test using background ratio derived from whole genome sequencing data. Genes with Benjamin-Hochberg adjusted p-value < 0.1 were considered allelic imbalanced.
For differential gene expression analysis, read counts for each gene were obtained using htseq-count56 using GENCODE human annotation release 24 as reference57. DESeq258 was used to identify differentially expressed genes using default parameters. Genes with Benjamin-Hochberg adjusted p-value < 0.2 were considered as differentially expressed. KEGG pathway enrichment analysis was performed with DAVID59.
VII. Enhancer perturbation using CRISPRi
CRISPR/dCas9 fused with KRAB domain (addgene cat. no. 71236) was introduced to genomic locus enclosing the SNP rs7578326 using sgRNA (targeting sequence TCCGTTGGTGACACAGTTGG) in HepG2 cells. CRISPR/dCas9 with the same sgRNA was used as negative control. Similarly, both plasmids were transfected in HEK293T cells as control. RNA was extracted using Qiagen RNeasy kit and reverse transcribed using High-Capacity cDNA Reverse Transcription Kit (Thermo). Quantitative PCR was performed to measure the expression of IRS1 gene using pre-designed primers (Qiagen QT00074144) and beta actin for internal control (Qiagen QT00095431). Triplicates were carried out for each experiment for the t-test.
VIII. Determination of TF binding preference using PWMs
Using motifs from the previous HT-SELEX study3, the score for reference and alternative genomic oligo sequences was measured for 255 distinct TFs with SNP-SELEX data. In particular, we used the ‘pssm’ function from Biopython60 to obtain Position Specific Scoring Matrices (PSSM) for each motif. PWM score of each sequence was then obtained by computing the maximum motif score of a sliding window over sequence in both forward and reverse strand. For each position, the ‘calculate’ function from Biopython34 was used to calculate PWM scores. PWM scores for two alleles were calculated separately and ΔPWM scores were then computed as the difference of PWM score between reference allele r and alternative allele a.
To assign significance for ΔPWM scores, we used atSNP61 to calculate p-values for each SNP-TF pair. Briefly, atSNP estimates random distribution for each motif and used the random distribution to calculate p-values. The same p-value cutoff (p<0.01) was used to select SNPs with allelic TF binding predicted by ΔPWM scores.
IX. Development of deltaSVM models
(1). Training of deltaSVM models
Fastq files of 533 TFs from a previous HT-SELEX study3 were used to build deltaSVM models. For each TF, each sequence retained after every SELEX cycle was used as positives and the sequences only present in cycle 0 as negatives (Extended Data Fig. 6a). Both positive and negative sequences were randomly down sampled to 20,000 sequences due to computing capacity. The gkm-SVM models were trained using lsgkm62 with two k-mer sizes, using parameters “−l 10 -k 6 -d 3” and “−l 8 -k 5 -d 3” respectively.
We then calculated deltaSVM scores using trained gkm-SVM models as described in Lee et al. (2015)10 using 40bp sequences with SNP at the center for each TF-SNP pair. Briefly, scores for each 10-mers were pre-computed using aforementioned gkm-SVM models via gkmpredict command. Therefore, scores for any SNP-containing 10-mer genomic sequences can be assigned, regardless of the position of the SNP within the 10-mer. When defining “delta”, we calculated the sum of subtractions between two alleles in all 10-mers overlapping the SNP (i.e., [summed SVM scores of all 10-mers containing reference allele] – [summed SVM scores of all 10-mers containing alternative allele]). Specifically, we used deltasvm.pl script from http://www.beerlab.org/deltasvm/. We used 10-mer as the default parameter in deltaSVM without testing additional parameters although it is possible other length of k-mer may lead to even better performance.
For each TF, we trained gkm-SVM models for two parameters and all six SELEX cycles. We then select best models among them for each TF as described below.
(2). Validation of deltaSVM models by cross-validation
To validate deltaSVM models, we performed five-fold cross-validation. Specifically, pbSNPs (p-value < 0.01) and non-pbSNPs (p-value > 0.5) from SNP-SELEX experiments were used as positives and negatives respectively. SNPs were then divided into for five folds equally for each TF while ensuring equal numbers of pbSNPs and non-pbSNPs were within each fold. We then selected best model using four-folds of SNPs based on AUPRC (area under precision recall curve) and then tested performance of the model on the remaining one-fold. The same procedure was performed for each fold. To ensure the quality of data, only TFs with more than 40 pbSNPs were used in testing.
The AUROC and AUPRC for each model were computed using R package PPROC63.
(3). Validation of deltaSVM models in the novel batch SNP-SELEX experiments
To fully avoid over-fitting issues, we performed another novel batch of SNP-SELEX experiments as described in previous sections. For each TF, the best model was selected based on AUPRC calculated on the entire set of pbSNPs and non-pbSNPs in the first batch of SNP-SELEX experiments. The models were then used to calculated deltaSVM scores for each SNP tested in the novel batch SNP-SELEX experiments.
After removing 5,309 SNPs with the first batch, there are 959,367 TF-SNP pairs including 61,020 SNPs and 487 TFs. Among them, there are 21,299 unique pbSNPs (Supplementary Table S8). Among them, only 87 TFs with >40 pbSNPs and for which both PWM models and deltaSVM models are available were included for comparison.
(4). Comparison of PWM models with deltaSVM models
To compare the performance comparison of PWM and deltaSVM models, two methods were used to calculate ΔPWM scores. For multi-nominal models, ΔPWM scores were calculated as described in the previous section for all TF-SNP pairs. For BEESEM5 models, beesem.py from https://github.com/sx-ruan/BEESEM were used to generate PWM models with default parameters. The BEESEM-derived PWM models were then used to calculate ΔPWM scores as described in the previous section. Both PWM models were applied to the same set of SNPs as deltaSVM models to compare performance.
For cross-validation, exactly the same set of SNPs were used in each fold for each TF to ensure a fair comparison. Similar to deltaSVM models, best models were selected using SNPs in four-folds based on AUPRC and SNPs in the remaining one-fold were used to compare performance. AUPRC and AUROC were also calculated using R package PPROC63. Only 129 TFs for which both PWM models and deltaSVM models are available were included for comparison.
For the novel batch of SNP-SELEX experiments, the same set of SNPs for each TF were used to compare performance. Best models were selected based on AUPRC using all SNPs in the first batch SNP-SELEX experiments for each TF. Then ΔPWM scores were calculated for each SNP using the selected models for multi-nominal and BEEMSEM models respectively. AUPRC and AUROC were then calculated for each TF to compare performance. Only 87 TFs with >40 pbSNPs and for which both PWM models and deltaSVM models are available were included for comparison.
(5). Prediction of the impact of each SNP on TF binding
To predict the impact of each SNP on TF binding, a pair of 40bp genomic sequences from the hg19 reference genome were selected, with the SNP to test located in the center of the oligo. We first scored both sequences using gkm models and determined if at least one of oligos can be bound by the TF. The threshold was determined based on bound oligos identified using SNP-SELEX experiments. Specifically, we computed gkm scores for all bound oligos and used the medium of the scores for the bound oligos for each TF as the threshold to determine TF binding. Only bound oligos were further predicted for allelic TF binding.
The deltasvm.pl script was used to predict preferential binding of the TF to the oligo sequences with the reference allele and alternative allele. We computed deltaSVM scores for all pbSNPs and used the medium of pbSNPs’ scores for each TF as the threshold to determine allelic TF binding.
X. Validation of the predicted SNPs impact on TF binding using ChIP-seq data
We made predictions for heterozygous SNPs covered by at least 20 allelic reads in ChIP-seq experiments in HepG2 and GM12878 cells7 respectively. For each TF ChIP-seq experiment, we computed the percentage of allelic imbalanced SNPs in predicted pbSNPs and non-pbSNPs. Confidence intervals for fraction of allelic imbalanced SNPs were calculated using “binom.confint” function in R package binom. Allelic imbalanced SNPs were determined as described in the previous section. For ΔPWM models, predicted pbSNPs were determined similarly using the median ΔPWM score for the bound oligonucleotides and pbSNPs respectively.
XI. Prediction of the TFs implicated in complex traits and diseases
To predict potential transcriptional regulators that may contribute to complex traits and disease, we applied previously established methods - stratified LD score regression (S-LDSC)64 - to examine if SNPs affecting certain TF binding are enriched in GWAS signals of complex traits and disease18,65–73. Briefly, S-LDSC models the casual effect of each SNP for a given trait as a linear additive contribution by a list of annotations and then estimates per-SNP heritability for each annotation as regression coefficient considering not only the SNP to test but also all SNPs in LD. Then p-value was computed to test if regression coefficient for annotation i is positive, which means annotation i explains additional heritability on top of other annotations. In other words, annotation i are enriched for SNPs associated with the trait.
We made predictions for 94 TFs with excellent deltaSVM models (AUPRC>0.75) for all common SNPs in 1000 genome project phase 3 for European population as mentioned above. The list of SNPs was obtained from website (https://data.broadinstitute.org/alkesgroup/LDSCORE/). The SNPs predicted to have an impact for each TF within the accessible chromatin regions in ENCODE DHS sites34 or FANTOME 535 permissive enhancers for all cell and tissue types were then used as annotation to estimate annotation-specific LD scores for each TF. We then run LDSC using these SNPs for each TF along with 53 baseline models including genic regions, enhancer regions and conserved regions. In many cases, SNP does not affect TF binding though the TF binds to the SNP. To rule out this scenario, we also included predictions for SNPs bound by the TF in the regression model. In summary, we run LDSC using 55 annotations including predicted SNPs with allelic TF binding, binding SNP prediction, and 53 baseline models, and p-values for regression coefficient for each TF were used to measure if predicted SNPs with allelic TF binding explains additional heritability. The p-values for the term of binding SNP prediction were used in Extended Data Fig. 10a.
Extended Data
Extended Data Figure 1 |. The sequence features of input oligonucleotides.
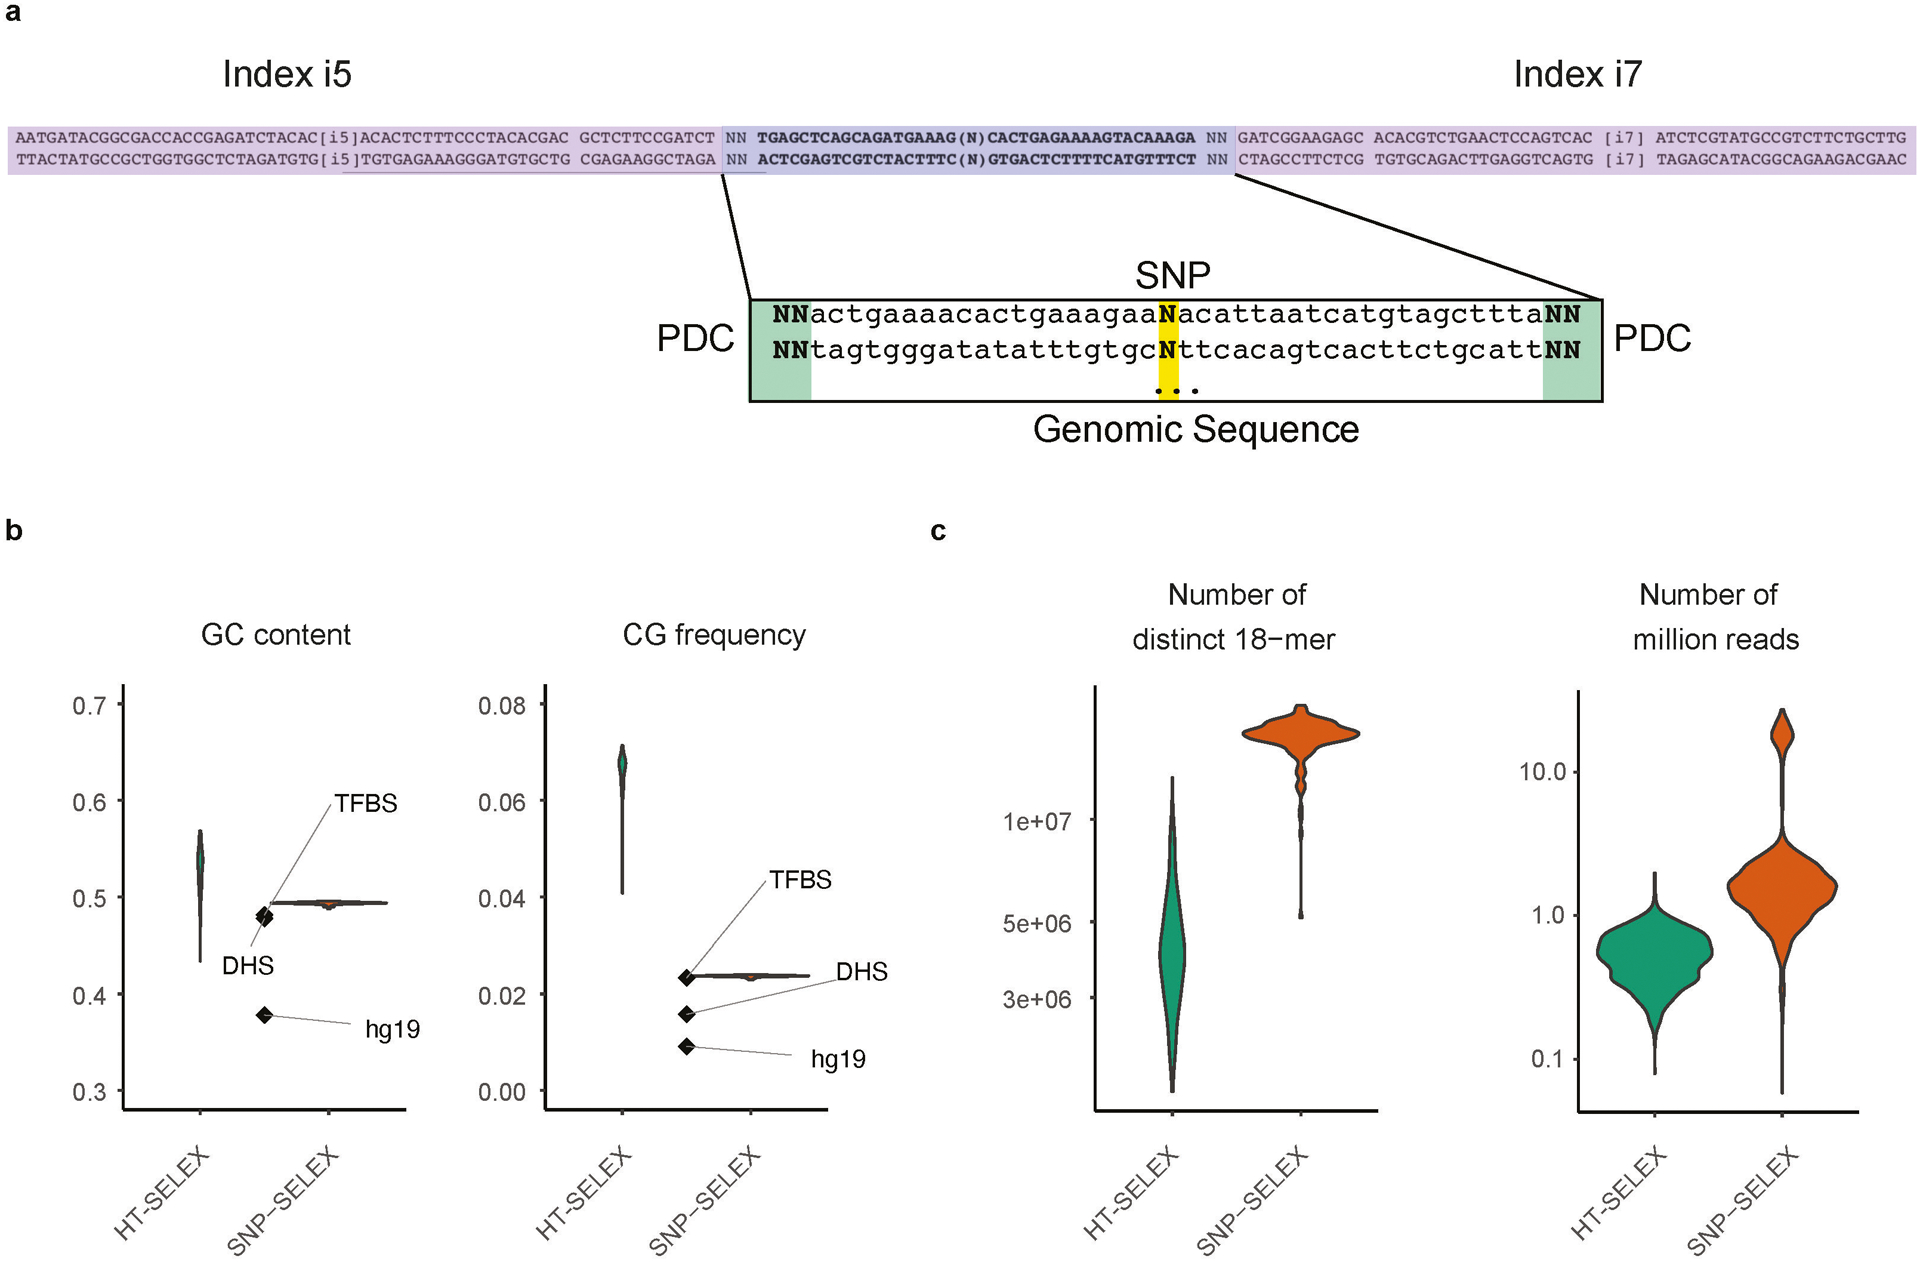
(a) An example of the oligo design for SNP-SELEX. Two random nucleotides were added to each end of the oligos as unique molecule identifiers (UMIs) to remove over-represented PCR duplicates. Illumina TruSeq dual-index system was adapted for oligo design.
(b) The GC content (left) and CpG frequency (right) of SNP-SELEX input were more similar to those of TF binding sites in the human genome (TFBS), open chromatin (DHS) and the entire human genome in general (hg19) than random sequences used in HT-SELEX.
(c) Comparison of k-mer coverage (left) and sequencing depth (right) of libraries between SNP-SELEX and HT-SELEX.
Extended Data Figure 2 |. Derivation of OBS and PBS.
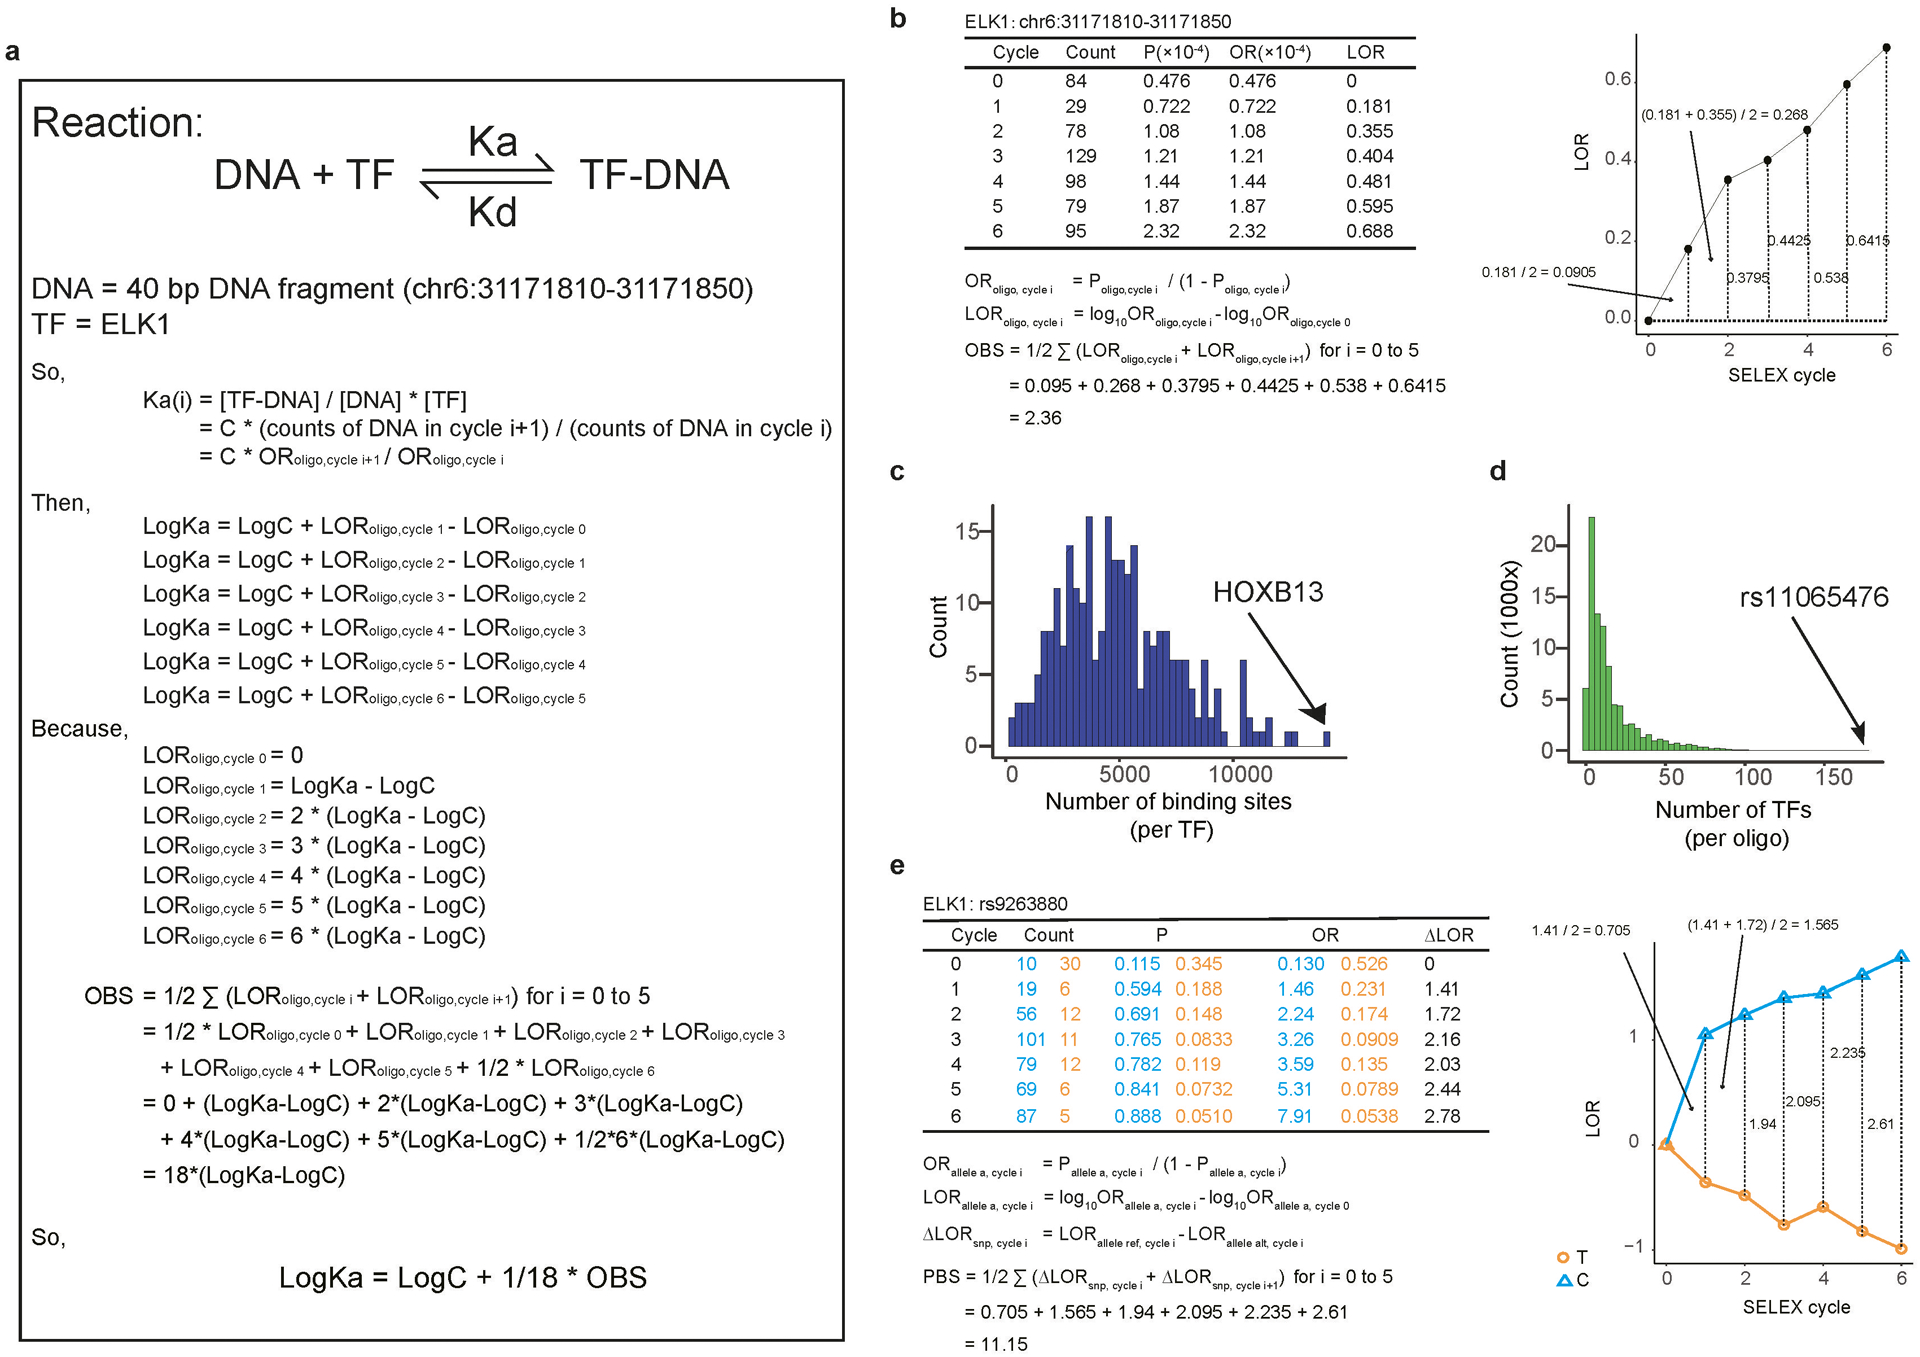
(a) Equations demonstrate the relationships between OBS and the association constant (Ka) of TF-DNA interactions.
(b) An example of how oligonucleotides were evolutionarily selected during SNP-SELEX. Table of counts for oligonucleotide chr6:31171810–31171850 is shown at left and the OBS curve is shown on the right.
(c-d) Histograms show the number of oligonucleotide sequence bound by each TF (c), the number of binding TFs for each oligonucleotide sequence (d).
(e) An example of how the abundance of SNPs varies in the course of a SNP-SELEX experiment. The table of counts for SNP rs9263880 is shown at the left and PBS curve is shown on the right. The orange line inside the black boxes indicates the reads of T-allele-containing fragment and the blue line shows the reads of C-allele-containing fragment.
Extended Data Figure 3 |. Reproducibility of SNP-SELEX data.

(a) Density plots show an example of the distribution of OBS of all oligos assayed in ELK SNP-SELEX replicative experiments. Vertical dashed lines indicate the cutoff for significant binding sequences (p=0.05 by Monte Carlo randomization). The 40-bp genomic sequences with OBS that is over the indicated values are recognized as significant binding sites of ELK1 or ELK4. DBD: DNA binding domain. FL: full-length protein.
(b) Density plots show an example of the distribution of PBS of all oligos assayed in ELK SNP-SELEX replicative experiments. Vertical dashed lines indicate the cutoff for significantly differential binding (p=0.01 by Monte Carlo randomization). The 40-bp SNP-containing genomic sequences with PBS over the indicated values are recognized as significantly differential (allelic) binding sites of ELK1 or ELK4. DBD: DNA binding domain. FL: full-length protein.
(c) An example illustrating differential DNA binding at six SNPs, in four SNP-SELEX experiments, including (i) two full-length ELK1 replicates, on the first two lines; (ii) one DNA binding domain (DBD) ELK1, on the third line; and one full-length ELK4 TF which belongs to the same structure family, on the last line. Each panel represents the logarithmic odds-ratio (y-axis) of observing the reference allele (REF), represented by a triangle, and the alternative allele (ALT), represented by a circle, over SNP-SELEX cycles (x-axis). The two alleles of each SNP are colored according to their nucleotides, where A is red, C is green, G is blue, and T is yellow. The figure shows that SNP-SELEX experiments of both replicates, full-length, DBD, and same structure TF family presents the same allelic preference.
(d, e) Comparison of oligonucleotide enrichment (d) and allele preference (e) between different biological replicates (replicates), full-length (FL), and DNA Binding Domain (DBD), members of the same structural family (family), and random pairs (others). For each pair of experiments, we compared the oligonucleotides that display binding in both experiments for binding oligonucleotides and compared Pearson Correlation Coefficients (PCC) between the PBS from each experiment. Horizontal line is median; hinges are 25th and 75th percentile; whiskers are most extreme value no further than 1.5 * IQR.
Extended Data Figure 4 |. SNP-SELEX results are correlated with TF binding in vitro and in vivo.
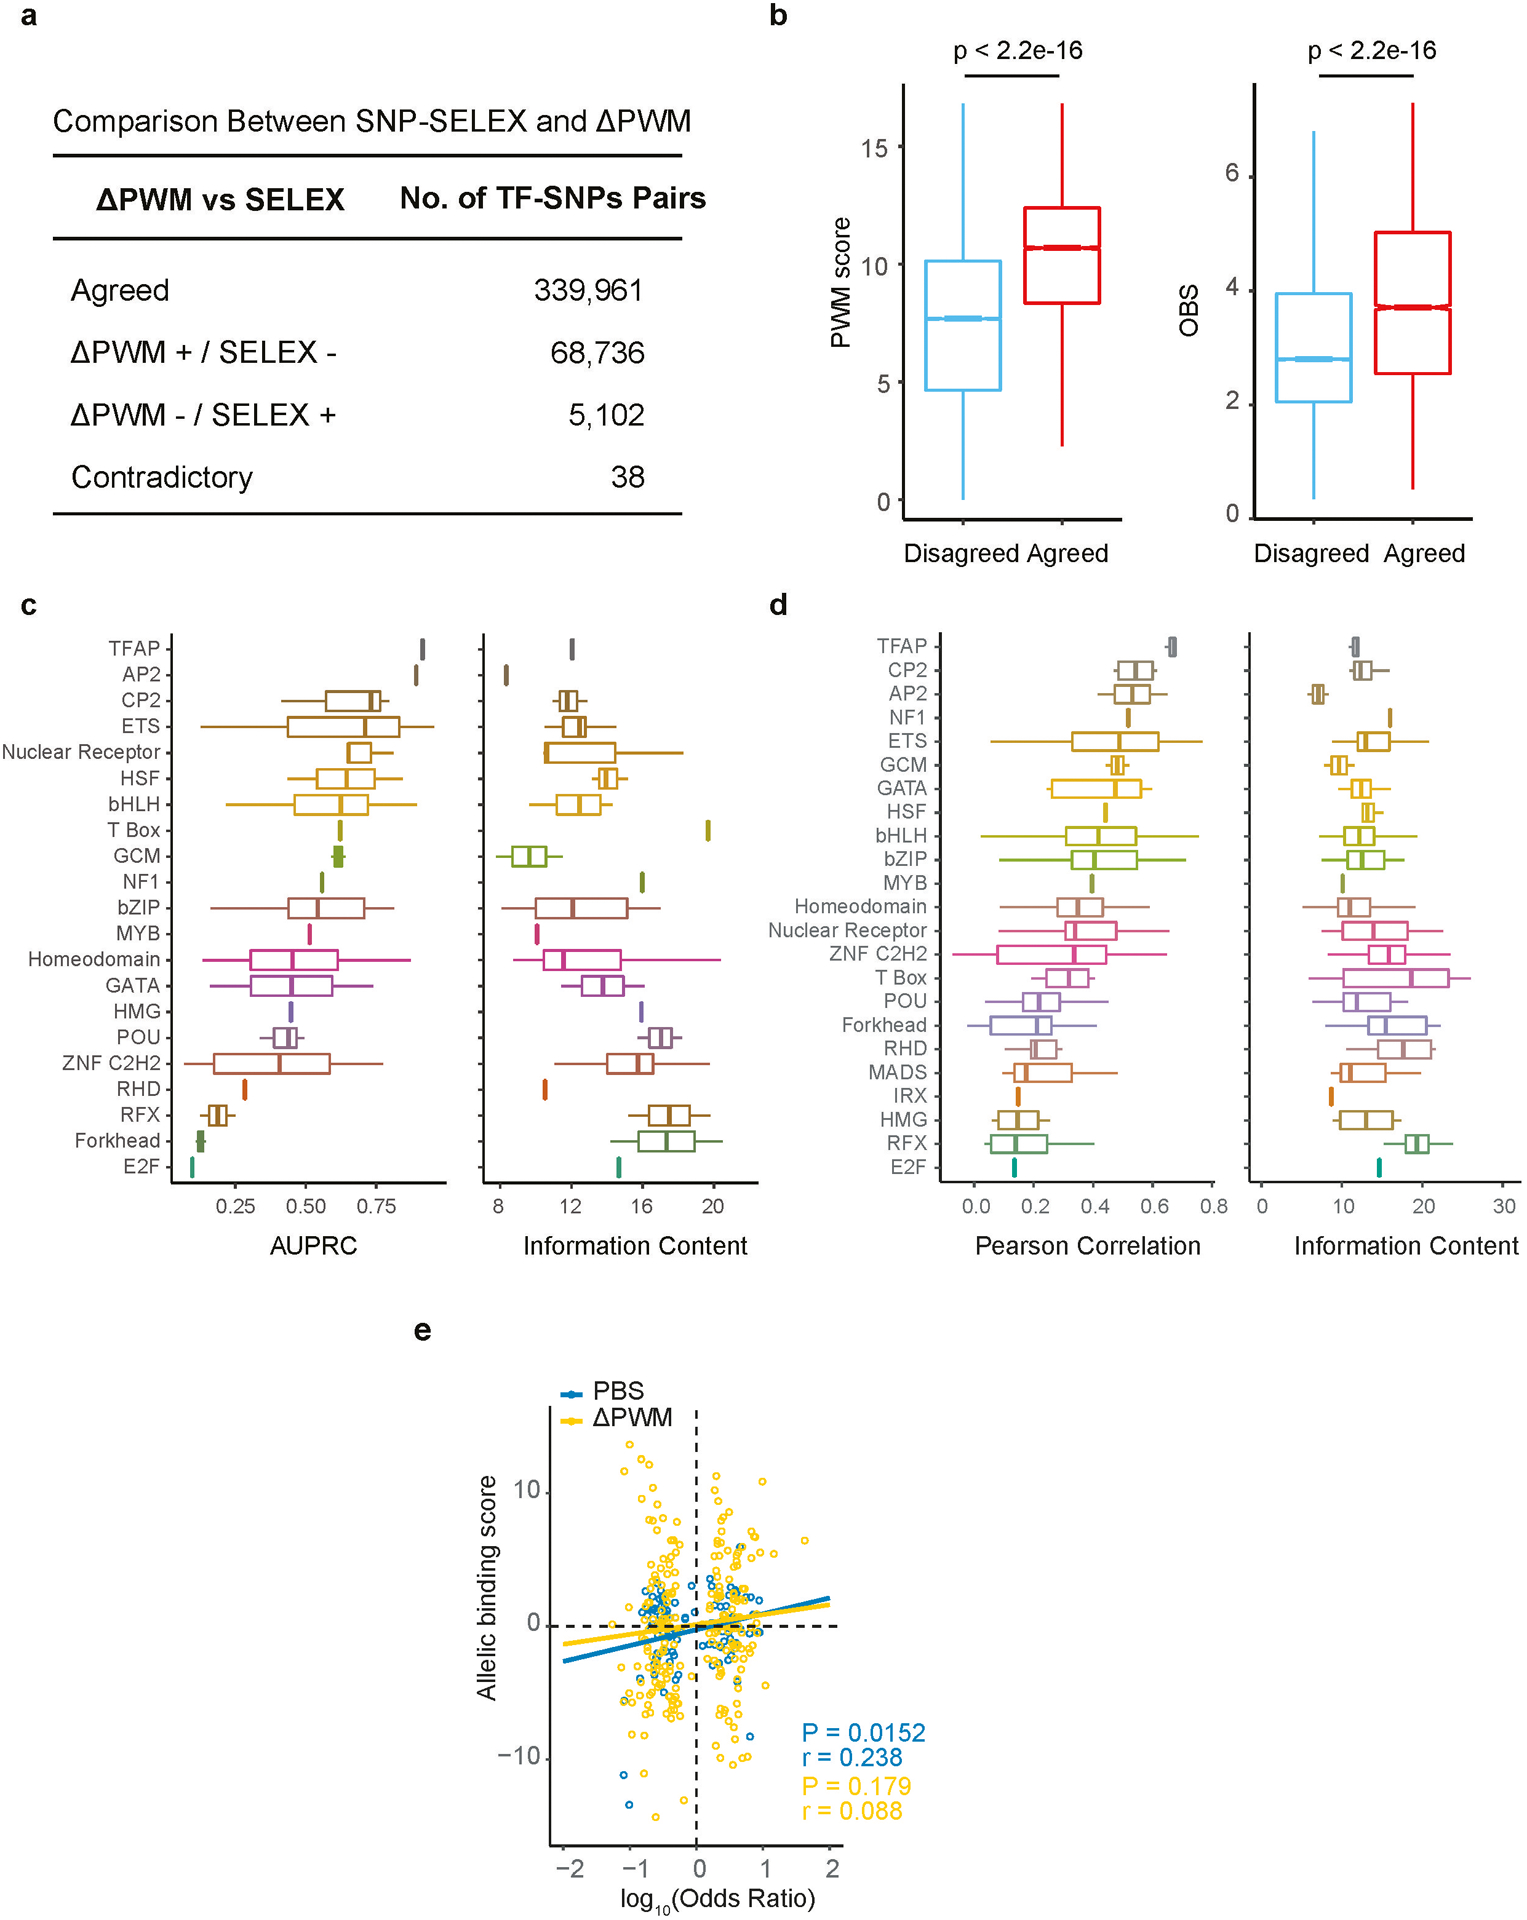
(a) Comparison of the SNPs with differential TF binding determined by SNP-SELEX and ΔPWM. An error matrix table showing the number of SNPs for which the same allele was identified as the preferred allele by both methods (Agreed), SNPs for which one allele was determined as preferential substrate by one method but no allele was called by the other (PWM+/ SNP-SELEX− and PWM−/ SNP-SELEX+), and SNPs where different alleles were called as preferential bound by each method (Contradictory). Note that the vast majority of the results agreed, with the most disagreement coming from PWM+/ SNP-SELEX−.
(b) Comparison of the PWM scores (left) and the OBS scores (right) between SNPs with concordant and discordant predictions. Note that discordant predictions mostly come from weak binding sites with low PWM scores and low OBS scores. Two-sided Mann-Whitney U test p-value is shown on the top. Horizontal line is median; hinges are 25th and 75th percentile; whiskers are most extreme value no further than 1.5 * IQR.
(c) Boxplots show performance of ΔPWM in predicting pbSNPs grouped by DNA binding domain structural families (left) and information content of motifs for each corresponding TF family (right). AUPRC (area under the precision-recall curve) is used to evaluate the performance of ΔPWM. Horizontal line is median; hinges are 25th and 75th percentile; whiskers are most extreme value no further than 1.5 * IQR.
(d) Boxplots show Pearson Correlation Coefficients (PCC) between PBS and ΔPWM (left) and information content (right) for each TF family. PCCs for some TF families are higher than others, independent of the information content (IC) of corresponding PWM models. Horizontal line is median; hinges are 25th and 75th percentile; whiskers are most extreme value no further than 1.5 * IQR.
(e) A scatterplot shows the correlation of PBS and allelic binding ratio derived from SNP-SELEX and ChIP-seq in GM12878 cells respectively. The PCCs and p-values calculated based on t-test are shown on the lower right corner. The allelic binding ratio is computed as the log10 odd ratio over input (see Methods for details). In total, 341 TF-SNP pairs including 269 unique SNPs and six TFs were plotted. TFs used include ATF2, PKNOX1, IRF3, NR2F1, YBX1, and TBX21.
Extended Data Figure 5 |. SNP-SELEX results are correlated with allelic enhancer activities detected using high-throughput reporter assays.
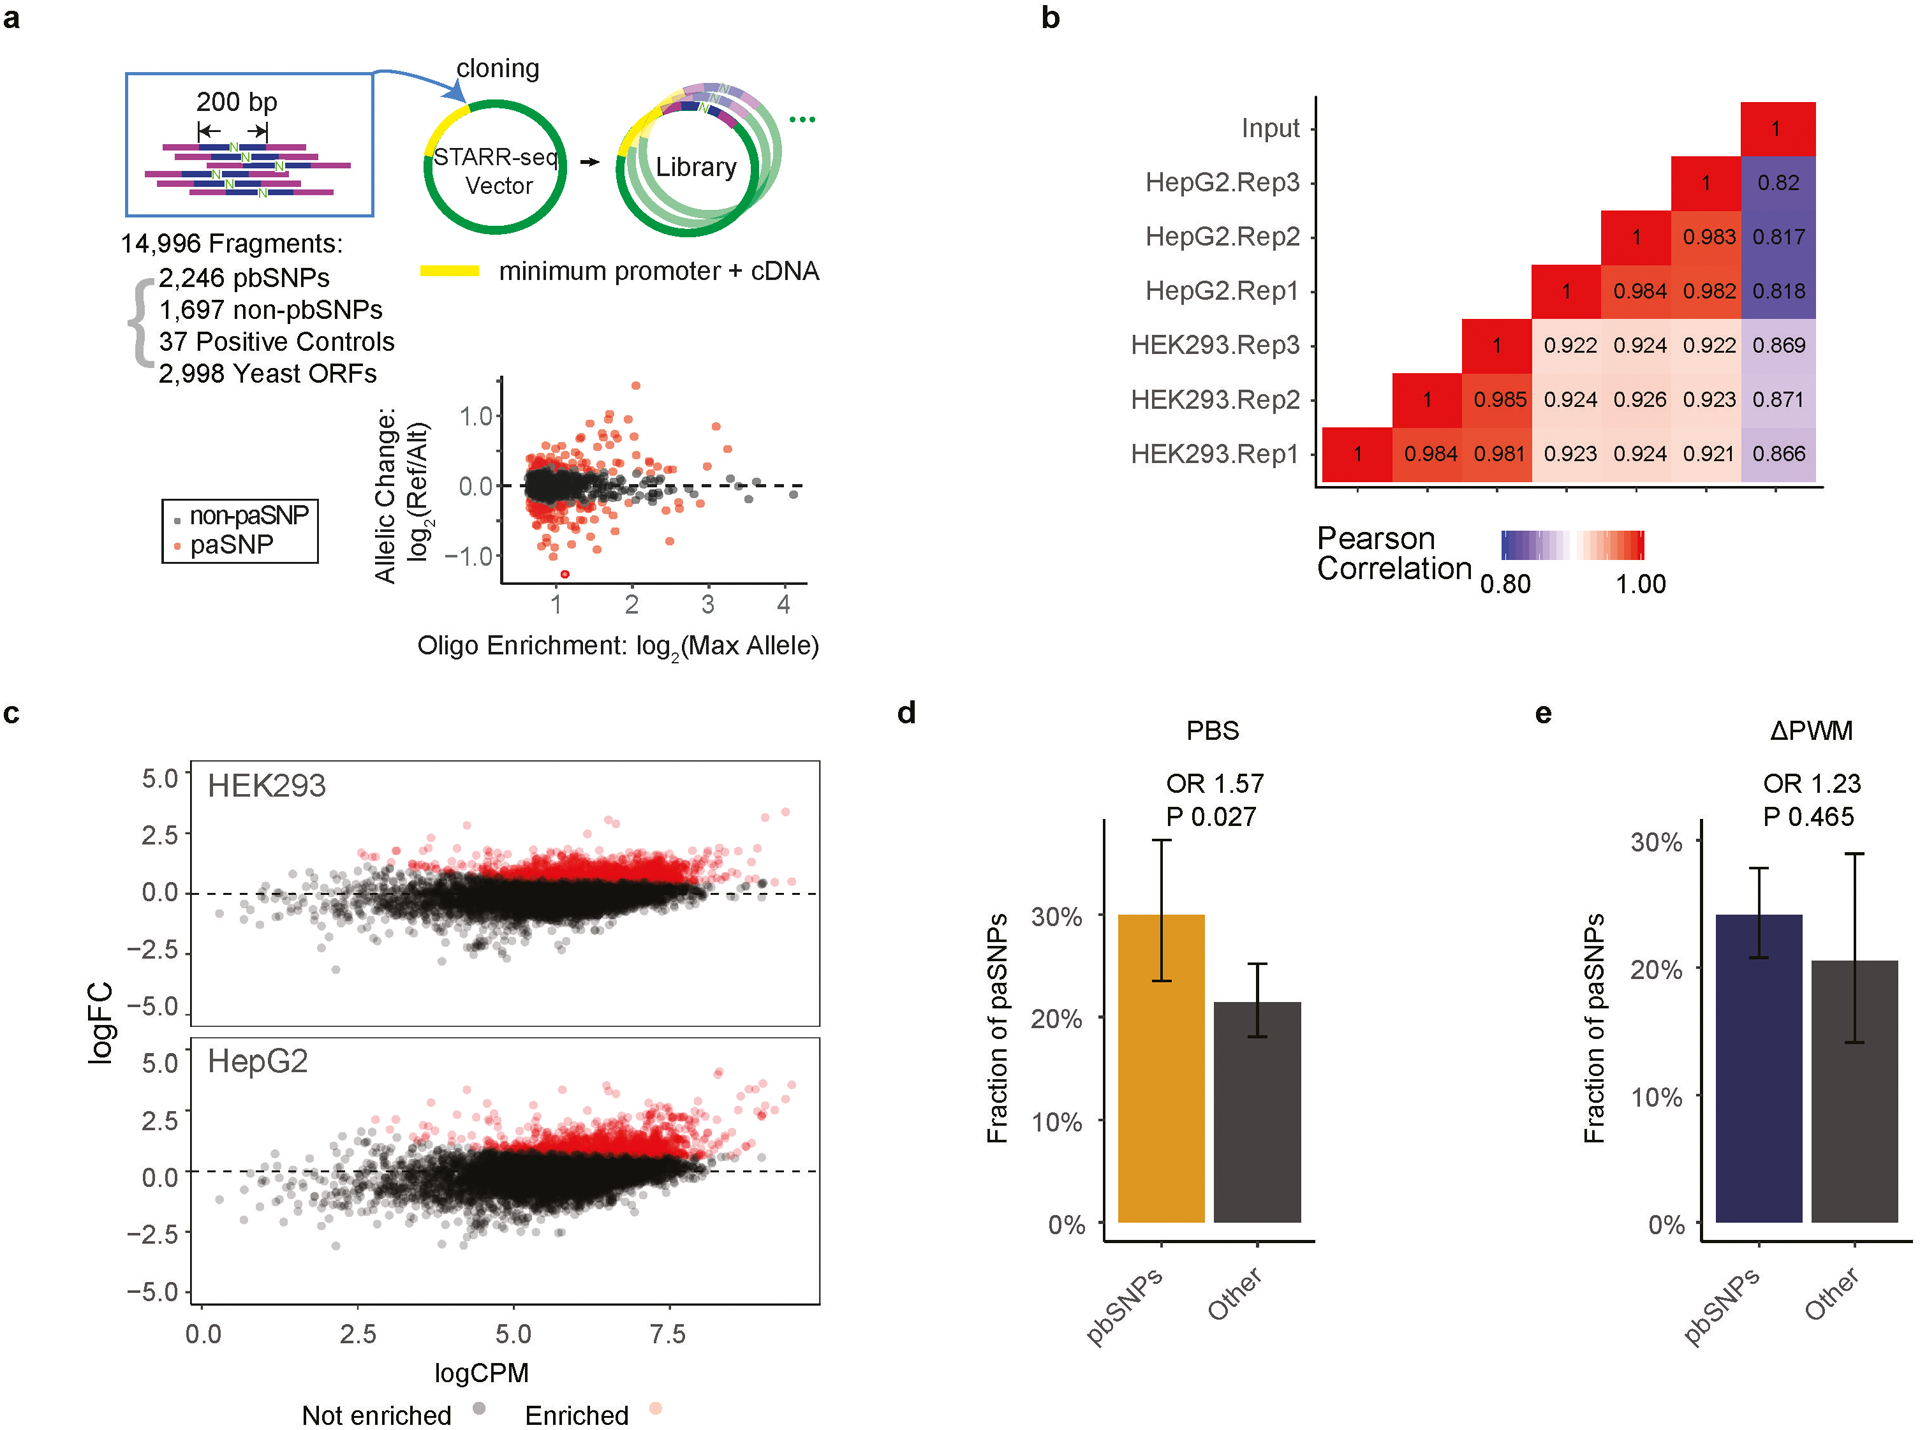
(a) A schematic diagram shows the strategy of using STARR-seq to assess the impact of SNPs in enhancer activity in HepG2 and HEK293T cells.
(b) Heatmap shows pair-wise Pearson’s Correlation Coefficients (PCCs) calculated among STARR-seq datasets. The read counts of each SNP in the starting reporter library, in the mRNA pools in three HepG2 replicates, and three HEK293T replicates were used for PCC calculation.
(c) MA plot of the logarithmic fold-change (y-axis) of read counts of SNP-containing mRNA over that of the input library expressed as logarithmic counts per million (CPM) (x-axis) for HEK293T, on the top panel, and HepG2, on the bottom panel. Each dot on the plot corresponds to an oligonucleotide, and the oligonucleotides showing enrichment (empirical FDR<0.05) are colored in red.
(d) Barplots comparing the fractions of paSNPs determined using STARR-seq in pbSNPs and non-pbSNPs by SNP-SELEX. Odds Ratio (OR) is shown between imbalanced and balanced SNPs, and the p-value is calculated by Fisher exact test. Error bars denote the 95% confidence interval calculated by Wilson method (Methods). Only pbSNPs corresponding to the highly expressed TFs (RPKM > 3) in the cell lines are considered for the analysis. n=167 SNP-cell pairs for pbSNPs; n=509 SNP-cell pairs for non-pbSNPs.
(e) Barplots comparing the fractions of paSNPs determined using STARR-seq in pbSNPs and non-pbSNPs predicted by ΔPWM. SNPs with p-value < 0.01 by atSNP were considered as pbSNPs. Odds Ratio (OR) is shown between imbalanced and balanced SNPs, and the p-value is calculated by Fisher exact test. Error bars denote the 95% confidence interval calculated by Wilson method (Methods). Only pbSNPs by highly expressed TFs (RPKM > 3) in the corresponding cell lines are considered for the analysis. n=564 SNP-cell pairs for pbSNPs; n=112 SNP-cell pairs for non-pbSNPs.
Extended Data Figure 6 |. deltaSVM more accurately predicts impacts of noncoding variants on TF binding in vivo than ΔPWM.
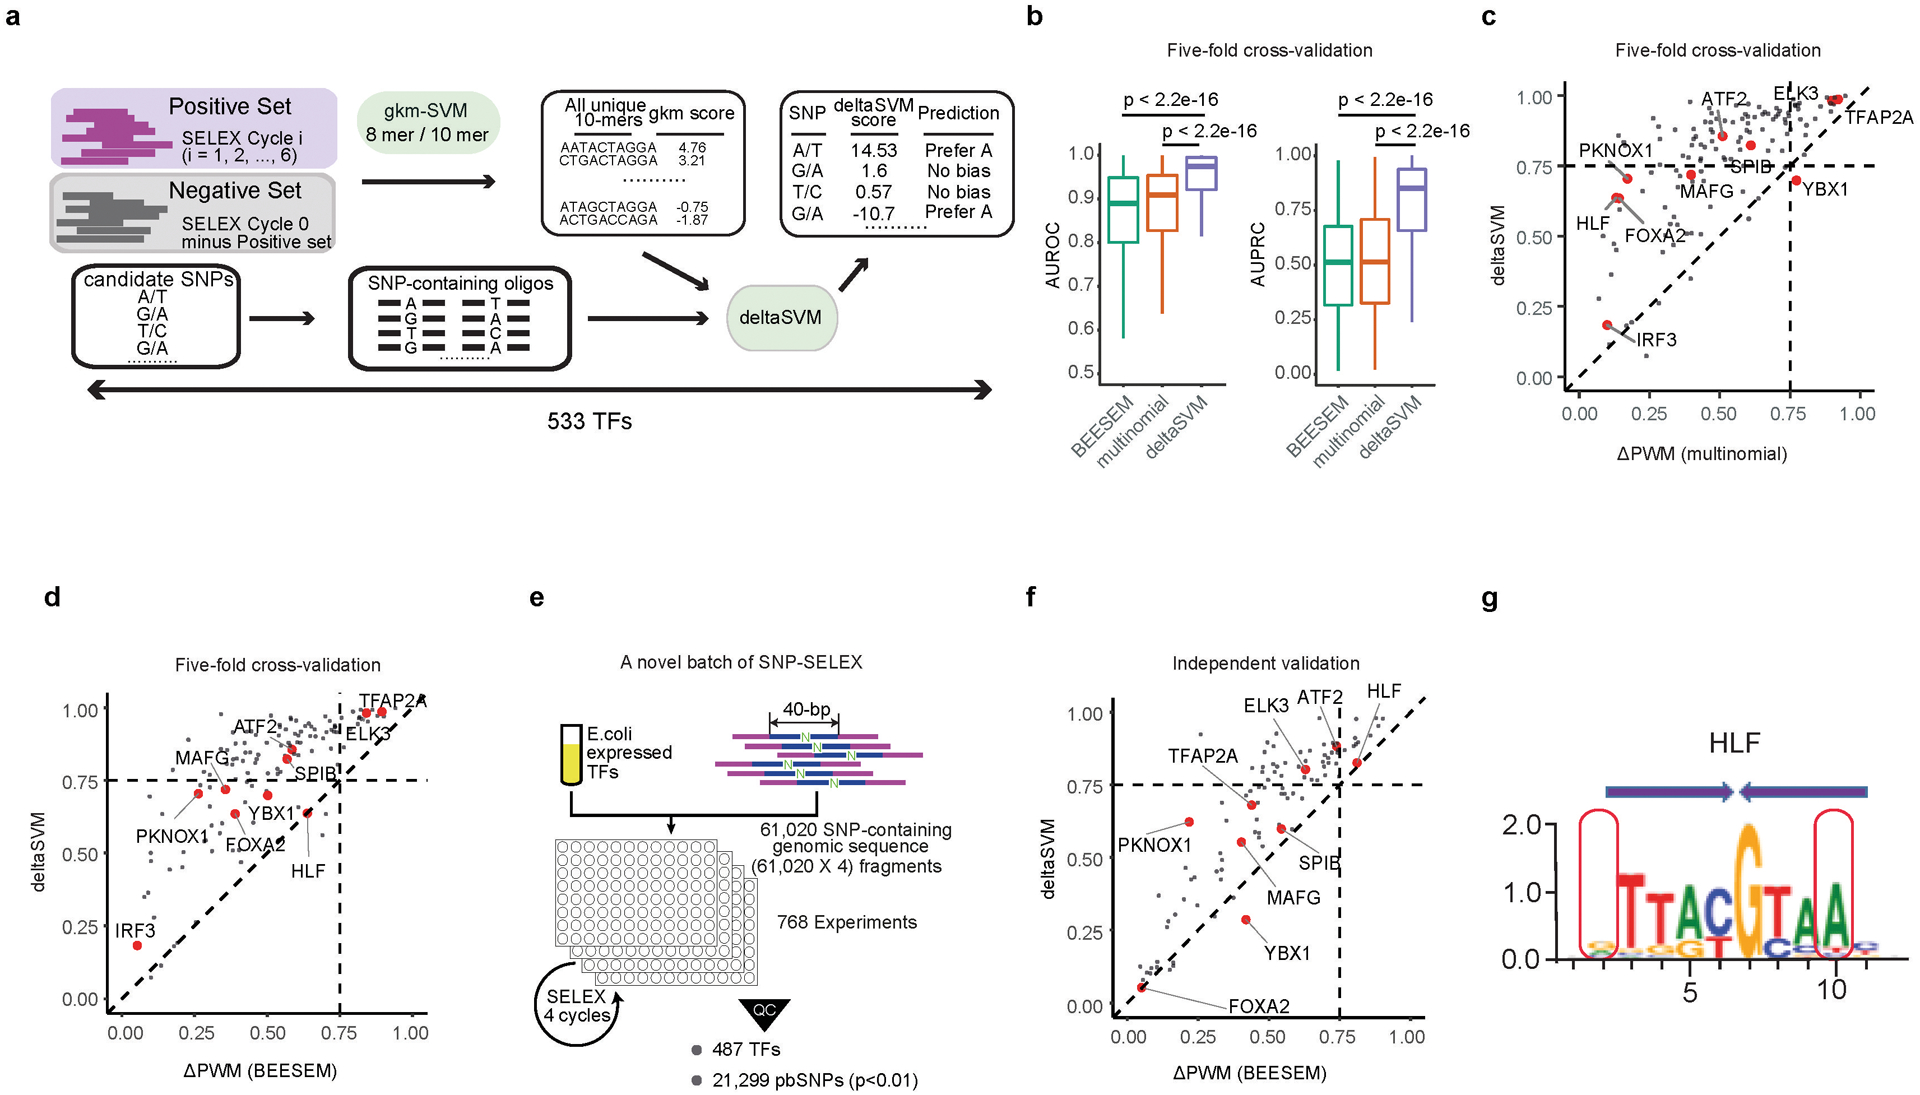
(a) A schematic graph for the training of deltaSVM models for 533 TFs. Data from previously reported HT-SELEX experiments using random DNA oligonucleotide sequences were used to derive these models. To develop deltaSVM models for each TF, the reads in each HT-SELEX cycle beyond cycle 0 reads were used as positive training sets, and the reads not enriched were used as negative training sets. All unique 10-mers were scored using gapped-kmer models to compute weights for deltaSVM. The two alleles of the 40-bp SELEX oligos were then scored using deltaSVM models to generate deltaSVM scores.
(b) Boxplots compare the performance of deltaSVM, PWM derived from HT-SELEX with the multinomial or BEESEM algorithms in predicting pbSNPs for 129 TFs. The results from five-fold cross-validation were shown. Two statistical evaluations were used, including area under the Receiver Operator Curve (AUROC, left) and area under the Precision-Recall Curve (AUPRC, right). P-values by two-sided Mann-Whitney U test are shown on the top. Horizontal line is median; hinges are 25th and 75th percentile; whiskers are most extreme value no further than 1.5 * IQR.
(c, d) Scatterplots compare the performance between deltaSVM (y-axis) and ΔPWM (x-axis) derived by multinomial models (c) and BEESEM models (d) by in predicting allelic binding of 129 TFs for which both models were available. Results from five-fold cross-validation were shown. The values in both axes were AUPRC.
(e) An overview of the SNP-SELEX experimental procedure describing the novel batch of SNP-SELEX.
(f) A scatterplot compares the performance between deltaSVM (y-axis) and BEESEM-generated ΔPWM (x-axis) in predicting allelic binding of 87 TFs for which both models are available by the novel batch of SNP-SELEX. The values in both axes are AUPRC.
(g) The logo describes the PWM model of a homodimeric binding pattern of TF HLF, with the monomeric half-site indicated by the purple arrows. The red boxes indicate the positions at which the SNP rs79124498 is located (left) and its co-dependent base position (right). The y-axis corresponds to the information content at each position of the PWM (x-axis).
Extended Data Figure 7 |. Comparison of deltaSVM models and ΔPWM in predicting allelic TF binding in weak and strong TF binding sites.
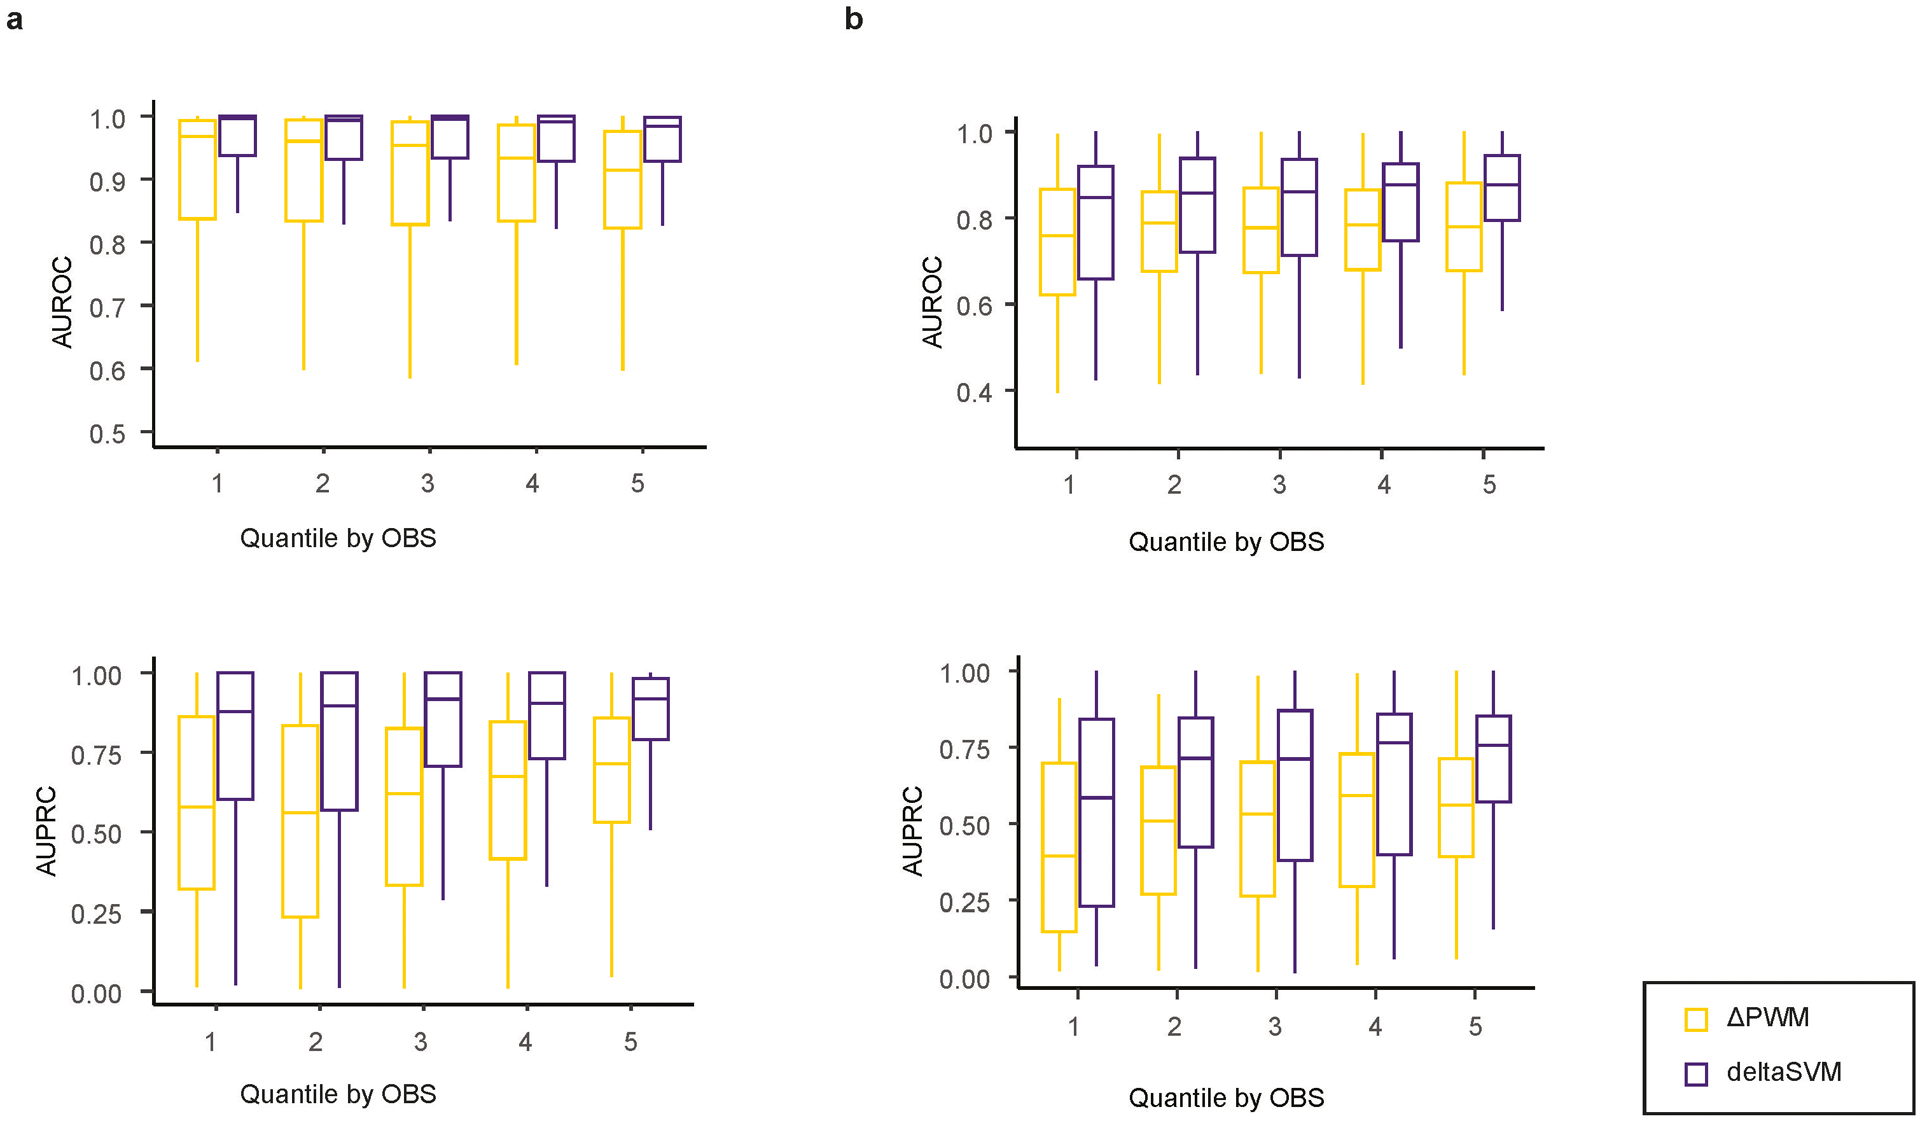
SNPs are categorized into five quantiles based on the OBS of the 40-bp DNA fragments. The performance of ΔPWM (green) and deltaSVM (orange) in predicting allelic binding of TFs was evaluated for SNPs in each category. Two batches of pbSNPs were used as gold standards for performance assessment: the pbSNPs from the initial SNP-SELEX experiments, with five-fold cross-validation (a) and the novel batch SNP-SELEX data (b). Both AUROC (upper) and AUPRC (lower) are shown for statistic assessment of the model performance. The first quantile represents SNPs with the weakest binding strength and the fifth quantile represents SNPs with the strongest binding strength. Horizontal line is median; hinges are 25th and 75th percentile; whiskers are most extreme value no further than 1.5 * IQR.
Extended Data Figure 8 |. deltaSVM models predict more accurately the noncoding variants affecting TF binding in vivo than ΔPWM.

(a) DeltaSVM models outperform ΔPWM in predicting differential DNA binding in vitro. Precision-Recall curves were used to assess the performance of either model in predicting allelic binding events identified in SNP-SELEX for three TFs, including ATF2, HLF, and MAFG. In all three cases, the performance of deltaSVM models (purple) was much better than that of ΔPWM (yellow). The area under the curve (AUC) used for quantitative comparison was shown within each plot.
(b) Barplots show the fractions of pbSNPs exhibiting allelic imbalance in TF ChIP-seq assays in HepG2 cells among all SNPs that were predicted to be differentially bound by a TF according to the deltaSVM models (purple) or the ΔPWM (yellow). The same datasets as in Fig. 3e were used. Only SNPs that were predicted to be bound by the TF were used in the comparison. The threshold for oligonucleotide binding and for the predicted pbSNPs was determined as the median score for the bound oligonucleotides and pbSNPs respectively. Error bars centered with mean percentage denote the 95% confidence interval calculated by Wilson method (Methods). For ΔPWM, n=2872(ATF2); n=4134(HLF); n=100(MAFG). For deltaSVM, n=115(ATF2); n=355(HLF); n=16(MAFG).
(c) Barplots show the fractions of pbSNPs exhibiting allelic imbalance in TF ChIP-seq assays in GM12878 cells among all SNPs that were predicted as differentially bound by a TF according to the deltaSVM models (purple) or the ΔPWM (yellow). Three TFs were included in the analyses, ATF2, NR2F1, and PKNOX1. Only SNPs that were predicted to be bound by the TF were used in the comparison. The threshold for oligonucleotide binding and the predicted pbSNPs was determined as the median scores for the bound oligos and pbSNPs respectively. Error bars centered with mean percentage denote the 95% confidence interval calculated by Wilson method (Methods). For ΔPWM, n=4318(ATF2); n=673(NR2F1); n=225(PKNOX1). For deltaSVM, n=142(ATF2); n=229(NR2F1); n=142(PKNOX1).
(d) Similar to Fig. 3e, deltaSVM models outperform ΔPWM in predicting differential DNA binding in vivo. Three TF ChIP-seq datasets from GM12878 cells were used for the comparison, including the same dataset as shown in panel b. Elbow plots show that for each TF, the top-ranked allelic SNPs predicted by deltaSVM models were found to have allelic imbalance in ChIP-seq assays performed in GM12878 cells (purple). By contrast, for allelic SNPs predicted by ΔPWM, only a small fraction showed allelic imbalance in vivo (yellow).
Extended Data Figure 9 |. T2D risk SNPs are enriched for pbSNPs.
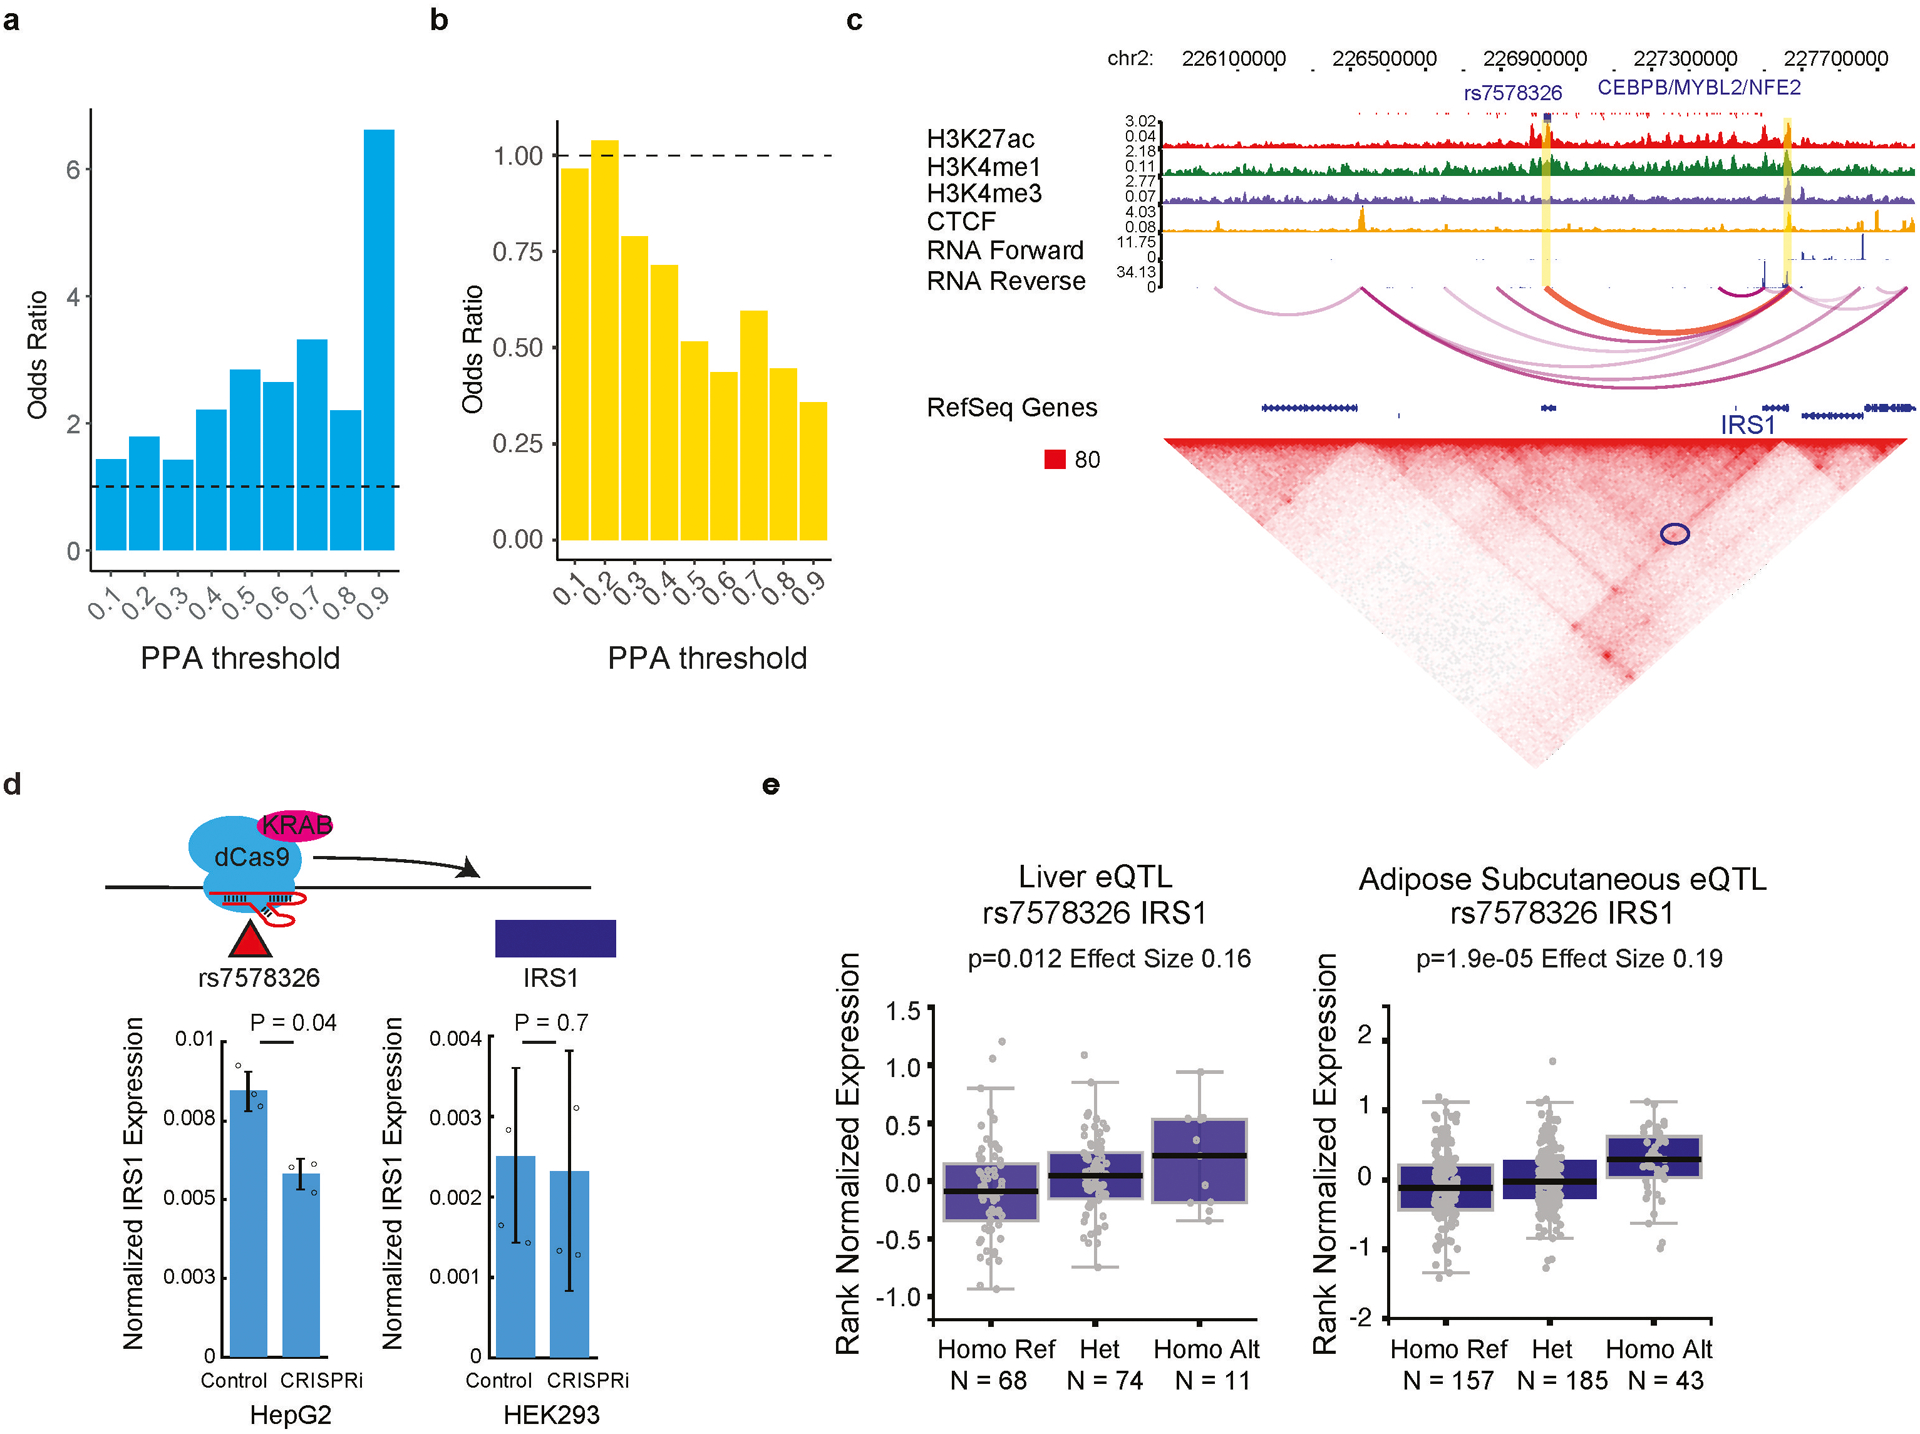
(a) Barplots show the enrichment of pbSNPs in T2D risk SNPs identified from an independent study (Greenwald, et al.14). The levels of enrichment were displayed for different groups risk SNPs categorized based on the PPA (Posterior Probability of Association). Note that SNPs with stronger PPAs and thus higher likelihood of being causal for T2D are more likely to be pbSNPs.
(b) Barplots show the enrichment of T2D risk SNPs in allelic TF binding SNPs predicted by PWM models using the same credible sets as Fig. 4a (Mahajan, et al.13). Specifically, SNPs with p-value < 0.01 by atSNP were used as allelic TF binding SNPs. The level of association is categorized according to PPA as in (a). Note that the likely causal SNPs with stronger T2D risk association no longer display higher enrichment for ΔPWM-predicted allelic SNPs.
(c) A T2D GWAS leading SNP rs7578326 and a pbSNP differentially bound by TFs CEBPB, CEBPE, MYBL2, and NFE2, is predicted to target the IRS1 gene based on Hi-C analysis (circled in blue in bottom panel) in HepG2 cells. The locus around the SNP is enriched for H3K27ac and H3K4me1.
(d) CRISPRi using dCas9 fused with repressive KRAB domain and guide RNA targeting the locus of SNP rs7578326 (upper) leads to reduced expression of IRS1 gene in HepG2 but not in HEK293T cells. qPCR results from three biological replicates in HepG2 (left) and HEK293 (right) cells are plotted in the bottom panel. Y-axis shows the power transformed values of expression presented as mean values +/− SD. Raw data are shown as small black circles for clarification. P-values computed using two-sided t-test are noted on the top.
(e) SNP rs7578326 is an eQTL in liver and adipose tissues. Normalized expression value from GTEx project for IRS1 gene is grouped based on individuals’ genotype of SNP rs7578326. Linear regression p-values and effect sizes are noted on the top. Horizontal line is median; hinges are 25th and 75th percentile; whiskers are most extreme value no further than 1.5 * IQR.
Extended Data Figure 10 |. Candidate TFs involved in complex traits and diseases identified by enrichment of TF binding alone.
(a) A heatmap shows the significant enrichment of SNPs predicted to be located within TF-DNA binding sites among traits- or disease-associated SNP. The color key is shown, and the value represents the −log10 p-value. TF-trait pairs mentioned in the text were marked with *. Note that the SNPs here do not necessarily affect TF binding affinity. The candidate regulator we observed and validated (Fig. 4b) could not be identified here if we only use the presence of SNPs at the binding sites without taking into account the impact of SNP on binding affinity.
(b, d) qPCR results from three biological replicates of MAFG (b) and HLF (d) in WT (HepG2), Control (Negative and HiPerfect), and cells treated with different siRNAs. Expression values are presented as mean values +/− SD.
(c, e) MA-plot showing differentially expressed genes comparing MAFG knockdown (c) and HLF knockdown (e) versus controls. Significant differentially expressed genes (FDR<0.2) were marked in red.
Supplementary Material
Acknowledgements
We thank S. Preissl (UCSD) and S.A. Chen (Stanford U) for insightful comments during manuscript preparation. We are also very grateful to S. Kuan, Z. Liu and B. Li for technical assistance. This work was supported by the Ludwig Institute for Cancer Research (B.R.), NIDDK (U01 DK105541 to B.R., M.S., and K.F.), Vetenskapsrådet Sweden (537-2014-6796 to J.Y.), and a CAPES foundation fellowship (BEX 5304/15-6 to A.M.R.S.).
Footnotes
Code Availability
Custom codes used to process and generate the results described in the current study were deposited into GitHub at [https://github.com/ren-lab/snp-selex].
Data Availability
Sequencing data generated in this study can be accessed via Gene Expression Omnibus (GEO) under accession number GSE118725.
The raw sequencing data of TF ChIP-seq of GM12878 is extracted from the ENCODE portal [https://www.encodeproject.org]. The specific TF data can be accessed by searching the accession ID listed in Supplementary Table S4.
The web portal [http://renlab.sdsc.edu/GVATdb/] provides a searchable interface for SNPs and TFs tested in the current study.
Enriched motifs for SNP-SELEX experiments using Homer are available in Supplementary File S1. Scores for all tested SNP-TF pairs by SNP-SELEX experiments are available in Supplementary File S2. The 94 high-confidence deltaSVM models predicted allelic binding of all common SNPs in the human genome are available in Supplementary File S3.
Reference
- 1.Buniello A et al. The NHGRI-EBI GWAS Catalog of published genome-wide association studies, targeted arrays and summary statistics 2019. Nucleic Acids Res 47, D1005–D1012, doi: 10.1093/nar/gky1120 (2019). [DOI] [PMC free article] [PubMed] [Google Scholar]
- 2.Weirauch MT et al. Evaluation of methods for modeling transcription factor sequence specificity. Nat Biotechnol 31, 126–134, doi: 10.1038/nbt.2486 (2013). [DOI] [PMC free article] [PubMed] [Google Scholar]
- 3.Yin Y et al. Impact of cytosine methylation on DNA binding specificities of human transcription factors. Science 356, doi: 10.1126/science.aaj2239 (2017). [DOI] [PMC free article] [PubMed] [Google Scholar]
- 4.Jolma A et al. DNA-binding specificities of human transcription factors. Cell 152, 327–339, doi: 10.1016/j.cell.2012.12.009 (2013). [DOI] [PubMed] [Google Scholar]
- 5.Ruan S, Swamidass SJ & Stormo GD BEESEM: estimation of binding energy models using HT-SELEX data. Bioinformatics 33, 2288–2295, doi: 10.1093/bioinformatics/btx191 (2017). [DOI] [PMC free article] [PubMed] [Google Scholar]
- 6.Farley EK et al. Suboptimization of developmental enhancers. Science 350, 325–328, doi: 10.1126/science.aac6948 (2015). [DOI] [PMC free article] [PubMed] [Google Scholar]
- 7.Consortium EP An integrated encyclopedia of DNA elements in the human genome. Nature 489, 57–74, doi: 10.1038/nature11247 (2012). [DOI] [PMC free article] [PubMed] [Google Scholar]
- 8.Arnold CD et al. Genome-wide quantitative enhancer activity maps identified by STARR-seq. Science 339, 1074–1077, doi: 10.1126/science.1232542 (2013). [DOI] [PubMed] [Google Scholar]
- 9.International HapMap C et al. Integrating common and rare genetic variation in diverse human populations. Nature 467, 52–58, doi: 10.1038/nature09298 (2010). [DOI] [PMC free article] [PubMed] [Google Scholar]
- 10.Lee D et al. A method to predict the impact of regulatory variants from DNA sequence. Nat Genet 47, 955–961, doi: 10.1038/ng.3331 (2015). [DOI] [PMC free article] [PubMed] [Google Scholar]
- 11.Rohs R et al. The role of DNA shape in protein-DNA recognition. Nature 461, 1248–1253, doi: 10.1038/nature08473 (2009). [DOI] [PMC free article] [PubMed] [Google Scholar]
- 12.Morgunova E et al. Two distinct DNA sequences recognized by transcription factors represent enthalpy and entropy optima. Elife 7, doi: 10.7554/eLife.32963 (2018). [DOI] [PMC free article] [PubMed] [Google Scholar]
- 13.Mahajan A et al. Fine-mapping type 2 diabetes loci to single-variant resolution using high-density imputation and islet-specific epigenome maps. Nat Genet 50, 1505–1513, doi: 10.1038/s41588-018-0241-6 (2018). [DOI] [PMC free article] [PubMed] [Google Scholar]
- 14.Greenwald WW et al. Pancreatic islet chromatin accessibility and conformation reveals distal enhancer networks of type 2 diabetes risk. Nat Commun 10, 2078, doi: 10.1038/s41467-019-09975-4 (2019). [DOI] [PMC free article] [PubMed] [Google Scholar]
- 15.Consortium GT et al. Genetic effects on gene expression across human tissues. Nature 550, 204–213, doi: 10.1038/nature24277 (2017). [DOI] [PMC free article] [PubMed] [Google Scholar]
- 16.Olefsky J, Farquhar JW & Reaven G Relationship between fasting plasma insulin level and resistance to insulin-mediated glucose uptake in normal and diabetic subjects. Diabetes 22, 507–513, doi: 10.2337/diab.22.7.507 (1973). [DOI] [PubMed] [Google Scholar]
- 17.Soyal SM et al. Associations of Haplotypes Upstream of IRS1 with Insulin Resistance, Type 2 Diabetes, Dyslipidemia, Preclinical Atherosclerosis, and Skeletal Muscle LOC646736 mRNA Levels. J Diabetes Res 2015, 405371, doi: 10.1155/2015/405371 (2015). [DOI] [PMC free article] [PubMed] [Google Scholar]
- 18.Manning AK et al. A genome-wide approach accounting for body mass index identifies genetic variants influencing fasting glycemic traits and insulin resistance. Nat Genet 44, 659–669, doi: 10.1038/ng.2274 (2012). [DOI] [PMC free article] [PubMed] [Google Scholar]
- 19.Scott RA et al. Large-scale association analyses identify new loci influencing glycemic traits and provide insight into the underlying biological pathways. Nat Genet 44, 991–1005, doi: 10.1038/ng.2385 (2012). [DOI] [PMC free article] [PubMed] [Google Scholar]
- 20.Nordquist N et al. The transcription factor TFAP2B is associated with insulin resistance and adiposity in healthy adolescents. Obesity (Silver Spring) 17, 1762–1767, doi: 10.1038/oby.2009.83 (2009). [DOI] [PubMed] [Google Scholar]
- 21.Apazoglou K et al. Antidepressive effects of targeting ELK-1 signal transduction. Nat Med 24, 591–597, doi: 10.1038/s41591-018-0011-0 (2018). [DOI] [PubMed] [Google Scholar]
- 22.Nordquist N et al. The transcription factor TFAP2B is associated with insulin resistance and adiposity in healthy adolescents. Obesity (Silver Spring) 17, 1762–1767, doi: 10.1038/oby.2009.83 (2009). [DOI] [PubMed] [Google Scholar]
- 23.Apazoglou K et al. Antidepressive effects of targeting ELK-1 signal transduction. Nat Med 24, 591–597, doi: 10.1038/s41591-018-0011-0 (2018). [DOI] [PubMed] [Google Scholar]
- 24.Leonardini A, Laviola L, Perrini S, Natalicchio A & Giorgino F Cross-Talk between PPARgamma and Insulin Signaling and Modulation of Insulin Sensitivity. PPAR Res 2009, 818945, doi: 10.1155/2009/818945 (2009). [DOI] [PMC free article] [PubMed] [Google Scholar]
- 25.Fruchart JC, Duriez P & Staels B Peroxisome proliferator-activated receptor-alpha activators regulate genes governing lipoprotein metabolism, vascular inflammation and atherosclerosis. Curr Opin Lipidol 10, 245–257 (1999). [DOI] [PubMed] [Google Scholar]
- 26.Shachter NS Apolipoproteins C-I and C-III as important modulators of lipoprotein metabolism. Curr Opin Lipidol 12, 297–304 (2001). [DOI] [PubMed] [Google Scholar]
- 27.Tg et al. Loss-of-function mutations in APOC3, triglycerides, and coronary disease. N Engl J Med 371, 22–31, doi: 10.1056/NEJMoa1307095 (2014). [DOI] [PMC free article] [PubMed] [Google Scholar]
- 28.Gotto AM Jr. Triglyceride as a risk factor for coronary artery disease. Am J Cardiol 82, 22Q–25Q, doi: 10.1016/s0002-9149(98)00770-x (1998). [DOI] [PubMed] [Google Scholar]
- 29.Khetarpal SA, Qamar A, Millar JS & Rader DJ Targeting ApoC-III to Reduce Coronary Disease Risk. Curr Atheroscler Rep 18, 54, doi: 10.1007/s11883-016-0609-y (2016). [DOI] [PubMed] [Google Scholar]
- 30.Jolma A et al. DNA-dependent formation of transcription factor pairs alters their binding specificity. Nature 527, 384–388, doi: 10.1038/nature15518 (2015). [DOI] [PubMed] [Google Scholar]
- 31.Kato N Insights into the genetic basis of type 2 diabetes. J Diabetes Investig 4, 233–244, doi: 10.1111/jdi.12067 (2013). [DOI] [PMC free article] [PubMed] [Google Scholar]
- 32.Replication DIG et al. Genome-wide trans-ancestry meta-analysis provides insight into the genetic architecture of type 2 diabetes susceptibility. Nat Genet 46, 234–244, doi: 10.1038/ng.2897 (2014). [DOI] [PMC free article] [PubMed] [Google Scholar]
- 33.Johnson AD et al. SNAP: a web-based tool for identification and annotation of proxy SNPs using HapMap. Bioinformatics 24, 2938–2939, doi: 10.1093/bioinformatics/btn564 (2008). [DOI] [PMC free article] [PubMed] [Google Scholar]
- 34.Thurman RE et al. The accessible chromatin landscape of the human genome. Nature 489, 75–82, doi: 10.1038/nature11232 (2012). [DOI] [PMC free article] [PubMed] [Google Scholar]
- 35.Andersson R et al. An atlas of active enhancers across human cell types and tissues. Nature 507, 455–461, doi: 10.1038/nature12787 (2014). [DOI] [PMC free article] [PubMed] [Google Scholar]
- 36.Li H & Durbin R Fast and accurate long-read alignment with Burrows-Wheeler transform. Bioinformatics 26, 589–595, doi: 10.1093/bioinformatics/btp698 (2010). [DOI] [PMC free article] [PubMed] [Google Scholar]
- 37.Heinz S et al. Simple combinations of lineage-determining transcription factors prime cis-regulatory elements required for macrophage and B cell identities. Mol Cell 38, 576–589, doi: 10.1016/j.molcel.2010.05.004 (2010). [DOI] [PMC free article] [PubMed] [Google Scholar]
- 38.Mathelier A et al. JASPAR 2016: a major expansion and update of the open-access database of transcription factor binding profiles. Nucleic Acids Res 44, D110–115, doi: 10.1093/nar/gkv1176 (2016). [DOI] [PMC free article] [PubMed] [Google Scholar]
- 39.Nitta KR et al. Conservation of transcription factor binding specificities across 600 million years of bilateria evolution. Elife 4, doi: 10.7554/eLife.04837 (2015). [DOI] [PMC free article] [PubMed] [Google Scholar]
- 40.Li H & Durbin R Fast and accurate short read alignment with Burrows-Wheeler transform. Bioinformatics 25, 1754–1760, doi: 10.1093/bioinformatics/btp324 (2009). [DOI] [PMC free article] [PubMed] [Google Scholar]
- 41.Zhou X, Lindsay H & Robinson MD Robustly detecting differential expression in RNA sequencing data using observation weights. Nucleic Acids Res 42, e91, doi: 10.1093/nar/gku310 (2014). [DOI] [PMC free article] [PubMed] [Google Scholar]
- 42.Ritchie ME et al. limma powers differential expression analyses for RNA-sequencing and microarray studies. Nucleic Acids Res 43, e47, doi: 10.1093/nar/gkv007 (2015). [DOI] [PMC free article] [PubMed] [Google Scholar]
- 43.Rao SS et al. A 3D map of the human genome at kilobase resolution reveals principles of chromatin looping. Cell 159, 1665–1680, doi: 10.1016/j.cell.2014.11.021 (2014). [DOI] [PMC free article] [PubMed] [Google Scholar]
- 44.Dixon JR et al. Topological domains in mammalian genomes identified by analysis of chromatin interactions. Nature 485, 376–380, doi: 10.1038/nature11082 (2012). [DOI] [PMC free article] [PubMed] [Google Scholar]
- 45.Durand NC et al. Juicebox Provides a Visualization System for Hi-C Contact Maps with Unlimited Zoom. Cell Syst 3, 99–101, doi: 10.1016/j.cels.2015.07.012 (2016). [DOI] [PMC free article] [PubMed] [Google Scholar]
- 46.Yan J et al. Transcription factor binding in human cells occurs in dense clusters formed around cohesin anchor sites. Cell 154, 801–813, doi: 10.1016/j.cell.2013.07.034 (2013). [DOI] [PubMed] [Google Scholar]
- 47.Zhang Y et al. Model-based analysis of ChIP-Seq (MACS). Genome Biol 9, R137, doi: 10.1186/gb-2008-9-9-r137 (2008). [DOI] [PMC free article] [PubMed] [Google Scholar]
- 48.van de Geijn B, McVicker G, Gilad Y & Pritchard JK WASP: allele-specific software for robust molecular quantitative trait locus discovery. Nat Methods 12, 1061–1063, doi: 10.1038/nmeth.3582 (2015). [DOI] [PMC free article] [PubMed] [Google Scholar]
- 49.McKenna A et al. The Genome Analysis Toolkit: a MapReduce framework for analyzing next-generation DNA sequencing data. Genome Res 20, 1297–1303, doi: 10.1101/gr.107524.110 (2010). [DOI] [PMC free article] [PubMed] [Google Scholar]
- 50.DePristo MA et al. A framework for variation discovery and genotyping using next-generation DNA sequencing data. Nat Genet 43, 491–498, doi: 10.1038/ng.806 (2011). [DOI] [PMC free article] [PubMed] [Google Scholar]
- 51.Van der Auwera GA et al. From FastQ data to high confidence variant calls: the Genome Analysis Toolkit best practices pipeline. Curr Protoc Bioinformatics 43, 11 10 11–33, doi: 10.1002/0471250953.bi1110s43 (2013). [DOI] [PMC free article] [PubMed] [Google Scholar]
- 52.Edge P, Bafna V & Bansal V HapCUT2: robust and accurate haplotype assembly for diverse sequencing technologies. Genome Res 27, 801–812, doi: 10.1101/gr.213462.116 (2017). [DOI] [PMC free article] [PubMed] [Google Scholar]
- 53.Browning SR & Browning BL Rapid and accurate haplotype phasing and missing-data inference for whole-genome association studies by use of localized haplotype clustering. Am J Hum Genet 81, 1084–1097, doi: 10.1086/521987 (2007). [DOI] [PMC free article] [PubMed] [Google Scholar]
- 54.Dobin A et al. STAR: ultrafast universal RNA-seq aligner. Bioinformatics 29, 15–21, doi: 10.1093/bioinformatics/bts635 (2013). [DOI] [PMC free article] [PubMed] [Google Scholar]
- 55.Trapnell C et al. Transcript assembly and quantification by RNA-Seq reveals unannotated transcripts and isoform switching during cell differentiation. Nat Biotechnol 28, 511–515, doi: 10.1038/nbt.1621 (2010). [DOI] [PMC free article] [PubMed] [Google Scholar]
- 56.Anders S, Pyl PT & Huber W HTSeq--a Python framework to work with high-throughput sequencing data. Bioinformatics 31, 166–169, doi: 10.1093/bioinformatics/btu638 (2015). [DOI] [PMC free article] [PubMed] [Google Scholar]
- 57.Harrow J et al. GENCODE: the reference human genome annotation for The ENCODE Project. Genome Res 22, 1760–1774, doi: 10.1101/gr.135350.111 (2012). [DOI] [PMC free article] [PubMed] [Google Scholar]
- 58.Love MI, Huber W & Anders S Moderated estimation of fold change and dispersion for RNA-seq data with DESeq2. Genome Biol 15, 550, doi: 10.1186/s13059-014-0550-8 (2014). [DOI] [PMC free article] [PubMed] [Google Scholar]
- 59.Dennis G Jr. et al. DAVID: Database for Annotation, Visualization, and Integrated Discovery. Genome Biol 4, P3 (2003). [PubMed] [Google Scholar]
- 60.Cock PJ et al. Biopython: freely available Python tools for computational molecular biology and bioinformatics. Bioinformatics 25, 1422–1423, doi: 10.1093/bioinformatics/btp163 (2009). [DOI] [PMC free article] [PubMed] [Google Scholar]
- 61.Zuo C, Shin S & Keles S atSNP: transcription factor binding affinity testing for regulatory SNP detection. Bioinformatics 31, 3353–3355, doi: 10.1093/bioinformatics/btv328 (2015). [DOI] [PMC free article] [PubMed] [Google Scholar]
- 62.Lee D LS-GKM: a new gkm-SVM for large-scale datasets. Bioinformatics 32, 2196–2198, doi: 10.1093/bioinformatics/btw142 (2016). [DOI] [PMC free article] [PubMed] [Google Scholar]
- 63.Robin X et al. pROC: an open-source package for R and S+ to analyze and compare ROC curves. BMC Bioinformatics 12, 77, doi: 10.1186/1471-2105-12-77 (2011). [DOI] [PMC free article] [PubMed] [Google Scholar]
- 64.Finucane HK et al. Partitioning heritability by functional annotation using genome-wide association summary statistics. Nat Genet 47, 1228–1235, doi: 10.1038/ng.3404 (2015). [DOI] [PMC free article] [PubMed] [Google Scholar]
- 65.Dubois PC et al. Multiple common variants for celiac disease influencing immune gene expression. Nat Genet 42, 295–302, doi: 10.1038/ng.543 (2010). [DOI] [PMC free article] [PubMed] [Google Scholar]
- 66.Willer CJ et al. Discovery and refinement of loci associated with lipid levels. Nat Genet 45, 1274–1283, doi: 10.1038/ng.2797 (2013). [DOI] [PMC free article] [PubMed] [Google Scholar]
- 67.Lambert JP et al. Mapping differential interactomes by affinity purification coupled with data-independent mass spectrometry acquisition. Nat Methods 10, 1239–1245, doi: 10.1038/nmeth.2702 (2013). [DOI] [PMC free article] [PubMed] [Google Scholar]
- 68.Okada Y et al. Genetics of rheumatoid arthritis contributes to biology and drug discovery. Nature 506, 376–381, doi: 10.1038/nature12873 (2014). [DOI] [PMC free article] [PubMed] [Google Scholar]
- 69.Schizophrenia Working Group of the Psychiatric Genomics, C. Biological insights from 108 schizophrenia-associated genetic loci. Nature 511, 421–427, doi: 10.1038/nature13595 (2014). [DOI] [PMC free article] [PubMed] [Google Scholar]
- 70.Bentham J et al. Genetic association analyses implicate aberrant regulation of innate and adaptive immunity genes in the pathogenesis of systemic lupus erythematosus. Nat Genet 47, 1457–1464, doi: 10.1038/ng.3434 (2015). [DOI] [PMC free article] [PubMed] [Google Scholar]
- 71.de Lange KM et al. Genome-wide association study implicates immune activation of multiple integrin genes in inflammatory bowel disease. Nat Genet 49, 256–261, doi: 10.1038/ng.3760 (2017). [DOI] [PMC free article] [PubMed] [Google Scholar]
- 72.Nelson CP et al. Association analyses based on false discovery rate implicate new loci for coronary artery disease. Nat Genet 49, 1385–1391, doi: 10.1038/ng.3913 (2017). [DOI] [PubMed] [Google Scholar]
- 73.Wray NR et al. Genome-wide association analyses identify 44 risk variants and refine the genetic architecture of major depression. Nat Genet 50, 668–681, doi: 10.1038/s41588-018-0090-3 (2018). [DOI] [PMC free article] [PubMed] [Google Scholar]
Associated Data
This section collects any data citations, data availability statements, or supplementary materials included in this article.
Supplementary Materials
Data Availability Statement
Sequencing data generated in this study can be accessed via Gene Expression Omnibus (GEO) under accession number GSE118725.
The raw sequencing data of TF ChIP-seq of GM12878 is extracted from the ENCODE portal [https://www.encodeproject.org]. The specific TF data can be accessed by searching the accession ID listed in Supplementary Table S4.
The web portal [http://renlab.sdsc.edu/GVATdb/] provides a searchable interface for SNPs and TFs tested in the current study.
Enriched motifs for SNP-SELEX experiments using Homer are available in Supplementary File S1. Scores for all tested SNP-TF pairs by SNP-SELEX experiments are available in Supplementary File S2. The 94 high-confidence deltaSVM models predicted allelic binding of all common SNPs in the human genome are available in Supplementary File S3.