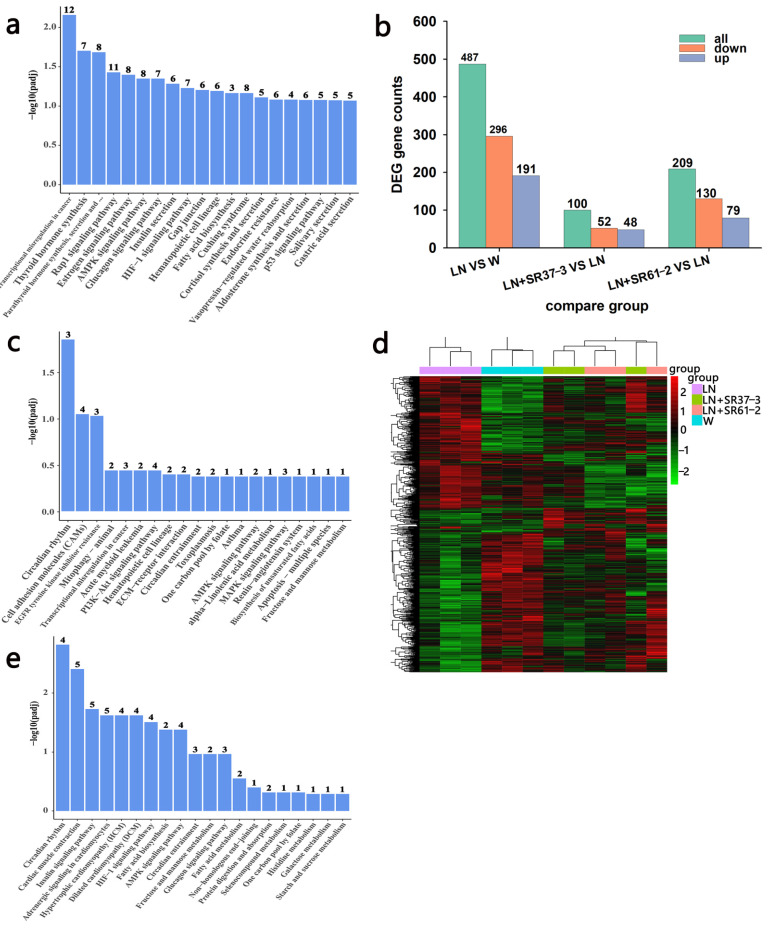
Figure 6.
The functional enrichment and expression profile of DEGs in the thoracic aorta. (a) The KEGG PATHWAY functional enrichment of down-regulated DEGs between the disease group and the control group. (b) The bar chart shows all significant DEGs in each comparison group, including up-regulated or down-regulated genes. (c) The KEGG PATHWAY functional enrichment of up-regulated DEGs between the LN + SR31-3 group and the LN group. (d) Heatmap showing the differentially expressed lncRNAs between different groups. (e) KEGG PATHWAY functional enrichment of up-regulated DEGs between the LN + SR61-2 group and the LN group. cont W: animals not treated with L-NAME receiving standard chow; cont LN: L-NAME-treated rats receiving standard chow; LN + SR37-3: L-NAME treated rats receiving PFM-SR37-3; LN + SR61-2: L-NAME-treated rats receiving PFM-SR61-2.

