Abstract
Drag reduction is a key problem in marine vehicles and fluid transportation industries. Reducing drag strategies and mechanisms need to be further investigated. To explore a bionic approach for reducing flow resistance, experimental and numerical simulation research was conducted to study the drag reduction characteristics of the Paramisgurnus dabryanus surface microstructure. In this study, the large-area flexible surface of the bionic loach scale was prepared by the template method of one-step demoulding. The water tunnel experiment results show that compared with the smooth surface, the drag reduction rate of the bionic surface ranges from 9.42% to 17.25%. And the numerical simulation results indicate that the pressure gradient and low-speed vortex effect created by the bionic loach scales can effectively reduce the friction drag. The results of experimental data and numerical simulation both prove that the bionic scales of Paramisgurnus dabryanus can achieve the underwater drag reduction function. This research provides a reference for drag reduction in marine industries and fluid delivery applications.
The large-area flexible surface of bionic loach scale was prepared by template method, and the bionic scales of Paramisgurnus dabryanus showed have a brilliant drag reduction performance.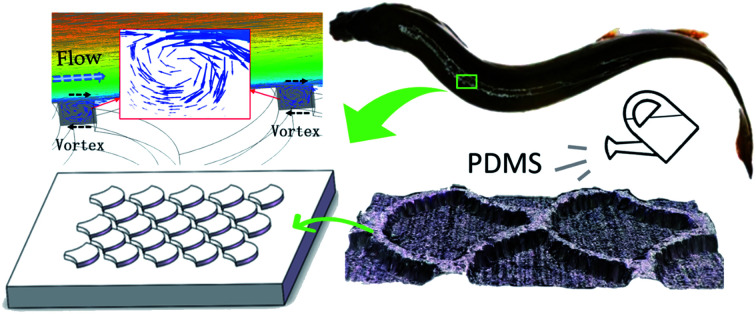
1. Introduction
Reducing energy consumption by improving underwater drag reduction (DR) technology is one of the key research fields currently.1 When submarines and torpedoes move underwater, the surface frictional resistance accounts for 70% of the total resistance, while for ships, it accounts for 80%. If the frictional resistance can be reduced by 10%, the speed and voyage of the ships would increase by 3.57%.2,3 Therefore, reducing surface frictional resistance is of great significance in practical engineering applications such as ships, underwater detectors, submarines, and torpedoes.4
The current methods of fluid drag reduction mainly include microbubble,5 polymer additive,6 superhydrophobic7 and bionic structure8 methods. Injecting airflow into the ship surface to form a layer of bubbles can reduce the frictional resistance. Although this method has a high DR rate, it requires additional energy input and complex devices. The polymer additive reduces the frictional resistance by improving fluid properties, however, frequent additions of additives are required, which likely leading to serious pollution. The superhydrophobic surface reduces the solid–liquid contact area by generating air pockets, thereby achieving the DR function. However, maintaining the air layer and coating durability at high-speed turbulent is a challenge.9 In fact, after billions of years of natural selection, many underwater creatures have evolved body surface structures with drag-reducing functions.10 For example, shark skin is covered with tiny shield scales with drag-reducing grooves.11 Transverse grooves generated by dolphin skinfolds can produce adaptive deformation according to the changes in environmental flow field pressure.12 The special spine-like structure on the body surface of puffer fish can effectively delay the separation of turbulent boundary layers.13 Muthuramalingam et al. studied the DR performance of European sea bass scales and found that the alternating high and low-speed stripes generated by scales in the near-wall region could reduce the drag.14 Chen et al. investigated the coupling DR function of tuna scales and flexible body surface, and the maximum DR rate reached 25.7% due to the vortexes effect of flexible epidermis.15 Wu et al. indicated that the crescent-like microstructure on fish scales could produce a water-trapping effect and thus forming a fluid lubrication film.16 Therefore, the bionic DR methods can be explored by analyzing the DR mechanism of underwater animals' surface microstructure.17
In the preparation of bionic DR materials with microstructures, there are main technologies such as mechanical precision machining, laser etching, 3D printing, direct replication molding and electrochemical machining.18–22 These methods have both advantages and disadvantages. And the advantages including strong adaptability, high precision, disadvantages including complex preparation, expensive processing costs, and rigid materials tend to limit their practical application. To achieve flexible adaptive properties and prepare large-area microstructures, the template method has attracted a great attention of researchers. Munther et al.23 prepared bionic placoid scales produced by micro-molding technique, which utilizes etched silicon molds, can deter microorganism settlement. An et al.24 prepared a bionic shark fin negative template by rolling it on the PVC board, and the bionic surface obtained by PDMS demoulding could effectively realize the drag reduction performance. Meanwhile, the simplicity of the template method and the precision of the prepared surface still need to be improved.
The Paramisgurnus dabryanus loach can swim freely in the complex environment of water or mud, which was treated as a bionic prototype in this study. Due to the flexible deformation of loach's body, tiny scale distribution on the body surface, and the mucus retained on the scales, the DR performance of the loach is maximized.25,26 Although the microstructure of the loach body surface triggers inspiration for the design of the bionic surface and has achieved some positive results on DR and anti-fouling,27–29 further in-depth analysis on DR mechanisms is required and preparation of large-area microstructure for application is a challenge as well. In this study, the scale morphology of the loach was described, and the most appropriate structural characteristic parameters were selected. Computerized numerical control (CNC) precision machining technology was utilized to prepare the anti-structure of bionic scales mold on aluminum substrate, then a bionic scale flexible sample size of 120 mm × 120 mm was obtained by polydimethylsiloxane (PDMS). The friction factor and DR rate of the bionic surface were investigated in a water tunnel bench. To reveal the DR mechanism, the flow field characteristics of the bionic and smooth surface were compared by numerical simulation. This study can lay a preliminary foundation for future application on the surfaces drag reduction of ships, submarines, and other underwater vehicles.
2. Preparation of bionic surface
2.1. Bionic prototype analysis
The loach was anesthetized with ether first. A piece of skin was cut off from the dorsal and immersed in 20% sodium bicarbonate solution for 10 min to remove the mucus. After being rinsed with distilled water, the skin was placed in ethanol with different concentrations (30%, 50%, 70%, 80% and 90%) for 5 min. Then, an ultrasonic cleaner was used to remove impurities on the surface of the skin. The treated sample was observed by a VHX-5000 3D ultra-depth field microscope. All the above treatments did comply with the Chinese law on the Protection of Animals, without any kind of cruel autopsy or abuse. Ethical approval was given by the Animal Experimental Ethical Inspection, Shenyang Agricultural University.
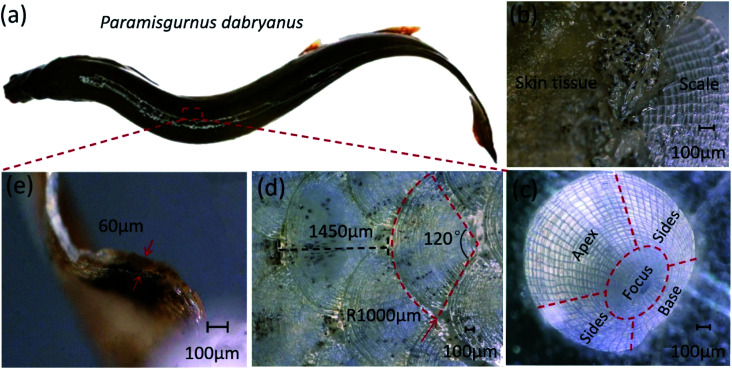
The Paramisgurnus dabryanus loach scales observed under the microscope are shown in Fig. 1. The scale is visible beneath the skin tissue with a black pattern (Fig. 1(b)). A single scale is approximately circular (Fig. 1(c)) and the entire scale was divided into four parts. The apex region is exposed to the outside to resist the friction of water, and the remaining three regions are covered by the surrounding scales. The overall distribution of scales is shown in Fig. 1(d). The exposed regions evenly distributed as fan shapes, with a central angle of approximately 120°, the scale radius is 1000 μm, the distribution distance from adjacent scales is 1450 μm, and the thickness is about 60 μm (Fig. 1(e)).
Fig. 1. Morphological observation of loach scales. (a) P. Dabryanus loach. (b) Scale beneath the skin. (c) Different regions on a single scale. (d) Size and arrangement of scales. (e) Thickness of a scale.
2.2. Fabrication of bionic scale surface
To facilitate processing, the scale structure was simplified. Based on the similarity principle, the parameters of height, distribution distance and inclined angle were adjusted, and the final determination of the results is shown in Fig. 2. The radius (R) of scale and auxiliary circles are 600 μm, the height (H) of scale is 100 μm, with no inclined angle, the array distribution distance (B) is 860 μm, and the shape parameter (C) is 720 μm.
Fig. 2. Bionic scale 3D visualization model.
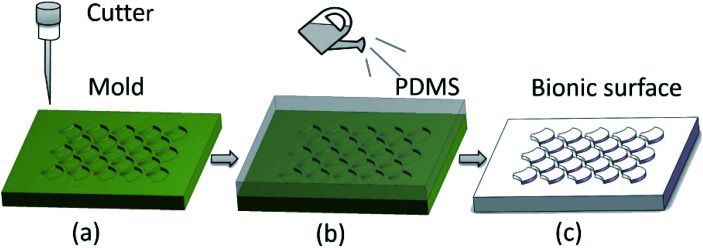
The templating method can be used for preparation of large-area flexible microstructures, usually consisting of two steps. Namely, step 1, preparing a mold for reproducing bionic structures, step 2, selecting suitable flexible materials to obtain the structured surface by die-casting.30Fig. 3 shows the preparation process of template method in this study.
Fig. 3. Preparation process of bionic scales. (a) CNC precision machining. (b) PDMS die casting. (c) Flexible bionic surface.
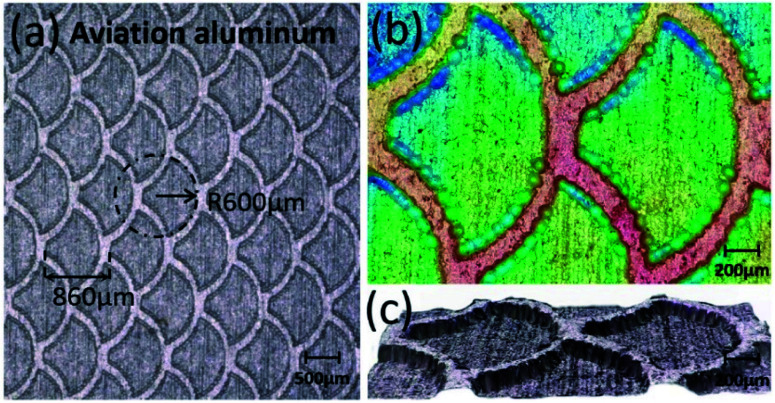
The anti-structure of the bionic scale was machined on the surface of aluminum by the CNC precision machining method. The 3D model of the anti-structure was built and transferred to the control end of CNC machining system. Then, the 30 μm single crystal diamond tool was selected to mill tens of thousands of evenly distributed anti-structures on the surface of an aluminum substrate. The size of the aluminum substrate is 120 mm × 120 mm, and the thickness is 5 mm. Fig. 4 shows the prepared anti-structures.
Fig. 4. Anti-structure surface. (a) Dimensions and overall distribution. (b) 3D image of topography. (c) 3D image of anti-structure.
Polydimethylsiloxane (PDMS) is a material with ideal chemical stability, elasticity, hydrophobicity, nontoxicity, and harmlessness.31 Hence, the PDMS was chosen as the main material for the preparation of flexible bionic scales surfaces. PDMS is usually a colorless liquid with high viscosity, which can be cured at a certain temperature after reacting with the curing agent. The preparation process of the flexible bionic surface was the followings:32 (i) an appropriate amount of dry release agent was sprayed on the surface of the aluminum substrate mold; (ii) the mixture of liquid PDMS and curing agent with a mass ratio of 10 : 1 was magnetically stirred for 15 min; (iii) the mixture was put into a vacuum drying oven and vacuumized repeatedly for 20 min, and the degree of vacuum was kept at −100 kPa to remove the bubbles existing in the solution; (iv) the mixture was slowly poured into the center of the aluminum substrate until the mold was filled, and the excess material was scraped off to ensure that the top surface was horizontal; (v) the mold with the PDMS cast was placed in a drying oven and cured at 80 °C for 8 h; (vi) demoulding carefully and cleaning the samples.
Fig. 5 shows the processed PDMS flexible bionic surface. The structural parameters of prepared bionic surface were consistent with the 3D model and had a high similarity with the surface morphology of the loach. To compare and test the drag reduction effect of the bionic structure, the PDMS flexible smooth sample was also prepared with the same thickness and size of the bionic surface.
Fig. 5. The bionic sample. (a) Rigid anti-structure and flexible PDMS structure. (b) Dimensions and overall distribution of flexible PDMS surface. (c) 3D topographies image.
3. Methods
3.1. Water tunnel experiment
The drag reduction performance of the fabricated flexible bionic sample was tested by a self-built water tunnel experiment bench.
3.1.1. Setup of the water tunnel bench
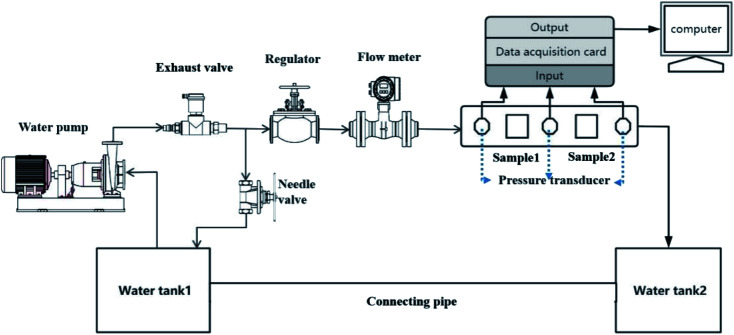
The test bench was composed of flowmeter, pump, regulating valve, needle valve, exhaust valve, pressure transducers, data acquisition system, LabVIEW program, stainless steel water tank and circulating pipeline. The water tunnel experimental device was shown in Fig. 6. The total length of the test section was 580 mm, and the cross-section was a rectangle of 70 mm (width) × 8 mm (height). The circulating medium was 20 °C water. The water was pumped out of tank 1, through the pipe into the test section, then into tank 2 and recycled to tank 1. The flow rate could be changed by adjusting the regulator, a needle valve was used for fine tuning. The fluid velocity measurement ranged from 0.78 m s−1 to 4.74 m s−1 which was recorded by the flowmeter. The experimental system was tested for leaks and was degassed before use. All the experimental data were recorded after the system reached the steady state.
Fig. 6. Water tunnel experiment bench.
3.1.2. Accuracy calibration and reproducibility verification
The pressure drop and flow rate of the test section were calibrated for accuracy before the testing. The test section was measured by the TXY815 pressure transducers which were calibrated by a pressure calibrator within 2 kPa. The electromagnetic flowmeter TXY920 with a range of 0–18 m3 h−1 had an accuracy of 0.5. Considering the measurement error of the flow rate after passing through various pipe fittings, the measurement volume method was used to calibrate the flow rate. Three repeated tests were conducted on smooth and bionic samples at different experimental conditions to verify the reproducibility of the test results. The results showed that the pressure drops of the three tests were nearly the same, and whose relative standard deviations were less than 5%.
3.1.3. Method of drag reduction evaluation
The test bench measured the flow resistance by calculating the pressure drop between the front and rear of the samples. The pressures of the bionic/smooth samples were measured by three transducers respectively, and the data was recorded by LabVIEW software. The flow rate Q can be calculated by eqn (1):
| 1 |
where D is the hydraulic diameter of the test section, U is the flow velocity.
The drag reduction rate η of the flexible surface with a bionic fish scale structure can be calculated by eqn (2):
| 2 |
where λs and λb are the friction factors of smooth surface and bionic surface respectively.
The frictional head loss Hf of the sample surface can be calculated by eqn (3):
| 3 |
where Δp is the pressure drop of the text section, γ is the unit weight of water, and l is the length of the test section.
Substituting eqn (1) and (3) by eqn (2), η of the bionic surface is given by:
| 4 |
where Δpb, Δps are the pressure drop of bionic surface and smooth surface respectively, Qb, Qs are the flow volume of bionic and smooth surface respectively.33
3.2. Numerical simulation analysis
In this study, ANSYS 19.1 software was used to explore and analyze the drag reduction effect and mechanism of bionic scales.
3.2.1. Setting of initial conditions
To simulate the fluid flow in the near-wall region, a three-dimensional computational domain as shown in Fig. 7 was selected. According to the geometrical characteristics of the bionic structure, the finite volume method was used to discretely generate meshes and the mesh of the bionic scale region was refined.
Fig. 7. Computational domain model.
This study treated the fluid as a transient incompressible fluid. “RNG k-epsilon (2 eqn)” was selected as the turbulence model for better dealing with flows with high strain rates and a large degree of streamline bending, and the “Enhanced Wall Treatment” function was used to process the near-wall area. The medium of the flow field was liquid water with a density of 998.2 kg m−3 and a dynamic viscosity of 0.001 Pa s. In the boundary conditions, the inlet velocity was selected as “Magnitude, normal to Boundary”. The turbulence intensity and hydraulic diameter in the specification method were calculated according to eqn (5):
| I = 0.16(Re)−1/8(Re = ρμL/μ) | 5 |
where I represents turbulence intensity; Re is Reynolds number; ρ represents fluid density; u is the average velocity of the fluid; μ is the viscosity of fluid; L is the characteristic length. “Simplec” was chosen for the pressure–velocity coupling scheme, and the momentum equation was discretized in a “second-order upwind” scheme to ensure accuracy and stability.
3.2.2. Drag reduction evaluation
By comparing the average resistance of the smooth surface and the bionic surface, the drag reduction rate of the bionic scale can be calculated by eqn (6):
| 6 |
where η is drag reduction rate (%); Fs and Fb are the total resistance (N) of the smooth surface and bionic surface respectively.
4. Results and discussions
4.1. Friction factor and drag reduction results
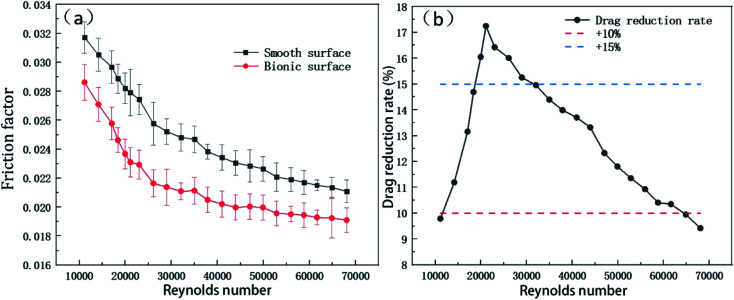
The prepared flexible bionic sample and flexible smooth sample were installed in the test section of the water tunnel experiment bench. The average pressure drops at both ends of the bionic sample and smooth sample were collected respectively. The water tunnel experiment results are shown in Fig. 8(a), and the friction factor of bionic surface ranging from 0.0191 to 0.0286, while it changes from 0.0211 to 0.0317 for smooth surface. As the flow velocity increases, the friction factor decreases, meanwhile, the friction factor of bionic surface is always lower than that of the smooth sample. The change of the curve slope is due to the fact that the thickness of boundary sublayer varies with Reynolds number, resulting in the variation of acting forces intensity.
Fig. 8. Results of water tunnel experiment. (a) Friction factor distribution. (b) Drag reduction rate at different Reynolds numbers.
The experimental DR rate is depicted in Fig. 8(b), and the findings indicate that DR rate ranges from 9.42% to 17.25%, showing first increase and then decrease with an increasing Reynolds number. Fig. 8(b) shows that the surface of the bionic scale can achieve drag reduction function in these experimental conditions.
To compare the bionic structures DR effect of this study with that in other research works, the relevant data of shark scales, grass carp scales et al. were collected and listed in Table 1. The comparison demonstrates that the DR rate of this study is relatively good compared with other literature, and different types of bionic structures have their own characteristics, influencing the boundary layer between fluid and wall.
Comparison of various bionic drag-reduction.
| Bionic structure | Flow velocity (m s−1) | Drag reduction rate (%) | Main reasons |
|---|---|---|---|
| Shark skin and bird feathers33 | 3.18–18.56 | −0.62–3.21 | Vortex cushioning and driving effects |
| European sea bass scale34 | 0.15 | 27.00 | Delayed turbulent transition |
| Grass carp scales35 | 0.66–0.74 | 2.58–2.81 | Forming a fluid-lubrication layer |
| Shark skin riblet36 | 2.50–6.50 | 21.73–23.85 | Reducing effective contact area |
| Shark skin denticles11 | 0.07–0.10 | 2.20–7.30 | Significant ability to control areas of fluid |
| Loach scales [this study] | 0.78–4.74 | 9.24–17.25 | Pressure gradient and low-speed vortex effects |
The drag reduction improvement of the bionic surface is due to the fact that the bionic scale structure has a significant effect on the fluid field and boundary layer, thus reducing the friction of surrounding wall. What's more, it is believed that the microstructure grooves can reduce the contact area between the surface and the fluid. The deliberately manufactured scales could reduce the amplitude of convective lamination, improve aerodynamic performance, and weakening turbulent boundary layers, similarly with other research works.37,38 Meanwhile, the surface wettability has a positive impact on flow resistance.39 The contact angles of the smooth/bionic flexible sample in this study are measured by contact angle instrument (DSA-25A). Fig. 9 displays that the contact angle of the flexible smooth surface and the bionic surfaces are 84° and 110° respectively, indicating that the bionic scale structure can improve the hydrophobicity, resulting in the improvement of drag reduction.
Fig. 9. Surface wettability. (a) The contact angle of the smooth surface. (b) The contact angle of the bionic surface.
4.2. Numerical simulation results and mechanism analysis
It is impossible to directly observe the microscopic phenomena of fluid on the water tunnel bench, so the process transfer and drag reduction mechanism was analyzed by numerical simulation.
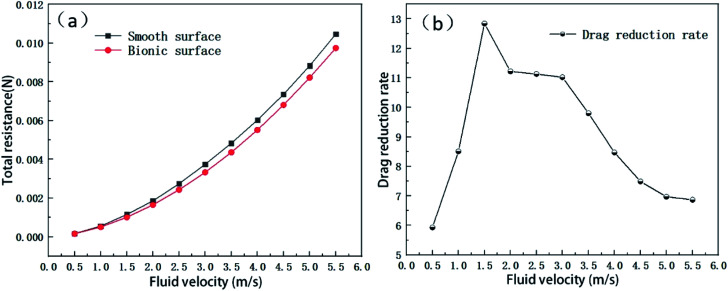
The difference of drag reduction effect between bionic scale surface and smooth surface was simulated under the flow velocity of 0.5–5.5 m s−1. The simulation results are exhibited in Fig. 10.
Fig. 10. Resistance simulation results. (a) Total resistance distribution; (b) drag reduction rate distribution.
The total flow resistance of the bionic surface is always lower than that of smooth surface (Fig. 10(a)). At the flow velocity of 1.5 m s−1, the drag reduction rate reaches a maximum of 12.84% and then decreases gradually with the increase of flow velocity (Fig. 10(b)). The overall trend of the numerical simulation results is almost the same with the water tunnel experimental data, and both reach the peak value of around 1.5 m s−1. Therefore, it should be feasible to reduce the flow resistance by bionic scales theoretically.
By analyzing and comparing the flow field characteristics of the bionic surface and the smooth surface at the flow velocity of 1.5 m s−1, the drag reduction mechanism of the bionic scale is discussed as followed.
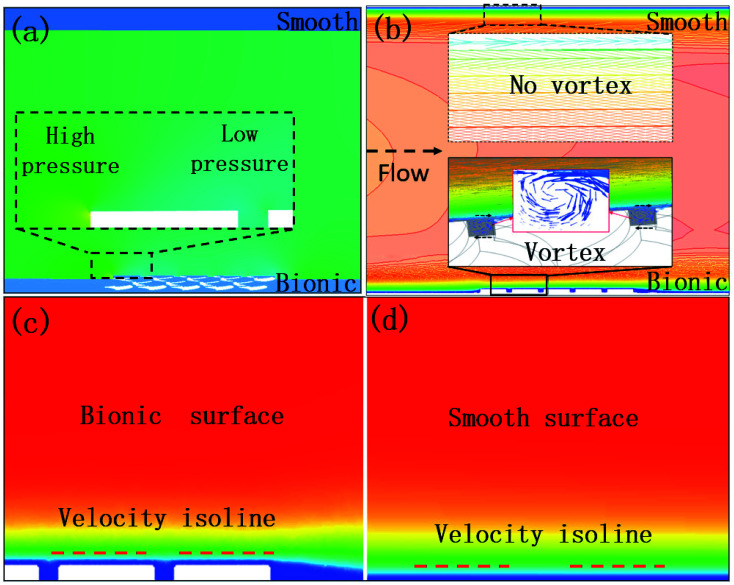
Fig. 11 shows the distributions of pressure and velocity in the near-wall region. Fig. 11(a) displays the near-wall pressure contour, and the black wireframe is a partially enlarged view of the bionic wall. Due to the stable low-pressure area in the bionic scale area, fluid can be absorbed from the surrounding area, and the high-pressure areas will also cause the fluid flowing into the low-pressure area, to ensure that the scale area will be fully filled by fluid. This area can be regarded as a fluid lubrication layer, which changes the hydrodynamic properties of the surface and facilitates the contact between liquid and substrate to become liquid–liquid contact, thus reducing the flow resistance.40,41
Fig. 11. Distributions of pressure and velocity. (a) Near-wall pressure contour. (b) Velocity vector diagram. (c) Bionic surface velocity contour. (d) Smooth surface velocity contour.
As shown in Fig. 11(b), the vortices are formed in the front and rear of the bionic scales, while there is no vortex formed on the smooth surface. The vortices cause buffering effect, which resembles rolling bearings in the scale structure, and convert the sliding friction between the solid–liquid interface into the rolling friction between the two liquid interfaces. Meanwhile, the flow direction above the vortex is same with the fluid velocity direction, which can facilitate the fluid flow. Owing to the existence of vortices, a large amount of low-velocity fluid accumulates between adjacent scales. Therefore, water film is formed on the scales, which drives the high-speed fluid away from the near-wall region, and reducing the near-wall velocity, and weakening the turbulence effectively.42 Hence, the appearance of vortex on the bionic surface can reduce the resistance.
Fig. 11(c) and (d) displays the locally magnified bionic/smooth near-wall velocity contours on the XY plane in the fluid domain. The low-speed area of the bionic scale surface is larger than that of the smooth surface. The red dotted lines in this figure are the contour lines of the speed of 0.45 m s−1. The bionic scales increase the thickness of the boundary layer near the wall surface, thereby achieving the effect of drag reduction.
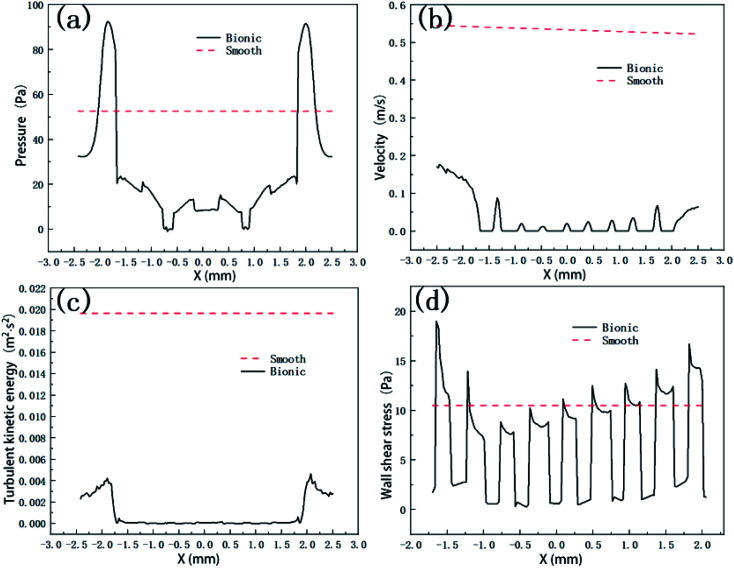
To analyze the variation of the flow field for two surfaces, the vertical centerlines ‘SL’ and ‘BL’, the horizontal centerlines ‘ST’ and ‘BT’ on smooth and bionic surfaces are elected as the auxiliary lines respectively. And line ‘BO’ is where scales overlap in bionic surface, and line ‘SO’ is in the same position of smooth surface. All the line lengths are 5 mm. The results are shown in Fig. 12.
Fig. 12. Flow field variation. (a) The pressure distribution curves of line ST and BT. (b) Velocity distribution curves of line SO and BO. (c) Turbulent kinetic energy distribution curves of line SL and BL. (d) Wall shear stress distribution curves of line SO and BO.
The average values of pressure, velocity, turbulent kinetic energy, and wall shear stress in the bionic near wall region are always lower than that in the smooth near-wall region at the same position. The fluid between the high-pressure area and the low-pressure area is affected by the pressure gradient, which can increase the driving force of the fluid, also offsets part of the viscous resistance during the flow process, and results in achieving the effect of drag reduction. Due to the existence of low-velocity vortices, a large amount of low-velocity fluid accumulates between adjacent scales, forming a water film, thus changing the flow field characteristics in the bionic wall.
Turbulent kinetic energy can reflect the intensity of energy exchange and transformation and is an index to measure the development or decline of turbulence. It can be obtained by eqn (7):
| K = 1.5(uI)2 | 7 |
where K is the turbulent kinetic energy, u is the average velocity, I is the turbulence intensity. The Reynolds stress refers to the additional stress caused by the exchange of pulsating momentum in the Reynolds equation. The turbulence intensity is equal to the ratio of the turbulent pulsation velocity to the average velocity, so the turbulence intensity can reflect the Reynolds stress. The value of turbulent kinetic energy at the bionic scales area is almost 0, indicating that there is less energy exchange and loss in this area, which reduces the Reynolds stress and thus reduces the flow resistance near the wall.
The interaction between the fluid and the wall creates wall shear stress. The wall shear stress can be obtained through eqn (8):
| 8 |
where τ is the shear stress (Pa), μ is the dynamic viscosity of the fluid (Pa s); du/dy is the velocity gradient (1 s−1). The existence of the bionic scales reduces the total shear stress so that the velocity gradient of the bionic wall is lower than that of the smooth wall. Thereby, it can be concluded that the viscous shear stress near the bionic wall is smaller, which is the main reason for the decrease of the viscous resistance.
5. Conclusions
In this study, a bionic loach scale drag reduction surface was investigated, and the following conclusions could be drawn:
The surface of Paramisgurnus dabryanus was covered with regularly distributed scales, and the exposed apical area of the scale was imitated to build a 3D model. The flexible surface like the living loach scale morphology was prepared by using template method to solidify PDMS. This preparation method could encourage the large area of bionic surface fabrication and practical application of drag-reducing materials.
The drag reduction function of the bionic sample was confirmed on a home-made water tunnel test bench. The results show that, the bionic surface has brilliant drag reduction performance and the drag reduction rate ranging from 9.42% to 17.25%. The improvement is mainly caused by the positive effect of bionic surface on the fluid field and boundary layer, and the larger water contact angle of bionic surface. The numerical simulation analysis confirms that a fluid lubricating layer and low-speed vortex are formed on the bionic structure, meanwhile, wall shear stress and turbulent kinetic energy on bionic surface are much lower than those for smooth surface. The above changes of flow field characteristics caused by bionic scales all play positive roles in improving drag reduction.
This research provides a methodological reference for the study of bionic flexible sample preparation and drag reduction mechanism, which lays a theoretical foundation for the study of drag reduction on the surfaces of underwater vehicles and fluid transportation.
Author contributions
Methodology, L. W. and X. F.; writing of the manuscript, L. W. and G. L.; establishment of the model, F. H., experimental data processing, G. L. and L. C., validation, S. W.; result discussion, G. L., L. W. and X. F.
Conflicts of interest
The authors declare there is no conflict of interest.
Supplementary Material
Acknowledgments
This study was supported by the National Natural Science Foundation of China (No. 51305282); Key Research Plan of Liaoning of China (No. 2020JH2/10700001); General Program of Department of Education of Liaoning Province of China (No. LJKZ0693).
References
- Zhang Y. Feng X. Tian G. Jia C. ACS Biomater. Sci. Eng. 2022;8(2):460–469. doi: 10.1021/acsbiomaterials.1c01049. [DOI] [PubMed] [Google Scholar]
- Rong W. Zhang H. Mao Z. Chen L. Liu X. ACS Omega. 2022;7:2049–2063. doi: 10.1021/acsomega.1c05507. [DOI] [PMC free article] [PubMed] [Google Scholar]
- Sindagi S. Vijayakumar R. Ships Offshore Struct. 2020;16:968–979. doi: 10.1080/17445302.2020.1790296. [DOI] [Google Scholar]
- Wu T. Chen W. Zhao A. He P. Chen H. Ocean Eng. 2020;218:107902. doi: 10.1016/j.oceaneng.2020.107902. [DOI] [Google Scholar]
- Kumagai I. Takahashi Y. Murai Y. Ocean Eng. 2015;95:183–194. doi: 10.1016/j.oceaneng.2014.11.019. [DOI] [Google Scholar]
- Gong W. Shen J. Dai W. Li K. Gong M. Int. J. Heat Mass Transfer. 2021;172:121152. doi: 10.1016/j.ijheatmasstransfer.2021.121152. [DOI] [Google Scholar]
- Zhang Y. Zhang Z. Yang J. Yue Y. Zhang H. Nanomaterials. 2022;12:44. doi: 10.3390/nano12010044. [DOI] [PMC free article] [PubMed] [Google Scholar]
- Barraza B. Moya F. Montecinos G. Ortega J. Rosenkranz A. Tamburrino A. Palza H. Sci. Technol. Adv. Mater. 2022;23:300–321. doi: 10.1080/14686996.2022.2063035. [DOI] [PMC free article] [PubMed] [Google Scholar]
- Feng X. Fan D. Tian G. Zhang Y. ACS Appl. Mater. Interfaces. 2022;14(28):32747–32760. doi: 10.1021/acsami.2c08513. [DOI] [PubMed] [Google Scholar]
- Tian G. Zhang Y. Feng X. Hu Y. Adv. Eng. Mater. 2021;2100696:1–25. [Google Scholar]
- Qin L. Ma Z. Sun H. Lu S. Zeng Q. Zhang Y. Dong G. Surf. Coat. Technol. 2021;427:127836. doi: 10.1016/j.surfcoat.2021.127836. [DOI] [Google Scholar]
- Tian G. Fan D. Feng X. Zhou H. RSC Adv. 2021;11:3399–3428. doi: 10.1039/D0RA08672J. [DOI] [PMC free article] [PubMed] [Google Scholar]
- Fan D. Feng X. Tian G. Zhang Y. Langmuir. 2021;37(40):11804–11817. doi: 10.1021/acs.langmuir.1c01745. [DOI] [PubMed] [Google Scholar]
- Muthuramalingam M. Villemin L. S. Briecker C. J. Exp. Biol. 2019;222:205963. doi: 10.1242/jeb.205963. [DOI] [PubMed] [Google Scholar]
- Chen D. Cui X. Chen H. Microsc. Res. Tech. 2021;84:1862–1872. doi: 10.1002/jemt.23743. [DOI] [PubMed] [Google Scholar]
- Wu L. Jiao Z. Song Y. Ren W. Niu S. Han Z. Sci. China: Technol. Sci. 2017;60(7):1111–1117. doi: 10.1007/s11431-016-0630-x. [DOI] [Google Scholar]
- Arzt E. Quan H. McMeeking R. M. Hensel R. Mater Sci. 2021;120:100823. [Google Scholar]
- Boswell B. Islam M. Davies I. Int. J. Adv. Manuf. Technol. 2018;94:789–806. doi: 10.1007/s00170-017-0912-y. [DOI] [Google Scholar]
- Wang Y. Zhang Z. Xu J. Yu H. Surf. Coat. Technol. 2021;409:126801. doi: 10.1016/j.surfcoat.2020.126801. [DOI] [Google Scholar]
- Domel A. G. Domel G. Weaver J. C. Saadat M. Bertoldi K. Lauder G. V. Bioinspiration Biomimetics. 2018;13(5):056014. doi: 10.1088/1748-3190/aad418. [DOI] [PubMed] [Google Scholar]
- Yun X. Xiong Z. He Y. Wang X. RSC Adv. 2020;10(9):5478–5486. doi: 10.1039/C9RA10373B. [DOI] [PMC free article] [PubMed] [Google Scholar]
- Liu J. Fang X. Zhu C. Xing X. Cui G. Li Z. Colloids Surf., A. 2020;607:125498. doi: 10.1016/j.colsurfa.2020.125498. [DOI] [Google Scholar]
- Munther M. Palma T. Angeron I. Salari S. Ghassemi H. Vasefi M. Beheshti A. Davami K. Appl. Surf. Sci. 2018;453:166–172. doi: 10.1016/j.apsusc.2018.05.030. [DOI] [Google Scholar]
- An Q. Zhang B. Liu G. Yang W. Zhao H. Wang J. Wang L. J. Taiwan Inst. Chem. Eng. 2019;97:389–396. doi: 10.1016/j.jtice.2019.01.015. [DOI] [Google Scholar]
- Yan M. Gu Y. Ma L. Tang J. He C. Zhang J. Mou J. Appl. Bionics Biomech. 2022;4485365:1–19. doi: 10.1155/2022/4485365. [DOI] [PMC free article] [PubMed] [Google Scholar]
- Chae B. Seo E. Kim H. J. Kim J. Lee S. J. Vib. Spectrosc. 2022;118:103338. doi: 10.1016/j.vibspec.2022.103338. [DOI] [Google Scholar]
- Seo E. Park J. Gil J. Lim H. Lee D. Lee S. J. Prog. Org. Coat. 2021;158:106383. doi: 10.1016/j.porgcoat.2021.106383. [DOI] [Google Scholar]
- Wu L. Wang H. Song Y. Zhang B. Xu Y. Liu C. Yan Y. Sci. Rep. 2020;10:12873. doi: 10.1038/s41598-020-69801-6. [DOI] [PMC free article] [PubMed] [Google Scholar]
- Wu L. Wang J. Luo G. Wang S. Qu J. Fan X. Liu C. Coatings. 2021;11:1357. doi: 10.3390/coatings11111357. [DOI] [Google Scholar]
- Jin H. Tian L. Bing W. Zhao J. Ren L. Prog. Mater. Sci. 2022;124:100889. doi: 10.1016/j.pmatsci.2021.100889. [DOI] [Google Scholar]
- Stafie N. Stamatialis D. Wessling M. Sep. Purif. Technol. 2005;45:220–231. doi: 10.1016/j.seppur.2005.04.001. [DOI] [Google Scholar]
- Wang H. Luo G. Chen L. Song Y. Liu C. Wu L. RSC Adv. 2022;12:16723. doi: 10.1039/D2RA01495E. [DOI] [PMC free article] [PubMed] [Google Scholar]
- Liu W. Ni H. Wang P. Zhou Y. Beilstein J. Nanotechnol. 2020;11:24–40. doi: 10.3762/bjnano.11.3. [DOI] [PMC free article] [PubMed] [Google Scholar]
- Muthuramalingam M. Puckert D. Rist U. Bruecker C. Sci. Rep. 2020;10:14534. doi: 10.1038/s41598-020-71434-8. [DOI] [PMC free article] [PubMed] [Google Scholar]
- Wu L. Jiao Z. Song Y. Liu C. Wang H. Yan Y. Sci. Rep. 2018;8:12186. doi: 10.1038/s41598-018-30490-x. [DOI] [PMC free article] [PubMed] [Google Scholar]
- Fu Y. Yuan C. Bai X. Biosurf. Biotribol. 2017;3:11–24. doi: 10.1016/j.bsbt.2017.02.001. [DOI] [Google Scholar]
- August G. Mehdi S. James C. Hossein H. Katia B. George V. J. R. Soc., Interface. 2018;15:1–9. [Google Scholar]
- Liu G. Yuan Z. Qiu Z. Feng S. Xie Y. Leng D. Tian X. Ocean Eng. 2020;199:106962. doi: 10.1016/j.oceaneng.2020.106962. [DOI] [Google Scholar]
- Yong C. Bharat B. J. Phys.: Condens. Matter. 2012;22:035104. [Google Scholar]
- Zhu Z. Li J. Peng H. Liu D. Machines. 2021;12:656. [Google Scholar]
- Shen Y. Tao J. Tao H. Chen S. Pan L. Wang T. Langmuir. 2015:10. doi: 10.1021/acs.langmuir.5b02946. [DOI] [PubMed] [Google Scholar]
- Hussain H. Desmond C. Jundika C. Therm. Sci. 2020;24:2793–2808. doi: 10.2298/TSCI190909059A. [DOI] [Google Scholar]


