Abstract
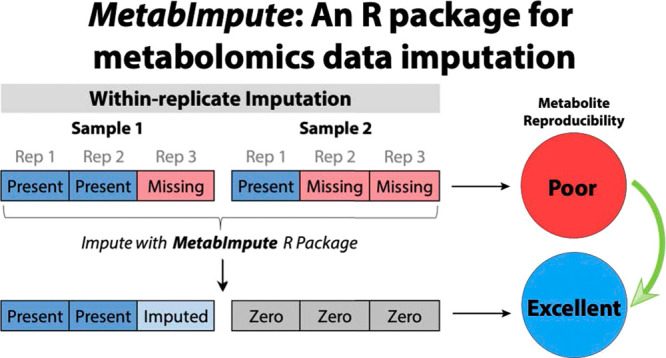
Missing data is a significant issue in metabolomics that is often neglected when conducting data preprocessing, particularly when it comes to imputation. This can have serious implications for downstream statistical analyses and lead to misleading or uninterpretable inferences. In this study, we aim to identify the primary types of missingness that affect untargeted metabolomics data and compare strategies for imputation using two real-world comprehensive two-dimensional gas chromatography (GC × GC) data sets. We also present these goals in the context of experimental replication whereby imputation is conducted in a within-replicate-based fashion—the first description and evaluation of this strategy—and introduce an R package MetabImpute to carry out these analyses. Our results conclude that, in these two GC × GC data sets, missingness was most likely of the missing at-random (MAR) and missing not-at-random (MNAR) types as opposed to missing completely at-random (MCAR). Gibbs sampler imputation and Random Forest gave the best results when imputing MAR and MNAR compared against single-value imputation (zero, minimum, mean, median, and half-minimum) and other more sophisticated approaches (Bayesian principal component analysis and quantile regression imputation for left-censored data). When samples are replicated, within-replicate imputation approaches led to an increase in the reproducibility of peak quantification compared to imputation that ignores replication, suggesting that imputing with respect to replication may preserve potentially important features in downstream analyses for biomarker discovery.
Untargeted metabolomics analyses geared toward biomarker discovery are at the forefront of the clinical metabolomics field. Mass spectrometry hyphenated with chromatography, including gas and liquid chromatography (GC and LC, respectively), are commonly used methods for investigating the metabolism of various systems, including in vitro microbial and tissue cultures and ex vivo samples such as blood, urine, and breath. The use of multidimensional chromatography (e.g., GC × GC and LC × LC) is a significant advancement over traditional one-dimensional chromatography in that it allows for the characterization of a much larger number of metabolites in these highly complex samples.1−3 It is especially common in untargeted analyses using GC × GC or LC × LC to detect several thousands of compounds. This increase in chromatographic capacity, however, presents challenges in data preprocessing and downstream statistical analyses.2 In addition to the high-dimensional nature of the acquired data, which typically yields many more features than samples, high instances of missing values—upward of 80% for some features—is a major problem. Missing data severely limit even the most robust tools available in the statistical toolkit, creating uncertainty around population estimators of location (means, medians) and dispersion (variances). This decreases statistical power and can lead to inconclusive or misleading inferences. Subsequently, more sophisticated multivariate and statistical learning approaches are also handicapped.
Missing values in metabolomics data sets arise from a variety of technical and biological sources. Data points can be absent because of instrumental limitations (e.g., detection limits), ineffective processing of the acquired data, or because the peaks are truly not present in the sample. These drivers can be broadly classified into three missingness mechanisms: missing completely at-random (MCAR), missing at-random (MAR), and missing not-at-random (MNAR).4,5 Data points are MCAR if they are missing due to wholly random events or errors, not related to whether data are present or absent, and occur over the entirety of the data distribution.4 For example, in volatile metabolomics, data points missing due to issues with sample preparation techniques or an instrumental issue can be deemed MCAR. Missingness of the MAR type are data points whose missingness is dependent on or associated with other observed values.4 This can arise as a result of suboptimal data processing steps related to peak alignment and/or deconvolution or from the choice of a sampling modality or chromatographic column that is selective for some chemical characteristics (e.g., polarity) over others. Finally, MNAR is due to the variable itself, for example, data that are missing due to factors such as limits of quantification or detection (LOQ or LOD, respectively).4,6
One of the most common strategies for handling missing data is a combination of removing features that have high proportions of missingness and replacing the remaining missing data points with zero. An application of this approach is the “80% rule” whereby features that have missing data points in more than 20% of samples (i.e., “frequency of observation” <80%) are removed from the data set, after which the remaining missing values are replaced with zeros.7 A variation of the 80% rule aimed at reducing the possibility of losing potentially important features is the “modified 80% rule,” which restricts the rule to within sample groups or classes.8 While this can reduce the sparsity of the data set, a disadvantage of imputing missing data points to zero (or to a similarly small value such as half of the global minimum) is skewing the distribution or underestimating measures of variance,9 despite the assumption that the missingness might be due to the LOD and the distribution is left-censored. As such, it is important that more careful thought be given to addressing missingness in metabolomics data, and the implications on preprocessing and downstream statistical analyses, especially as they relate to the missingness type.
Characterizing the missingness type is challenging, primarily due to the difficulty of identifying the mechanisms that led to the missingness; this creates problems because many imputation solutions require the missingness type be known.10 While it may be possible to test for a necessary condition of MCAR explicitly, this is not the case for MAR.10 Testing for MAR versus MNAR is also difficult unless there is a strong a priori assumption for MNAR.11 When testing for MAR versus MCAR, it is important to note that because MAR is a condition of MCAR, tests of MCAR are thus only testing a necessary condition of that missingness type and should only be applied if an assumption of MAR holds a priori.10 In addition, the missingness type falls into two general categories of “ignorable” and “nonignorable.”10 MCAR and MAR can be considered ignorable in that virtually any imputation method can be used without serious negative consequences. There are numerous approaches for testing the condition of MCAR and MAR against the MNAR alternative, including Little’s test (for MCAR) and likelihood ratio tests (MAR versus MNAR, although only if there is a strong a priori assumption for MNAR).10 MNAR is considered nonignorable, and the imputation approach used should be carefully considered. Addressing missingness of this type is difficult in part due to the ambiguity surrounding its driver(s). Consequently, tests for MNAR are much more limited and generally not confident in evaluating the MNAR assumption.10
In an effort to better understand missingness mechanisms and their implications for preprocessing in untargeted metabolomics data, we explore two real-world GC × GC data sets. We have three goals for this study. First, we aim to gain some level of insight into the missingness mechanism(s) of multidimensional metabolomics data. Second, based on inferences surrounding missingness type, we compare the performance of nine widely known methods for imputing missing data: zero, mean, median, minimum, half-minimum (HM), Random Forest (RF), Bayesian principal component analysis (BPCA), quantile regression imputation of left-censored data (QRILC), and Gibbs sampler imputation (GSImp). Third, we introduce an imputation approach that takes into account the availability of replicate measurements in the data set and the effect of imputation on reproducibility. Analyzing samples in replicate can provide valuable information about missing values, specifically to the question of whether they are “truly” missing or rather missing due to stochastic events. This approach, along with strategies to assist in evaluating missingness in metabolomics data sets, is wrapped into an R package we created called MetabImpute. The strategy of imputing in the context of replication has significant implications in data preprocessing and subsequent statistical analysis, and, to our knowledge, this study is the first to describe a replication-based imputation approach and is the first systematic examination of the effect of imputation on reproducibility.
Experimental Section
Metabolomics Data Sets
Two real-world metabolomics data sets were used for this study and are described previously.12,13 The first data set—hereafter referred to as the fungal data—is composed of six strains each of the fungi Coccidioides immitis and C. posadasii, each grown in biological triplicate in either the mycelia or spherule life cycle, and three uninoculated liquid media controls per life cycle, for a total of 78 samples. The second data set—hereafter referred to as the bacterial data—contains 81 Pseudomonas aeruginosa cystic fibrosis chronic lung infection isolates analyzed in biological triplicate, including uninoculated liquid media controls, for a total of 258 samples. For both experiments, headspace volatile compounds were extracted using solid-phase microextraction (SPME) and analyzed by comprehensive two-dimensional gas chromatography coupled to time-of-flight mass spectrometry (GC × GC-TOFMS). After data cleanup (artifact and contaminant removal), a total of 767 chromatographic features were identified for the fungal data set and 979 chromatographic features for the bacterial data set. The full methods for data preprocessing were previously published,12,13 including a comprehensive list of artifacts removed during data cleanup.13
Evaluation of the Missingness Mechanism
Pairwise correlations (Pearson and Spearman) between each feature’s missingness vector (where present values are replaced with 1 and missing values with 0) and all other features in the data set were calculated. Features were considered MCAR if no significant correlations were found between any pair of features (Benjamini–Hochberg-corrected P ≤ .05); features were grouped as MAR or MNAR otherwise. Additionally, the strength of the pairwise correlations regardless of significance was used to assess missingness in which moderate or stronger correlations (≥0.5) were suggestive of MCAR. The Kolmogorov–Smirnov (KS) goodness-of-fit test and the Cucconi test with Benjamini–Hochberg correction were applied to the remaining features to determine whether their distributions were left-truncated, indicative of possible MNAR missingness.14 Features with left-truncated distributions when compared to left censored normal distributions were characterized as MNAR, and MAR otherwise. Features with greater than 60% missingness were excluded from analysis as the KS test fails in left truncated vectors above this missingness threshold.15
Simulation and Missing Value Generation
Simulated complete data sets of identical dimensionality were created by generating matrices based on the estimated covariance structure of the incomplete fungal and bacterial data sets using an approach described previously.15 For both simulated data sets, we utilized the approach detailed by Kokla et al. to simulate MAR, mixed (1:1) MAR/MNAR, and MNAR missingness mechanisms for missing proportions from 5 to 50%.15 This process involves sequentially choosing two features at random and removing a select proportion of the largest values in one of these features in the case of MAR. For MNAR, we consider only left-truncated missingness. Here, single variables have a random proportion of their lowest values removed, and this process is repeated until the desired missingness proportion is reached.
Missing Value Imputation
Nine common imputation methods were evaluated (descriptions in Supplementary Information). Minimum, half-minimum (HM), mean, and median imputation methods are “single-value” imputation methods that impute missing values of a feature to the global values indicated by the respective methods. For zero imputation, missing values were replaced with zeros. For the MAR, MNAR, and mixed MAR/MNAR simulated data sets, zero imputation was excluded because simulated data were drawn from a normal distribution based on covariance matrices. Because this distribution is continuous with no clear lower bound, there is no obvious numeric choice that is analogous to zero. For analyses involving the fungal and bacterial data sets, zero imputation was utilized as the basis of comparison between imputation methods. Four additional algorithmic approaches—Bayesian principal component analysis (BPCA),16 Random Forest (RF),17 quantile regression imputation of left-censored data (QRILC),18 and Gibbs sampler imputation (GSImp)19—were considered. Additionally, for every method above, an approach that considers replication was devised. First, for samples in which there are 1/3 present values within the set of three replicates, the present values within the replicate group are permuted to zero and the missing values are imputed to zero (i.e., all values in the replicate group are set to zero). Second, for samples in which there were 2/3 present values within the set of replicates, the present values are left unchanged while missing values are imputed using one of the nine imputation approaches described above: for minimum (RepMin), half-minimum (RepHM), mean (RepMean), and median (RepMedian), using the present values within the replicate samples; for BPCA (RepBPCA), RF (RepRF), QRILC (RepQRILC), and GSImp (RepGSImp), using the present values across the entire data set. For zero (RepZero), the missing values within the replicate are imputed with zeros. All imputation was performed prior to any normalization.
Performance Evaluation
Normalized root-mean-square error and PCA-Procrustes analysis were used to evaluate model performances.15,20 Intraclass correlation coefficients (ICC) were used as a measure of reproducibility for each feature.21 ICCs were classified as: excellent ≥0.90, good 0.75–0.89, moderate 0.50–0.74, and poor <0.50.22 The overall change in ICC was measured for an imputation method by taking the mean change in ICC over n number of features (F) versus two baselines, the original data (with missing values), and the zero-imputed data:
Results and Discussion
Evaluation of Data Set Missingness Types
We first set out to identify the missingness profiles of two metabolomics data sets, one from an analysis of fungal volatile metabolites and the other from an analysis of bacterial volatile metabolites. Because the acquisition of metabolomics data involves many confounding factors that can affect the presence or absence of a metabolite, such as instrumental LOD/LOQ, numerous method parameters, and sampling methodologies, we posit that missingness of the completely at-random type is unlikely. Using Pearson and Spearman correlation analyses between missing and present volatiles, it was found that every feature was significantly correlated (P ≤ .05) to the missingness of at least one other feature for both data sets (pairwise correlations not shown). Thus, there were likely not any features that could be categorized as MCAR using this method. By exclusion, we determined that our data was composed of either MAR, MNAR, or a mixture of the two. Furthermore, we assumed that the most likely mechanism of left-censored MNAR is due to below-limits of detection, a commonly presumed cause of missingness in metabolomics.6 The Kolmogorov–Smirnov (KS) test, which tests for a left-truncated distribution, was used to investigate this. The missingness profiles of both data sets were evaluated by the proportion of features classified as each missingness type (relative to the total number of features) and by the contribution of individual missing values (relative to the total number of missing values). Results suggested a large number of volatile features possessing left-truncated distributions, and we characterized these to be predominantly MNAR. The largest proportion of features across the entirety of both data sets were considered MAR, followed by features that could not be evaluated due to high degrees of missingness (≥60%). In both data sets, features that were excluded from the analysis of the missingness type (detected in <60% of samples) had the highest contribution to the overall missingness followed by those with MAR (Figure 1).
Figure 1.
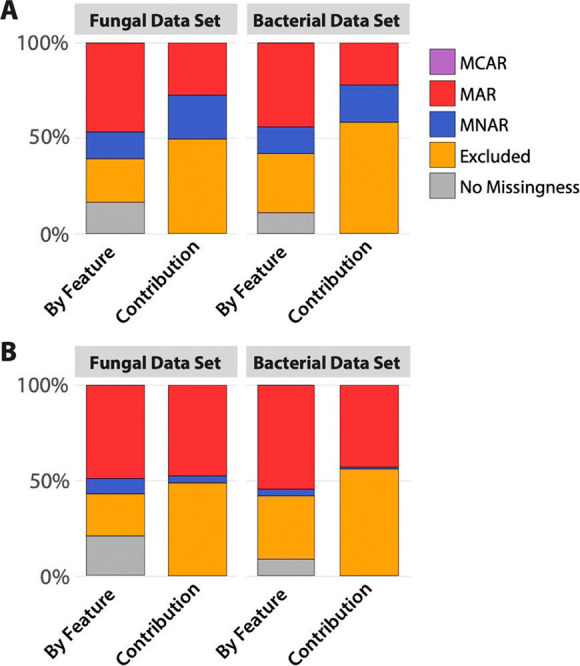
Percent missingness type by volatile features (number of features of each missingness type divided by the total number of features), and percent contribution of each volatile feature’s missingness to the overall missingness profile (number of missing values within each feature for each missingness type divided by the total number of missing values). (A) Classification using Pearson correlation and the KS test. (B) Classification using Pearson correlation and Cucconi test. “Excluded” refers to features that could not be evaluated by the KS test because of high degrees of missingness (≥60%). MCAR was not detected in either data set.
It is reasonable to conclude that volatiles with more than 60% of their data missing (excluded in order to apply the KS test) contributed largely to the overall missingness. Although it is impossible to know with certainty the mechanism of missingness for these features, pairwise correlation analysis suggested that there was a low degree of MCAR when using only significant correlations (classified as MCAR if Benjamini–Hochberg-corrected P < .05 for all pairwise correlations). When assessing MCAR using correlation coefficients regardless of significance, inferences are less clear as strong correlations (≥0.7) suggest the presence of small proportions of MCAR (16 and 19% for the fungal and bacterial data sets, respectively). Between MAR and MNAR, however, there is more ambiguity. This is largely due to the fact that the KS test assumes a normal distribution and is testing whether or not the distributions of the volatile features are approximately normal (Gaussian) versus left-censored. Density plots of these data sets show that many features’ distributions are skewed to the right, consistent with data that are missing due to LOD/LOQ (Figure S1). Cullen and Frey plots, which can be used to infer the distributions of these features, show that normal distributions are not common in either data set (Figure 2). Because of this, it is likely that models dependent on normal distributions poorly fit the data and give spurious inferences about missingness. To bolster the results from the KS test, we applied the nonparametric Cucconi test, which compares the location and scale between two distributions. Results from the Cucconi test differed from those of the KS test in that they indicated higher proportions of MAR data (Figure 1). These conflicting results speak to the difficulty in characterizing distributions and identifying missingness mechanisms.
Figure 2.
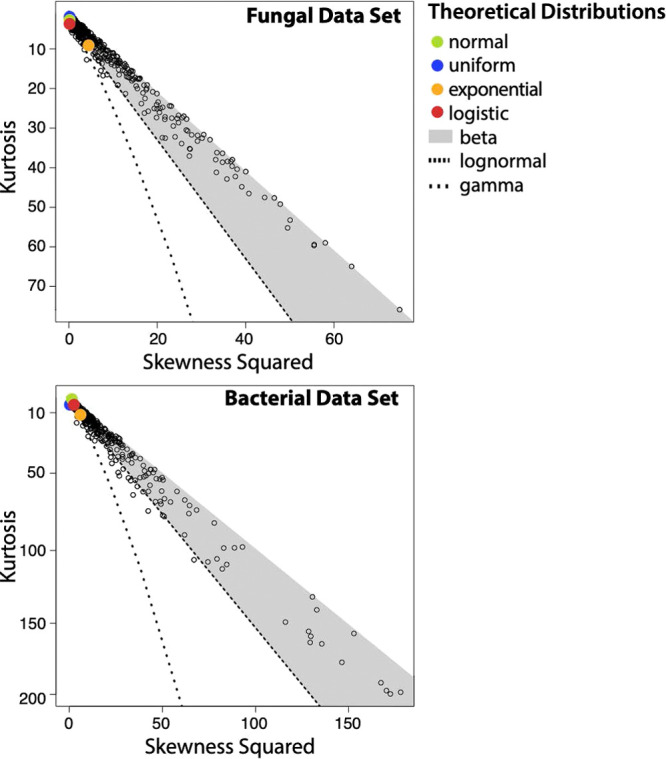
Cullen and Frey plots of estimated distributions of all variables in each data set.
While it was found that a majority of volatiles appear to be MAR or MNAR, there are limitations to these approaches, primarily due to the difficulty in identifying the true distribution of metabolomic features. Distribution analysis showed that there is a wide variation in potential “true” distributions of features, and this analysis is itself limited by high degrees of missingness. Often, assumptions must be made by researchers regarding the likeliest missingness mechanism in order to properly select an imputation method; however, clear guidelines do not exist to select appropriate methods. It is important to note that the choice of an imputation method should not be taken lightly, as biases may be introduced into the data. These relationships can skew statistical results and subsequent inferences. Although we did not explore other methods here, inferences about the missingness type might be made by examining frequencies of observation of features within groups, such as sample replicates or sample classes. Examining the signal-to-noise ratio of features can also aid in inspecting the missingness type. Information gleaned from these strategies can inform what imputation approaches may be the most appropriate, as well as how to impute with respect to the experimental design (i.e., imputation across the data set as a whole, or imputation within sample classes or replicates).
Imputation Evaluation of Simulated Complete Data
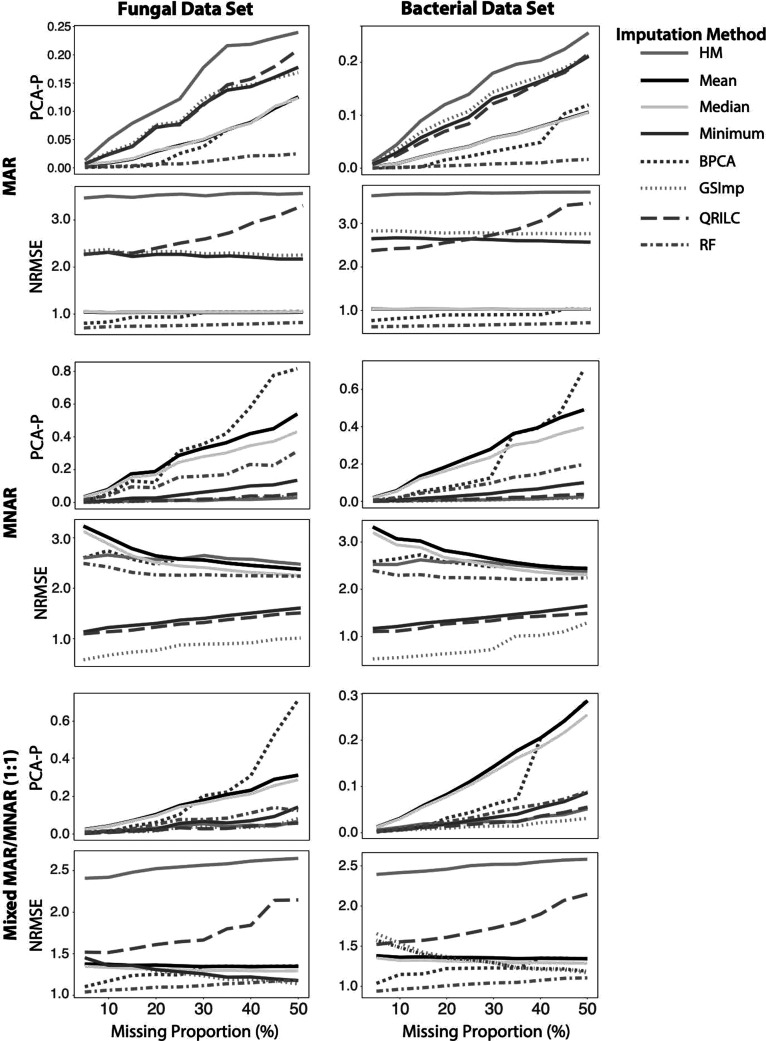
To evaluate the impacts of imputation on the data sets, simulated complete data matrices based on the covariance structure of the real data were generated for each data set. Matrices with missingness levels ranging from 5 to 50% were also generated with intervals of 5% in three types of missingness mechanisms: MAR, MNAR, and mixed (1:1) MAR/MNAR. Imputation methods were applied, and normalized root-mean-square error (NRMSE) and PCA-Procrustes (PCA-P) analyses were performed to compare the imputed matrices to the complete matrices, where smaller values indicate better relative performance. In the MAR mechanism, we find that RF imputation outperformed other imputation methods in both performance metrics for the MAR mechanism of missingness, and GSImp outperformed other imputation methods for the MNAR when analyzed by NRMSE (Figure 3), confirming the findings of other studies.15,19 The PCA-P analysis of the MNAR data showed that HM and QRILC perform equally well as GSImp, even at high levels of missingness. In the mixed missingness mechanism approach combining MAR and MNAR, we find that RF is the highest performing imputation method when evaluated by NRMSE, while PCA-P scores suggest that at low proportions of missingness (up to 20%), all but mean and median imputation methods perform well. However, as the proportion of missingness increases, BPCA begins to perform poorly, and while HM, Minimum, GSImp, QRILC, and RF all continue to perform quite well, GSImp was superior at the highest levels of missingness. GSImp may be particularly robust as an imputation method as it employs Elastic Net regularization to overcome the problem of high dimensionality (p features ≫ n observations) and better accommodates unique correlation structures. The degradation in the performance of BPCA could be due to the use of expectation maximization (EM) to estimate variance–covariance parameters, which requires a large sample size and MAR missingness.23−25 High proportions of missingness and the presence of MNAR could be decreasing the robustness of this estimation. EM is also more suited for models that require the assumption of linearity, a characteristic that may not be inherent to this data.
Figure 3.
Performance of imputation methods applied to various proportions of MAR, MNAR, and mixed (1:1) MAR:MNAR missingness simulated from the fungal and bacterial data sets, where smaller values indicate better relative performance. HM = half-minimum, BPCA = Bayesian principal components analysis, GSImp = Gibbs sampler imputation, QRILC = quantile regression imputation of left-censored data, and RF = Random Forest.
Notably, two of the worst performing imputation methods by NRMSE score—HM and QRILC—performed well by PCA-P (Figure 3). The discrepancy in performance of QRILC between these two metrics may be due to the assumption of normality required for QRILC. These results also indicate that different imputation methods could be more useful depending on what downstream analysis is used, a conclusion that previous research also suggests.26 For example, RF may be a good choice for imputation when the data are dominated by MAR or a mixture of MAR and MNAR, which are the two most likely scenarios for the bacterial and fungal data (Figure 1). With respect to single imputation methods (mean, median, minimum, etc.), it is important to note that these methods can underestimate variability and introduce bias.27,28 This analysis of imputation methods, however, does not address the degree to which imputation affects sample reproducibility when replicate data are available, as they are for both the fungal and bacterial data.
Effects of Imputation on Replication
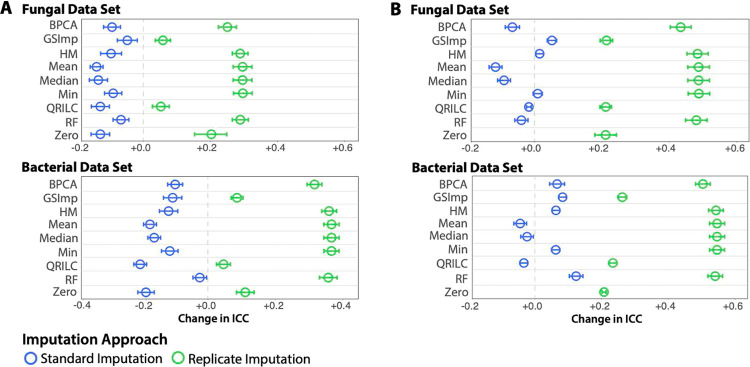
The samples in the bacterial and fungal data sets were analyzed in biological replicates of three, and therefore, these correlated samples contain additional information that can be leveraged to improve the reproducibility of the samples via imputation of missing values. A simple measure of reproducibility is the intraclass correlation coefficient (ICC). ICC thresholds have been used by us and others as a filter during data cleanup and postprocessing to simplify the data structure and aid in the identification of important features. This is accomplished by removing those features that have low reproducibility while retaining potentially important rare features.12,13,29−31 We measured the reproducibility of the metabolomes within these triplicates before and after imputation using the nine standard (nonreplicate) imputation methods, as well as the same methods adapted for replicate data. The replicate imputation approaches assign all values for a feature in a replicate group to zero if the within-group missingness exceeds 50% for that feature (where a group is defined as a set of biological replicates); alternatively, if within-group missingness is less than 50%, the missing values are imputed based on one of the standard imputation approaches. This “majority–minority” imputation approach treats peaks that are detected in a majority of sample replicates as more likely to be a product of the metabolism being studied, and peaks that are detected in a minority of sample replicates as more likely to be present due to chance. Using the mean of the change in ICC between the original data or the zero-imputed data (as a baseline), and the standard and replicate imputation methods, we found that all of the standard imputation methods decreased feature ICC compared to the original data containing missing values, while replicate imputation methods increased ICC across all features for both the data sets when compared to the original data (Figure 4A) or standard zero imputation (Figure 4B). Furthermore, the replicate imputation method outperformed the equivalent standard imputation method in all cases, when measured by ICC (Figure 4).
Figure 4.
Mean change in ICC across all individual features between imputation methods compared to (A) original un-imputed data with missing values, and (B) zero-imputed data as a baseline using standard imputation (blue) or replicate imputation (green) methods. Whiskers represent the nonsimultaneous 95% confidence intervals. HM, half-minimum; BPCA, Bayesian PCA; GSImp, Gibbs sampler imputation; QRILC, quantile regression imputation of left-censored data; and RF, Random Forest.
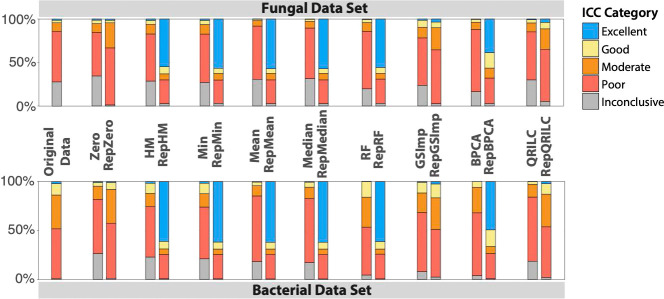
We analyzed the driving factors of the increase in ICC observed when employing within-replicate imputation and found that a large proportion of features possessed excellent ICC after imputation of missing values, whereas with standard imputation methods, there was a higher proportion of features with poor ICC (Figure 5). Taking a closer look, we observed large numbers of features with great increases in ICC in the majority of replicate imputation methods when compared to both zero-imputed data as a baseline and no imputation. For example, RepHM imputation results in 346 and 464 volatiles shifting from poor ICC to excellent ICC in the fungal and bacterial data sets, respectively (Figure 6 and Table S1). We hypothesized that this upward shift in feature ICCs was primarily due to the permutation of replicate groups to zero in the case that only a single value out of three was present. To explore this hypothesis, the proportion of replicate groups that was permuted to zero of all the groups present was plotted against the change in ICC of all imputation methods compared to the zero imputed data (as a baseline) for each feature. Scatter plots of these results show that features in which there are a large number of replicates permuted entirely to zero tend to have large positive ICC changes (Figure S2). Pearson correlations of the ICC changes to proportion of features permuted to zero in the fungal and bacterial data ranged from 0.78 to 0.89 (P = 0+) and 0.62 to 0.83 (P = 0+), respectively, depending on the within-replicate imputation method used (Table S2), suggesting that permuting features of a replicate group to zero if the majority of values are missing is an important mechanism for increasing ICC.
Figure 5.
Proportion of features in each ICC category following imputation. HM = half-minimum, BPCA = Bayesian PCA, GSImp = Gibbs sampler imputation, QRILC = quantile regression imputation of left-censored data, RF = Random Forest, Rep = replicate version of imputation. Excellent: ≥0.90; Good: 0.75–0.89; Moderate: 0.50–0.74; Poor: <0.50.
Figure 6.
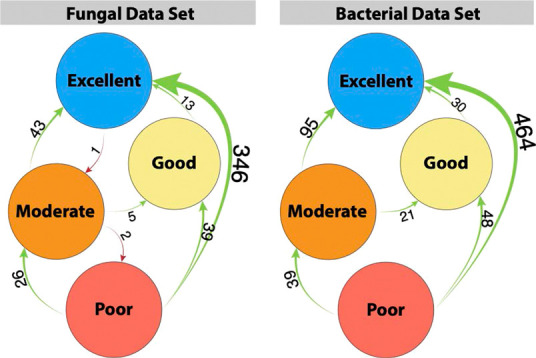
Network plot of ICC shifts of volatile features following within-replicate half-minimum (RepHM) imputation. Excellent: ≥0.90; Good: 0.75–0.89; Moderate: 0.50–0.74; Poor: <0.50.
MetabImpute for Exploring Missingness and Performing Replicate Imputation
The replicate imputation methods described in this study can be adapted for any number of replicates, and the threshold for the percentage of missing values that are imputed may also be modified. Based on the analyses performed in this study, we developed an R package called MetabImpute to explore various aspects of metabolomics data sets, especially those with technical or biological replicates. Included in the package are tools to evaluate missingness mechanisms, variable distributions, to impute using all the methods described in this study, and finally, to evaluate the effects of imputation on ICC. Table S3 lists the package dependencies and adapted/modified packages utilized in MetabImpute.
Limitations
Several important limitations and areas for future investigation exist. While we considered many commonly utilized imputation methods, others including k-nearest neighbors, singular value decomposition, local least squares, and random imputation are available. Our analysis also did not evaluate the impact of imputation and missing values on approaches for normalizing compound abundances (e.g., to an internal standard, probabilistic quotient normalization, etc.). In our case, we imputed prior to normalization and estimated ICCs after normalization. The effects of the order of these operations, to our knowledge, have not been extensively studied.
In our classification of missingness type, certain variables have a small sample size due to high proportions of missingness. For Pearson correlation, small sample sizes could impact the robustness of the correlation estimation; however, as we did not consider variables with 60% or greater missingness, the minimum sample size for a given variable would be 30 in the fungal data set and 103 in the bacterial data set. Prior research suggests that 30 samples are enough to make sound inferences from Pearson correlation.32
In some cases, researchers may wish to evaluate a model’s predictive ability and utilize a training and testing set. Some predictive models allow missing values while others do not, and if imputation is required, two main points must be considered. If data are held out when building a model, certain methods of imputation (i.e., those that use the rest of the data set to impute a given variable’s missing values) should be used on each set independently to reduce bias. Further research is needed to explore this.
In the MetabImpute package, users have the option of choosing a replicate threshold specifying what percentage of missing values are imputed to either zero or a nonzero value using the chosen imputation approach and what present values are permuted to zero. There may be instances where users have different numbers of replicates than what is presented in this study (e.g., more than three). We explored the effect of various thresholds using a third data set composed of ten samples (eight bacterial cultures and two uninoculated media samples), each with six replicates. Results showed that the most optimal replicate imputation method(s) were not the same as those identified for the bacterial and fungal data (data not shown). This is likely due to the significantly smaller sample size of this third data set (which was also more sparse) and makes it difficult to generalize the effect of different thresholds to larger data sets with more than three replicates. It is therefore advisable to use the MetabImpute package to evaluate multiple replicate thresholds and imputation methods to determine the most appropriate approach for the data at hand.
Conclusions
Handling missing data is an important issue in metabolomics data postprocessing and can significantly affect downstream analysis. Methods do exist to assess mechanisms of missingness; however, many rely on inherent assumptions about the missingness mechanisms themselves, and others cannot be utilized in metabolomics data that commonly contain significantly more features than samples. Additionally, certain methods of excluding features with high missingness, such as the 80% rule, introduce the risk of excluding potentially important features (e.g., biomarkers).
In this study, we took two real-world GC × GC volatile metabolomics data sets that were collected in biological triplicates and evaluated their missingness profiles and the mechanisms that underlie them. We concluded that out of the features we were able to analyze, the missingness profiles in both the data sets were likely not MCAR, but a mixture of MAR and MNAR, with a higher proportion of the former. A large number of volatiles also possessed high degrees of missingness and followed many different distributions. Using simulated data, RF imputation appeared to outperform other imputation methods with MAR data, while GSImp outperformed other imputation methods with MNAR data. In mixed missingness data, results were less clear; however, RF and GSImp outperformed other methods.
In the setting of data with biological or technical replicates, the effects of imputation have not been studied previously. We introduced and evaluated a methodology described as replicate imputation, where features that have a high percentage of missingness within the replicates are permuted to zero, and missing value imputation is performed on the remaining features using the present values within the sets of replicates. Uniformly, utilizing the replicate imputation method led to higher overall ICC, which may preserve relationships within replicate groups and more features for downstream analysis that could be important for biomarker discovery. We conveniently present these missingness evaluation and imputation strategies in an R package called MetabImpute such that explorations into missingness in metabolomics data sets can be easily incorporated into a data preprocessing pipeline.
Acknowledgments
Funding for the collection of the metabolomics data was provided by the Cystic Fibrosis Foundation (Hill17P0) and Cystic Fibrosis Foundation Therapeutics (Hill18A0-CI), the National Institutes of Health (R56HL139846), and the Arizona Biomedical Research Centre (ADHS18-198861). Bacterial isolates were obtained from the Cystic Fibrosis Isolate Core at Seattle Children’s Center for Global Infectious Disease Research, funded by the National Institutes of Health (P30 DK089507) and the Cystic Fibrosis Foundation (HOFFMA20Y2-OUT). Supplemental funding for publication was provided by the Arizona State University Graduate and Professional Student Association Publication Grant Program (E.A.H.K).
Supporting Information Available
The Supporting Information is available free of charge at https://pubs.acs.org/doi/10.1021/acs.analchem.1c04093.
Definitions of imputation methods, Figures S1 and S2, and Tables S1–S3 (PDF)
Author Contributions
T.J.D. and E.A.H.K. conceived the study and processed the data; H.D.B. and E.A.H.K. acquired funding for research and publication; T.R.F. analyzed the data; M.R. reviewed statistical analyses; T.J.D., T.R.F., and E.A.H.K. wrote the manuscript; H.D.B. reviewed and edited the manuscript; all authors approved the final version. T.J.D., T.R.F., and E.A.H.K. contributed equally to this work.
The authors declare no competing financial interest.
Notes
The data sets included in this study (chemical feature peak areas and retention times) are available at the NIH Common Fund’s National Metabolomics Data Repository (NMDR), the Metabolomics Workbench, at www.metabolomicsworkbench.org (fungal data: Project ID PR001064/Study ID ST001659, https://doi.org/10.21228/M85H6W bacterial data: Project ID PR000970/Study ID ST001414, https://doi.org/10.21228/M89Q4F). The MetabImpute R package is available at https://github.com/BeanLabASU/MetabImpute.
Supplementary Material
References
- Patrushev Y. V. Advantages of two-dimensional gas chromatography. Kinet. Catal. 2015, 56, 386–393. 10.1134/S0023158415030155. [DOI] [Google Scholar]
- Higgins Keppler E. A.; Jenkins C. L.; Davis T. J.; Bean H. D. Advances in the application of comprehensive two-dimensional gas chromatography in metabolomics. TrAC, Trends Anal. Chem. 2018, 109, 275–286. 10.1016/j.trac.2018.10.015. [DOI] [PMC free article] [PubMed] [Google Scholar]
- Jandera P. Comprehensive two-dimensional liquid chromatography—practical impacts of theoretical considerations. A review. Cent. Eur. J. Chem 2012, 10, 844–875. 10.2478/s11532-012-0036-z. [DOI] [Google Scholar]
- Rubin D. B. Inference and missing data. Biometrika 1976, 63, 581–592. 10.1093/biomet/63.3.581. [DOI] [Google Scholar]
- Little R. J. A.; Rubin D. B.. Statistical analysis with missing data, 2nd ed.; John Wiley & Sons: 2002. [Google Scholar]
- Do K. T.; Wahl S.; Raffler J.; Molnos S.; Laimighofer M.; Adamski J.; Suhre K.; Strauch K.; Peters A.; Gieger C.; Langenberg C.; Stewart I. D.; Theis F. J.; Grallert H.; Kastenmüller G.; Krumsiek J. Characterization of missing values in untargeted MS-based metabolomics data and evaluation of missing data handling strategies. Metabolomics 2018, 14, 128. 10.1007/s11306-018-1420-2. [DOI] [PMC free article] [PubMed] [Google Scholar]
- Smilde A. K.; van der Werf M. J.; Bijlsma S.; van der Werff-van der Vat B. J. C.; Jellema R. H. Fusion of mass spectrometry-based metabolomics data. Anal. Chem. 2005, 77, 6729–6736. 10.1021/ac051080y. [DOI] [PubMed] [Google Scholar]
- Yang J.; Zhao X.; Lu X.; Lin X.; Xu G. A data preprocessing strategy for metabolomics to reduce the mask effect in data analysis. Front. Mol. Biosci. 2015, 2, 4. 10.3389/fmolb.2015.00004. [DOI] [PMC free article] [PubMed] [Google Scholar]
- Gelman A.; Hill J.. Missing-data Imputation. In Data analysis using regression and multilevel/hierarchical models; Cambridge University Press: 2006; pp 529–542. [Google Scholar]
- Rhoads C. H. Problems with tests of the missingness mechanism in quantitative policy studies. Stat. Politics Policy 2012, 3, 1012. 10.1515/2151-7509.1012. [DOI] [Google Scholar]
- Molenberghs G.; Beunckens C.; Sotto C.; Kenward M. G. Every missingness not at random model has a missingness at random counterpart with equal fit. J. R. Stat. Soc. Series B: Stat. Methodol. 2008, 70, 371–388. 10.1111/j.1467-9868.2007.00640.x. [DOI] [Google Scholar]
- Higgins Keppler E. A.; Mead H. L.; Barker B. M.; Bean H. D. Life cycle dominates the volatilome character of dimorphic fungus Coccidioides spp. mSphere 2021, 6, e00040-21. [DOI] [PMC free article] [PubMed] [Google Scholar]
- Davis T. J.; Karanjia A. V.; Bhebhe C. N.; West S. B.; Richardson M.; Bean H. D. Pseudomonas aeruginosa volatilome characteristics and adaptations in chronic cystic fibrosis lung infections. mSphere 2020, 5, e00843-20 10.1128/mSphere.00843-20. [DOI] [PMC free article] [PubMed] [Google Scholar]
- Chernobai A.; Rachev S. T.; Fabozzi F. J.. Composite Goodness-of-Fit Tests for Left-Truncated Loss Samples. In Handbook of Financial Econometrics and Statistics; Lee C. F.; Lee J. C., Eds.; Springer: New York, NY, 2015; pp 575–596. [Google Scholar]
- Kokla M.; Virtanen J.; Kolehmainen M.; Paananen J.; Hanhineva K. Random forest-based imputation outperforms other methods for imputing LC-MS metabolomics data: a comparative study. BMC Bioinf. 2019, 20, 492. 10.1186/s12859-019-3110-0. [DOI] [PMC free article] [PubMed] [Google Scholar]
- Stacklies W.; Redestig H.; Scholz M.; Walther D.; Selbig J. pcaMethods—a bioconductor package providing PCA methods for incomplete data. Bioinformatics 2007, 23, 1164–1167. 10.1093/bioinformatics/btm069. [DOI] [PubMed] [Google Scholar]
- Tang F.; Ishwaran H. Random forest missing data algorithms. Stat. Anal. Data Min. 2017, 10, 363–377. 10.1002/sam.11348. [DOI] [PMC free article] [PubMed] [Google Scholar]
- Lazar C.; Burger T.; Wieczorek S.. imputeLCMD: A collection of methods for left-censored missing data imputation, 2; 2015.
- Wei R.; Wang J.; Jia E.; Chen T.; Ni Y.; Jia W. GSimp: A Gibbs sampler based left-censored missing value imputation approach for metabolomics studies. PLoS Comput. Biol. 2018, 14, e1005973 10.1371/journal.pcbi.1005973. [DOI] [PMC free article] [PubMed] [Google Scholar]
- Miller-Atkins G.; Acevedo-Moreno L.-A.; Grove D.; Dweik R. A.; Tonelli A. R.; Brown J. M.; Allende D. S.; Aucejo F.; Rotroff D. M. Breath metabolomics provides an accurate and noninvasive approach for screening cirrhosis, primary, and secondary liver tumors. Hepatol. Commun. 2020, 4, 1041–1055. 10.1002/hep4.1499. [DOI] [PMC free article] [PubMed] [Google Scholar]
- Wolak M. E.; Fairbairn D. J.; Paulsen Y. R. Guidelines for estimating repeatability. Methods Ecol. Evol. 2012, 3, 129–137. 10.1111/j.2041-210X.2011.00125.x. [DOI] [Google Scholar]
- Koo T. K.; Li M. Y. A guideline of selecting and reporting intraclass correlation coefficients for reliability research. J. Chiropr. Med. 2016, 15, 155–163. 10.1016/j.jcm.2016.02.012. [DOI] [PMC free article] [PubMed] [Google Scholar]
- Allison P. D.Handling missing data by maximum likelihood. In SAS Global Forum: Statistics and Data Analysis, 2012; pp 1038–21.
- Allison P. D.Missing data; Sage University Paper Series on Quantitative Applications in the Social Sciences; SAGE Publications, Inc.: Thousand Oaks, CA, 2002; pp 7–136. [Google Scholar]
- Enders C. K.; Bandalos D. L. The relative performance of full information maximum likelihood estimation for missing data in structural equation models. Struct. Equ. Model. 2001, 8, 430–457. [Google Scholar]
- Di Guida R.; Engel J.; Allwood J. W.; Weber R. J. M.; Jones M. R.; Sommer U.; Viant M. R.; Dunn W. B. Non-targeted UHPLC-MS metabolomic data processing methods: a comparative investigation of normalisation, missing value imputation, transformation and scaling. Metabolomics 2016, 12, 93. 10.1007/s11306-016-1030-9. [DOI] [PMC free article] [PubMed] [Google Scholar]
- Dziura J. D.; Post L. A.; Zhao Q.; Fu Z.; Peduzzi P. Strategies for dealing with missing data in clinical trials: From design to analysis. Yale J. Biol. Med. 2013, 86, 343–358. [PMC free article] [PubMed] [Google Scholar]
- Jørgensen A. W.; Lundstrøm L. H.; Wetterslev J.; Astrup A.; Gøtzsche P. C. Comparison of results from different imputation techniques for missing data from an anti-obesity drug trial. PLoS One 2014, 9, e111964 10.1371/journal.pone.0111964. [DOI] [PMC free article] [PubMed] [Google Scholar]
- Bean H. D.; Rees C. A.; Hill J. E. Comparative analysis of the volatile metabolomes of Pseudomonas aeruginosa clinical isolates. J. Breath Res. 2016, 10, 047102 10.1088/1752-7155/10/4/047102. [DOI] [PMC free article] [PubMed] [Google Scholar]
- Rees C. A.; Nordick K. V.; Franchina F. A.; Lewis A. E.; Hirsch E. B.; Hill J. E. Volatile metabolic diversity of Klebsiella pneumoniae in nutrient-replete conditions. Metabolomics 2017, 13, 18. 10.1007/s11306-016-1161-z. [DOI] [PMC free article] [PubMed] [Google Scholar]
- Mead H. L.; Roe C. C.; Higgins Keppler E. A.; Caballero Van Dyke M. C.; Laux K. L.; Funke A. L.; Miller K. J.; Bean H. D.; Sahl J. W.; Barker B. M. Defining Critical Genes During Spherule Remodeling and Endospore Development in the Fungal Pathogen, Coccidioides posadasii. Front. Genet. 2020, 11, 483. 10.3389/fgene.2020.00483. [DOI] [PMC free article] [PubMed] [Google Scholar]
- Bonett D. G.; Wright T. A. Sample size requirements for estimating Pearson, Kendall and Spearman correlations. Psychometrika 2000, 65, 23–28. 10.1007/BF02294183. [DOI] [Google Scholar]
Associated Data
This section collects any data citations, data availability statements, or supplementary materials included in this article.


